Cancer type classification using plasma cell-free RNAs derived from human and microbes
- Division of General Surgery, Peking University First Hospital, China
- Translational Cancer Research Center, Peking University First Hospital, China
- MOE Key Laboratory of Bioinformatics, Center for Synthetic and Systems Biology, School of Life Sciences, Tsinghua University, China
- State Key Laboratory of Food Science and Technology, Nanchang University, China
- State Key Laboratory of Molecular Oncology, National Cancer Center/National Clinical Research Center for Cancer/Cancer Hospital, Chinese Academy of Medical Sciences and Peking Union Medical College, China
- Institute of Hepatobiliary Surgery, The First Hospital Affiliated to Army Medical University, China
- Department of Epidemiology, Faculty of Navy Medicine, Navy Medical University, China
- Department of Breast Surgical Oncology, National Cancer Center/National Clinical Research Center for Cancer /Cancer Hospital, Chinese Academy of Medical Sciences and Peking Union Medical College, China
- Shenzhen Stomatology Hospital (Pingshan), Southern Medical University, China
- Microbiome Medicine Center, Department of Laboratory Medicine, Zhujiang Hospital, Southern Medical University, China
Figures
Figure 1 with 1 supplement
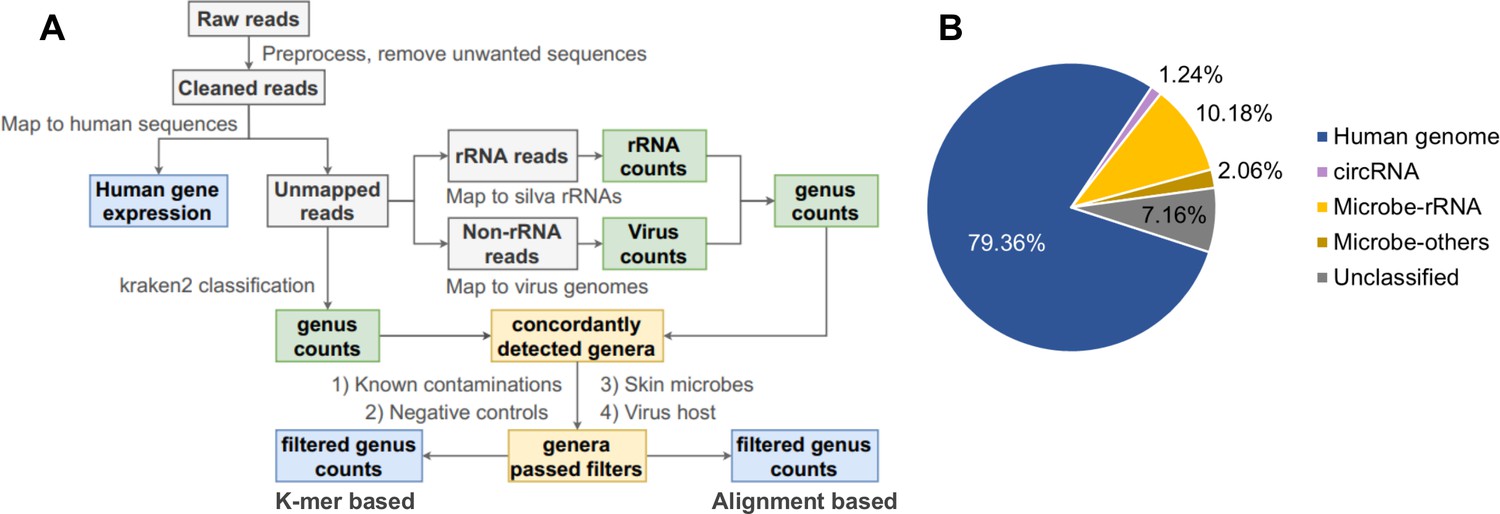
Pipeline for cell-free RNA (cfRNA) sequencing data processing.
(A) The bioinformatic pipeline for plasma cfRNA sequencing data processing. After adapter trimming, spike in, potential vector contaminations, and human rRNA sequences were removed. Cleaned reads were aligned to the human genome and circular RNA back-spliced junctions. Unmapped reads were classified with a k-mer-based pipeline and an alignment-based pipeline. Genera detected by both pipelines were used for downstream analysis. Potential contaminations (known common laboratory contaminants, genera detected in control samples, skin microbes, and suspicious viral genera) were excluded. See the Materials and methods section for details. (B) Average fractions of different cfRNA components in cleaned reads. Microbe-rRNA refers to reads annotated to rRNA. Microbe-others refers to non-rRNA reads that were assigned to microbial genomes by kraken2.
Figure 1—figure supplement 1
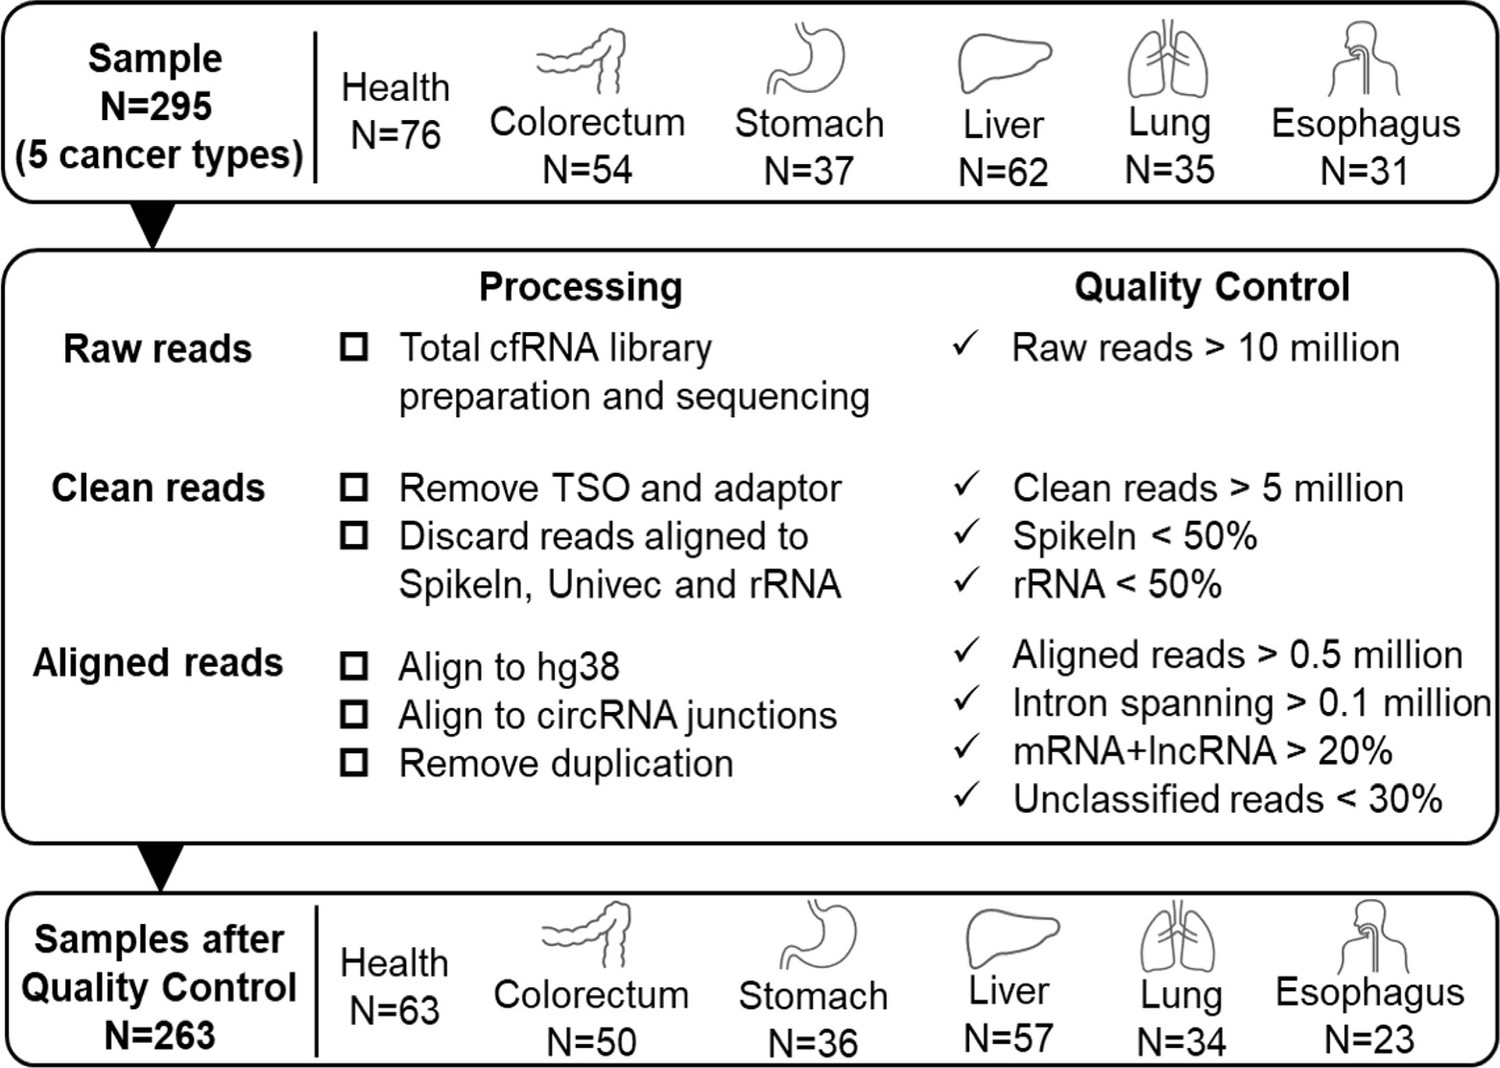
Quality control of sequencing data.
We used 295 samples of 5 cancer patients and healthy donors to discover potential RNA biomarkers. 263 samples passed the following quality control criteria: (1) Raw reads: at least 10 million. (2) Clean reads: at least 5 million. Spike-in sequence: <50%. rRNA sequence: <50%. (3) Aligned reads (reads mapped to the human genome or circRNA junctions): at least 0.5 million; Intron-spanning reads: at least 0.1 million; reads assigned to mRNA and lncRNA: at least 20%; unclassified reads (reads cannot be assigned to annotated exon, intron, antisense of exons, promoter, enhancer, or repeats): less than 30%.
Figure 2 with 1 supplement

Human genes and microbial signals revealed by cell-free RNA (cfRNA)-seq.
(A) The number of detected human transcripts (counts per million >2) of different RNA types and their relative abundances. (B). Representative coverages for ACTB and TUBB1 in healthy donors (HDs) from three clinical centers (samples HD-1, HD-2, and HD-3 are provided by PKU, ShH-1, and SWU, respectively). (C). Metagene plot for read coverage around 5’ exon boundaries and 3’ exon boundaries. The mean coverage of 100 nt around exon boundaries for exons with read coverage >3 is shown. (D). Relative abundance of reads assigned to different phyla by kraken2. (E). Representative read coverage of Lawsonella clevelandensis 16S and 23S rRNA in healthy donors from three clinical centers. (F). A representative read coverage on the HBV genome in cfRNA of a patient with liver cancer.
Figure 2—figure supplement 1
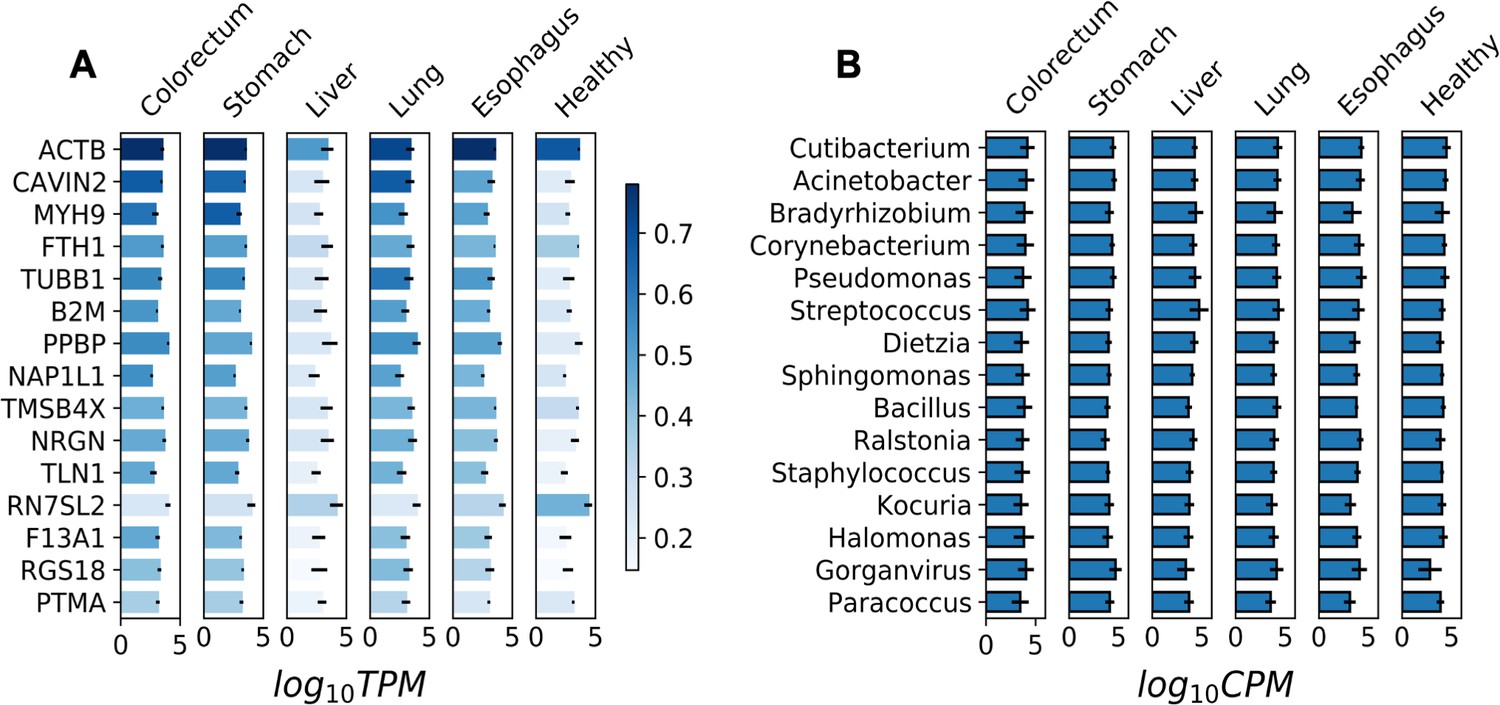
Most abundant human genes and microbial genera in plasma cell-free (cfRNA) libraries.
(A) The abundance (log10TPM) of the 15 most abundant human genes in different sample groups. TPM: transcripts per million. (B) The abundance (log10CPM) of the 15 most abundant genera in different sample groups. CPM: counts per million.
Figure 3 with 1 supplement
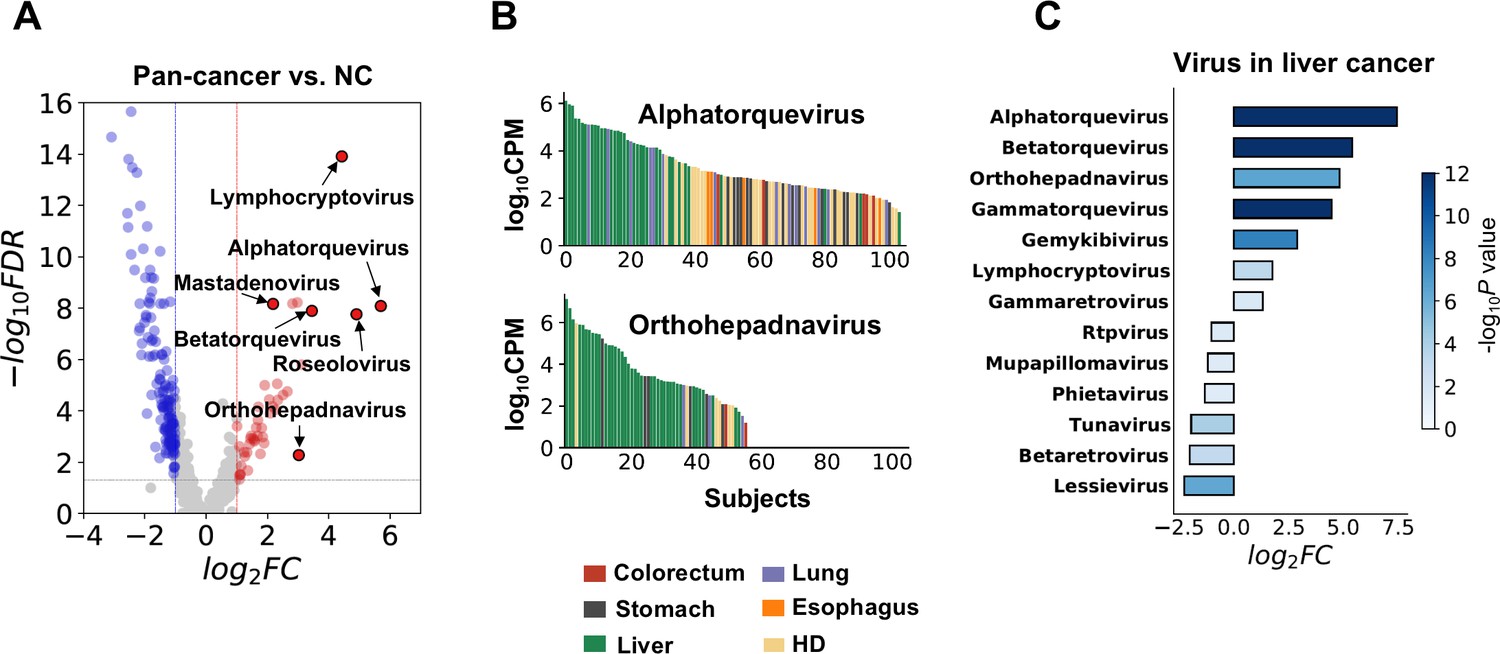
Biological relevance of alterations in the microbial cell-free RNA (cfRNA) profile.
(A) Example genera with significantly altered abundance in cancer patients when compared to healthy donors (HDs). FC: fold change. FDR: false discovery rate. FC and FDR were calculated using the result of the alignment-based method, and labeled genera were supported by both pipelines. (B) Abundance of Alphatorquevirus and Othohepavirus in the alignment-based pipeline across different samples ranked in descending order; colors indicate different sample groups. (C) Virus genera with significant abundance alterations (FDR <0.05 and log2fold-change >1) in liver cancer patients when compared to HDs.
Figure 3—figure supplement 1
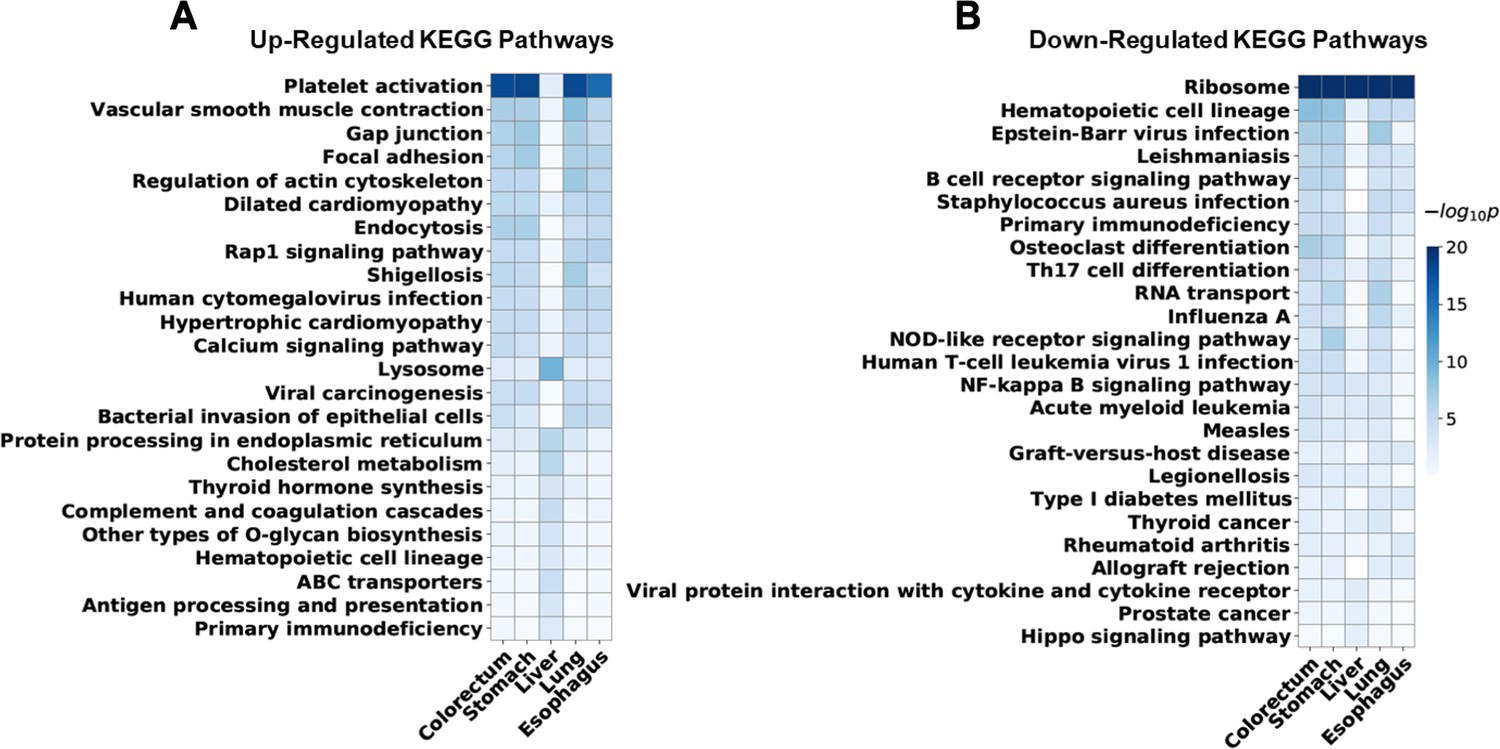
Enriched Kyoto Encyclopedia of Genes and Genomes (KEGG) pathways of differentially expressed human genes for each cancer type.
For five cancer types, the top 10 most significantly enriched KEGG pathways of upregulated and downregulated genes were identified. Union of these pathways was visualized. Rows for enriched pathways, columns for different cancer types, and colors indicate significance of the enrichment. Enriched pathways of liver cancer are relatively distinct from other cancer types, which may reflect some of its unique properties.
Figure 4 with 2 supplements
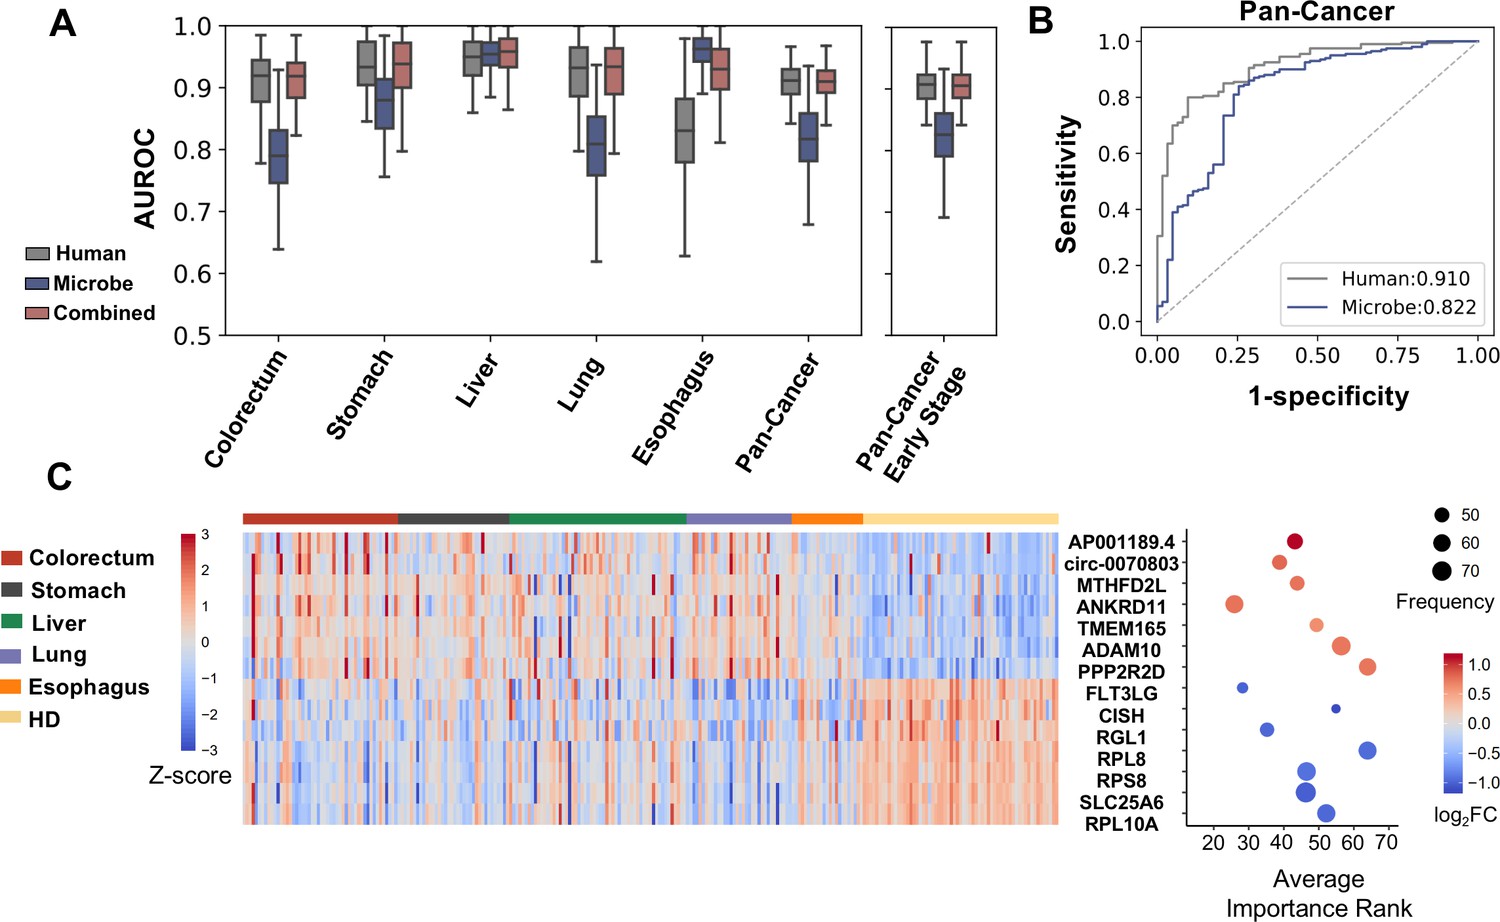
Cell-free RNA (cfRNA) features for cancer detection.
(A) Performance (AUROC) on the holdout dataset in 100 rounds of bootstrap resampling using abundance of human gene expression, microbe abundance (kraken2’s results), and combining both data for the binary classification (cancer patients vs. healthy donors). (B) Out-of-bag ROC curve using human or microbe features. For each sample, the median value of probabilities predicted by classifiers fitted in bootstrap replicates that reserved this sample in the testing set was utilized to generate the ROC curve. (C) Recurrent features with top fold changes when combining human and microbe features for bootstrap analysis. The left panel depicts Z scores of the expression levels in different subjects. The right panel illustrates their average importance ranks, frequency of identified as top 50 features, and fold change compared to healthy donors.
Figure 4—figure supplement 1
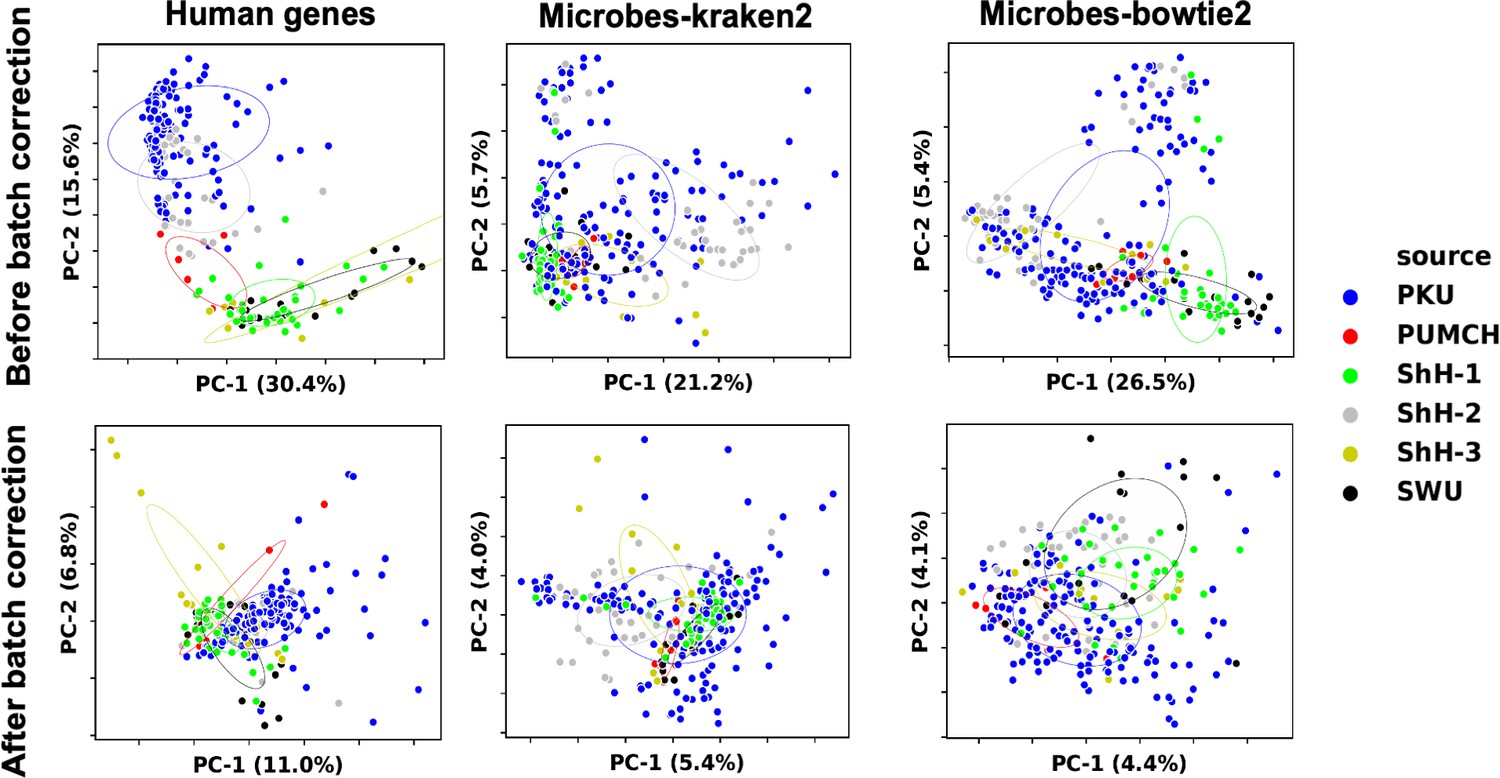
Data normalization for machine learning.
We used RUVg to remove unwanted variations from trimmed mean of M-values (TMM) normalized gene expression and genus abundance. The 25% most insignificant features between different sample groups in discovery set reported by edgeR’s ANOVA test were used as empirical controls. Data variations among different samples before (upper) and after (lower) RUVg processing were visualized with principal component analysis (PCA). Colors indicate different clinical centers.
Figure 4—figure supplement 2
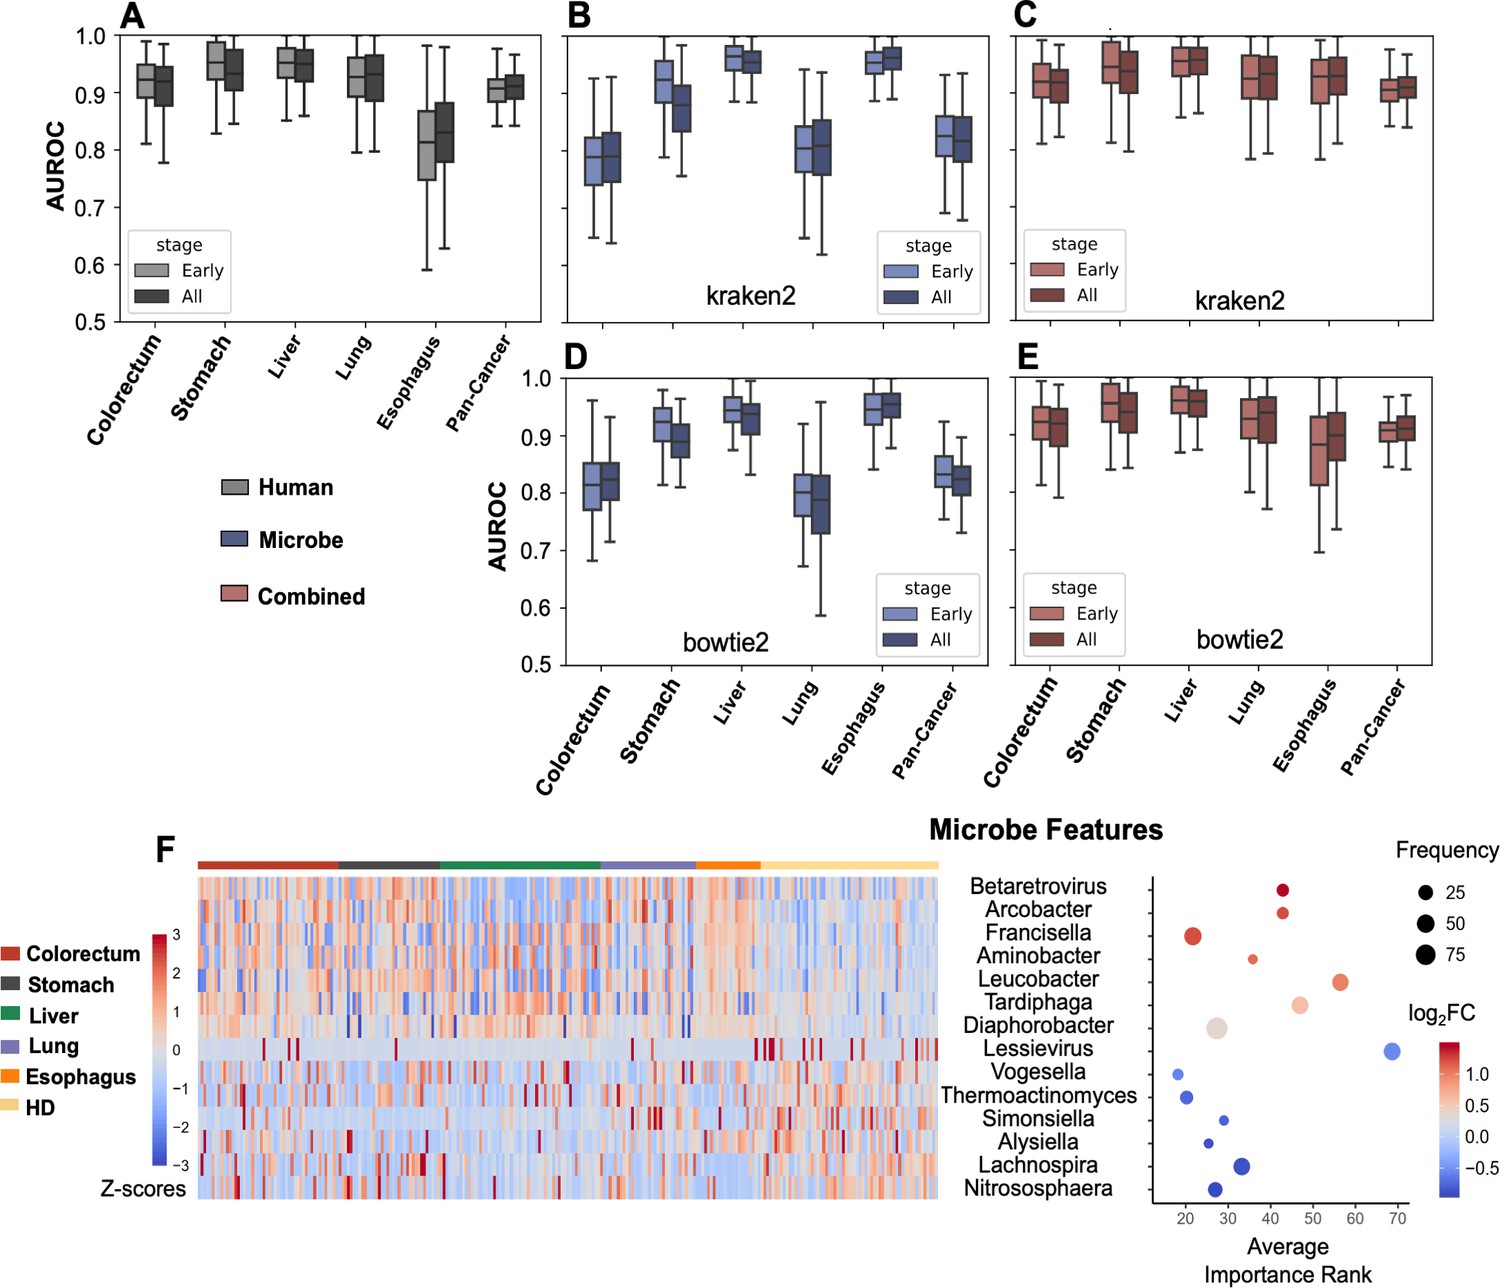
Binary classification for cancer detection.
(A–E) Bootstrapping AUROC on holdout set. (A) Performance of human genes, stratified by cancer stages. (B–C) Performance of microbe features (B) and combined both microbe and human features (C) using kraken2’s results. (D–E) Performance of microbe features (D) and combined both microbe and human features (E) using bowtie2’s results. (F) Recurrently selected features with top fold changes when only considering microbe data for cancer vs. healthy donor (HD) classification.
Figure 5 with 1 supplement
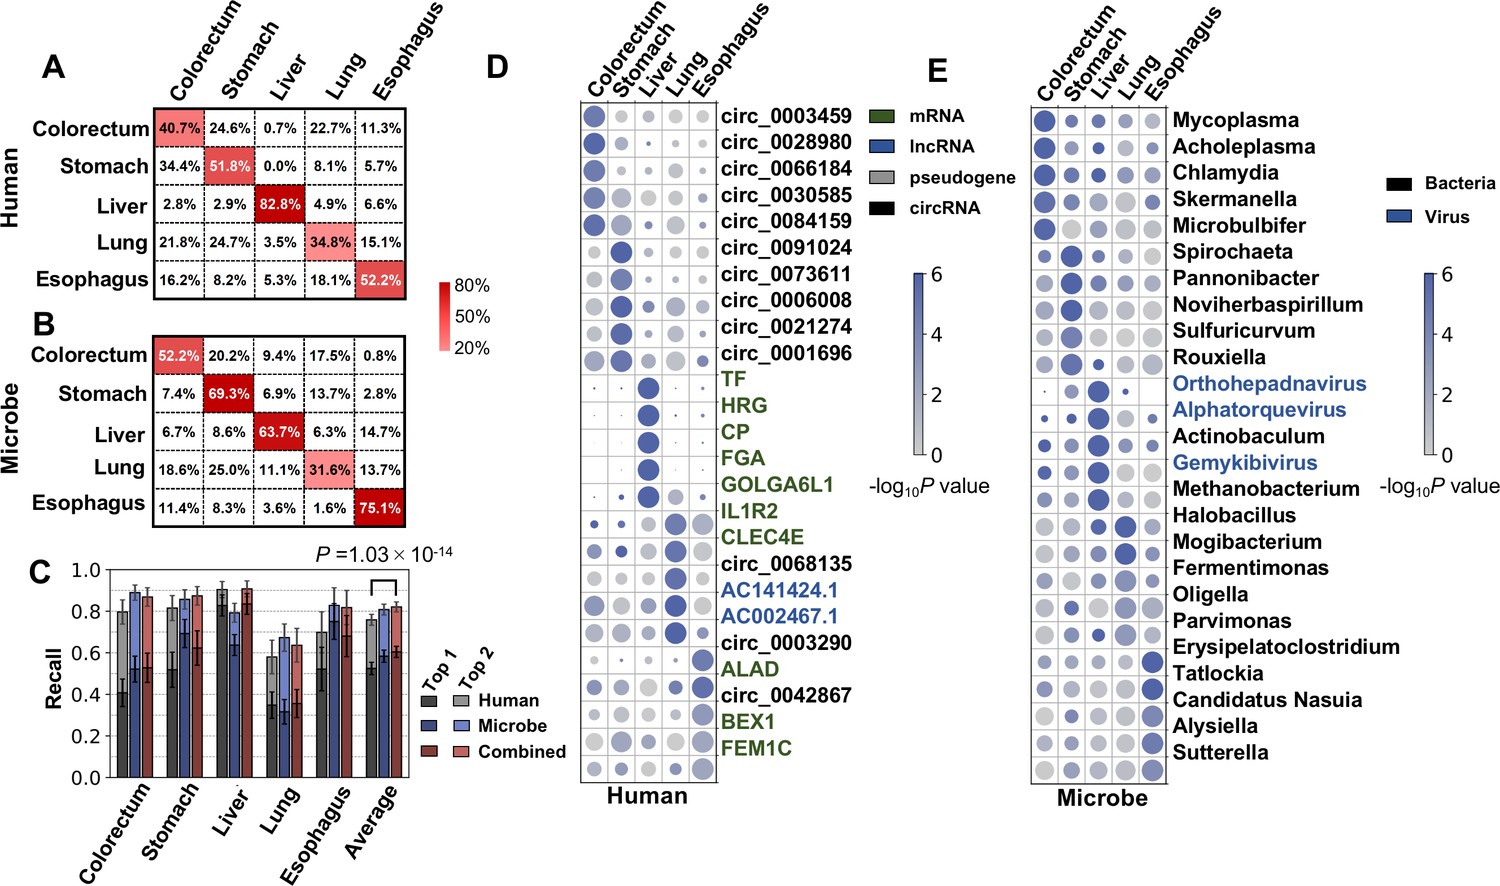
Cancer classification using human and microbial cell-free RNAs (cfRNAs).
(A–B) Confusion matrix of human (A) and microbe (B) features averaged across bootstrap replicates. (C) Top 1 and top 2 recall for each cancer type in multiclass classification. The statistical significance was determined by a one-tailed Mann-Whitney U test. (D–E) Recurrent human (D) and microbe (E) features with the top fold change in multiclass classification. The sizes and colors of the circles indicate the relative abundances (bowtie2 result, scaled to 0–1) and p values in the one vs. rest comparisons, respectively.
Figure 5—figure supplement 1
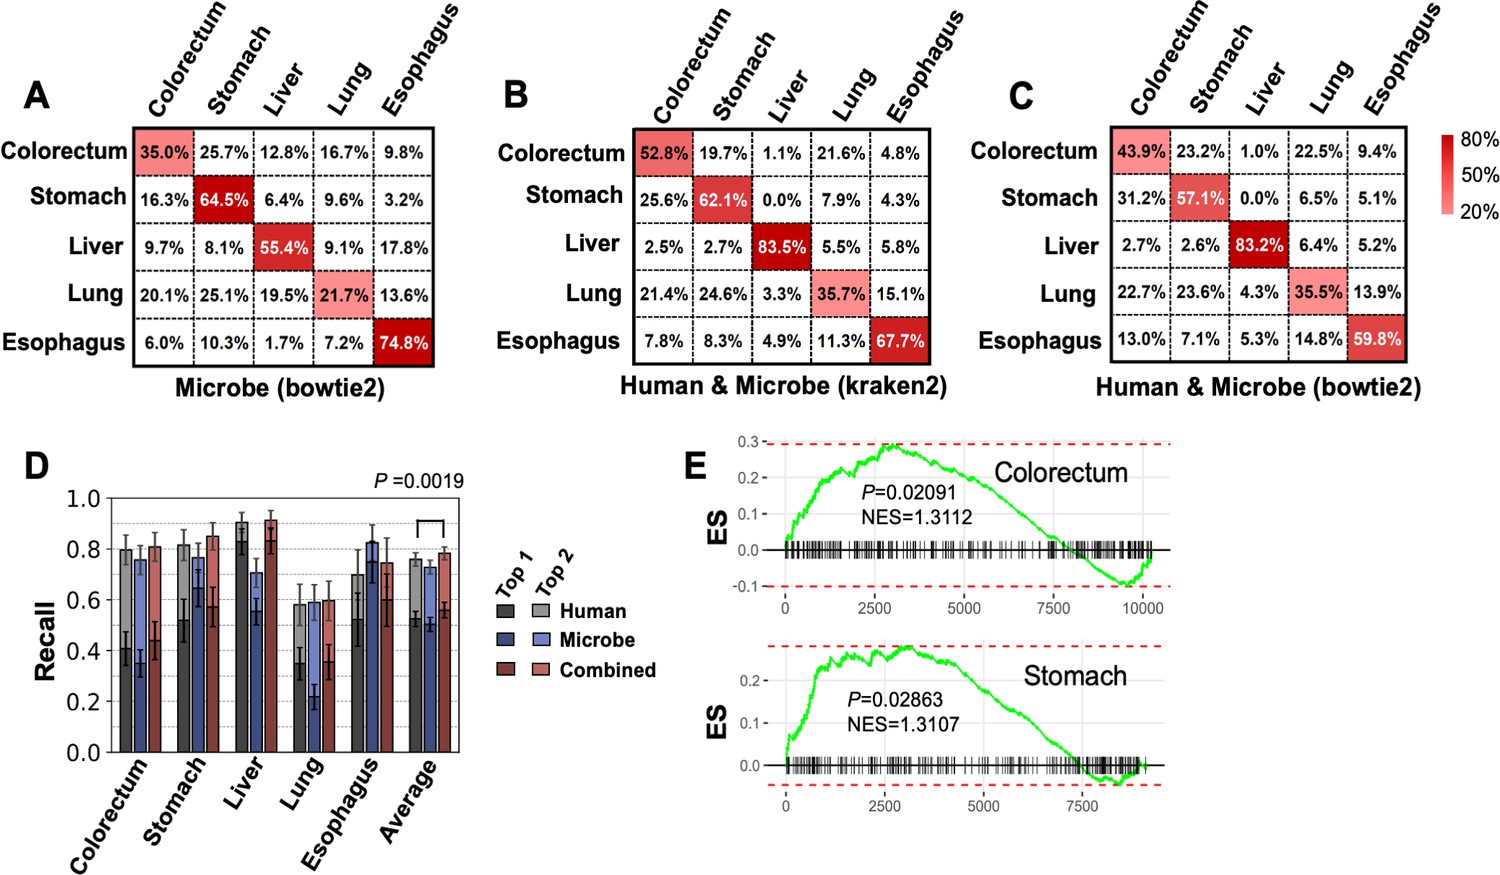
Performance for multiclass classification.
(A–C) Confusion matrices for microbe features using bowtie2 pipeline (A), combine microbe and human features using kraken2 pipeline (B) and bowtie2 pipeline (C), and averaged across 100 bootstrap replicates. (D) Top 1 and top 2 recall of human and microbe features using bowtie2’s results. The statistical significance was determined by one-tailed Mann–Whitney U test. (E) Gene set enrichment analysis (GSEA) for the enrichment of up to 300 circular RNAs (circRNAs) that upregulated in stomach cancer and colorectum cancer. circRNAs were ranked by fold change in tumor tissue vs. normal tissue comparison using mioncocirc data. ES: enrichment score; NES: normalized enrichment score.
Tables
Table 1
Enriched Kyoto Encyclopedia of Genes and Genomes (KEGG) pathways of significantly up- and downregulated human genes based on the cell-free RNA (cfRNA)-seq data of all cancer patients vs. healthy donors (HDs).
| Pathways* | p value | Gene ratio† | Trend |
|---|---|---|---|
| Platelet activation | 1.52E-19 | 0.0728 | Up |
| Calcium signaling pathway | 1.28E-07 | 0.0695 | |
| ECM-receptor interaction | 2.98E-07 | 0.0364 | |
| Neutrophil extracellular trap formation | 4.15E-07 | 0.0579 | |
| Focal adhesion | 5.79E-07 | 0.0596 | |
| Phospholipase D signaling pathway | 3.52E-06 | 0.0464 | |
| Human cytomegalovirus infection | 8.81E-06 | 0.0596 | |
| Regulation of actin cytoskeleton | 1.09E-05 | 0.0579 | |
| Rap1 signaling pathway | 1.21E-05 | 0.0563 | |
| Viral carcinogenesis | 4.16E-05 | 0.0530 | |
| Ribosome | 2.32E-69 | 0.174 | Down |
| PD-1 checkpoint pathway in cancer | 1.74E-03 | 0.026 | |
| Proteasome | 2.51E-03 | 0.017 | |
| Pyrimidine metabolism | 3.43E-03 | 0.019 | |
| Th17 cell differentiation | 3.85E-03 | 0.028 | |
| Th1 and Th2 cell differentiation | 6.45E-03 | 0.025 | |
| Transcriptional misregulation in cancer | 6.85E-03 | 0.042 | |
| NOD-like receptor signaling pathway | 7.08E-03 | 0.040 | |
| Cytosolic DNA-sensing pathway | 7.16E-03 | 0.019 | |
| NF-kappa B signaling pathway | 7.39E-03 | 0.026 |
-
*
Enriched pathway of pan-cancer upregulated and downregulated genes.
-
†
Fraction of upregulated or downregulated genes annotated to a KEGG pathway.
Additional files
-
Supplementary file 1
Clinical information of samples used in this study.
- https://cdn.elifesciences.org/articles/75181/elife-75181-supp1-v1.docx
-
Supplementary file 2
Statistics in reads mapping.
- https://cdn.elifesciences.org/articles/75181/elife-75181-supp2-v1.xlsx
-
Supplementary file 3
Filtering of potential contamination and read counts in negative control samples.
- https://cdn.elifesciences.org/articles/75181/elife-75181-supp3-v1.xlsx
-
Supplementary file 4
Fraction of reads assigned to difference sequences.
- https://cdn.elifesciences.org/articles/75181/elife-75181-supp4-v1.xlsx
-
Supplementary file 5
Differential analysis for human and microbial reads between cancer patients and healthy donors.
- https://cdn.elifesciences.org/articles/75181/elife-75181-supp5-v1.xlsx
-
Supplementary file 6
Differential analysis for one vs. rest comparisons between different cancer types.
- https://cdn.elifesciences.org/articles/75181/elife-75181-supp6-v1.xlsx
-
Supplementary file 7
Recurrency and average importance rank of top 100 features for cancer detection.
- https://cdn.elifesciences.org/articles/75181/elife-75181-supp7-v1.xlsx
-
Supplementary file 8
Recurrency and average importance rank of top 500 features for cancer classification.
- https://cdn.elifesciences.org/articles/75181/elife-75181-supp8-v1.xlsx
-
Transparent reporting form
- https://cdn.elifesciences.org/articles/75181/elife-75181-transrepform1-v1.docx
Download links
A two-part list of links to download the article, or parts of the article, in various formats.
Downloads (link to download the article as PDF)
Open citations (links to open the citations from this article in various online reference manager services)
Cite this article (links to download the citations from this article in formats compatible with various reference manager tools)
Cancer type classification using plasma cell-free RNAs derived from human and microbes
eLife 11:e75181.
https://doi.org/10.7554/eLife.75181


