Rolling circle RNA synthesis catalyzed by RNA
- MRC Laboratory of Molecular Biology, Cambridge Biomedical Campus, United Kingdom
- Department of Physics, University of York, United Kingdom
Figures
Figure 1 with 1 supplement
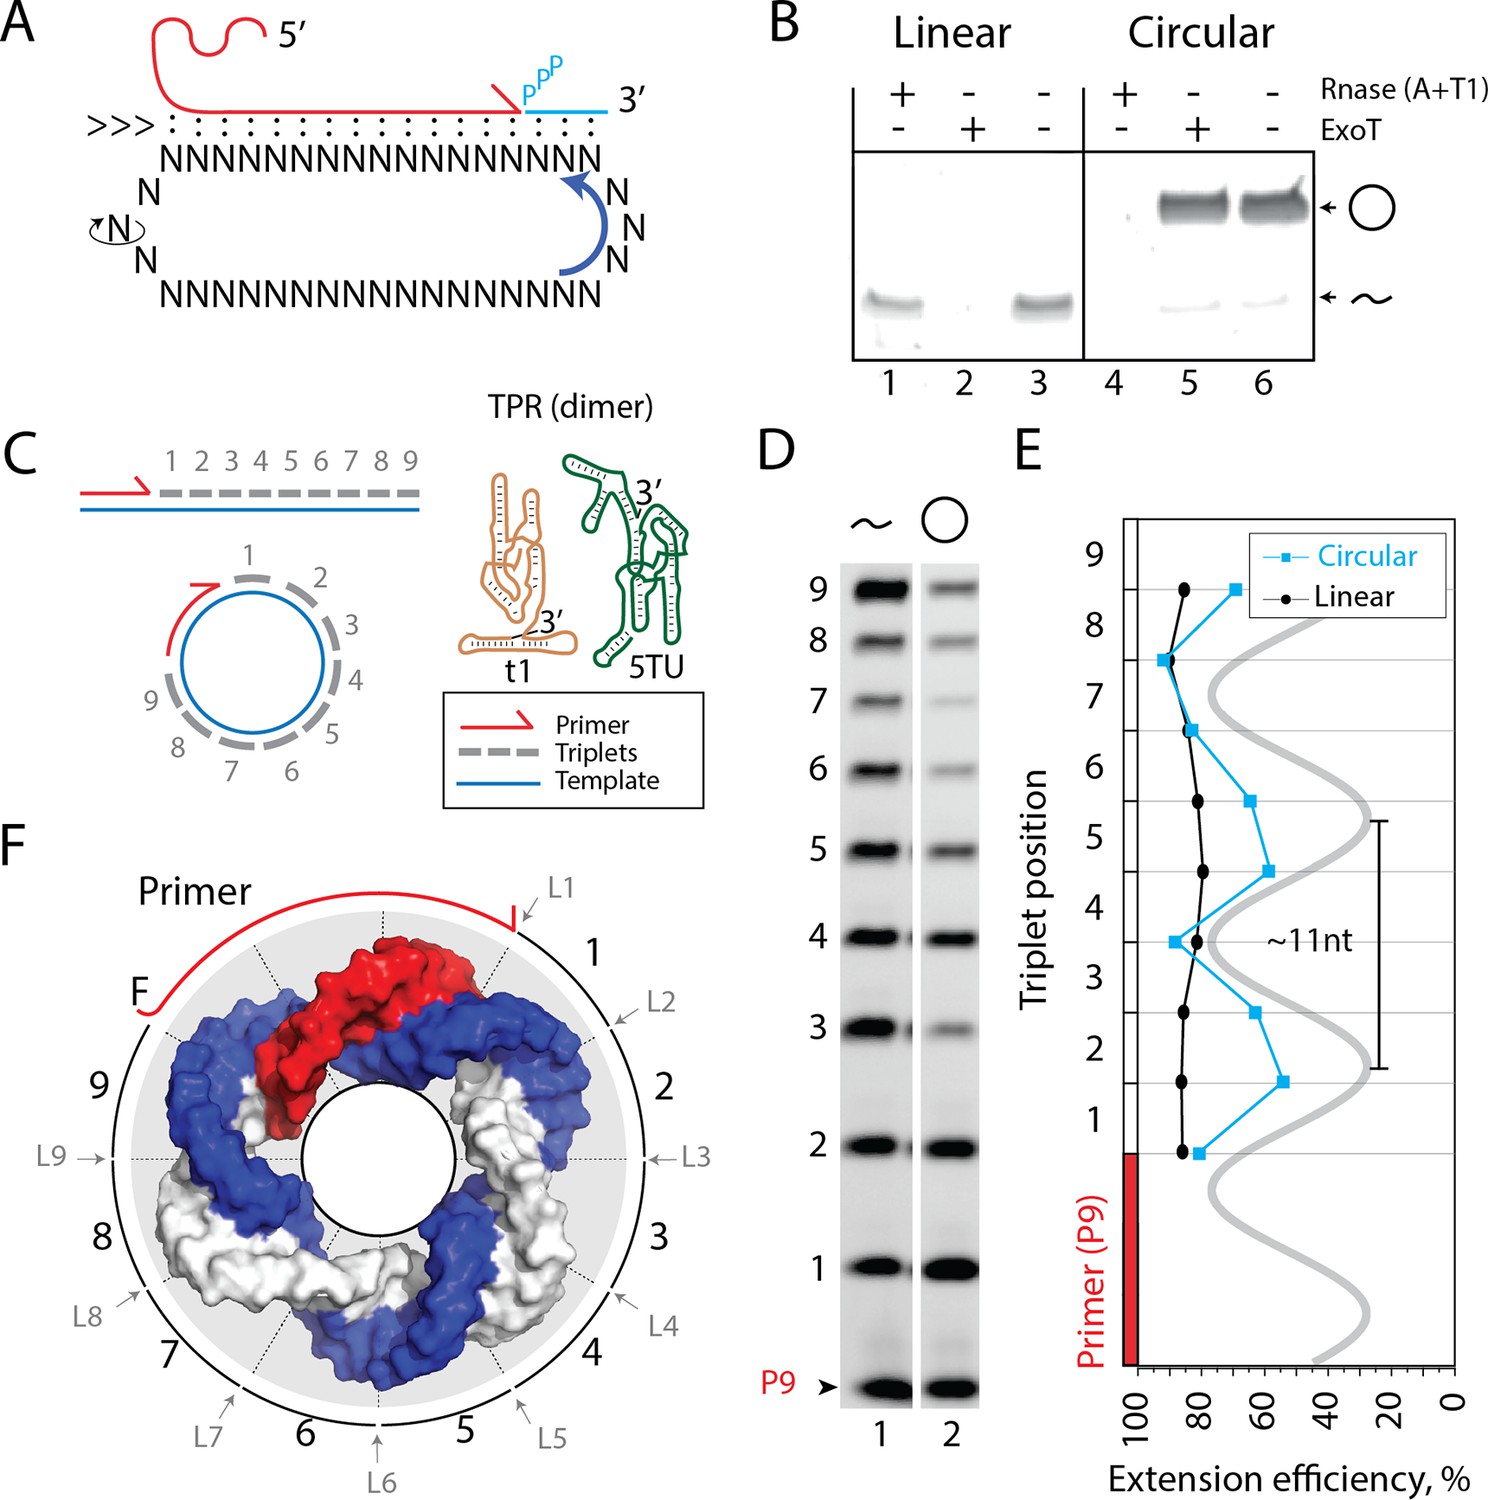
Primer extension on circular RNA (circRNA) templates.
(A) Schematic illustration of rolling circle synthesis (RCS). Red product RNA strand is extended by a triplet at the 3′-end while three base pairs dissociate at the 5′-end keeping the total hybridization energy constant. Topological relaxation is allowed by rotation of the single stranded part of the circular template (swiveling arrow). (B) Linear or circularized RNA is treated with or without endo- or exonucleases (RNase A/T1 mix or Exonuclease T (ExoT)). Only circRNA is resistant to ExoT digestion. (C) Schematic representation of primer triplet extension on a linear or circRNA template and of the TPR hetero-dimer comprising the catalytic subunit (5TU (green)) and the non-catalytic subunit (t1 (red)) (Attwater et al., 2018) (TPR sequence: Supplementary file 1). (D) PAGE gel of TPR primer extension, P9 (5′-FAM-GAAGAAGAA) is the unextended primer, bands 1–9 denote extension of P9 by +1 to + 9 triplets (full length). RNA template used was sc12GAA-p (36 nt, 12 repeat UUC template). Experiment was done under standard conditions in the Tris buffer system described in Materials and Methods except that 800 pmol triplets were used. (E) Extension efficiency of formation of bands 1–9 in (D) (see Materials and methods) is plotted against triplet position. (F) Schematic model of the sc12GAA-p illustrating the different accessibility of in- or outside facing triplet junctions on the scRNA template (blue), with P9 primer (red), and the product strand (light gray). Original gel images and numerical values are supplied in Figure 1—source data 1.
-
Figure 1—source data 1
Gel images and numerical values.
- https://cdn.elifesciences.org/articles/75186/elife-75186-fig1-data1-v2.zip
Figure 1—figure supplement 1
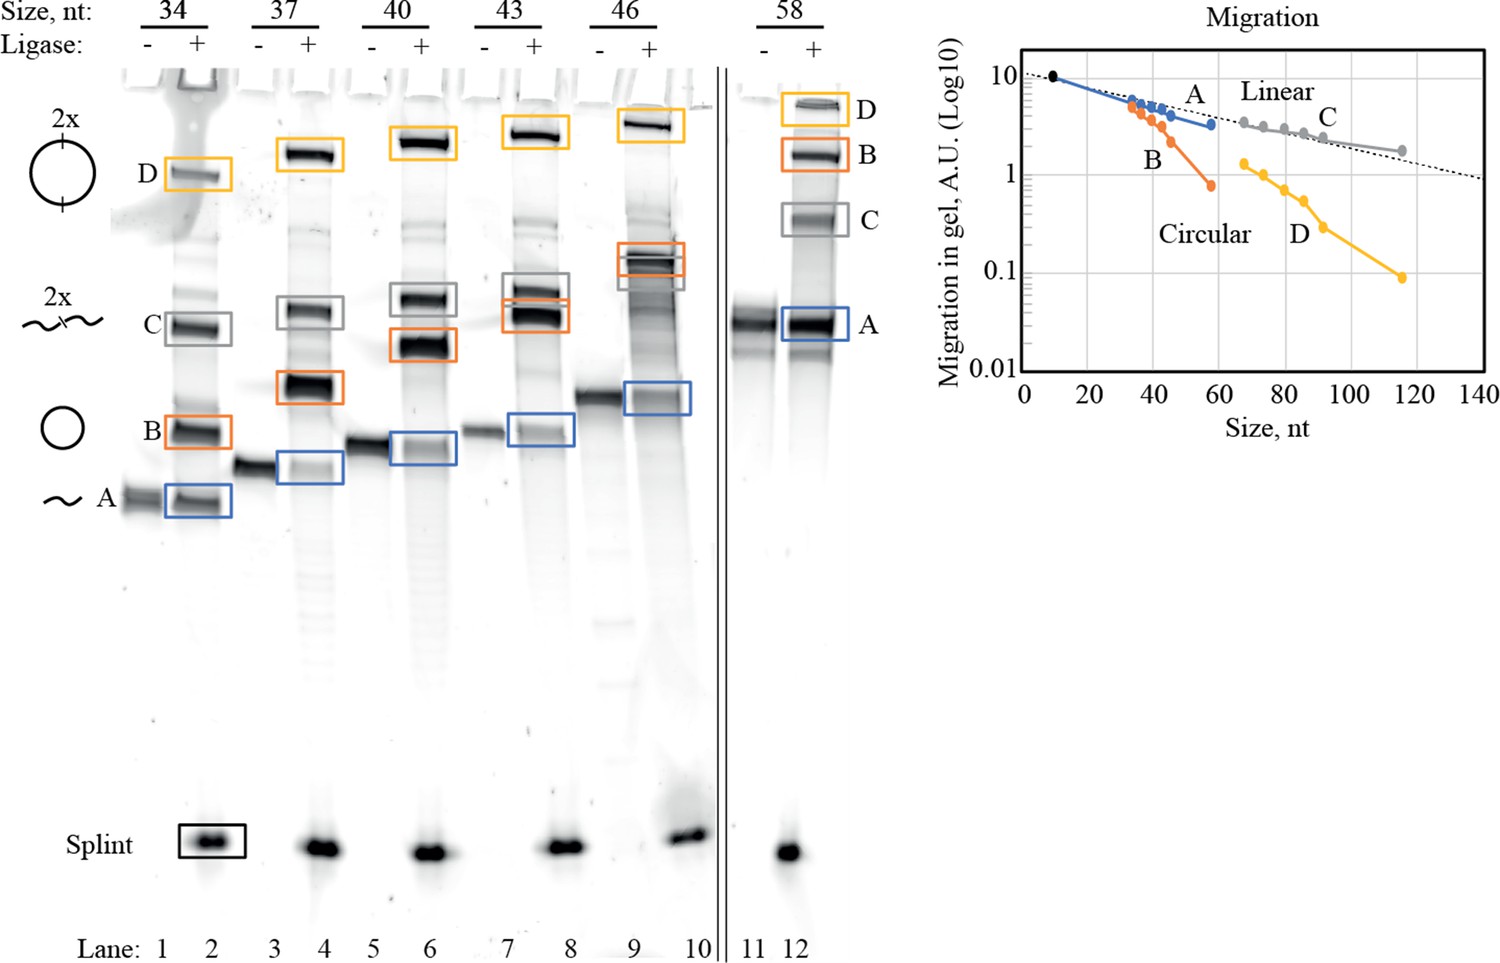
Purification of circularized RNA (scGAA8-16).
Identification and dissection of circularized RNA were performed by denaturing PAGE. Representative SyBr Gold stained 10% Urea PAGE gel is shown here for illustrating the circularization process of circular RNA templates used in main text Figure 2B. In the gel, RNA before (odd lanes) and after (even lanes) ligation with T4RNA ligase 2 was analyzed. A 10 nucleotide (nt) RNA splint (covering 5 nt of the 5′-end and 3′-end of the linear RNA strand) was used for circularization as required by T4 RNA ligase 2. In the ligated samples, multiple bands (A–D) appeared representing various combinations of ligated RNA strands. By migration analysis (right panel), we identified (A) and (C) as linear constructs and (B) and (D) as circularized constructs (illustrations of the identified structure of (A–D) can be seen to the right of the gel). Monomeric circularized RNA (corresponding to band (B)) was dissected out and used throughout this work. In general, we observe that circularized RNA is retained in PAGE compared to the linear strand of the same sequence. All circles used in this work were purified based on the approach outlined above. Bands (A–D) discussed here should not be confused with templates (A–D) used in main text Figure 4. Original gel is supplied in Figure 1—figure supplement 1—source data 1.
-
Figure 1—figure supplement 1—source data 1
Gel images.
- https://cdn.elifesciences.org/articles/75186/elife-75186-fig1-figsupp1-data1-v2.zip
Figure 2 with 1 supplement
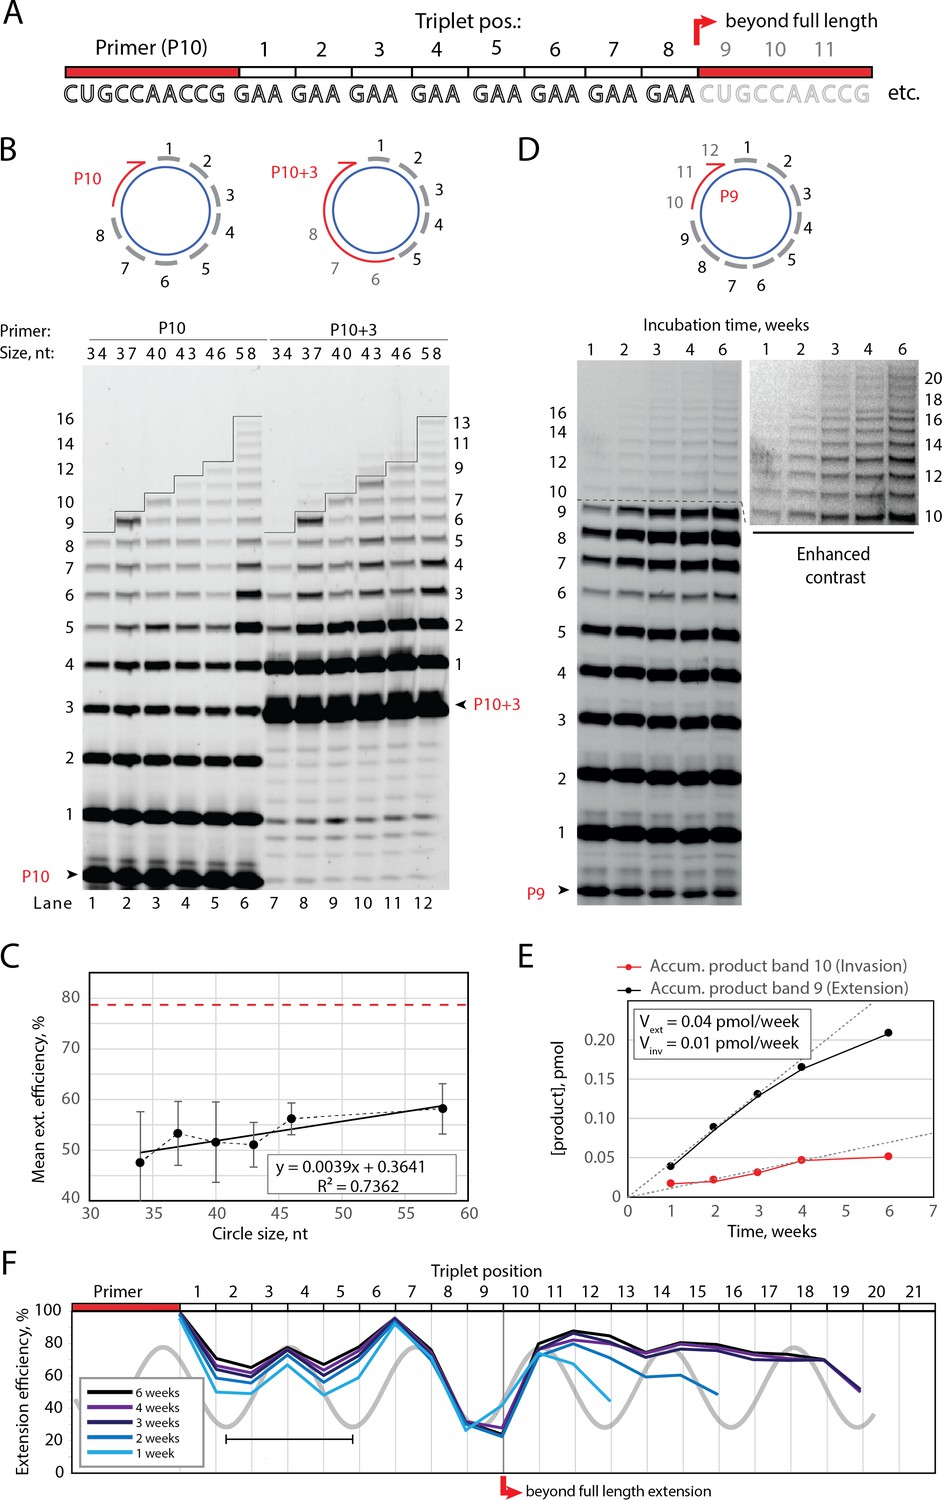
Full-length and beyond full-length RNA-catalyzed RNA synthesis on circular RNA templates.
(A) Product strand of primer extension experiments with primer P10 (red) and eight triplet scRNA template strands. Potential beyond full-length circle synthesis triplets are shaded opaque. (B) Various scRNA template sizes allow full-length primer extension as indicated (with eight triplet sites) (gray), GAA triplets (black), and primers P10 (5′-FAM-CUGCCAACCG) or P10 +3 (5′-FAM-GAAGAAGAA-CUGCCAACCG) (red). PAGE of primer extensions (under standard conditions) with full-length synthesis for different scRNA templates (34–58, termed scGAA8-16, Supplementary file 1) marked by a black line. (C) Mean extension efficiency plotted as a function of scRNA size calculated from extension experiments including (B) (error bars indicate standard deviation, n=5), with mean extension efficiency for a linear RNA template (red dashed line). (D) PAGE of time-course of primer extension of primer P9 on scRNA template, sc12GAA-p (optimized conditions). Full-length circle synthesis is marked by a dashed black line (after +9). Bands +10 and beyond (see Enhanced contrast section) indicate beyond full-length synthesis. (E, F) Mean extension efficiency (from (D)) plotted against time (E) or triplet position (F), showing the respective amounts of product at full-length (black) and beyond full-length circle (red) synthesis as well as the drop in efficiency at full length, which recovers once beyond full-length synthesis is initiated. Vext and Vinv denote the calculated velocity of formation of bands 9 and 10, respectively. Original gel images and numerical values are supplied in Figure 2—source data 1.
-
Figure 2—source data 1
Gel images and numeric values.
- https://cdn.elifesciences.org/articles/75186/elife-75186-fig2-data1-v2.zip
Figure 2—figure supplement 1
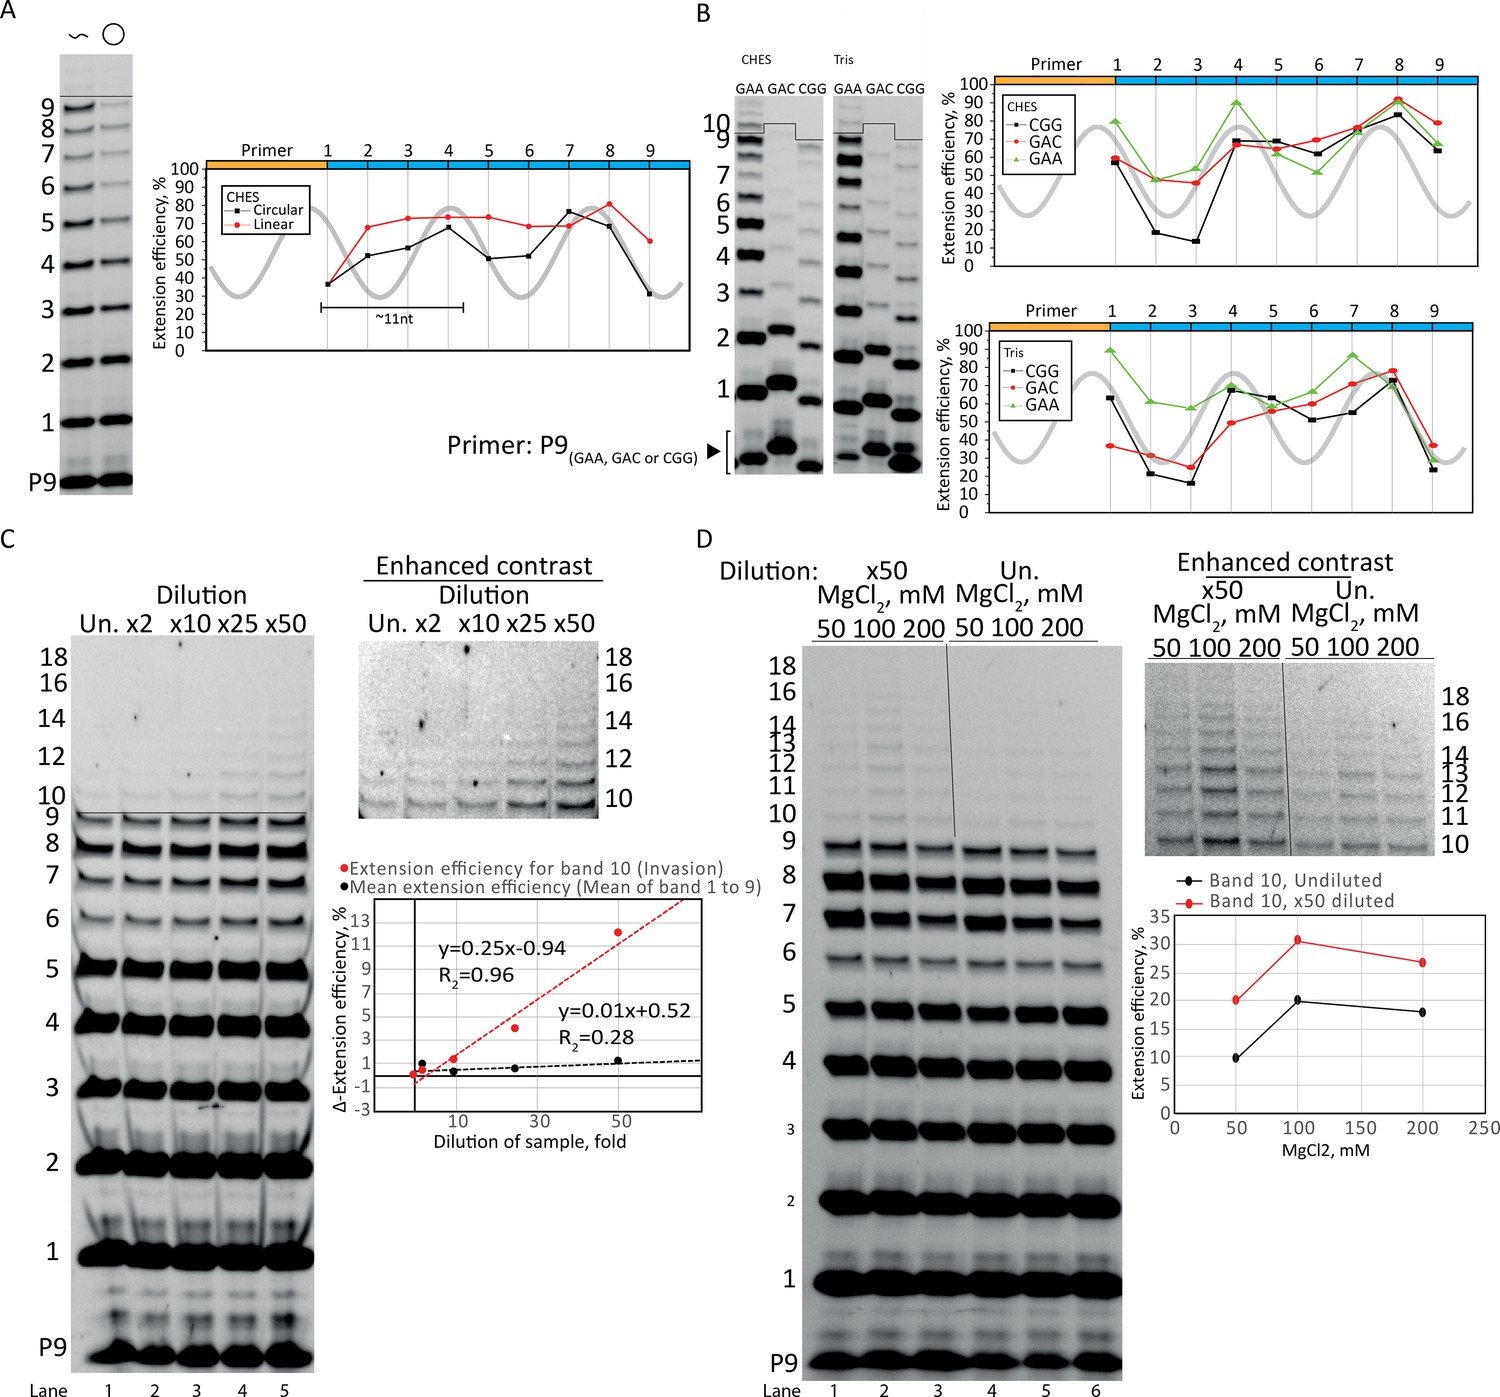
Optimization of rolling circle synthesis.
(A) Comparison between linear and circular primer extension using the CHES reaction buffer system (similar to main text Figure 1D that is in the Tris buffer system). Extensions performed at −7°C for 2 weeks. Template sc12GAA-p and primer P9 were used. 100 pmol triplets were used. (B) The periodic oscillations were observed with various repeat sequence templates (CGG, GAC, and GAA, termed sc12CGG-p, sc12GAC-p, and sc12GAA-p, respectively) in both CHES and Tris buffer systems. Primers P9 (CGG), P9 (GAC), or P9 were used respectively. Extensions performed at −7°C for 4 weeks. 200 pmol triplet was used in the CHES buffer system samples, 100 pmol triplets was used in the Tris buffer system samples. (C) Dilution of samples increased the efficiency. The plot in (C) shows the difference in extension efficiency (Δ-extension efficiency) between the undiluted (Un.) and the 2–50-fold diluted (×2–×50) samples. The Δ-extension efficiency of the ligations before invasion (mean of bands 1–9) were unaffected by the dilution (giving a Δ-extension efficient of ~1). However, the Δ-extension efficiency of band 10 (full length +1 triplet, invasion) increased strongly with dilution. Extensions performed at −7°C for 1 week. (D) The same effect of dilution (improving invasion) was seen over a range of MgCl2 concentrations (50–200 mM). Extensions performed at −7°C for 1 week. All extension reactions presented here were run at standard reaction conditions described in main text Materials and methods except when specified otherwise for dilution, salt, or buffer system. In (C, D), template sc12GAA-p and primer P9 were used. Original gels and numeric values are supplied in Figure 2—figure supplement 1—source data 1.
-
Figure 2—figure supplement 1—source data 1
Gel images and numeric values.
- https://cdn.elifesciences.org/articles/75186/elife-75186-fig2-figsupp1-data1-v2.zip
Figure 3 with 6 supplements
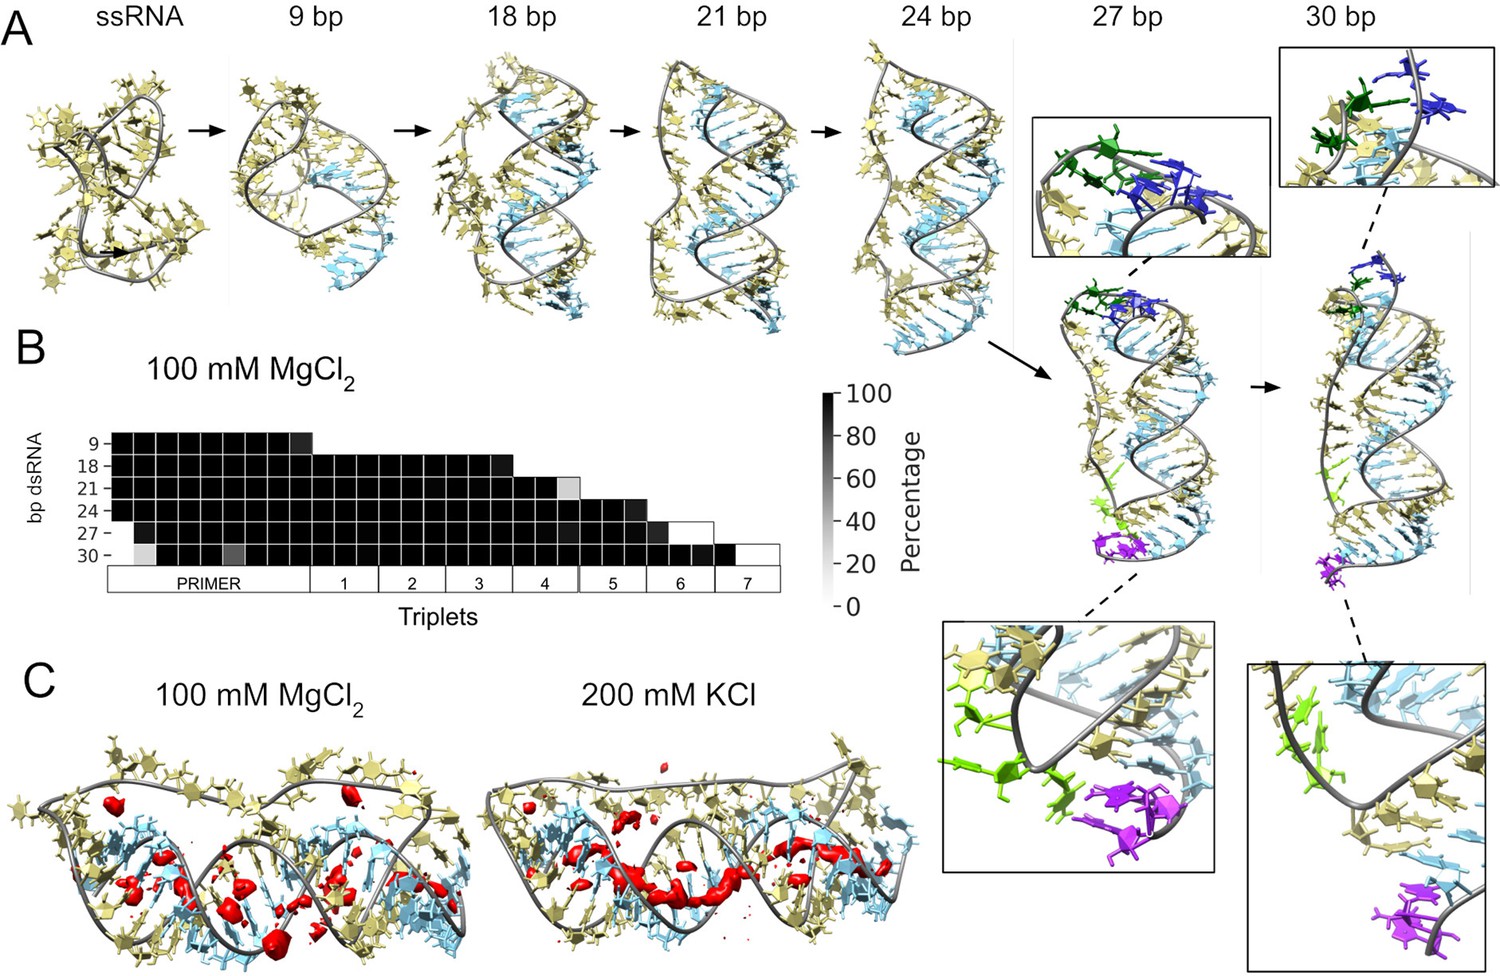
Molecular dynamics simulation of small circular RNA.
(A) Main conformations (and zoom-in to relevant regions [squares]) observed from simulations in 100 mM MgCl2 on scRNA exploring consecutive states of primer extension, from 9 to 30 bp dsRNA with pyrimidine (template) strand (UUC)12 (khaki), purine (product) strand (GAA) (light blue), 5′-end and unpaired bases (dark blue) and 3′-end unpaired bases (purple) and matching melted bases from the template strand (dark green (5′-end)/light green (3′-end)). (B) Percentage of frames from the last 100 ns of the simulations presenting canonical hydrogen bond pairing for each bp. (C) Counterion-density maps (in red) around RNA molecules that show an occupancy ~10 times or greater than the bulk concentration.
Figure 3—figure supplement 1
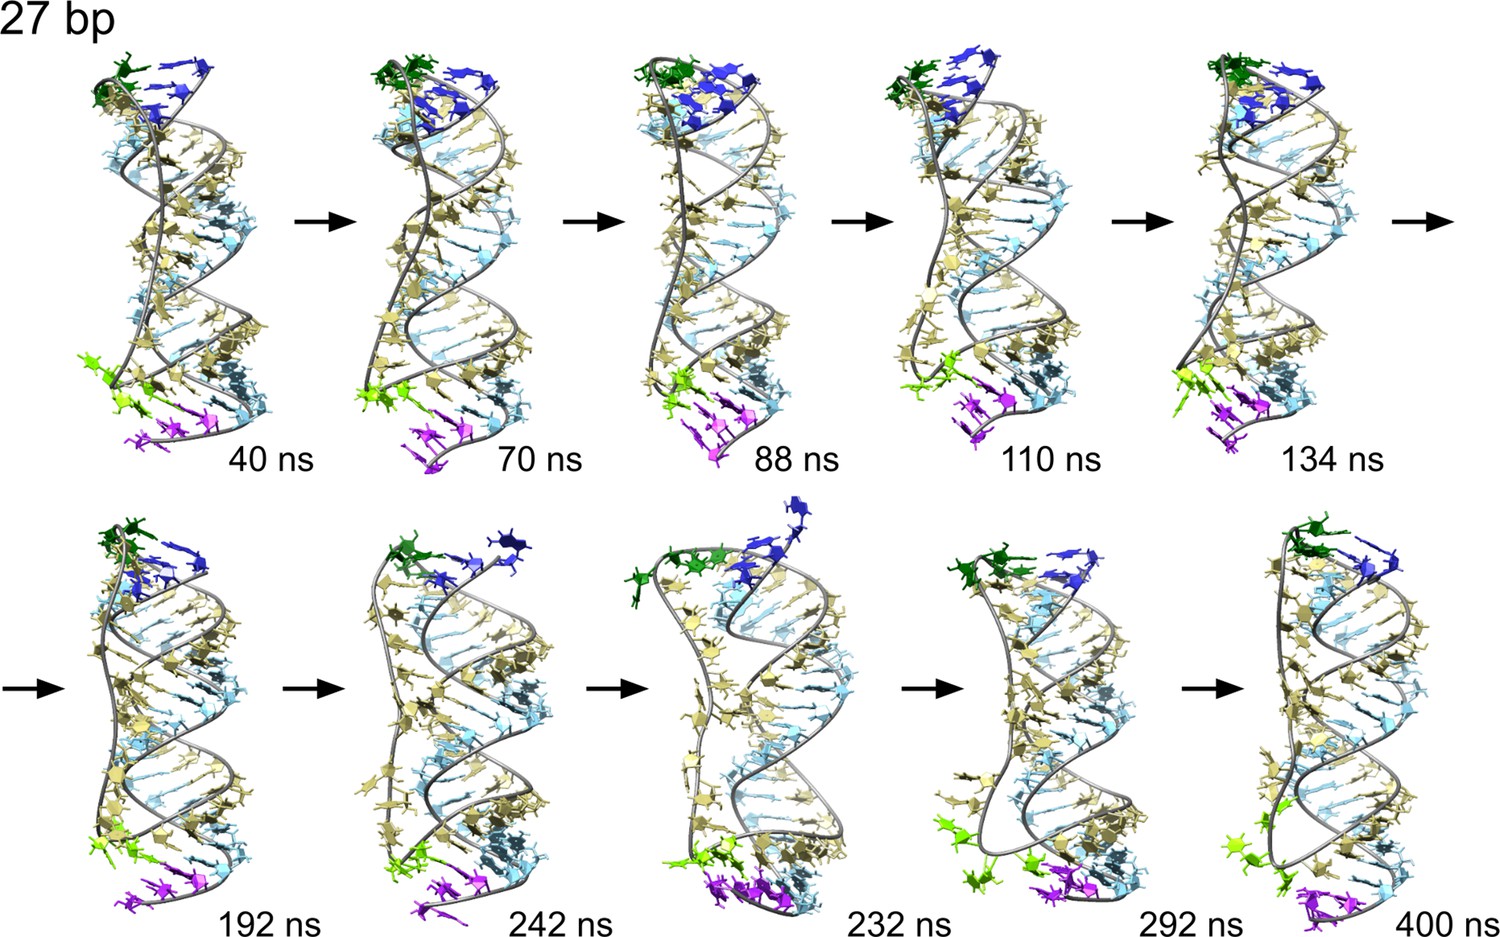
Time sequence of snapshots from the simulation of scRNA with 27 bp dsRNA in 100 mM MgCl2 with pyrimidine (template) strand (UUC)12 (khaki), purine (product) strand (GAA) (light blue).
We observe a series of melting and reannealing events in the 3′-end (purple and light green) during the first half of the simulation and in the 5′-end (dark blue and dark green) during the second half.
Figure 3—figure supplement 2
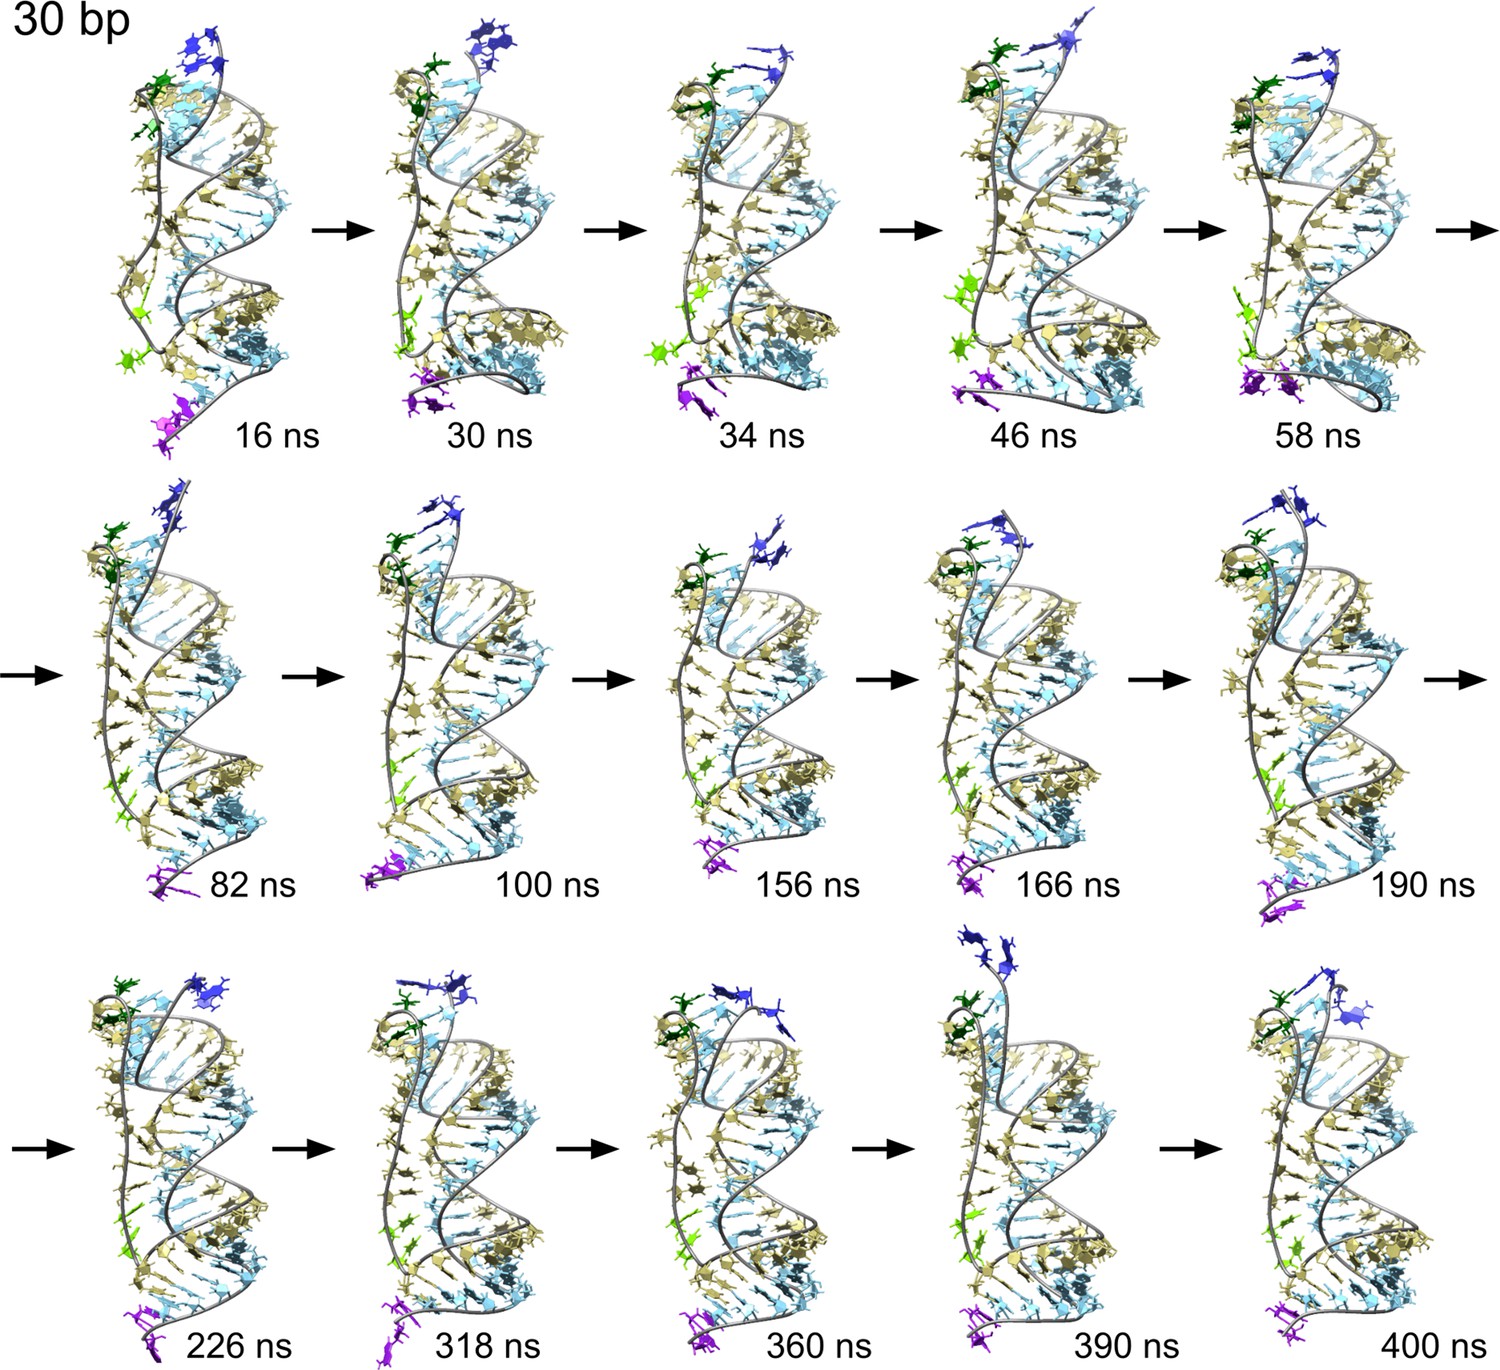
Time sequence of snapshots from the simulation of scRNA with 30 bp dsRNA in 100 mM MgCl2.
We observe a series of melting and reannealing events in the 5′-end (dark blue and dark green). The rest of the color code is the same as Figure 3—figure supplement 1.
Figure 3—figure supplement 3
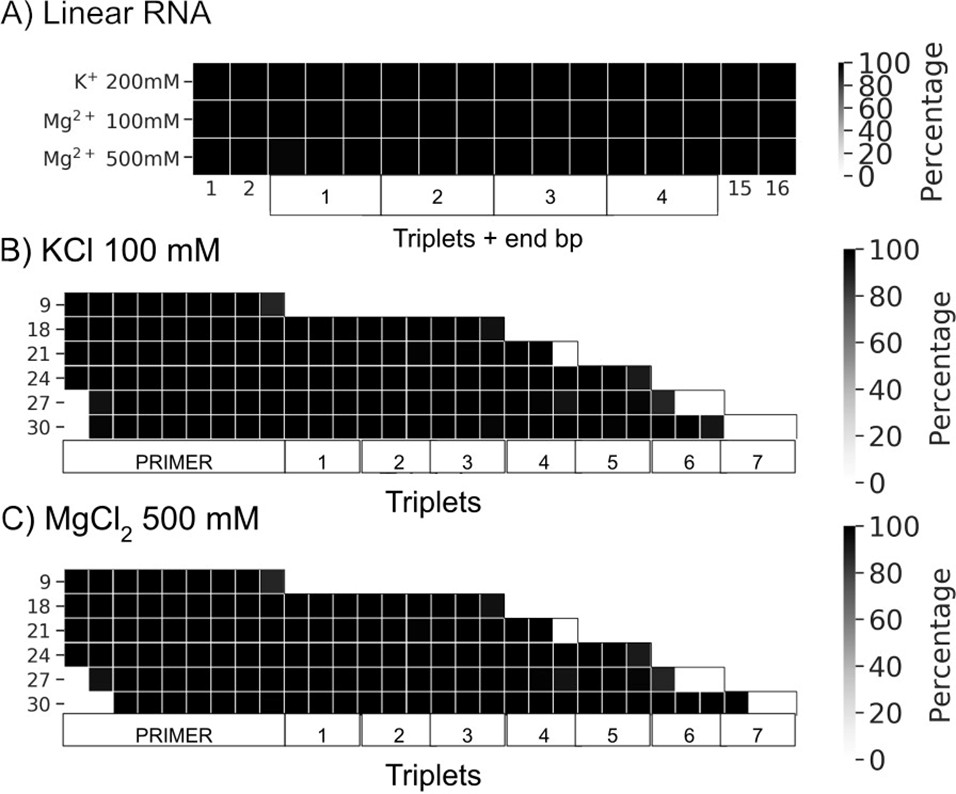
Percentage of frames from the last 100 ns of the simulations presenting canonical hydrogen bond pairing for each base pair (bp).
(A) Linear RNAs solvated with the three buffers (100 mM KCl, 200 mM MgCl2, and 500 mM MgCl2). (B) Rolling circle RNA synthesis (RCS) simulations solvated with 100 mM KCl. (C) RCS simulations solvated with 500 mM Mg Cl2.
Figure 3—figure supplement 4
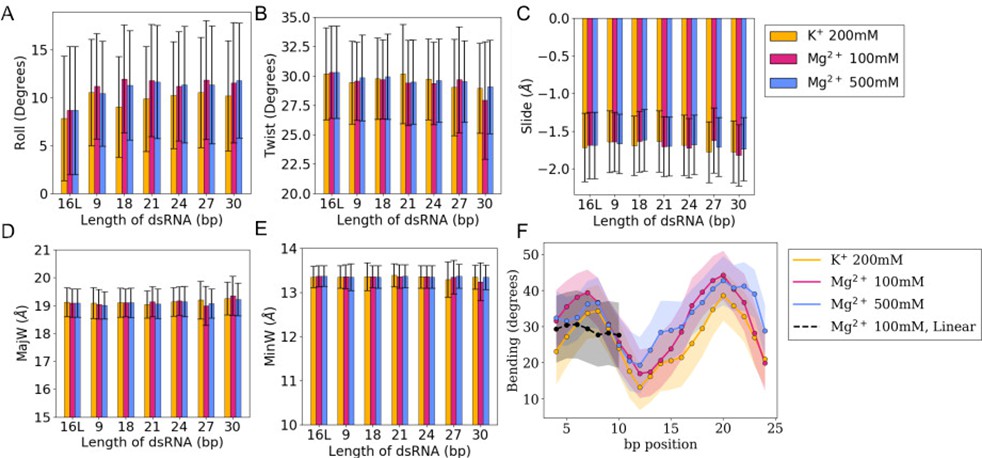
Roll, slide, twist, and major and minor groove widths.
(A–E) Averages and standard deviations (as error bars) of bp-step parameters (roll, slide, and twist) together with major and minor groove widths (MajW and MinW, respectively) calculated over the last 100 ns of the simulations. The trajectory of the 16 bp linear RNA is labeled as 16 L. (F) Bending profile for all the sub-fragments 4-bp long along 30 bp of dsRNA embedded in a 36-bp circular ssRNA.
Figure 3—figure supplement 5
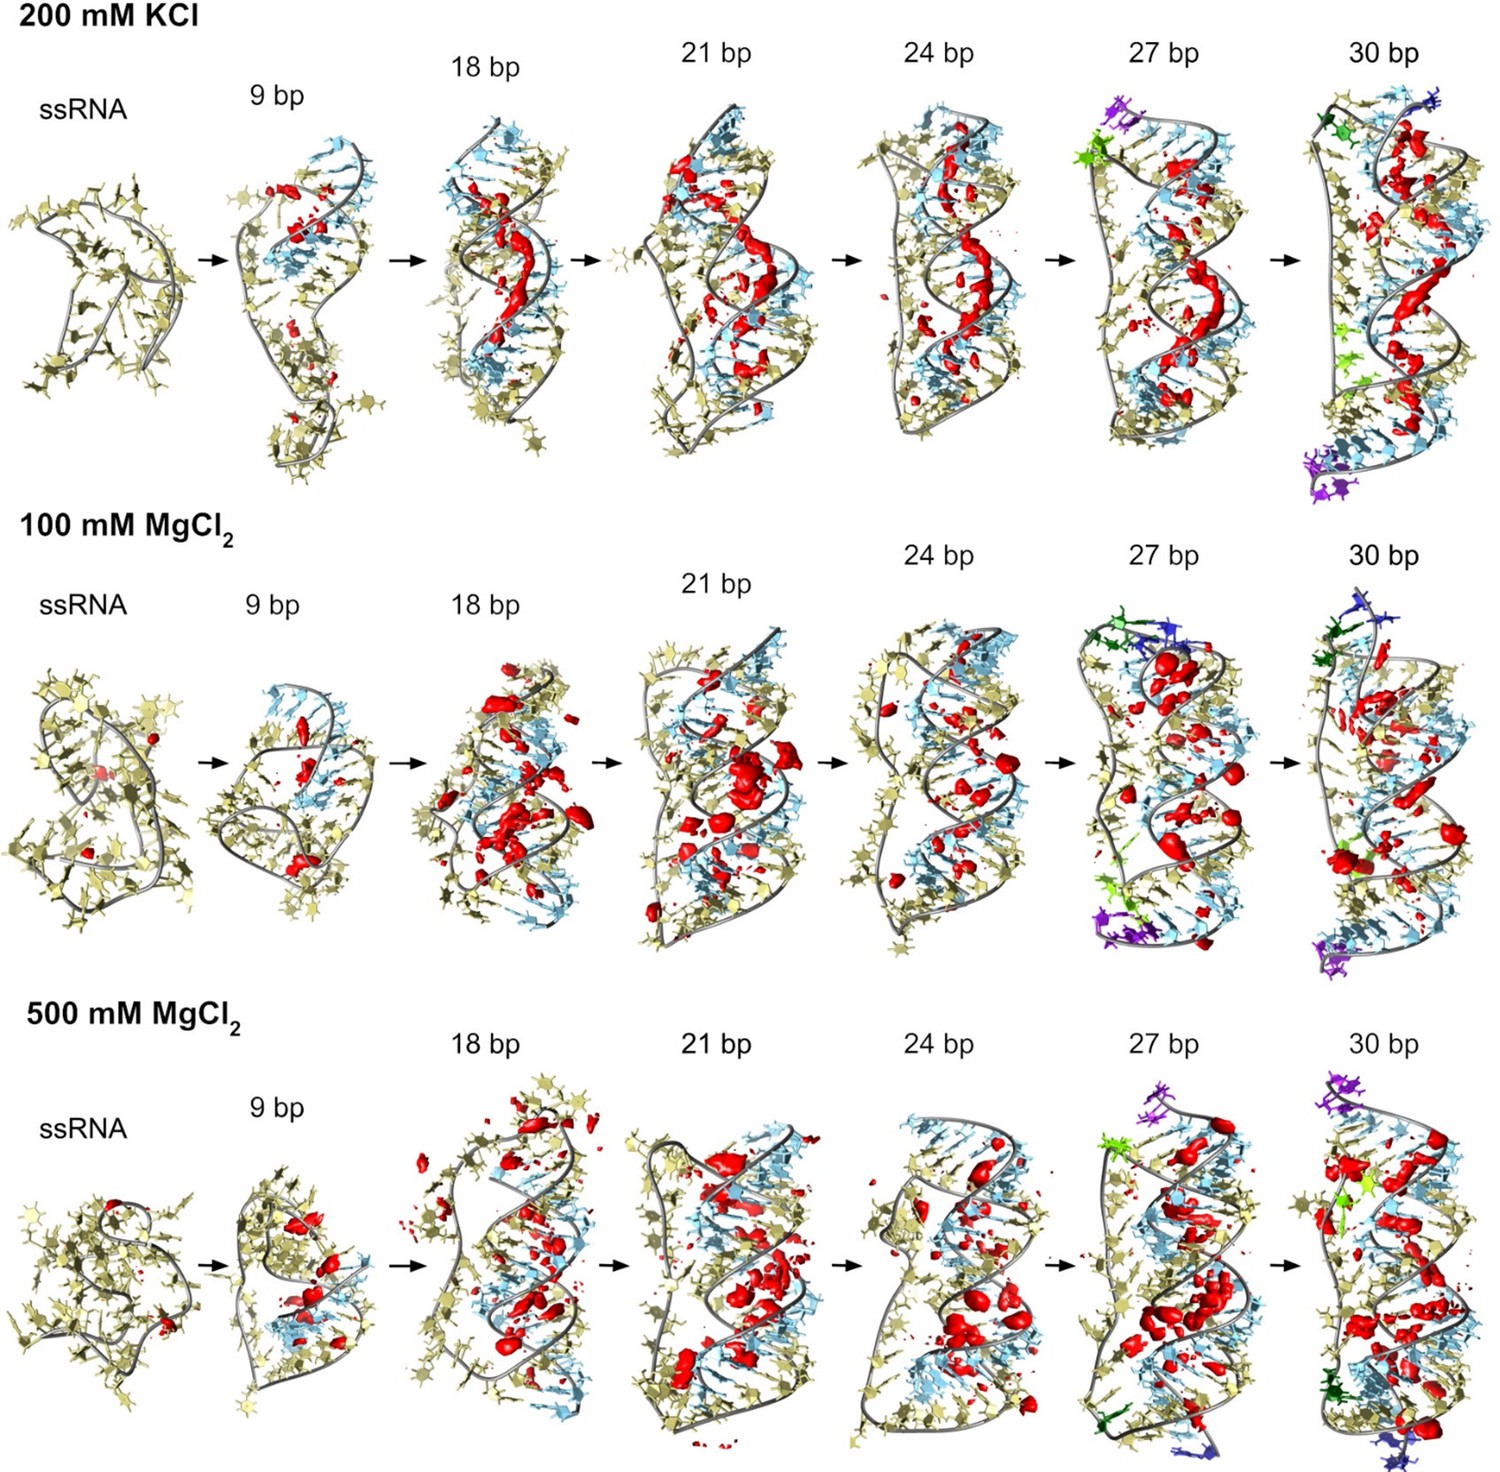
Counterion-density maps around RNA molecules that show an occupancy ~10 times or greater than the bulk concentration (in red) as seen in simulations.
These areas are the molecular regions where cations localize preferentially. In the case of 200 mM KCl, these align along the grooves, whereas, in the case of MgCl2, they tend to be closer to the backbone and bridge distant backbone points, making the bases more exposed. Extremely high Mg2+ concentrations provide similar interacting profiles to moderate levels indicating saturation on the preferred binding sites in both cases.
Figure 3—figure supplement 6
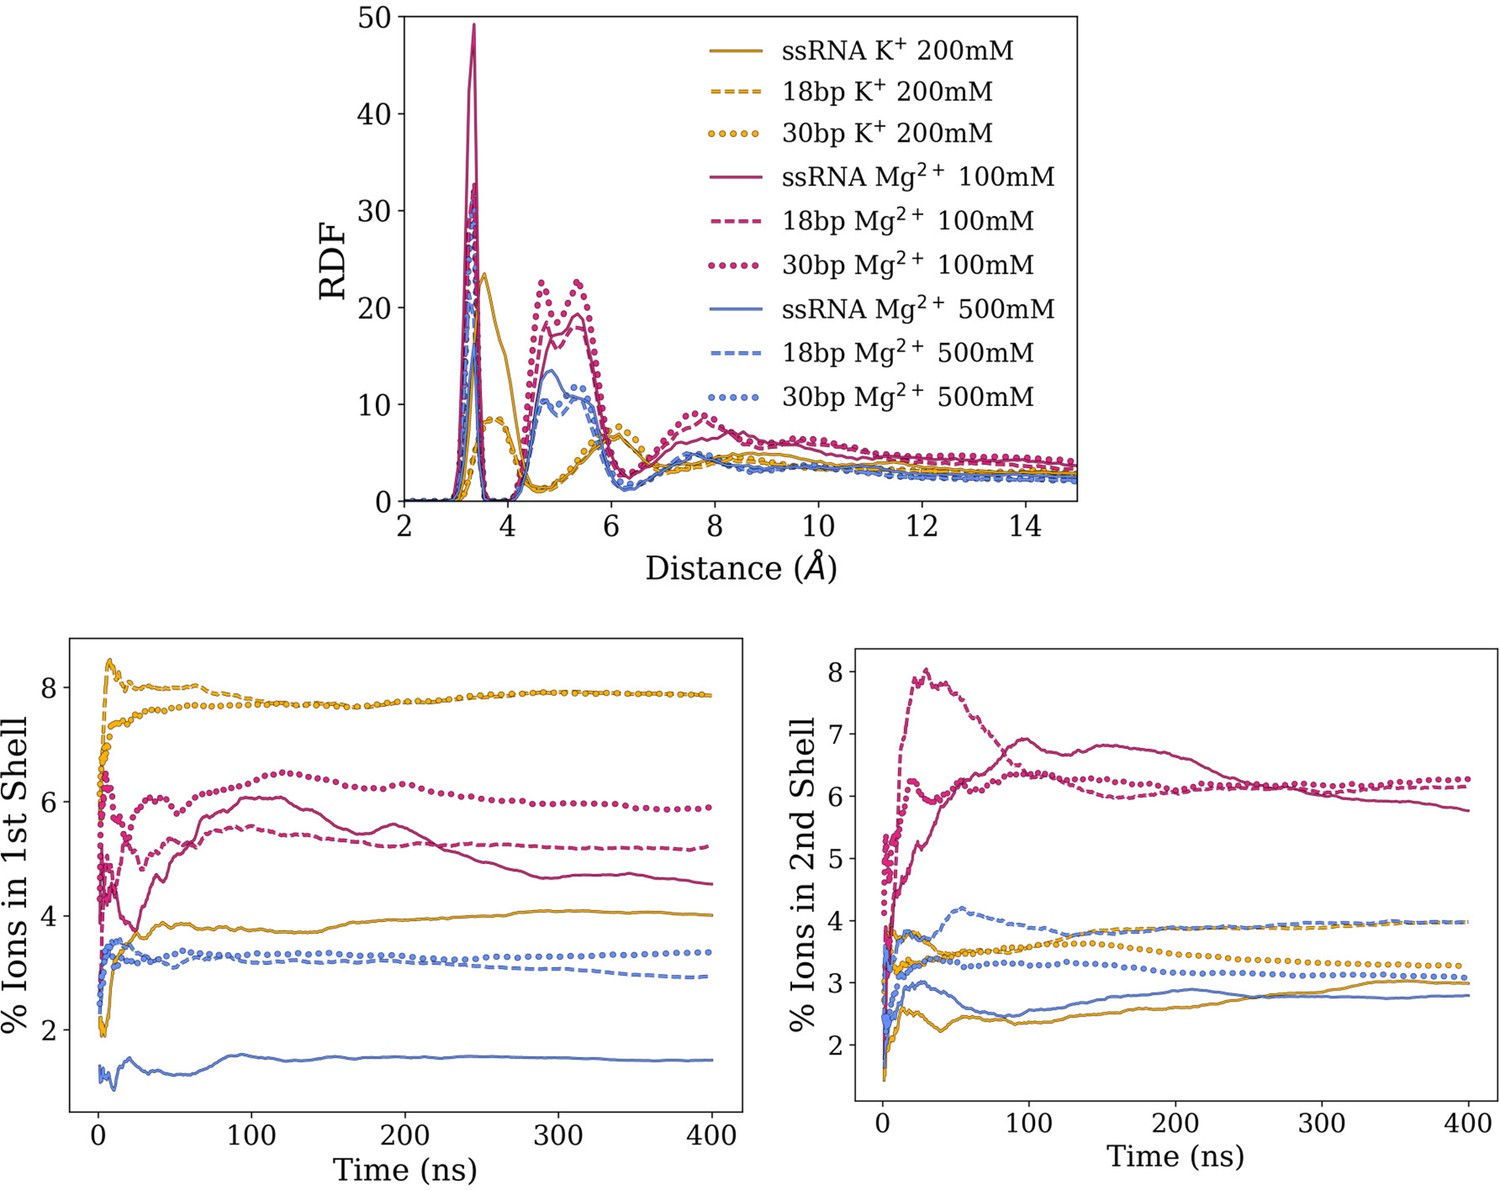
Averages and standard deviation of RDF of cations around RNA backbone phosphates.
(Top) Averages and standard deviations (as error bars) of radial distribution functions (RDFs) of cations around RNA backbone phosphates. The RDFs indicate the probability of finding an ion within a certain distance of a particular RNA atom in relation to its bulk concentration (set at 1). Magnesium ions make more direct interactions with RNA backbone (first peak) and mediated by water molecules (subsequent peaks) than potassium. The smaller RDF peaks observed on 500 mM compared to 100 mM indicate a relatively lower ion condensation around RNA with respect to bulk concentration due to saturation. (Bottom) Cumulated ion populations as function of simulation time within the first and the second solvation shells around RNA backbone phosphates, which corresponds to the first and second peaks of the RDF, respectively.
Figure 4 with 2 supplements
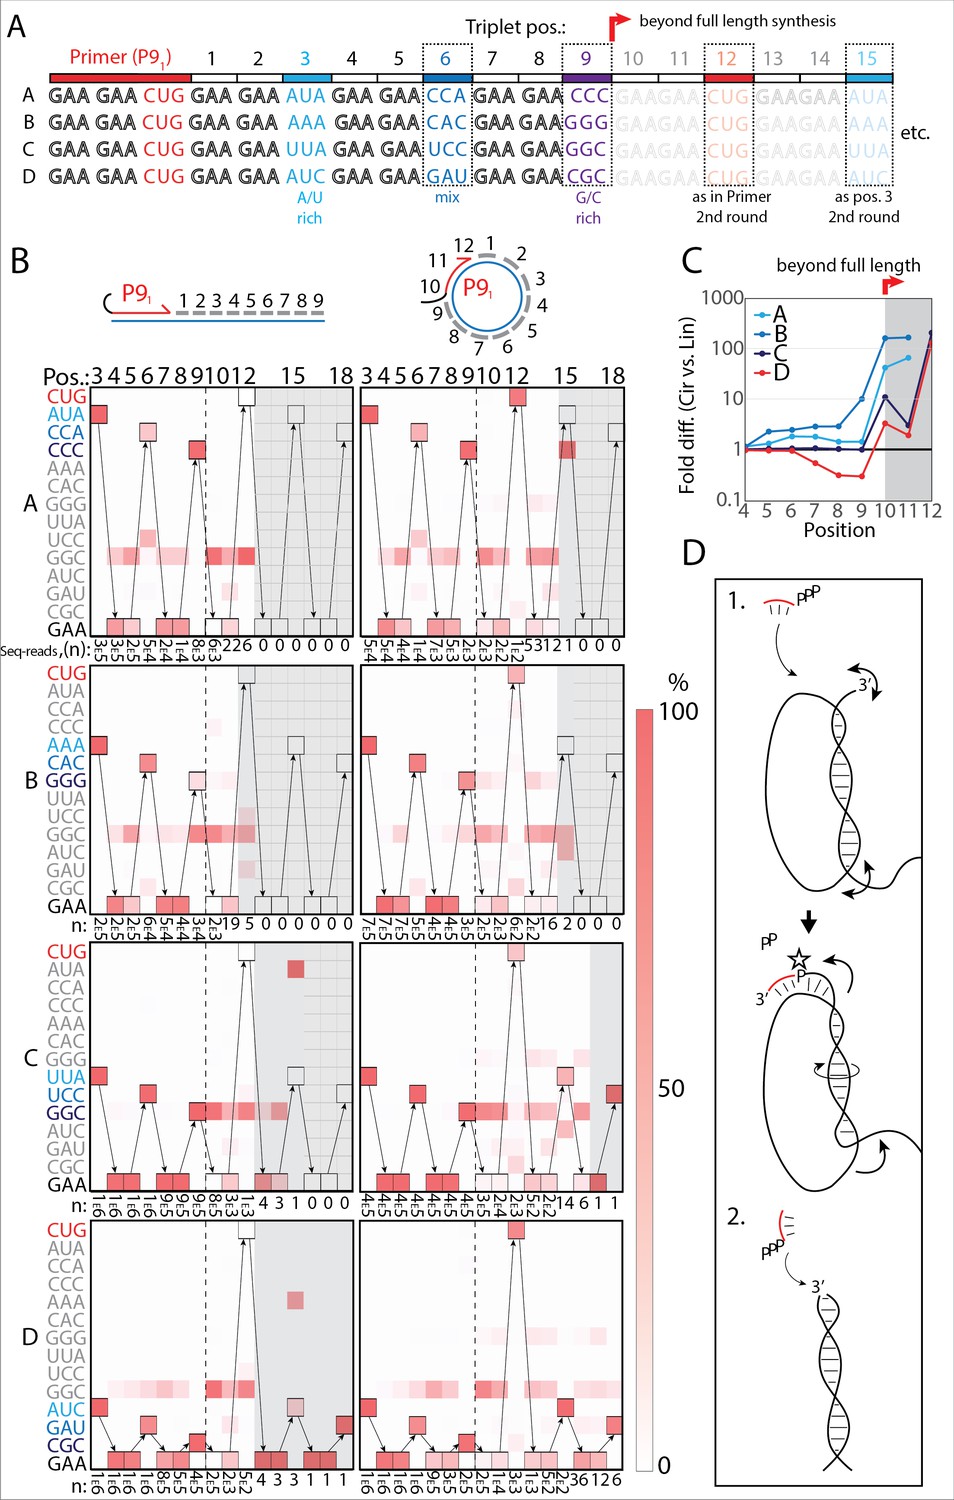
RNA-catalyzed RNA synthesis beyond full length for circular templates.
(A) Product strands of primer extension experiments with linear and scRNA templates A–D with primer P91. Opaque sequence illustrate potential beyond full-length synthesis on scRNA. Barcode triplets at positions 3 (A/U rich) (cyan), 6 (mix) (blue), and 9 (G/C rich) (purple) allow identification of product RNAs. Barcode triplet at position 12 is the final triplet of primer P91 and at position 15 is the same as that of position 3 but after beyond full-length circle synthesis on the scRNA template. (B) Fidelity heatmap of the sequences derived from the one-pot experiments with linear (left) or circular (right) templates. Red color indicates high prevalence of a given triplet (vertical axis) at the position noted (3–18). n: denotes the number of sequence reads (3E5=3×10⁵) used to calculate the fidelity for each triplet at the given position. Transparent gray boxes cover positions with n≤5. (C) Plot shows ratio (fold difference) of the probability of a product of reaching positions 4–12 on circular compared to linear templates. Fold difference was calculated based on fidelity data presented in (B). (D) Model illustrating (1.) beyond full-length extension on a circular template (templated RCS) and (2.) on a linear template (non-templated). Full analysis of the data in B is supplied in Figure 4—source data 1.
-
Figure 4—source data 1
Full analysis of sequencing data used in Figure 4B.
- https://cdn.elifesciences.org/articles/75186/elife-75186-fig4-data1-v2.zip
Figure 4—figure supplement 1
Deep sequencing of extension products.
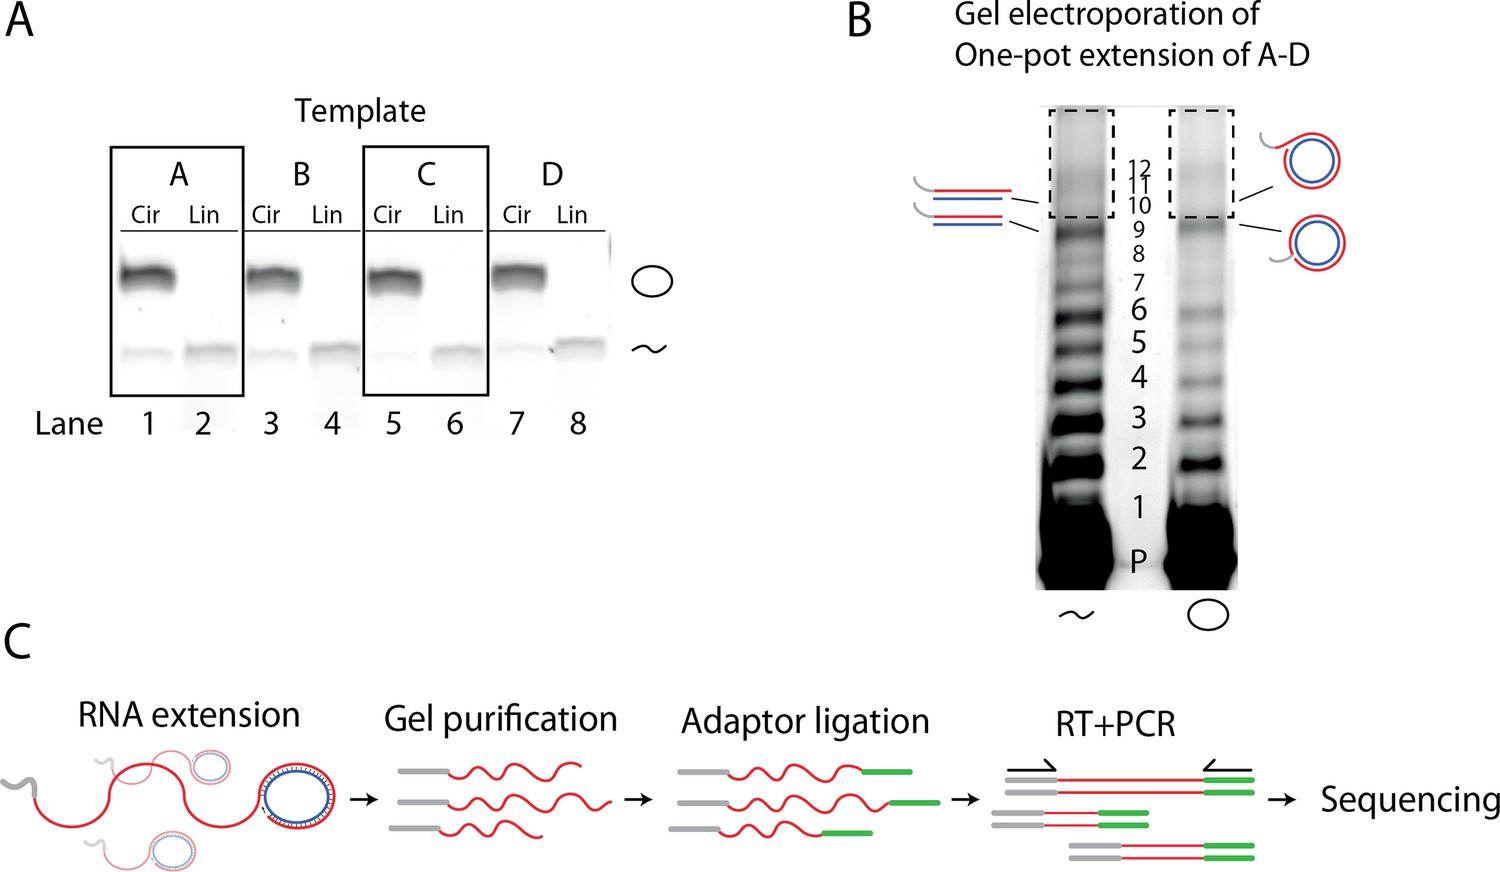
(A) Representative SyBr Gold stained 10% Urea PAGE gel showing linear and circularized templates A–D. Circularized RNA was retained in the gel as expected. A small degree of hydrolyzed RNA is seen as a lower band in the gel indicating that circles that a low fraction of circles has opened. (B) 10% Urea PAGE separation of one-pot extension reaction used for deep sequencing. Dashed box denotes excised region (above the full-length product (band 9)) used for RNA recovery and Deep-sequencing. (C) Illustration of the protocol for sequencing of extension products. The initial extension products get gel purified, then 3′-adaptor ligated with a 5′-adenylated DNA adapter strand, and finally RT-PCR amplified (adding additional adapter sequences) and submitted for sequencing. Original gels are supplied in Figure 4—figure supplement 1—source data 1.
-
Figure 4—figure supplement 1—source data 1
Gel images.
- https://cdn.elifesciences.org/articles/75186/elife-75186-fig4-figsupp1-data1-v2.zip
Figure 4—figure supplement 2
Controls for deep-sequencing data.
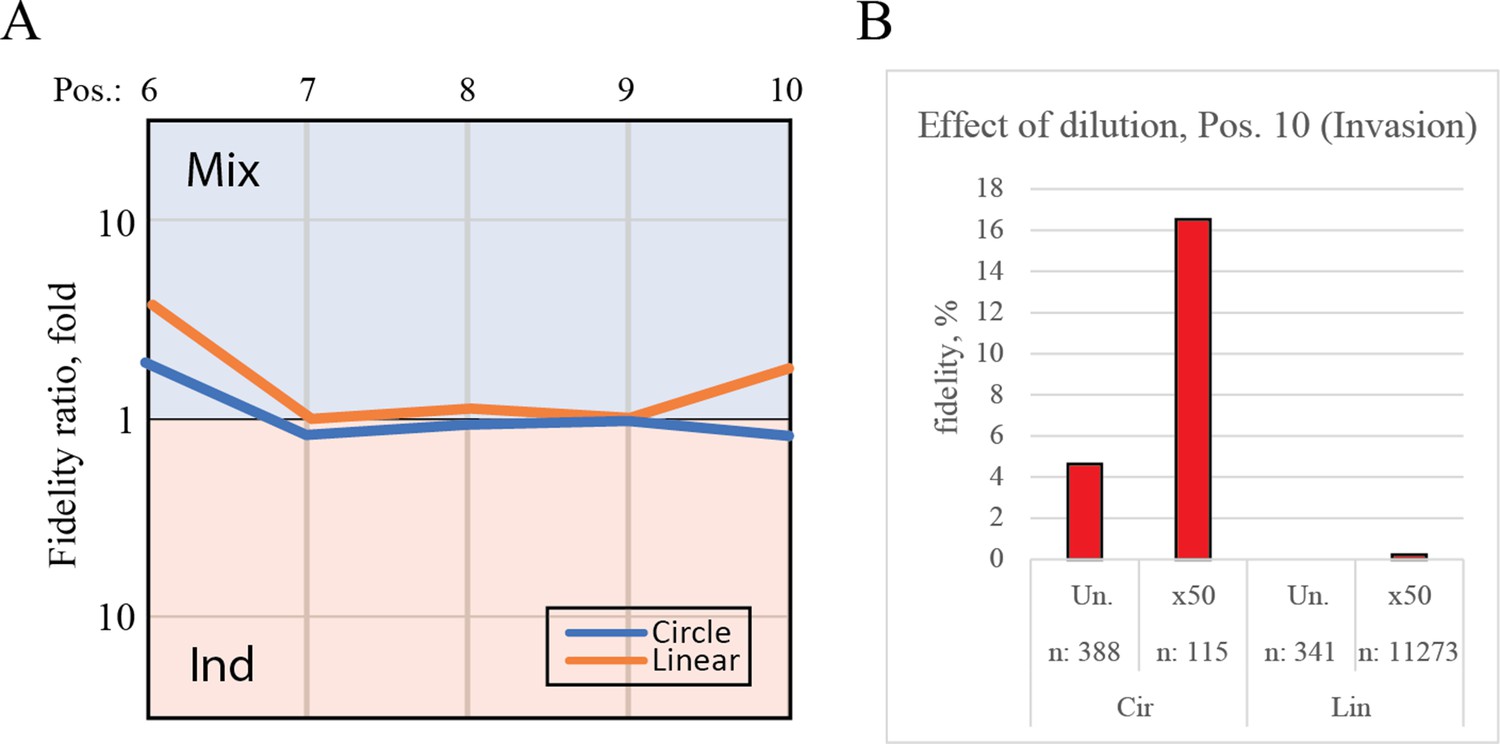
(A) Plot shows the fidelity ratio at the noted triplet positions between extension reactions where the templates were incubated either in one-pot (Mix) or in individual tubes (Ind). This is shown for the circular templates (blue lines) and linear templates (orange lines). (B) The effect of dilution with water leads to increased fidelity at the point of invasion (position 10). Bar chart shows the fidelity for insertion of the expected triplet at position 10 (making invasion) calculated from deep-sequenced samples that were either not diluted (Un.) or diluted 50-fold (×50).
Figure 5 with 1 supplement
RNA-catalyzed branched RCS.
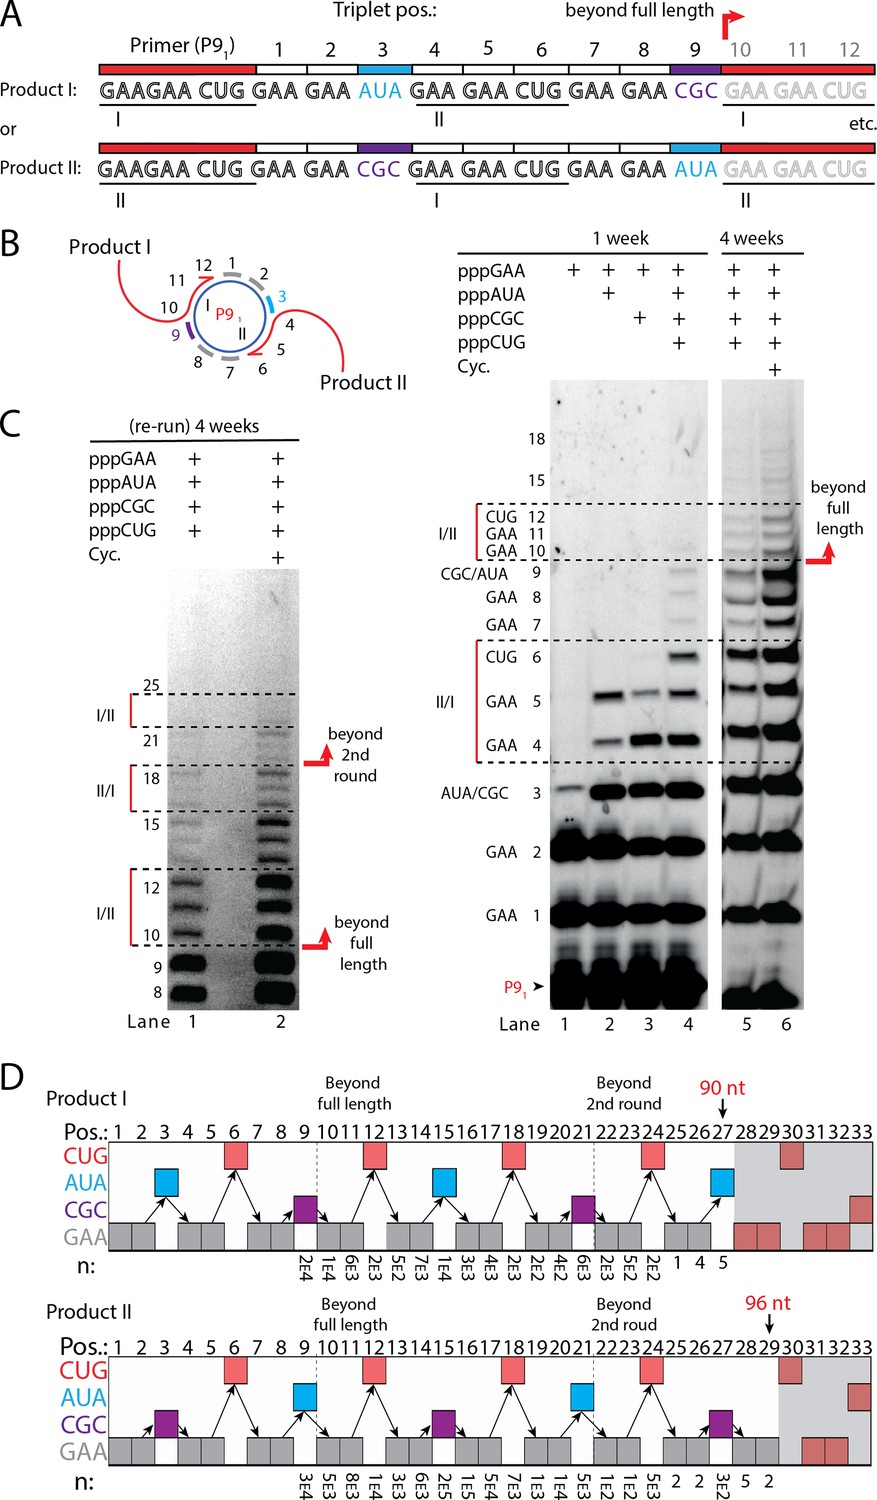
(A) Product strand of primer extension experiments with scRNA template containing two priming sites (I and II) for primer P91. Depending on the priming site two different products will be made (I or II). (B, C) Scheme and PAGE of primer extension experiments with only the noted triplets added with (C) long electrophoretic separation to achieve optimal resolution of long products. Cycling (Cyc.) indicates that the samples had been exposed to four thermal and freeze-thaw cycles (80°C 2 min, 17°C 10 min, −70°C 5–15 min, and −7°C 7 days) leading to increased efficiency. (D) Sequencing of longer than full-length branched RCS products on the double primer site scRNA (without cycling). Products I and II both reaching almost three full rounds of replication of the circular RNA template (up to 96 nt, 32 triplet incorporations). Original gel images and full analysis of the data in D are supplied in Figure 5—source data 1.
-
Figure 5—source data 1
Gel images and full data analysis of sequencing data used in Figure 5D.
- https://cdn.elifesciences.org/articles/75186/elife-75186-fig5-data1-v2.zip
Figure 5—figure supplement 1
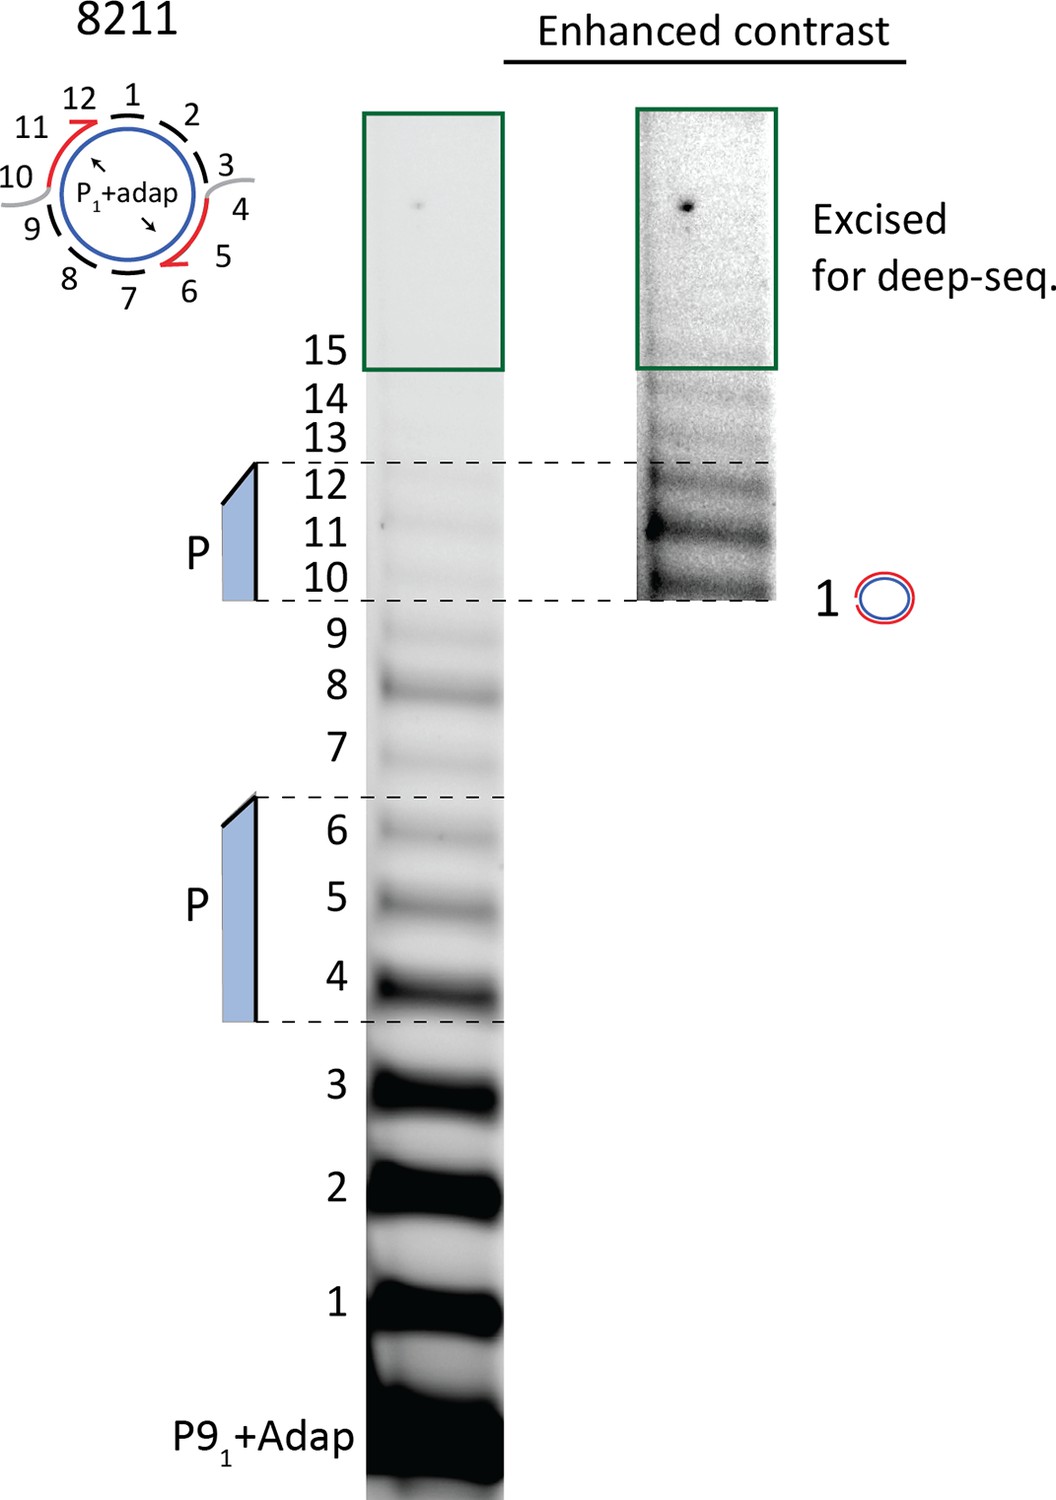
10% Urea PAGE separation of circular template extension reaction used for deep sequencing.
Excised gel piece is marked with green.
Figure 6 with 1 supplement
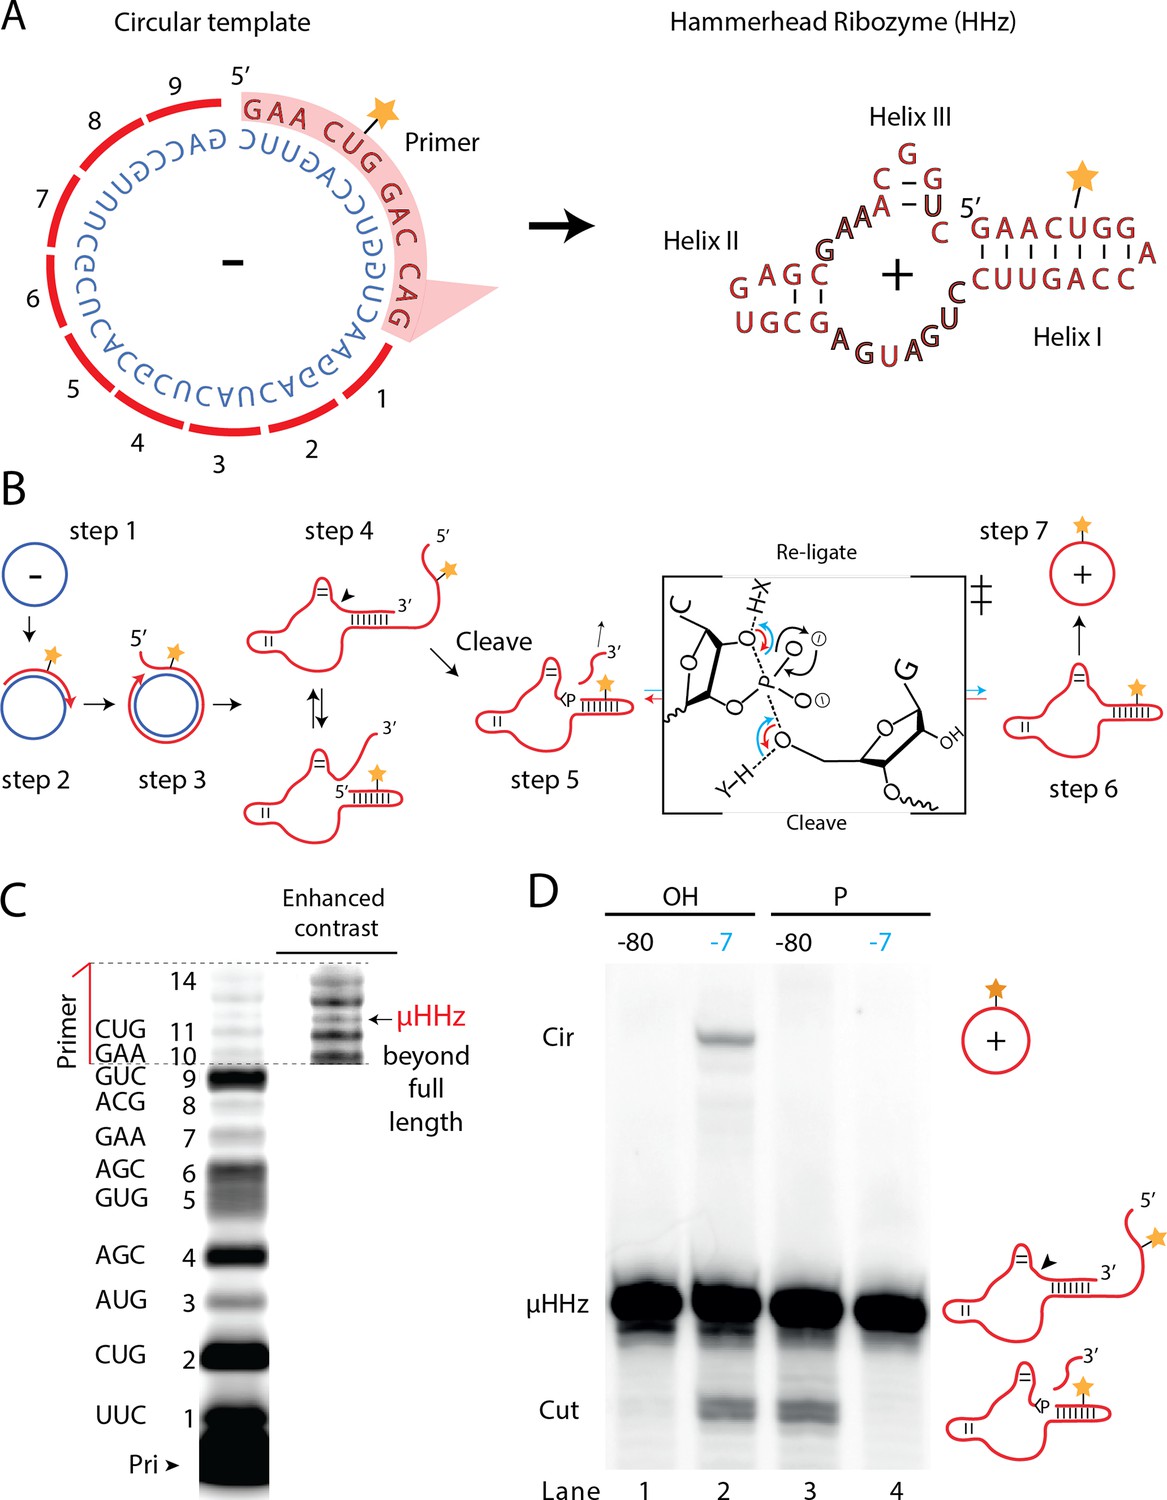
Steps of a viroid-like replication cycle catalyzed by RNA alone.
(A) Illustration of the µHHz (−) and (+) strand. (B) Schematic illustration of the RNA-catalyzed viroid-like replication with steps comprising RNA-catalyzed combined RCS (steps 1–3), resection (steps 4 and 5), and self-circularization (steps 6 and 7). Panel between steps 5 and 6 illustrates the presumed chemical structures of the transition state of cleavage and re-ligation between the µHHz 3′- and 5′-ends. Blue arrow denotes the re-ligation reaction by bond formation with the 5′-nucleotide (forming the circle) and transesterification of the 2,3-cyclic phosphate bond (>p). Red arrows denote cleavage of the phosphate diester backbone (cleaving the circle) and formation of the 2′,3′-cyclic phosphate (>p). X and Y denote acids/bases involved in the transesterification reaction. (C) PAGE gel showing primer extension of RCS synthesis of the µHHz with substrate overhang to allow self-cleavage. scHHz temp was used as template and PHHz was used as primer (Pri). (D) PAGE gel showing cleavage and circularization of a µHHz, but only when incubated at –7°C, allowing eutectic phase to form, and with a free 5′-OH, needed for circularization, but not for cleavage. Original gel images are supplied in Figure 6—source data 1.
-
Figure 6—source data 1
Gel images.
- https://cdn.elifesciences.org/articles/75186/elife-75186-fig6-data1-v2.zip
Figure 6—figure supplement 1
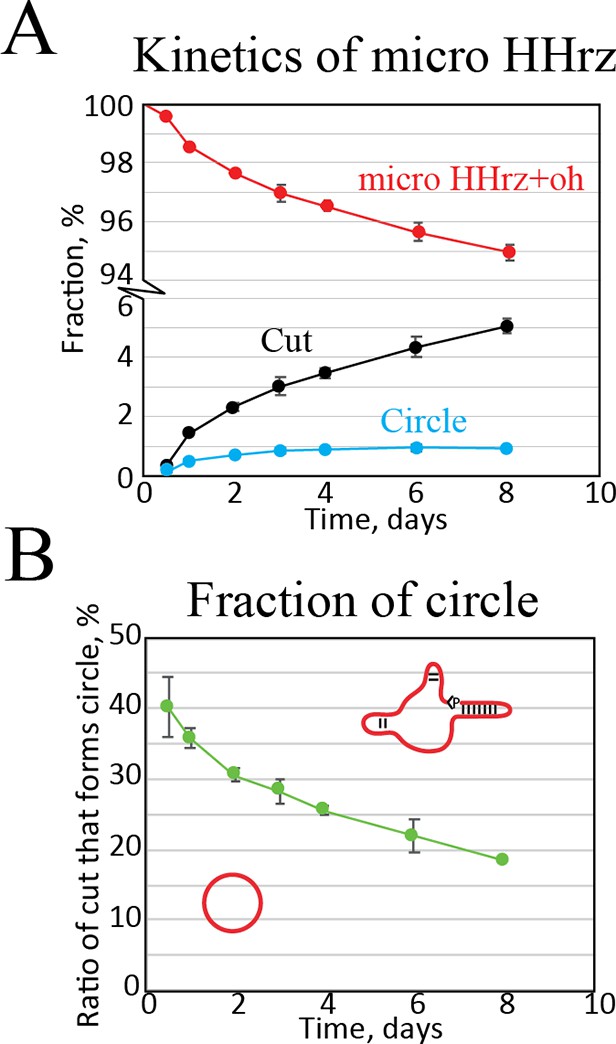
Kinetic analysis of the µHHrz.
(A) Quantification of band intensities as a function of time. Here, we see that cut RNA accumulates while the amount of circular RNA seems to reach an equilibrium. (B) Fraction of circular RNA relative to cut as a function of time. This plot shows that a very high amount of circle is formed at short time points slowly dropping in relation to non-circular cut RNA.
Videos
Video 1
Movie of the RCS simulation where dsRNA is 27-bp long.
We observe fraying and annealing of 5′- and 3′-ends demonstrating the quick timescales of these transitions.
Video 2
Movie of the RCS simulation where dsRNA is 30-bp long.
We observe again fraying and annealing of 5′- and 3′-ends demonstrating the quick timescales of these transitions.
Additional files
-
Transparent reporting form
- https://cdn.elifesciences.org/articles/75186/elife-75186-transrepform1-v2.pdf
-
Supplementary file 1
Oligonucleotide sequences.
- https://cdn.elifesciences.org/articles/75186/elife-75186-supp1-v2.docx
Download links
A two-part list of links to download the article, or parts of the article, in various formats.
Downloads (link to download the article as PDF)
Open citations (links to open the citations from this article in various online reference manager services)
Cite this article (links to download the citations from this article in formats compatible with various reference manager tools)
Rolling circle RNA synthesis catalyzed by RNA
eLife 11:e75186.
https://doi.org/10.7554/eLife.75186


