Multi-targeted therapy resistance via drug-induced secretome fucosylation
- Department of Chemical and Biomolecular Engineering, Korea Advanced Institute of Science and Technology (KAIST), Republic of Korea
- Department of Biological Sciences, KAIST, Republic of Korea
- Department of Biochemistry, College of Veterinary Medicine, Seoul National University, Republic of Korea
- Comparative Medicine Disease Research Center (CDRC), Seoul National University, Republic of Korea
- BK21 PLUS Program for Creative Veterinary Science Research and Research Institute for Veterinary Science, Seoul National University, Republic of Korea
- Department of Bio and Brain Engineering, KAIST, Republic of Korea
- Computational Systems Biochemistry Research Group, Max Planck Institute of Biochemistry, Germany
- Department of Electrical Engineering, KAIST, Republic of Korea
- Department of Internal Medicine, Seoul National University Hospital, Republic of Korea
- Cancer Research Institute, Seoul National University College of Medicine, Republic of Korea
- Department of Pathology, Seoul National University Hospital, Seoul National University College of Medicine, Republic of Korea
- Department of Thoracic and Cardiovascular Surgery, Seoul National University Bundang Hospital, Republic of Korea
- KAIST Institute for Health Science and Technology (KIHST), KAIST, Republic of Korea
- KAIST Institute for BioCentury (KIB), KAIST, Republic of Korea
- BioProcess Engineering Research Center and Bioinformatics Research Center, KAIST, Republic of Korea
Figures
Figure 1 with 12 supplements
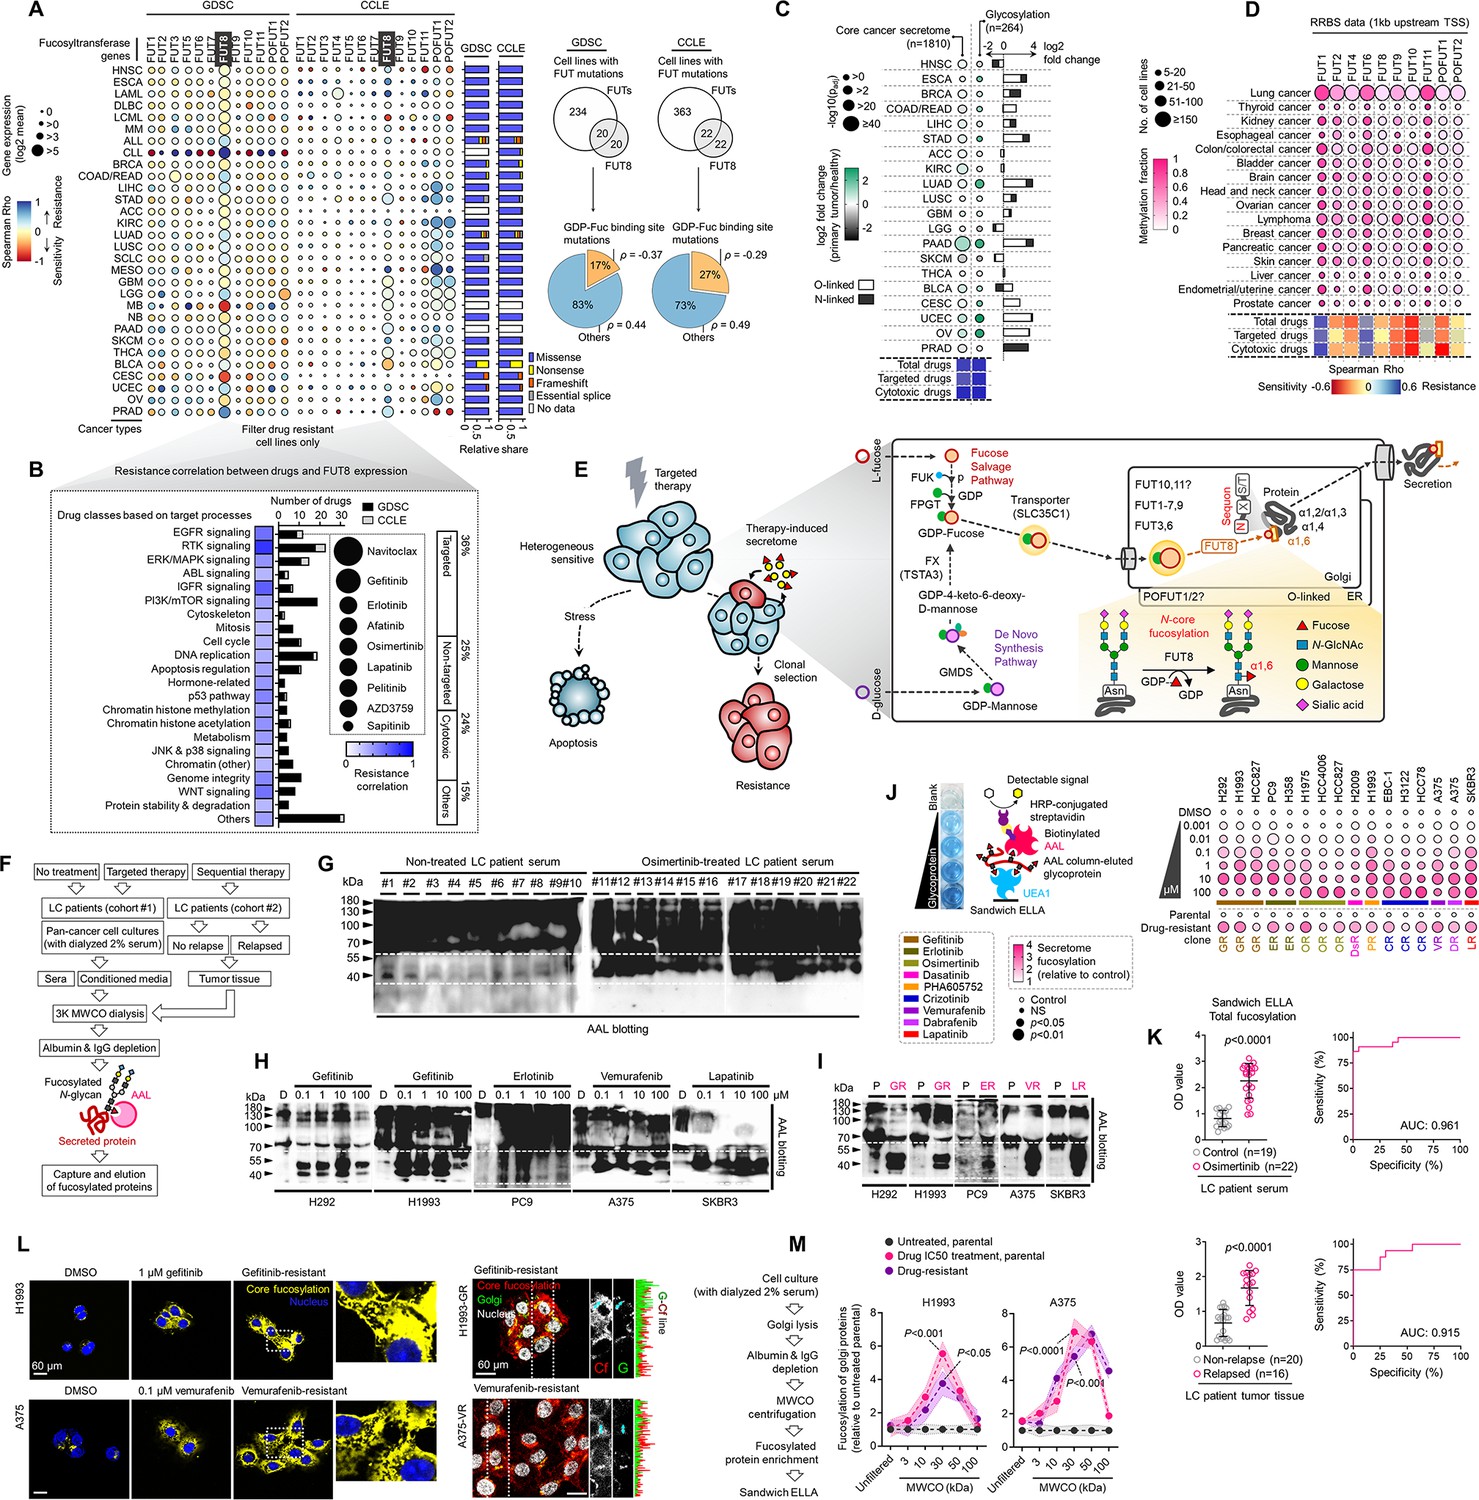
Secretome fucosylation is a post-translational mechanism associated with targeted therapy resistance in cancer.
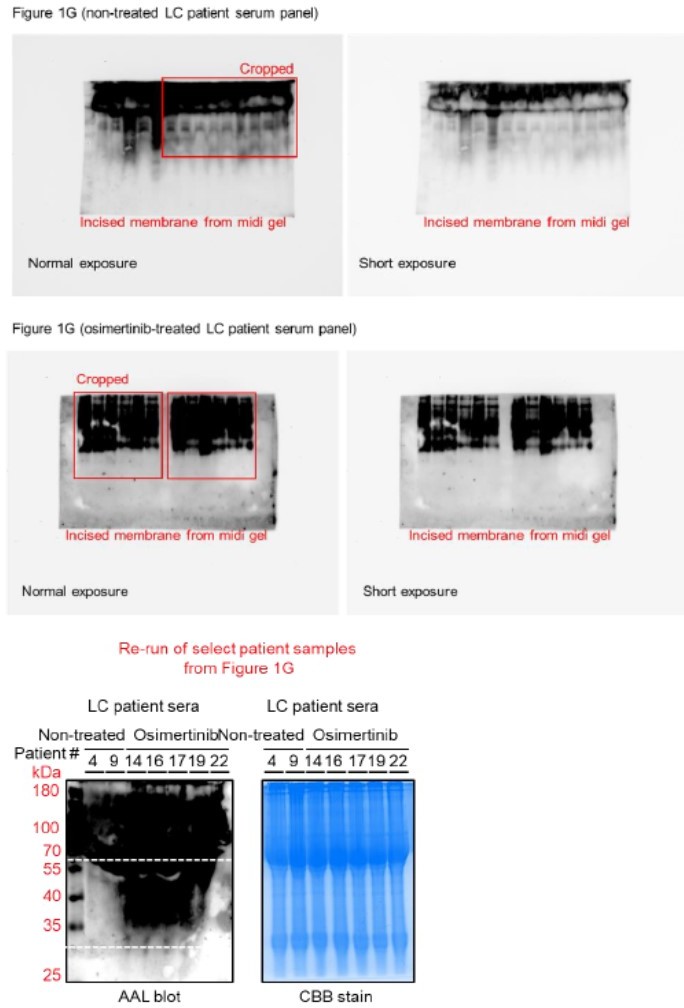
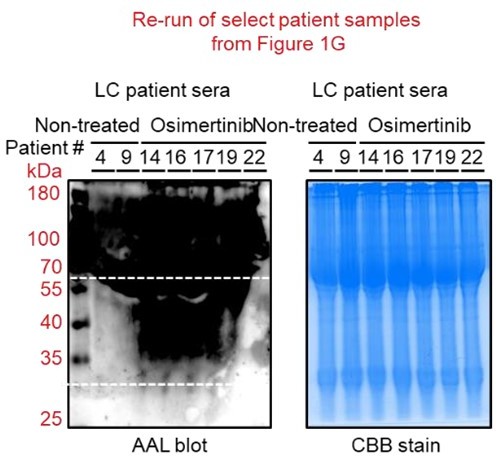
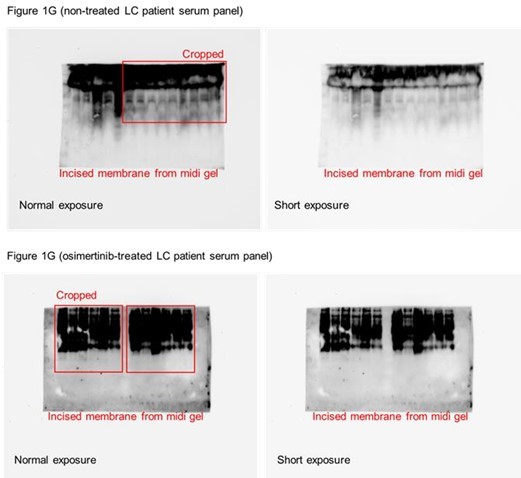
(A) Dot plot visualization of correlation between indicated FUT gene expression and drug response per cancer type screened in GDSC and CCLE. Size of circle refers to mean log2 gene expression while color corresponds to Spearman’s rank coefficients. Per-sample estimates of area under the fitted dose-response curve were used as a metric of drug response per cell line. Only statistically significant correlations are shown (p<0.05). Beside is a relative mean proportion of mutational signatures of all FUT genes per cancer type queried in GDSC and CCLE. FUT mutations were classified as “GDP-Fuc binding site mutations” if any mutations (amino acid change) occurred near (±5 amino acid position) or at the annotated GDP-Fuc binding sites. Domain information was queried in UniProt. Spearman’s rank coefficients (correlation between FUT expression and drug response) were calculated in cell lines carrying these mutations as opposed to those that do not (‘others’). Note that FUT4 data is not available in the GDSC dataset. (B) Positive correlation between FUT8 gene expression and resistance to drugs grouped accordingly per target process in GDSC. Data from both GDSC and CCLE are summarized. Color represents Spearman’s rank coefficients per target process. Only statistically significant correlations are shown (p<0.01). Bars indicate the number of drugs per class while the size of the circle corresponds to relative Spearman’s rank coefficients per drug. Beside is a proportion of drug categories (GDSC classification) from all drugs with resistance profiles positively correlated with FUT8 expression. (C) Dot plot visualization of differential (TCGA primary tumor versus paired normal) CCS and overlapped glycosylation gene set expressions (including O-/N-linked glycosylation) per cancer type. Size of circle refers to adjusted -log10 p-value while color corresponds to log2 fold change in expression. Statistically significant (p<0.05) Spearman’s correlation between drug sensitivity and CCS or glycosylation expression derived from GDSC are shown as a heatmap. In total, 169 drug profiles were queried; 33 are targeted, and 10 are cytotoxic drugs. (D) Dot plot visualization of mean promoter methylation fraction 1 kb upstream of the TSS of indicated FUT genes per cancer type from CCLE RRBS dataset. Size of circle refers to the number of screened cell lines while color corresponds to FUT promoter methylation. Only statistically significant changes are shown (p<0.05). Correlation between drug sensitivity and methylation is shown as heatmap as in C. (E) Schematic of secretome N-glycoprotein core fucosylation in the context of cancer TIS. (F) Preparation of patient- and cell culture-derived samples for capture and enrichment of fucosylated proteins and downstream fucosylation assays. (G) AAL blot analysis of total fucosylation in indicated crude patient sera prepared as in F. Representative of two independent experiments. Samples were originally performed in a single midi-SDS-PAGE format and blots were incised per sample group prior to incubations (samples #1–10, #11–16, and #17–22). Re-run of select samples in a single SDS-PAGE format, equal loading controls, and AAL specificity are presented in Figure 1—figure supplement 4. (H and I) AAL blot analysis of total fucosylation in indicated secretomes from sensitive cells (H) following treatment with or without indicated drugs for 48 hr or DR clones (I). Samples were prepared as in F. Representative of two independent experiments. Blot incisions per cell line or pair are shown. Equal loading controls and AAL specificity are presented in Figure 1—figure supplement 4. (J) Dot plot visualization of fucosylation characterization by sandwich ELLA in indicated secretomes from sensitive cells or DR clones prepared as in F following treatment with or without indicated drugs for 48 hr. Color indicates fold change values relative to DMSO or parental (means ± SD of three biological replicates) while size indicates p values; Student’s t-test. NS, not significant. Schematic of in-house developed sandwich ELLA and representative colorimetric output are displayed on the left panel. (K) Fucosylation characterization by sandwich ELLA in indicated crude patient sera (top) or tissues (bottom) prepared as in F. Each point indicates mean absorbance at 450 nm from two to three replicates. Representative of two independent experiments. ROC curves are shown. For statistical analysis, the nonparametric Kruskal-Wallis test was used. (L) Representative confocal images of indicated sensitive cells or DR clones stained for: core fucosylation (fluorescein-conjugated AAL; yellow) and nuclei (DAPI; blue) or golgi (RCAS1; green), core fucosylation(fluorescein-conjugated AAL; red), and nuclei (DAPI; blue).Cells were treated with and without 1 μM gefitinib or 0.1 μM vemurafenib for 48 h. The co-localization histogram plot of the indicated line is shown. Representative of two independent experiments. (M) Fucosylation characterization by sandwich ELLA in indicated golgi-fractionated cell lysates from sensitive cells or DR clones prepared as in schematic following treatment with or without gefitinib (for H1993) or vemurafenib (for A375) IC50 for 48 hr and filtered according to their indicated nominal molecular weight limit (NMWL). Values are relative to untreated parental (means ± SD of two biological replicates). For statistical analysis, a Student’s t-test was used.
-
Figure 1—source data 1
Uncropped blots (labeled and unlabeled) for Figure 1G, H and M.
- https://cdn.elifesciences.org/articles/75191/elife-75191-fig1-data1-v2.zip
-
Figure 1—source data 2
Uncropped blots and gels (labeled and unlabeled) for Figure 1—figure supplement 4A,B and C.
- https://cdn.elifesciences.org/articles/75191/elife-75191-fig1-data2-v2.zip
-
Figure 1—source data 3
Uncropped blots (labeled and unlabeled) for Figure 1—figure supplement 11C.
- https://cdn.elifesciences.org/articles/75191/elife-75191-fig1-data3-v2.zip
Figure 1—figure supplement 1
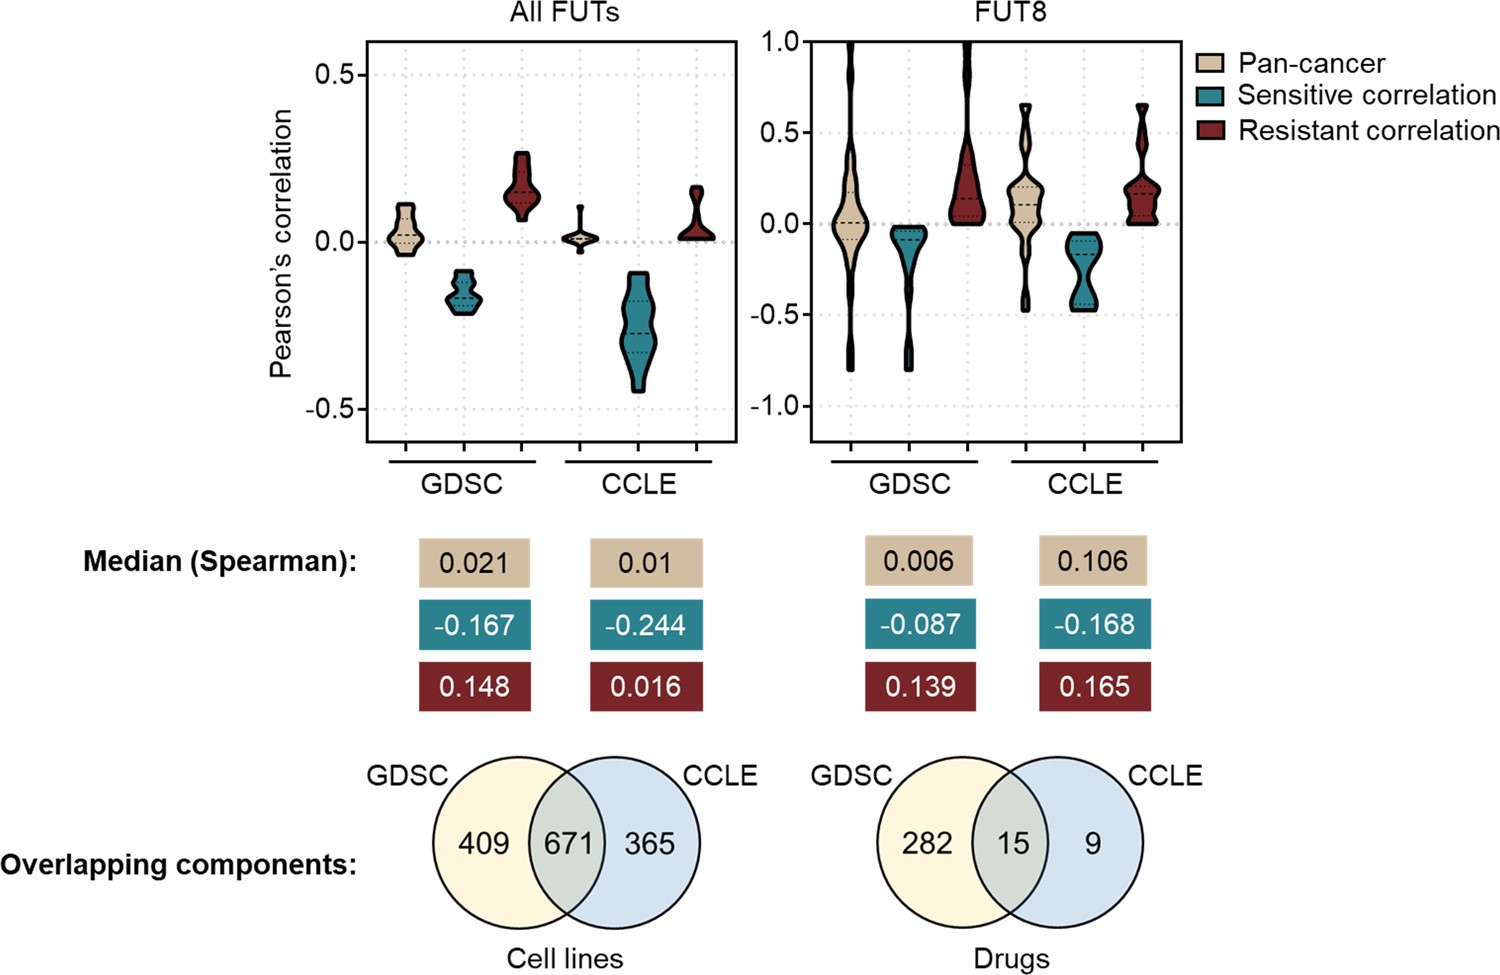
Comparison of correlations between FUT expression profiles and drug sensitivity and other shared components in GDSC and CCLE datasets.
Top panel shows Pearson’s correlation distributions and median values for comparable associations between FUT gene expression and drug sensitivity. Bottom panel shows cell line and drug overlaps between data sources.
Figure 1—figure supplement 2
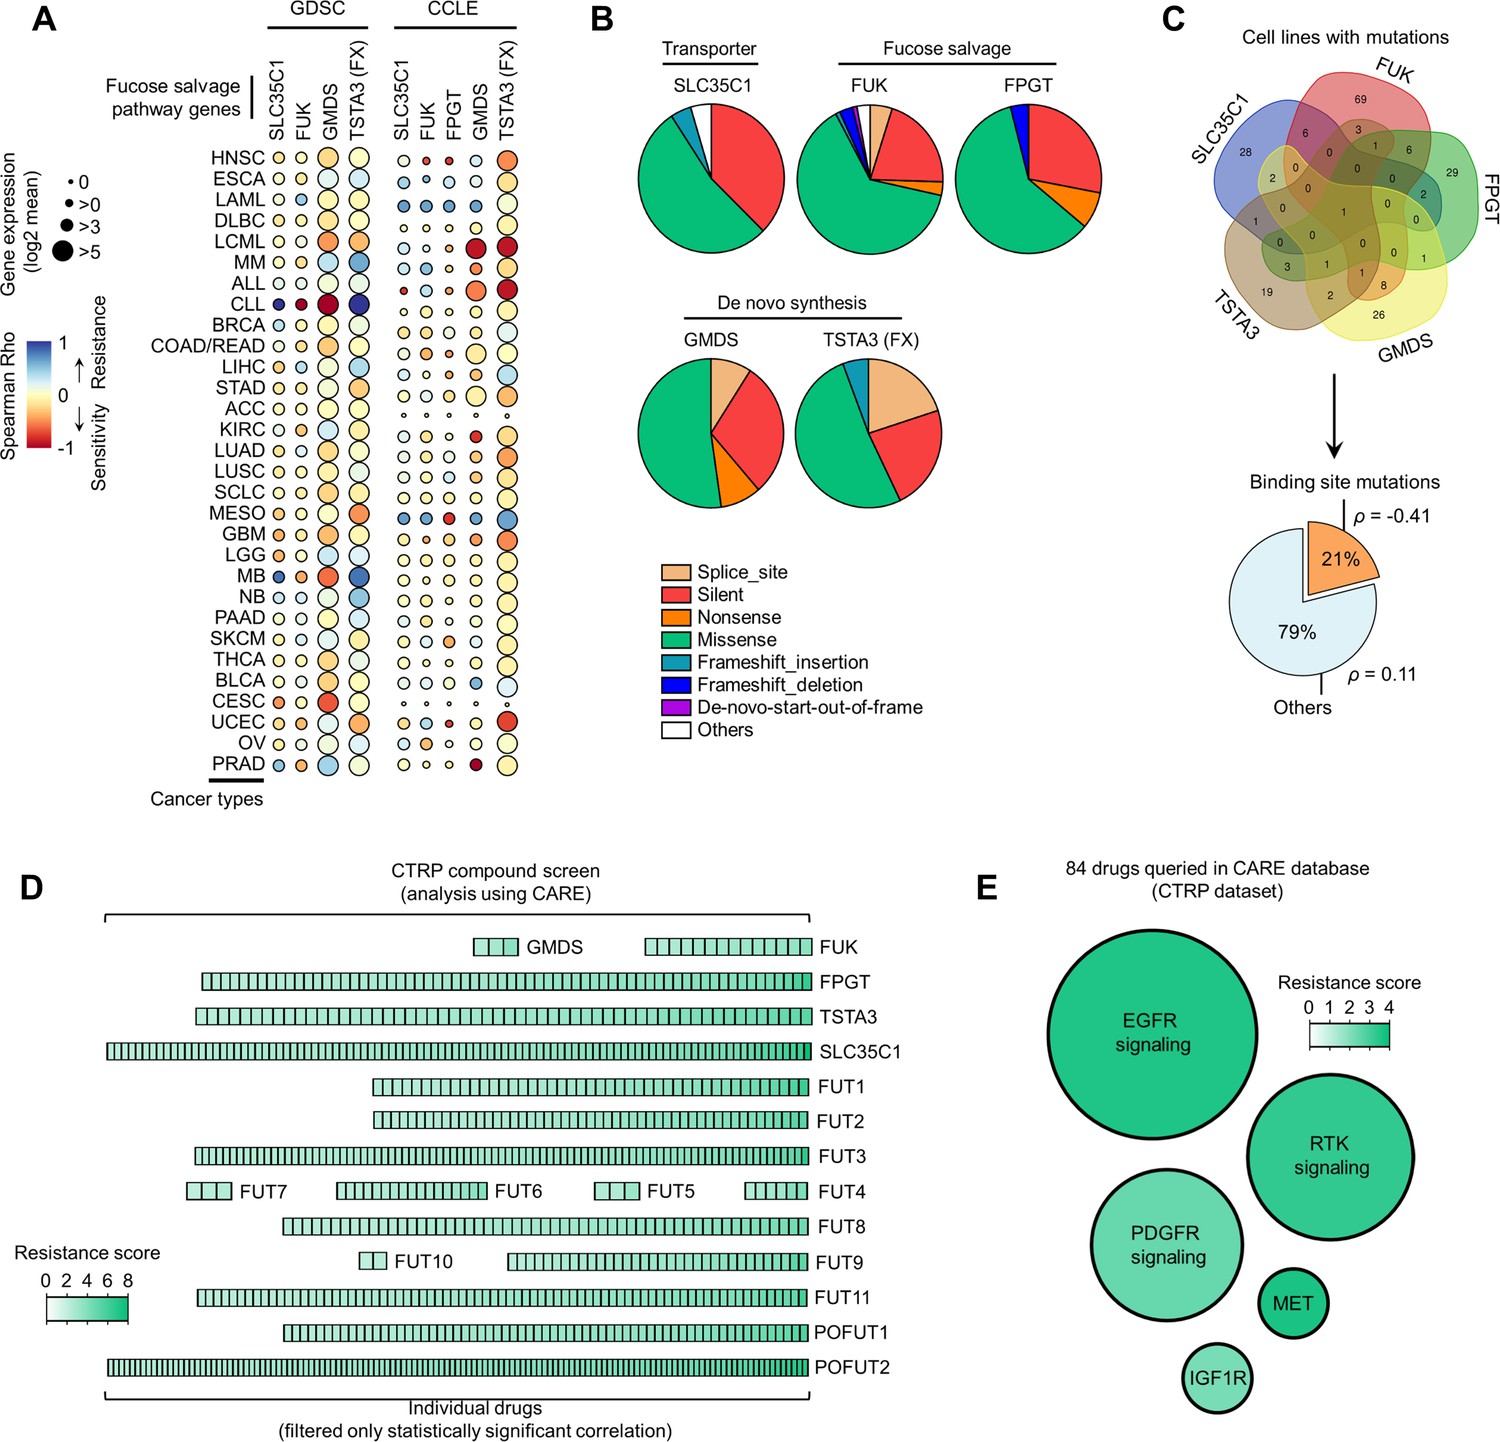
Correlation between fucose salvage and de novo synthesis gene expression and drug sensitivity.
(A) Dot plot visualization of correlation between indicated fucosylation gene expression and drug response per cancer type screened in GDSC and CCLE. Size of circle refers to mean log2 gene expression while color corresponds to Spearman’s rank coefficients. Per-sample estimates of area under the fitted dose-response curve were used as a metric of drug response per cell line. Only statistically significant correlations are shown (p<0.05). (B) Relative mean proportion of mutational signatures of indicated fucosylation genes per cancer type queried in CCLE. (C) Mutations were classified as ‘binding site mutations’ if any mutations (amino acid change) occurred near (±5 amino acid position) or at the annotated binding sites, which include, but are not limited to, FUT-binding sites. Domain information was queried in UniProt. Spearman’s rank coefficients (correlation between fucosylation gene expression and drug response) were calculated in cell lines carrying these mutations as opposed to those that do not (“others”). (D) Heatmap visualization of CARE scores showing correlation between indicated fucosylation gene expression and drug response for an individual targeted therapy in all cancer types screened in CTRP. Only statistically significant correlations are shown (p<0.05). (E) Heat-scatterplot visualization of mean CARE scores of fucosylation genes as in D and drugs categorized according to their target signaling in all cancer types screened in CTRP. Only statistically significant correlations are shown (p<0.05).
Figure 1—figure supplement 3
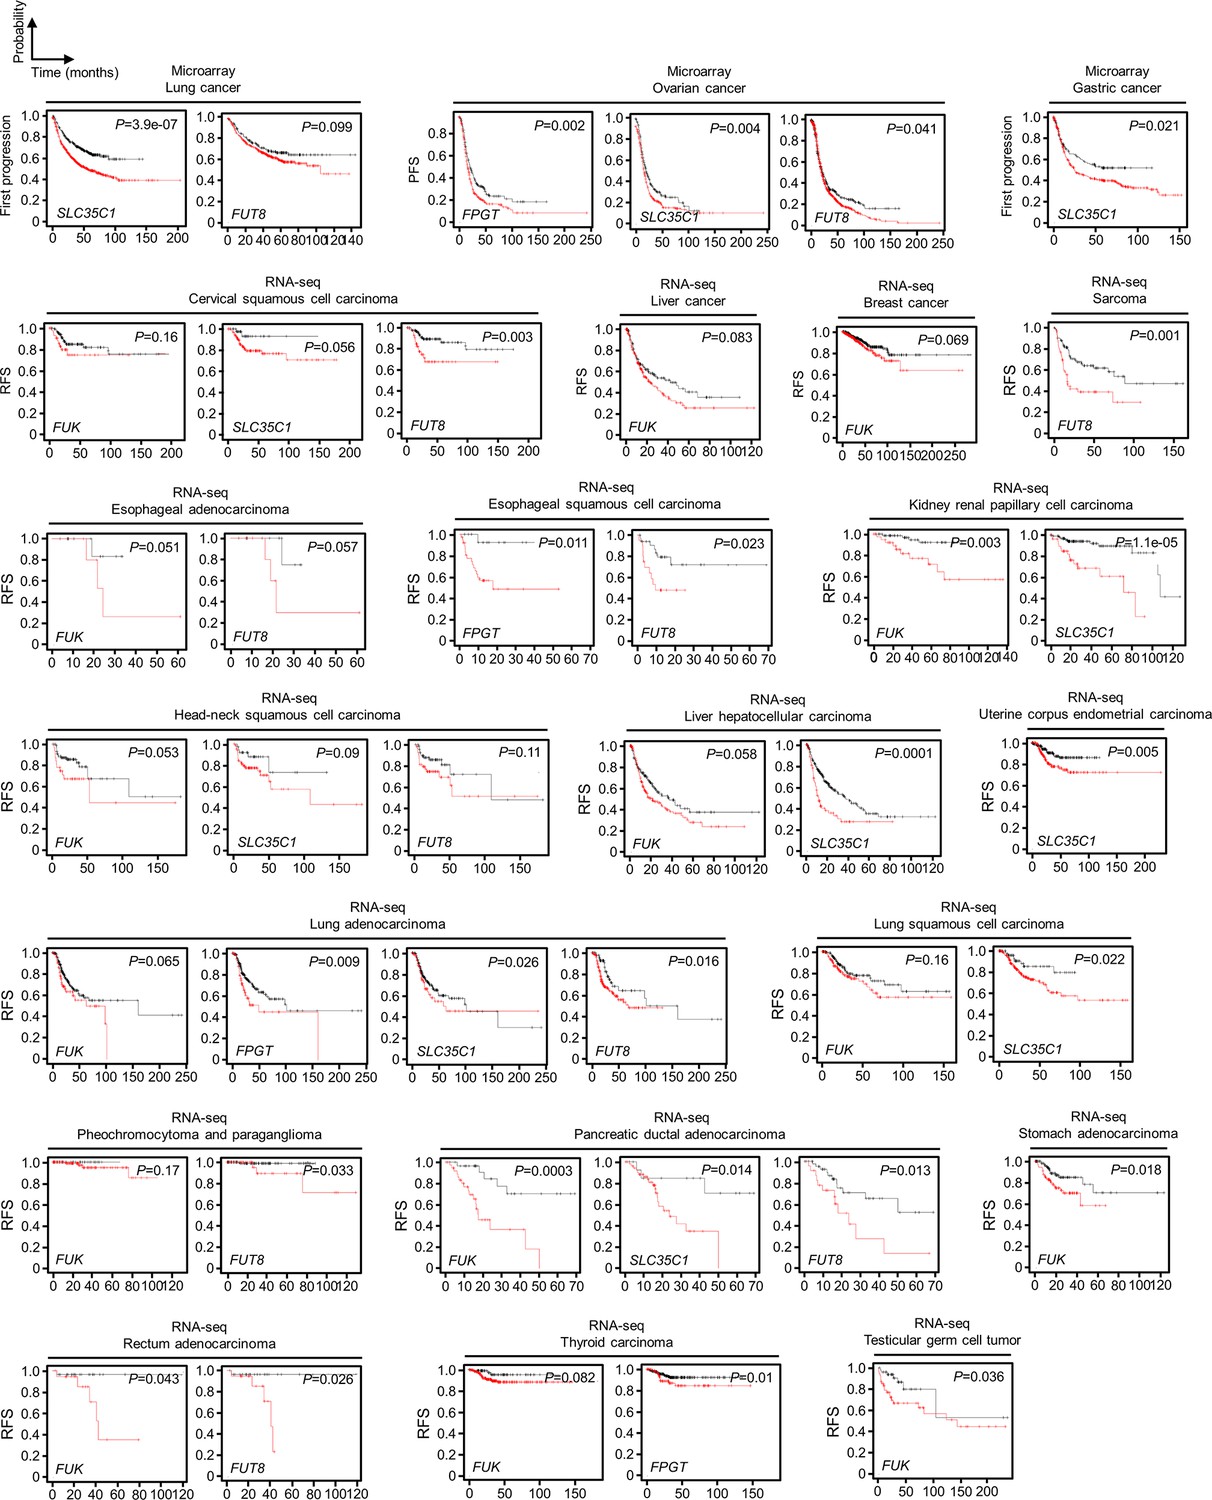
Fucose salvage gene expression is associated with cancer patient relapse and poor survival during/after therapy.
Kaplan-Meier plots of first progression survival and RFS of patients diagnosed with indicated cancer types, stratified by the expression of indicated fucosylation gene in their primary tumors.
p-Values were calculated using a log rank test.
Figure 1—figure supplement 4
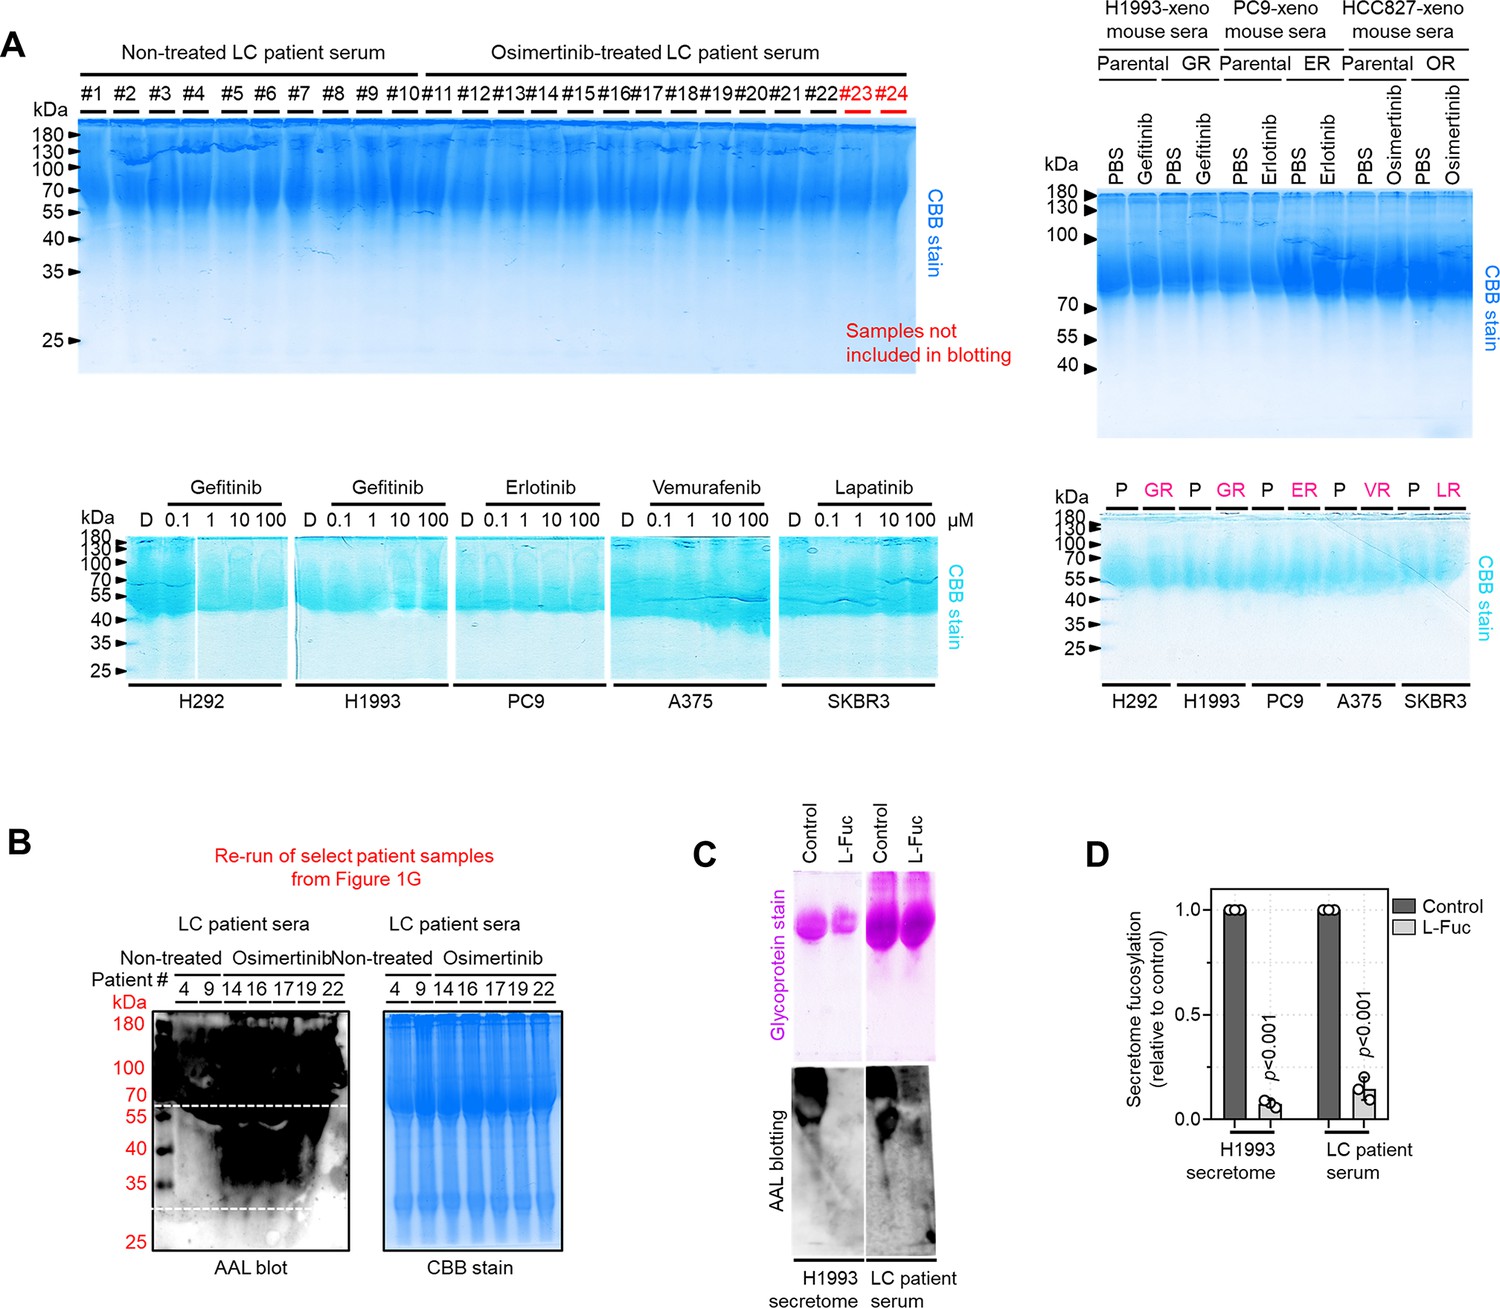
Equal loading controls and AAL specificity.
(A) Representative Coomassie stained SDS-PAGE gels showing fucosylated secretome proteins from indicated sensitive cells or DR clones prepared as in Figure 1G–I and Figure 1—figure supplement 11C following treatment with or without indicated drugs for 48 hr. (B) Representative re-run of AAL blot analysis and Coomassie stained SDS-PAGE gels from select patient serum samples as in Figure 1G. (C and D) Characterization of AAL specificity by glycoprotein staining, AAL blot analysis, and sandwich ELLA. Cell secretomes and patient sera were prepared as in Figure 1F, except a competitive sugar (0.1 M L-Fuc) was added onto 15 μg N-glycoprotein samples prior to loading. Gels and blots are representative of two independent experiments. Values in sandwich ELLA are relative to control (means ± SD of two biological replicates). For statistical analysis, two-tailed Mann–Whitney U test was used.
Figure 1—figure supplement 5
Therapy resistance-associated N-glycan enrichment in >30 kDa proteins.
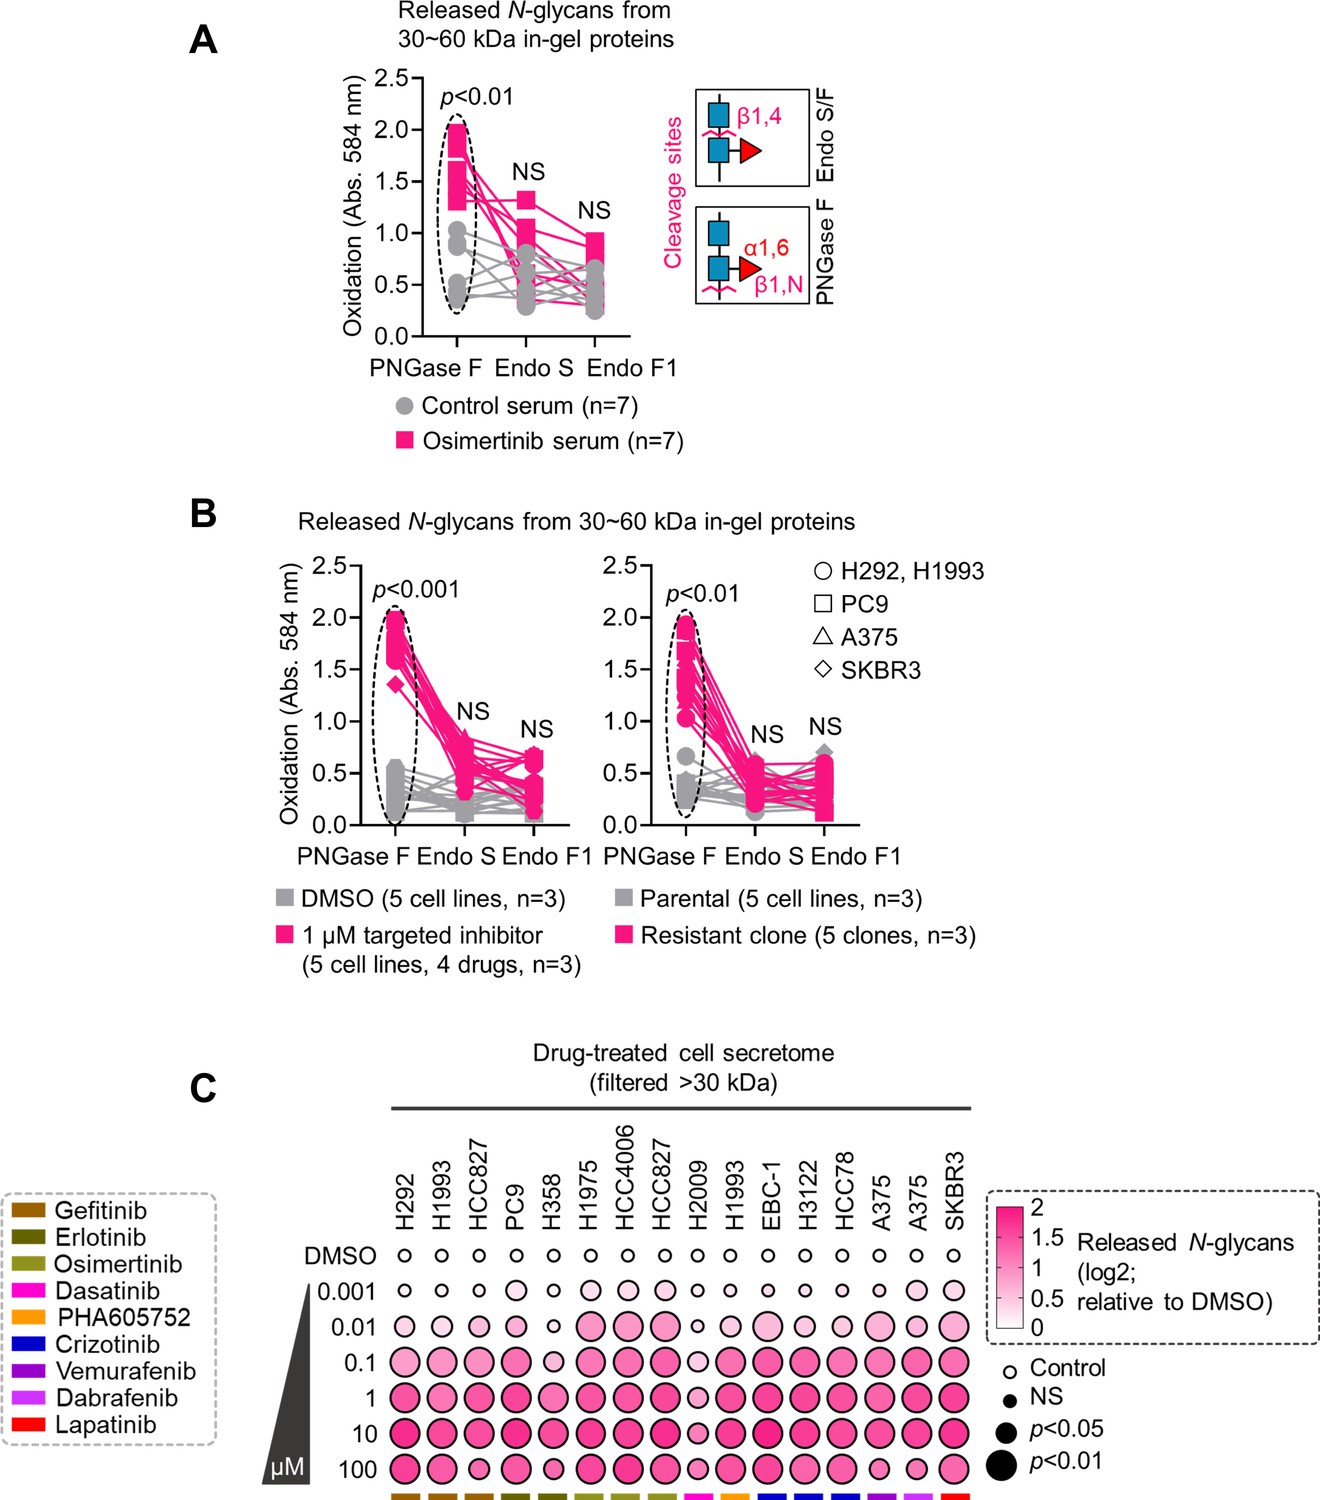
(A) N-glycan release assay using indicated N-glycan-cleaving enzymes in crude patient sera prepared as in Figure 1F. Prior to this assay, samples were separated by SDS-PAGE followed by Coomassie staining. 30~60 kDa in-gel proteins were then excised, followed by exogenous de-N-glycosylation (total 8 U PNGase F or total 10 U Endo S/F). The glycan cleavage site is shown for each enzyme. Values indicate the mean absorbance at 584 nm from three replicates. Representative of two independent experiments. Sample size n, unique patient samples. For statistical analysis, a two-tailed Mann–Whitney U test was used. NS, not significant. (B) N-glycan release assay using indicated N-glycan-cleaving enzymes in indicated secretomes from sensitive cells or DR clones prepared as in Figure 1F following treatment with or without indicated drugs for 48 h. 30~60 kDa in-gel proteins were then excised, followed by exogenous de-N-glycosylation (total 8 U PNGase F or total 10 U Endo S/F). Values indicate the mean absorbance at 584 nm from three replicates. Representative of two independent experiments. For statistical analysis, a two-tailed Mann–Whitney U test was used. NS, not significant. (C) Dot plot visualization of N-glycan characterization by N-glycan release assay using PNGase F in indicated secretomes from sensitive cells following treatment with or without indicated drugs for 48 hr. Color indicates log-transformed fold change mean absorbance values at 584 nm relative to DMSO (means ± SD of three biological replicates) while size indicates p values; Student’s t-test. NS, not significant. Cell secretomes were prepared as in Figure 1F; except filtered with a>30 kDa nominal molecular weight limit (NMWL).
Figure 1—figure supplement 6
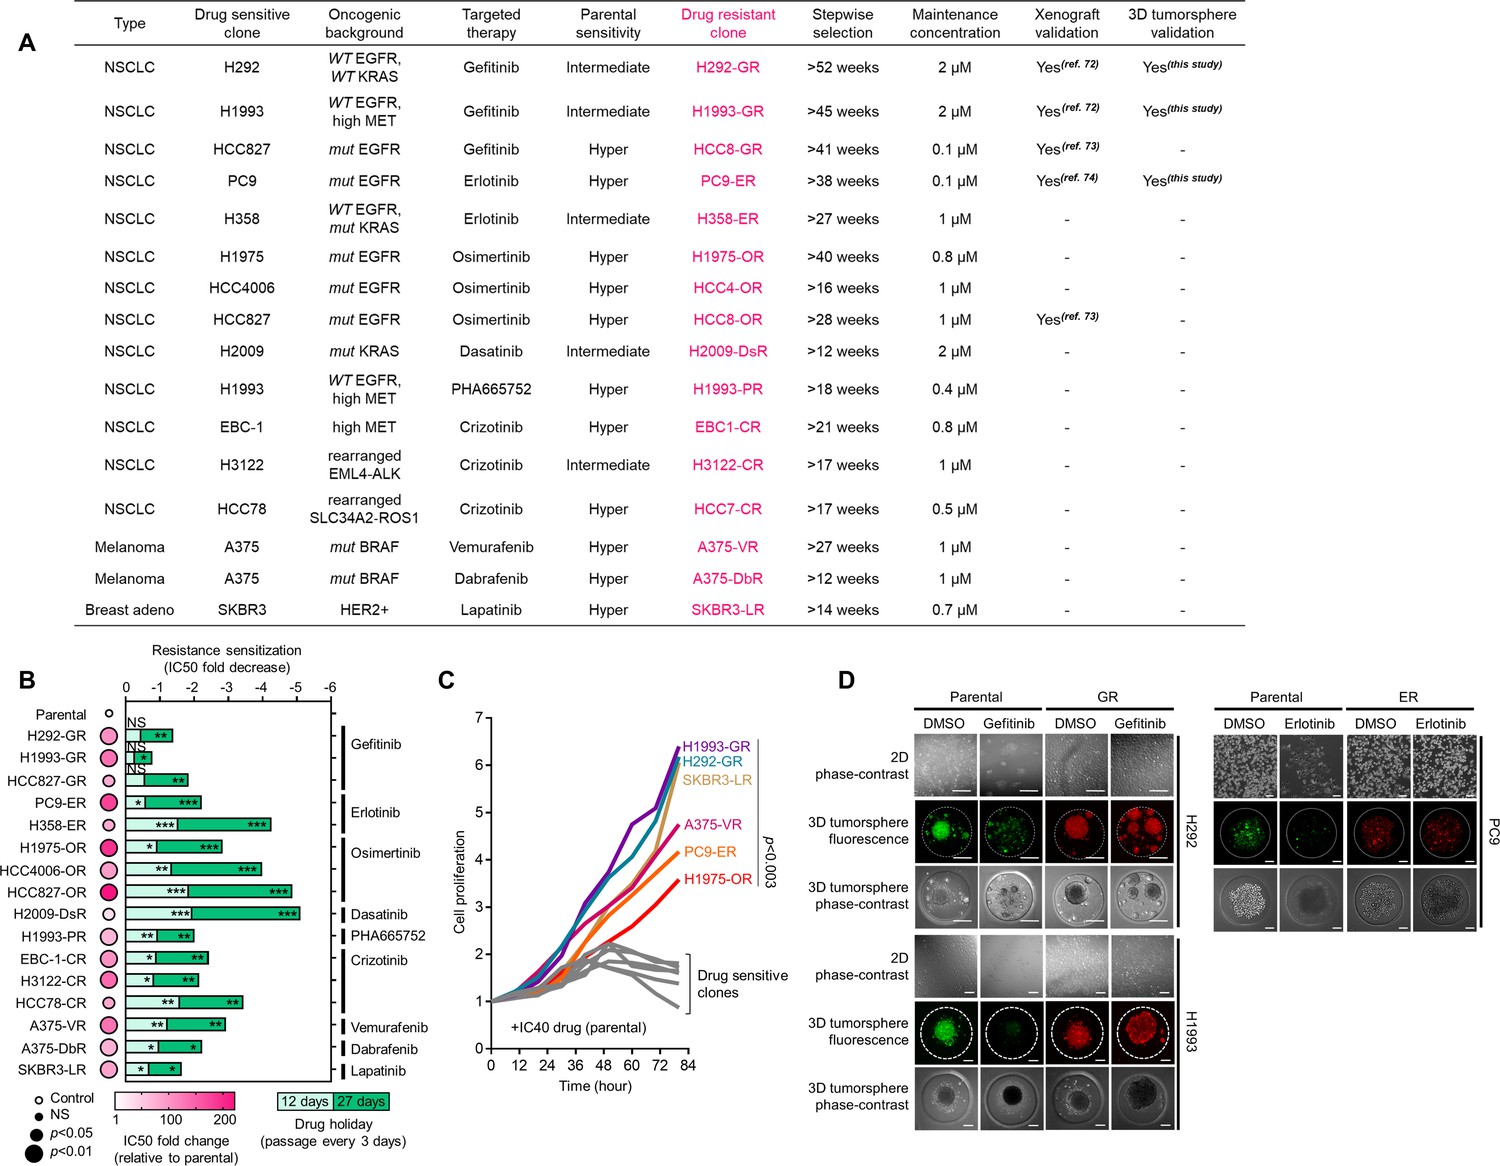
Characterization of DR clones.
(A) Summary of drug resistance selection in a panel of human cancer cell lines. (B) Characterization of resistance in DR clones. Color in the dot plot indicates IC50 fold change values relative to parental control (means ± SD of three biological replicates) while size indicates size indicates p values; Student’s t-test. NS, not significant. Stability of resistance was also assayed using 12- and 27-day drug holidays. Cells were treated with or without drugs for 72 hr with a concentration dilution series and were assayed by SRB. Representative of three independent experiments. *p<0.05, **p<0.01, ***p<0.001, Student’s t-test. NS, not significant. (C) Proliferation of indicated sensitive cells or DR clones upon treatment with IC40 concentrations of indicated drugs (assessed in parental cells) for indicated times and were assayed by SRB. Values are relative to time point 0. Representative of two independent experiments. For statistical analysis, Student’s t-test was used. (D) Morphological evaluation of parental cells and GR clones in 2D and 3D cultures. For 3D spheroids, cells were transfected with CellTracker-Green for sensitive or CellTracker-Red for resistant. Cultures were treated with or without 2 µM gefitinib or 0.1 µM erlotinib for 72 hr. Representative of two independent experiments.
Figure 1—figure supplement 7
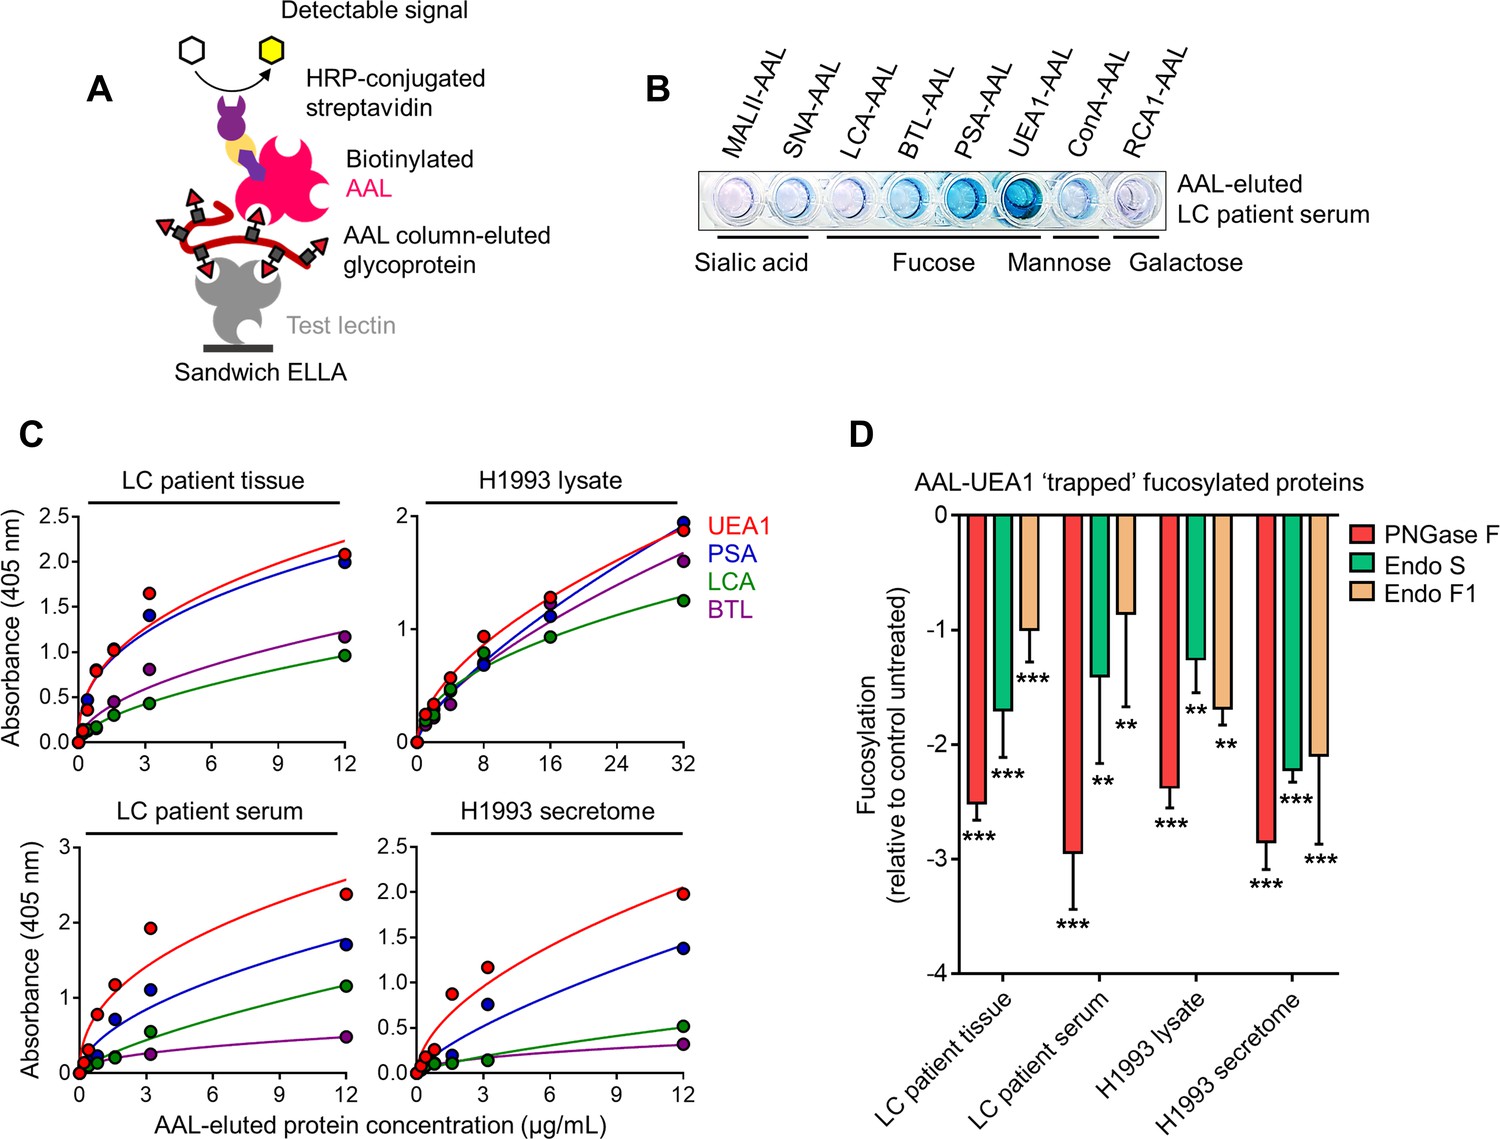
Sandwich ELLA.
(A) Schematic of in-house developed sandwich ELLA. (B) Representative detection of indicated captured glycoproteins from AAL-eluted LC patient serum (2 µg/mL per well) in a plate coated with indicated unconjugated test lectins. (C) Characterization of fucosylation by sandwich ELLA in indicated AAL-eluted cell or tissue lysates, cell secretomes or patient sera. Values indicate mean absorbance at 405 nm from three replicates. Representative of two independent experiments. (D) Characterization of fucosylation by sandwich ELLA in indicated AAL-eluted samples as in C upon exogenous de-N-glycosylation by (total 8 U PNGase F or total 10 U Endo S/F). Values are relative to untreated control (means ± SD of three biological replicates). **p<0.01, ***p<0.001, Student’s t-test.
Figure 1—figure supplement 8
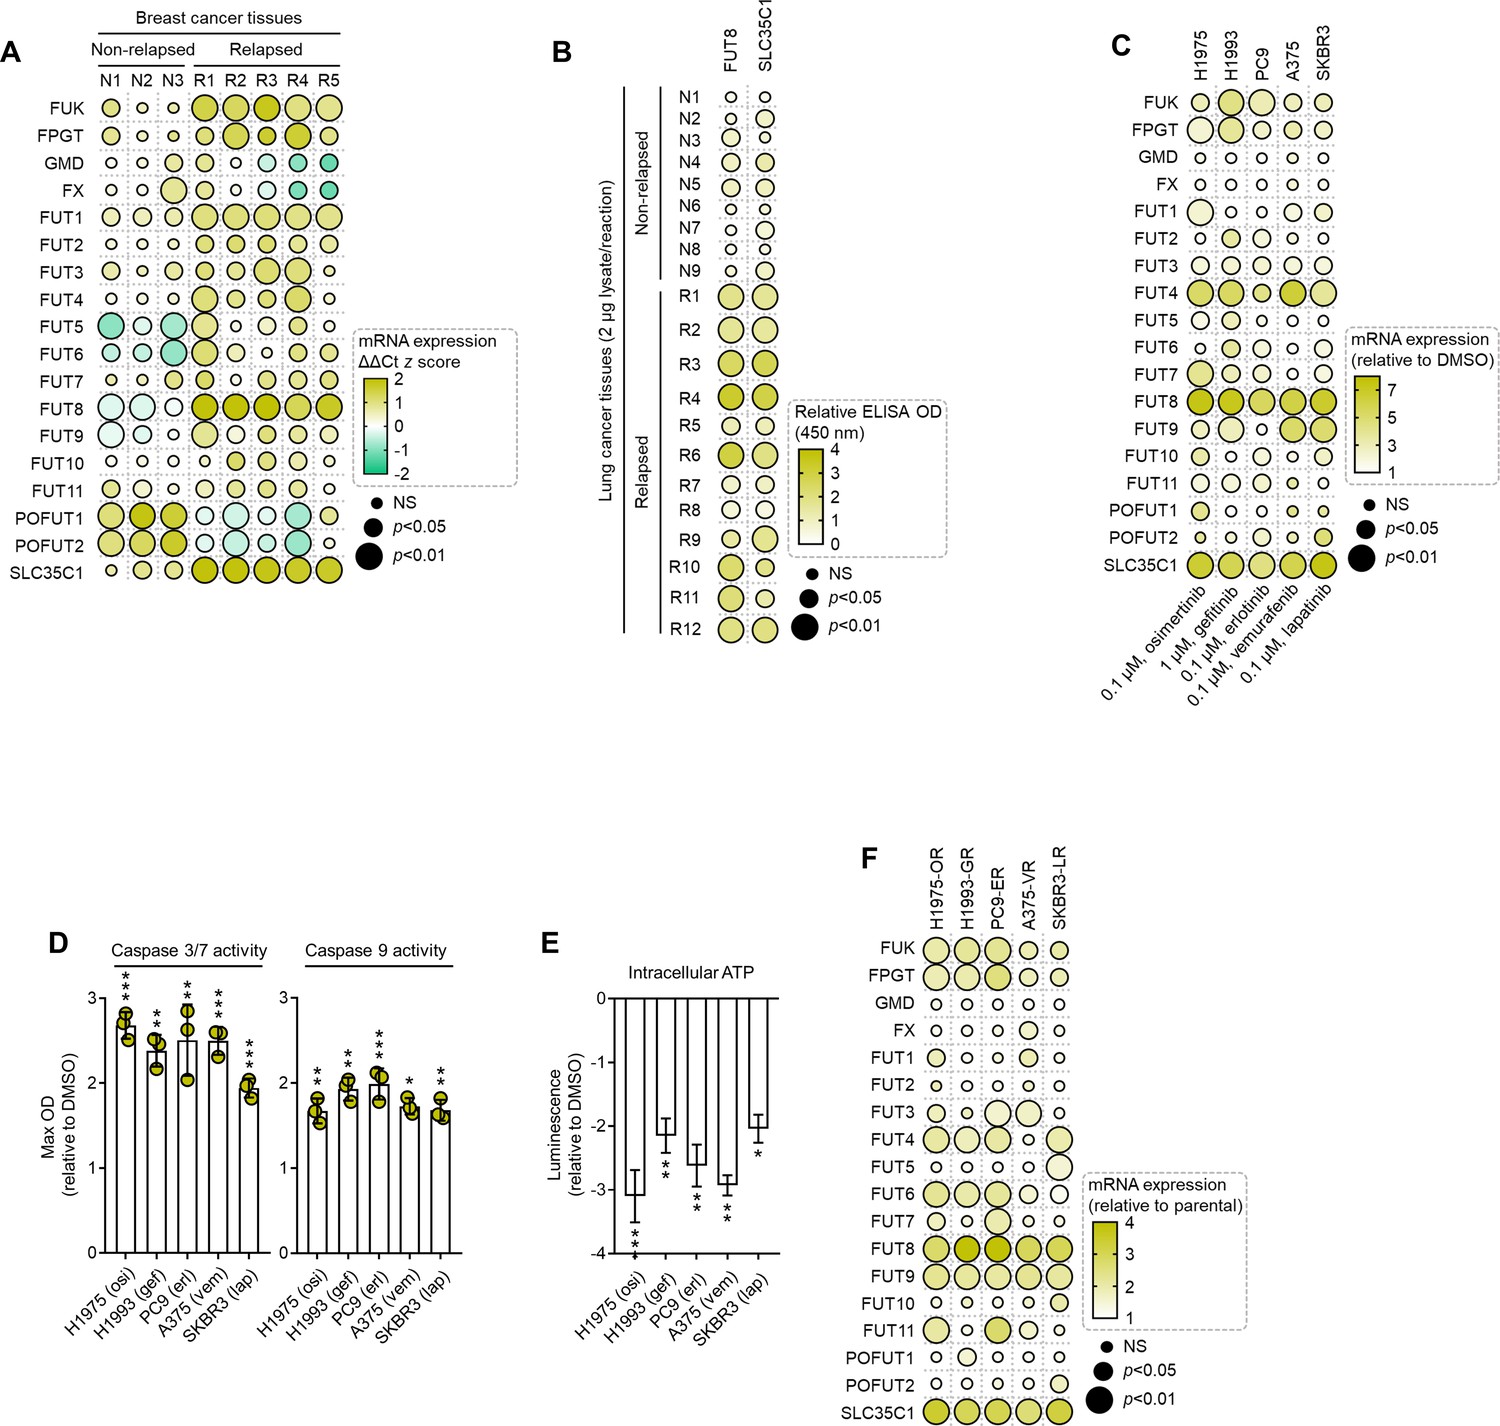
Expression and activity of fucose salvage genes and fucosyltransferases are associated with cancer patient relapse, therapy-induced apoptosis, and multiple acquired targeted therapy resistance.
(A) Dot plot visualization of indicated gene expression by qPCR analysis in indicated FFPE tumor tissue sections from patients with breast cancer who underwent sequential multidrug therapy. Color indicates log-transformed fold change values relative to the non-relapsed sample with lowest expression for the indicated gene (not displayed in the heatmap) and normalized to GAPDH levels (means ± SD of three biological replicates) while size indicates p values; Student’s t-test. NS, not significant. (B) Dot plot visualization of indicated FUT8 and SLC35C1 protein detection by ELISA analysis of indicated tumor tissues from patients with lung cancer who underwent first-line therapy. Color indicates log-transformed fold change mean absorbance values at 450 nm (three biological replicates) relative to the non-relapsed sample with lowest expression for the indicated gene (not displayed in the heatmap) while size indicates p values; Student’s t-test. NS, not significant. (C) Dot plot visualization of indicated gene expression by qPCR analysis in cells treated with or without indicated drug concentrations for 72 hr. Color indicates log-transformed fold change values relative to relative to DMSO and normalized to GAPDH levels (means ± SD of three biological replicates) while size indicates p values; Student’s t-test. NS, not significant. (D) Caspase 3/7 DEVDase and caspase 9 activities of indicated cells and treatment conditions as in D. Values are relative to DMSO (means ± SD of two biological replicates). *p<0.05, **p<0.01, ***p<0.001, Student’s t-test. (E) Intracellular ATP activity of indicated cells and treatment conditions as in D. Values are relative to DMSO (means ± SD of two biological replicates). *p<0.05, **p<0.01, ***p<0.001, Student’s t-test. (F) Dot plot visualization of indicated gene expression by qPCR analysis in indicated DR clones. Color indicates log-transformed fold change values relative parental control and normalized to GAPDH levels (means ± SD of three biological replicates) while size indicates p values; Student’s t-test. NS, not significant.
Figure 1—figure supplement 9
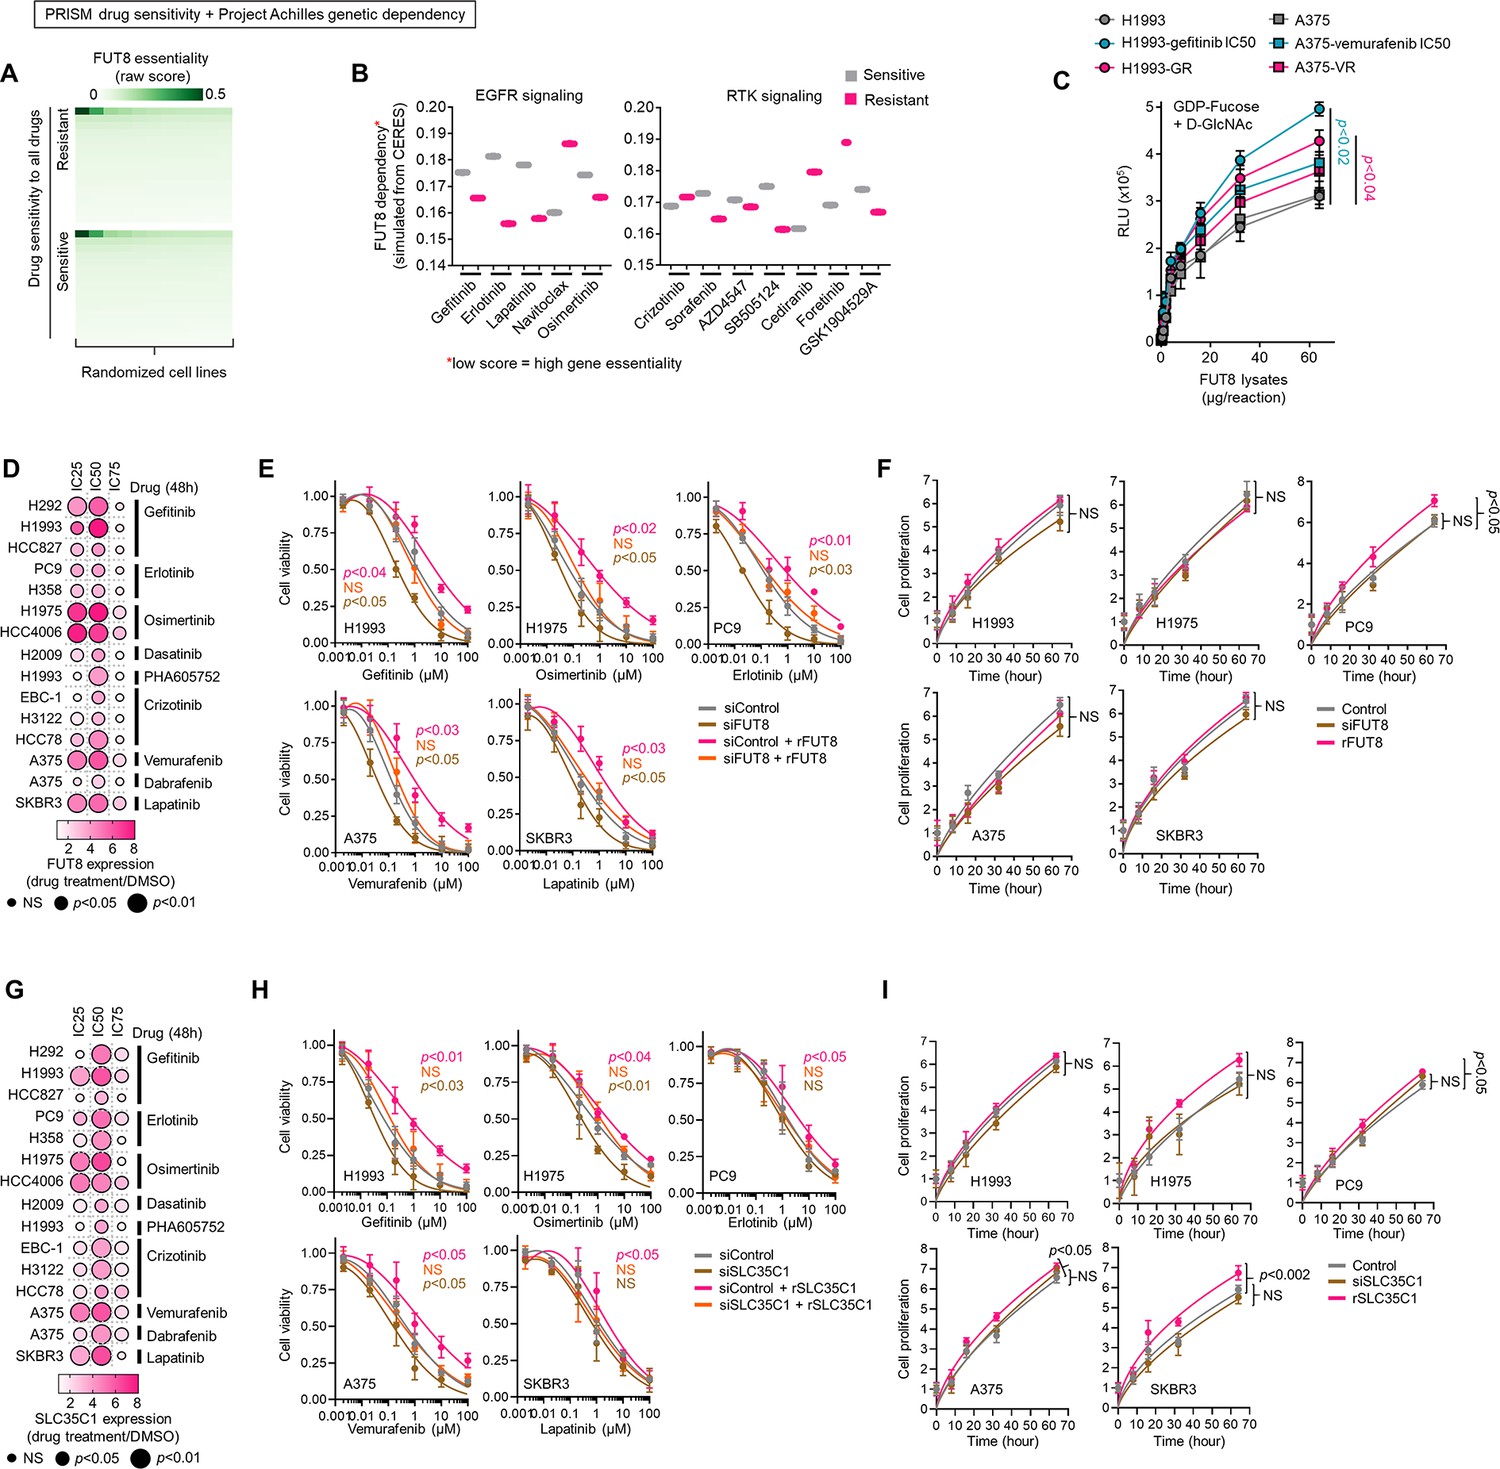
FUT8 and SLC35C1 confer resistance to kinase inhibitors in sensitive cancer cells.
(A) Heatmap visualization of raw essentiality scores of FUT8 in all cell lines screened in both PRISM and Achilles projects. Drug sensitivity of cell lines were binarized and grouped as shown. (B) Mean dependency scores of FUT8 in cell lines indicated as either sensitive or resistant to indicated drugs. (C) GDP-Fuc activity analysis of FUT8 in FUT8 immunoprecipitates from indicated DMSO or drug-treated cell lysates or DR clone lysates. Values indicate luminescence units and are relative to control reaction (means ± SD of three biological replicates). Representative of two independent experiments. For statistical analysis, two-tailed Mann–Whitney U test was used. (D) Dot plot visualization of FUT8 gene expression by qPCR analysis in indicated cells treated with or without IC25, IC50, or IC75 of indicated drugs for 72 hr. Color indicates log-transformed fold change values relative to DMSO and normalized to GAPDH levels (means ± SD of three biological replicates) while size indicates p values; Student’s t-test. NS, not significant. (E) Cell viability of indicated cells upon FUT8 RNAi subsequently transfected with or without FUT8 cDNA for 48 hr. Cells were treated with indicated drug concentrations for 48 hr. Values are relative to DMSO (means ± SD of three biological replicates). Representative of two independent experiments. For statistical analysis, Student’s t-test was used. NS, not significant. (F) Proliferation of indicated cells upon FUT8 RNAi or FUT8 cDNA transfection as in E. Values are relative to time point 0 (means ± SD of three biological replicates). Representative of two independent experiments. For statistical analysis, Student’s t-test was used. NS, not significant. (G) Dot plot visualization of SLC35C1 gene expression by qPCR analysis in indicated cells treated with or without IC25, IC50, or IC75 of indicated drugs for 72 hr. Color indicates log-transformed fold change values relative to DMSO and normalized to GAPDH levels (means ± SD of three biological replicates) while size indicates p values; Student’s t-test. NS, not significant. (H) Cell viability of indicated cells upon SLC35C1 RNAi subsequently transfected with or without SLC35C1 cDNA for 48 hr. Cells were treated with indicated drug concentrations for 48 hr. Values are relative to DMSO (means ± SD of three biological replicates). Representative of two independent experiments. For statistical analysis, Student’s t-test was used. NS, not significant. (I) Proliferation of indicated cells upon SLC35C1 RNAi or SLC35C1 cDNA transfection as in H. Values are relative to time point 0 (means ± SD of three biological replicates). Representative of two independent experiments. For statistical analysis, Student’s t-test was used. NS, not significant.
Figure 1—figure supplement 10
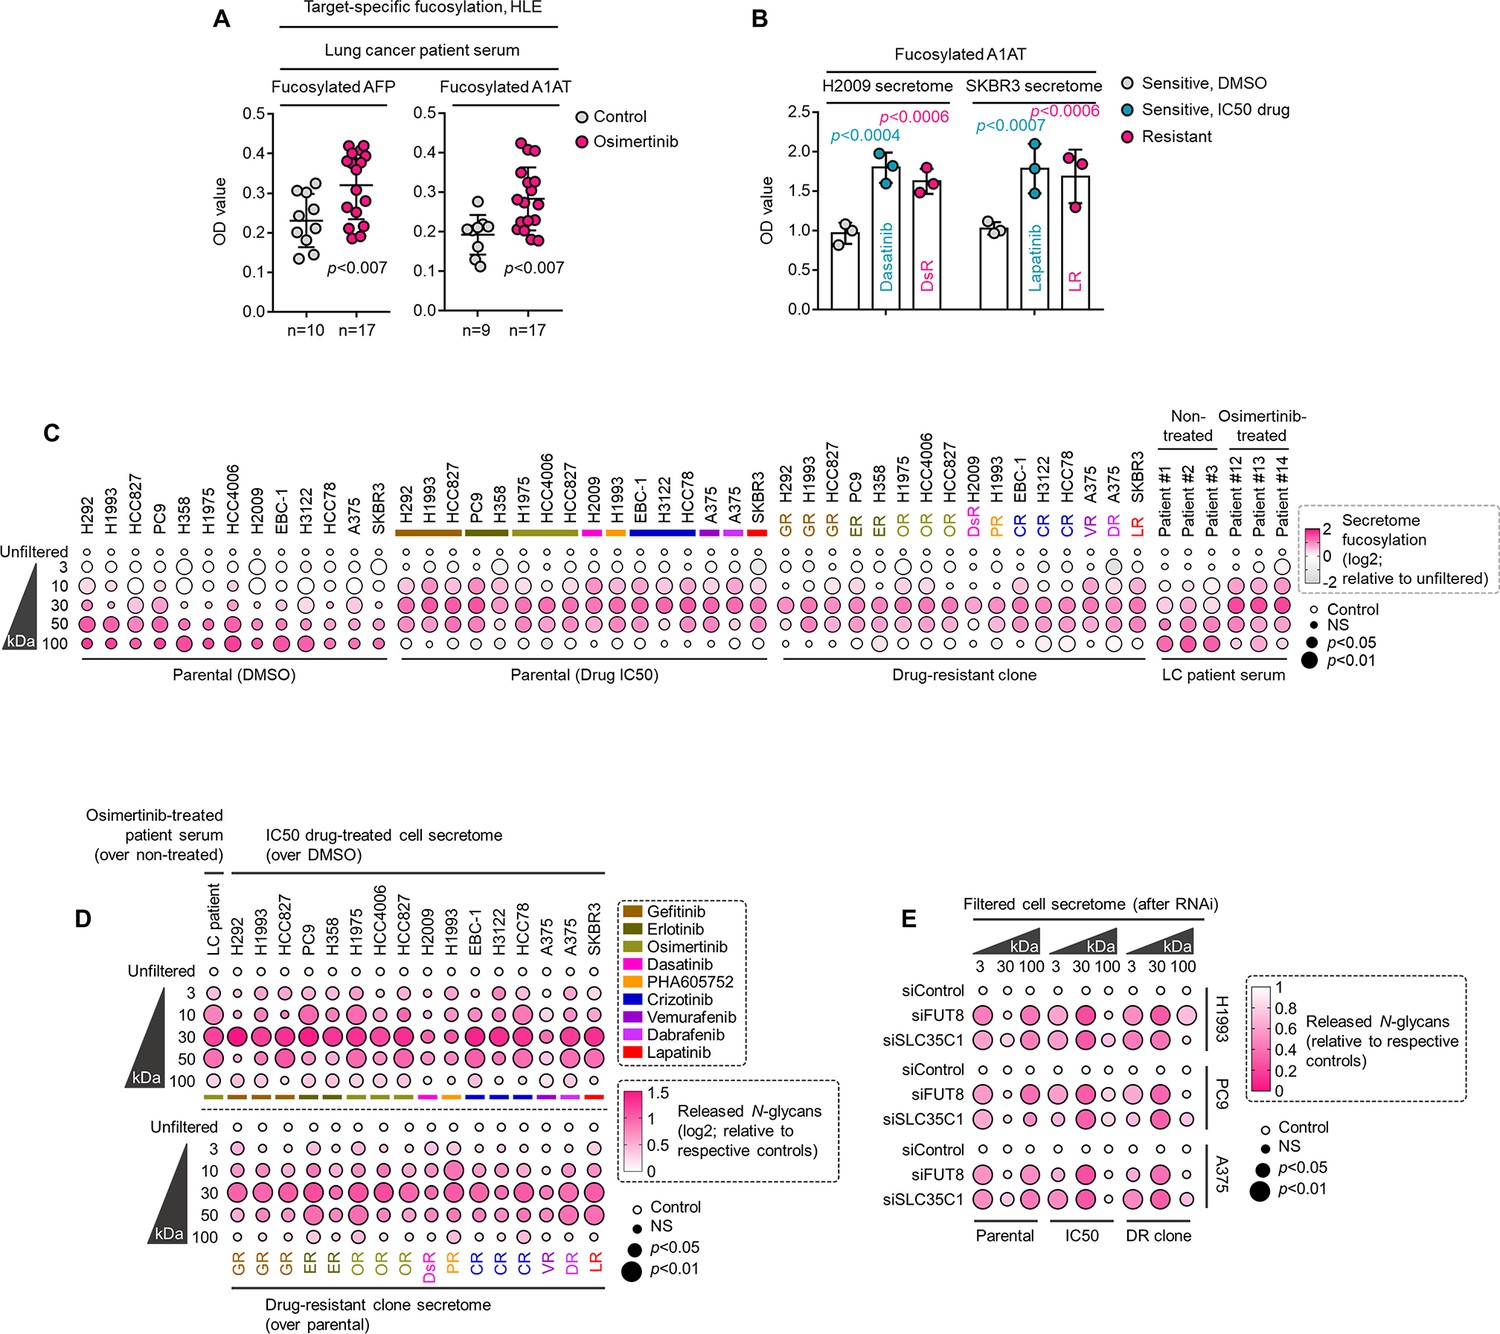
Therapy resistance-associated core fucosylation of proteins between 30 and 100 kDa is regulated by FUT8 or SLC35C1.
(A) HLE analysis of AFP or A1AT fucosylation in sera from patients with lung cancer treated with or without osimertinib. Values indicate mean absorbance at 450 nm from three replicates (for each sample). Representative of two independent experiments. For statistical analysis, two-tailed Mann–Whitney U test was used. (B) HLE analysis of A1AT fucosylation in indicated secretomes derived from sensitive cells treated with or without lapatinib or dasatinib IC50 or indicated DR clones. Values represent mean absorbance at 450 nm (means ± SD of three biological replicates). Representative of two independent experiments. For statistical analysis, two-tailed Mann–Whitney U test was used. (C) Dot plot visualization of fucosylation characterization by sandwich ELLA in indicated secretomes from sensitive cells or DR clones following treatment with or without respective drug IC50s for 48 hr; or sera from patients treated with or without osimertinib. Color indicates log-transformed fold change values relative to unfiltered secretome/sera (means ± SD of three biological replicates) while size indicates p values; Student’s t-test. NS, not significant. Cell secretomes and patient sera were prepared as in Figure 1F; except filtered according to their indicated NMWL. (D) Dot plot visualization of N-glycan characterization by N-glycan release assay using PNGase F in indicated secretomes from sensitive cells or DR clones following treatment with or without respective drug IC50s for 48 hr; or sera from patients treated with or without osimertinib. Color indicates log-transformed fold change mean absorbance values at 584 nm relative to relative to unfiltered secretome/sera (means ± SD of three biological replicates) while size indicates p values; Student’s t-test. NS, not significant. Cell secretomes and patient sera were prepared as in Figure 1F; except filtered according to their indicated NMWL. (E) Dot plot visualization of fucosylation characterization by sandwich ELLA in indicated secretomes from sensitive cells or DR clones upon FUT8 or SLC35C1 RNAi for 48 hr following treatment with or without drug IC50 (gefitinib for H1993, erlotinib for PC9, and vemurafenib for A375) for 48 hr. Color indicates fold change mean absorbance values at 584 nm relative to relative to respective siControls per RNAi (means ± SD of two biological replicates) while size indicates p values; Student’s t-test. NS, not significant. Note that this is a ‘down assay’ where a stronger color palette corresponds to lesser N-glycan release. Cell secretomes were prepared as in Figure 1F; except filtered according to their indicated NMWL.
Figure 1—figure supplement 11
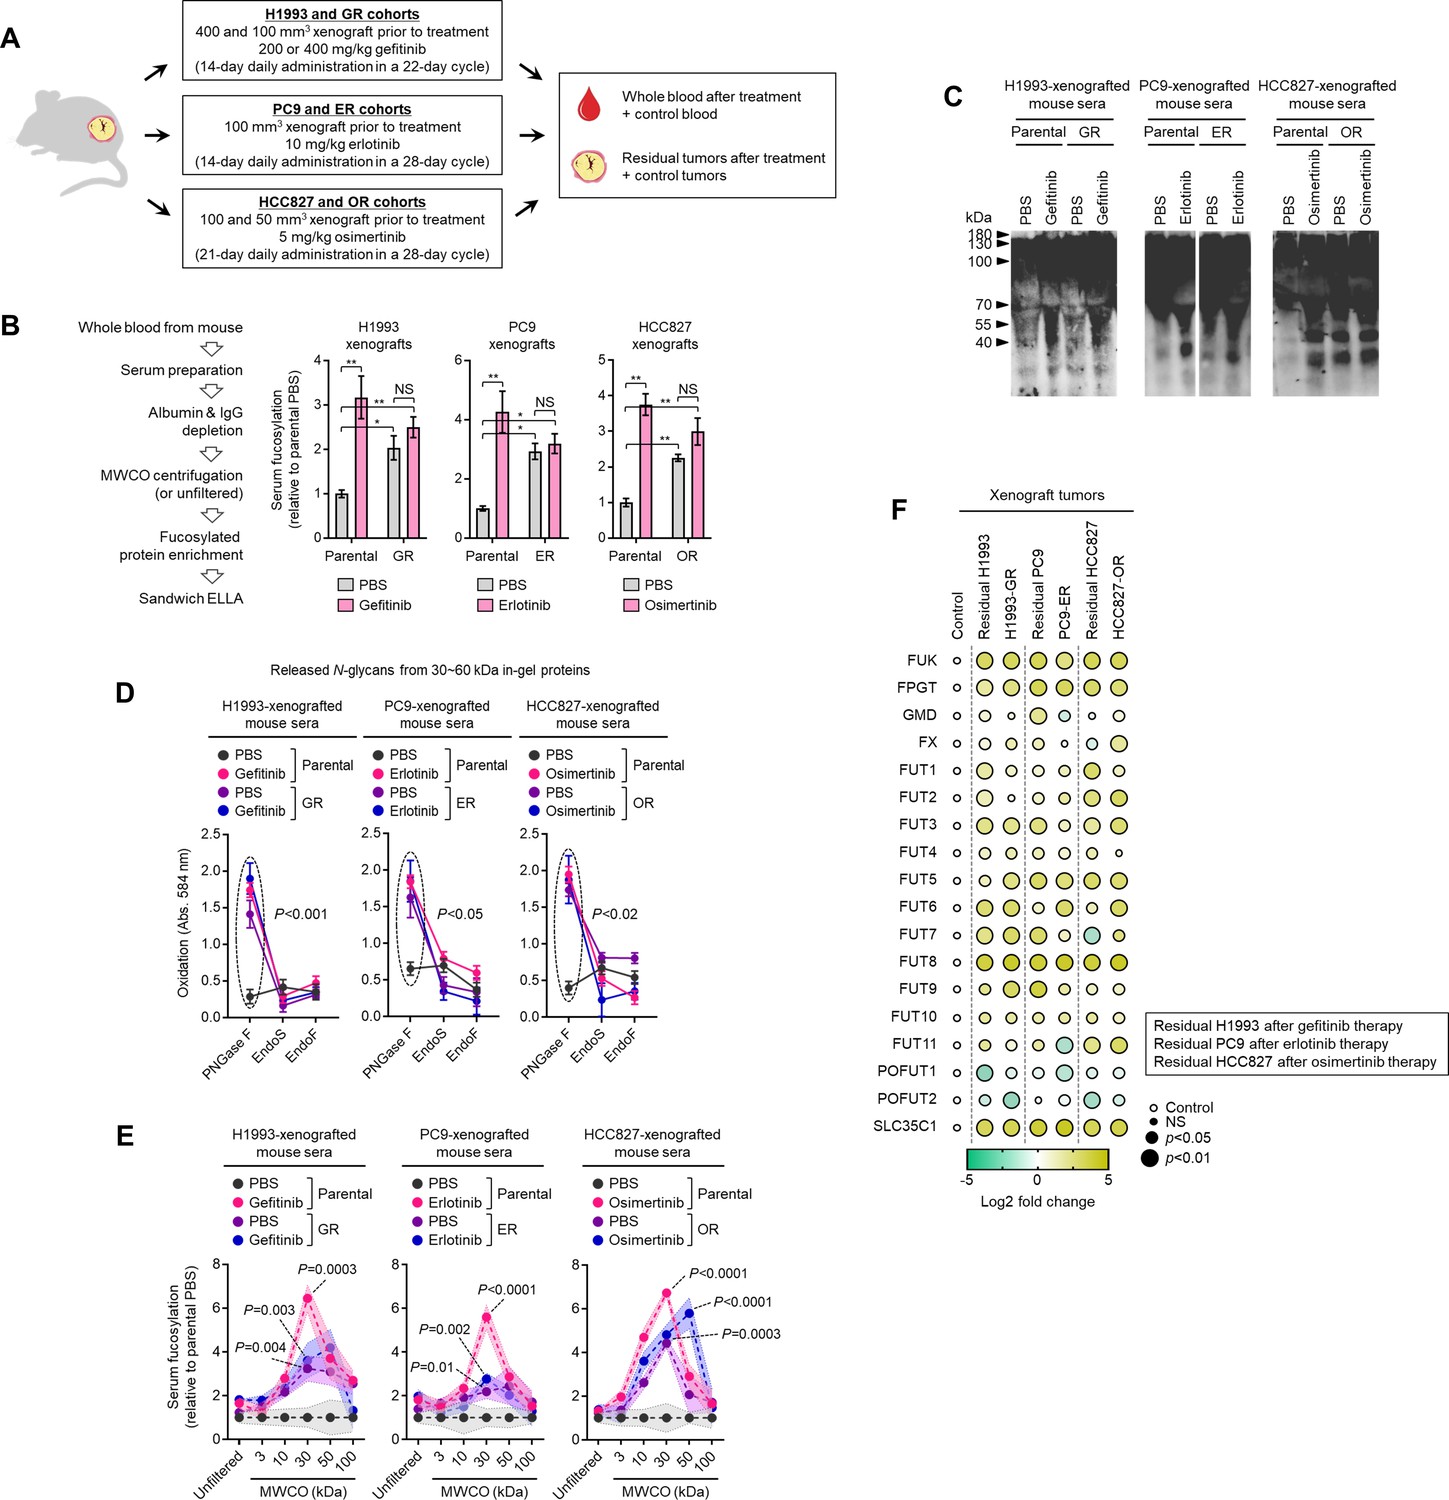
Systemic secretome fucosylation is associated with drug resistance and residual tumor mass persistence after targeted therapy.
(A) Schematic of experimental design and sampling involving tumor xenograft mouse models. (B) Characterization of fucosylation by sandwich ELLA in indicated sera from xenografted mice treated with or without respective drugs as in A. Sera were prepared as indicated. Values are relative to parental PBS (means ± SD of four to six biological replicates). *p<0.05, **p<0.01, Student’s t-test. NS, not significant. (C) AAL blot analysis of total fucosylation in indicated sera as in B. Sera were prepared as in B. Representative of two independent experiments. Equal loading controls are presented in Figure 1—figure supplement 4. (D) N-glycan release assay using indicated N-glycan-cleaving enzymes in sera prepared as in B. Prior to this assay, samples were separated by SDS-PAGE followed by Coomassie staining. 30~60 kDa in-gel proteins were then excised, followed by exogenous de-N-glycosylation (total 8 U PNGase F or total 10 U Endo S/F). Values indicate the mean absorbance at 584 nm from three replicates. Representative of two independent experiments. Sample size n, unique patient samples. For statistical analysis, a two-tailed Mann–Whitney U test was used. NS, not significant. (E) Characterization of fucosylation by sandwich ELLA in indicated sera as in B. Sera were prepared as in B; except filtered according to their indicated NMWL. Values are relative to parental PBS (means ± SD of four to six biological replicates). p Values are indicated as the size of the corresponding circle; Student’s t-test. NS, not significant. (F) Dot plot visualization of indicated gene expression by qPCR analysis in parental or DR xenograft tumors established from control or systemically drug-treated mice. Color indicates log-transformed fold change values relative to control tumor and normalized to GAPDH levels (means ± SD of three biological replicates) while size indicates p values; Student’s t-test. NS, not significant. Details on experimental design is described in (A).
Figure 1—figure supplement 12
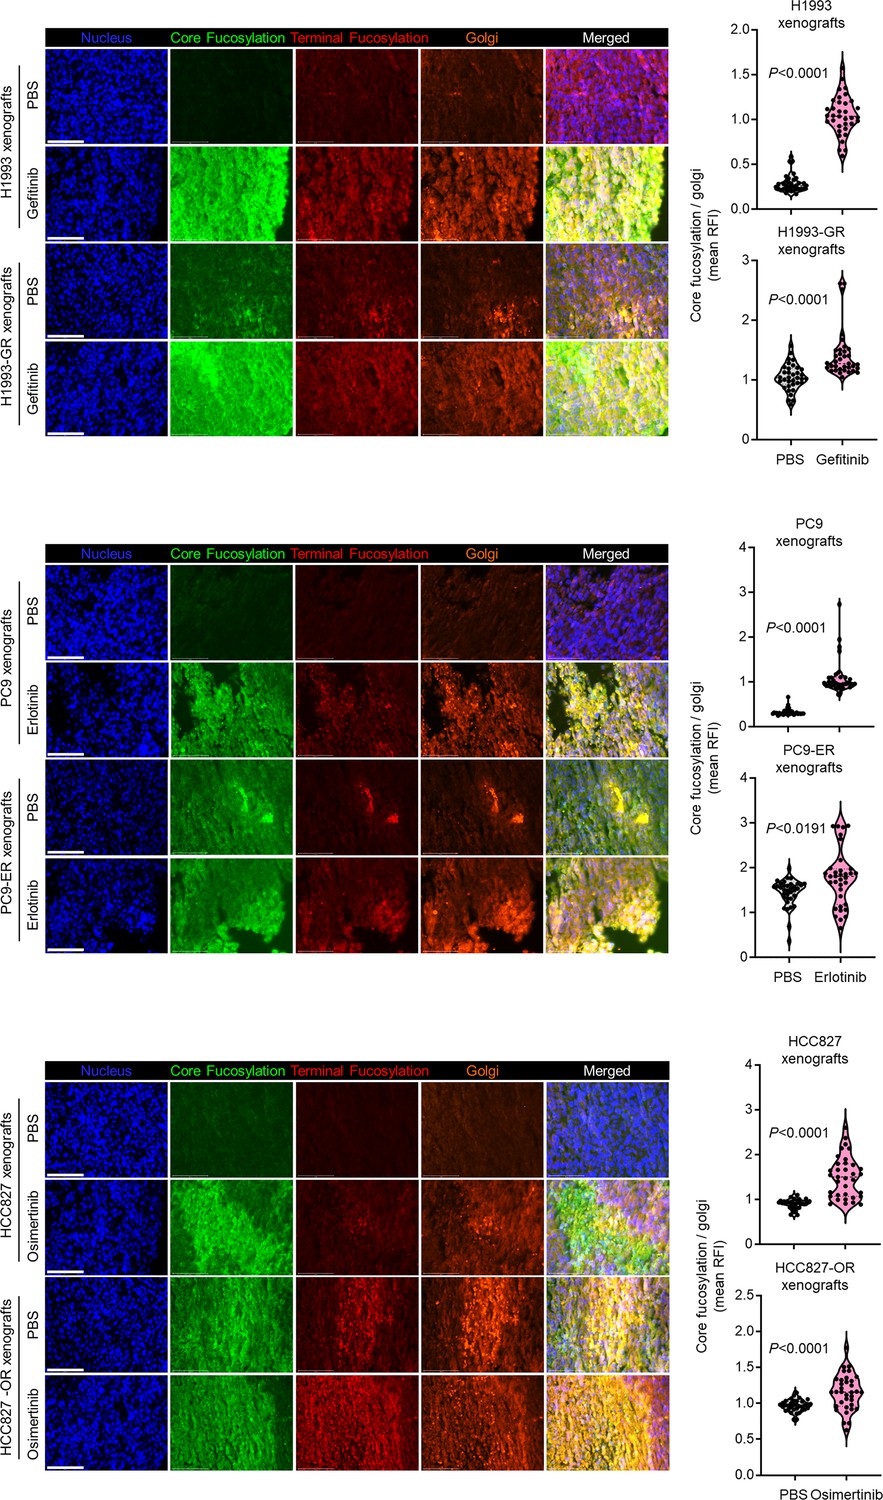
Distinct fucosylation in mouse tumor xenografts.
Representative snapshots from wide-field fluorescence images of indicated tumor tissues from mice as in Figure 1—figure supplement 10A stained for fluorescein-conjugated AAL (core fucosylation; green), Alexa Fluor 594-conjugated UEA1 (terminal fucosylation; red), RCAS1 (golgi marker; orange), and DAPI (nuclei; blue). Scale bar indicates 75 μm. Beside shows fluorescence quantification of at least 50 regions-of-interest (ROIs) within the tumor mass evaluated per FFPE tumor slice. Values indicate relative fluorescence intensity (RFI) relative to PBS (means ± SD of at least five FFPE tumor slices from four to six biological replicates). For statistical analysis, a two-tailed, unpaired Student’s t-test with Welch’s correction for unequal variance was used.
Figure 2 with 6 supplements
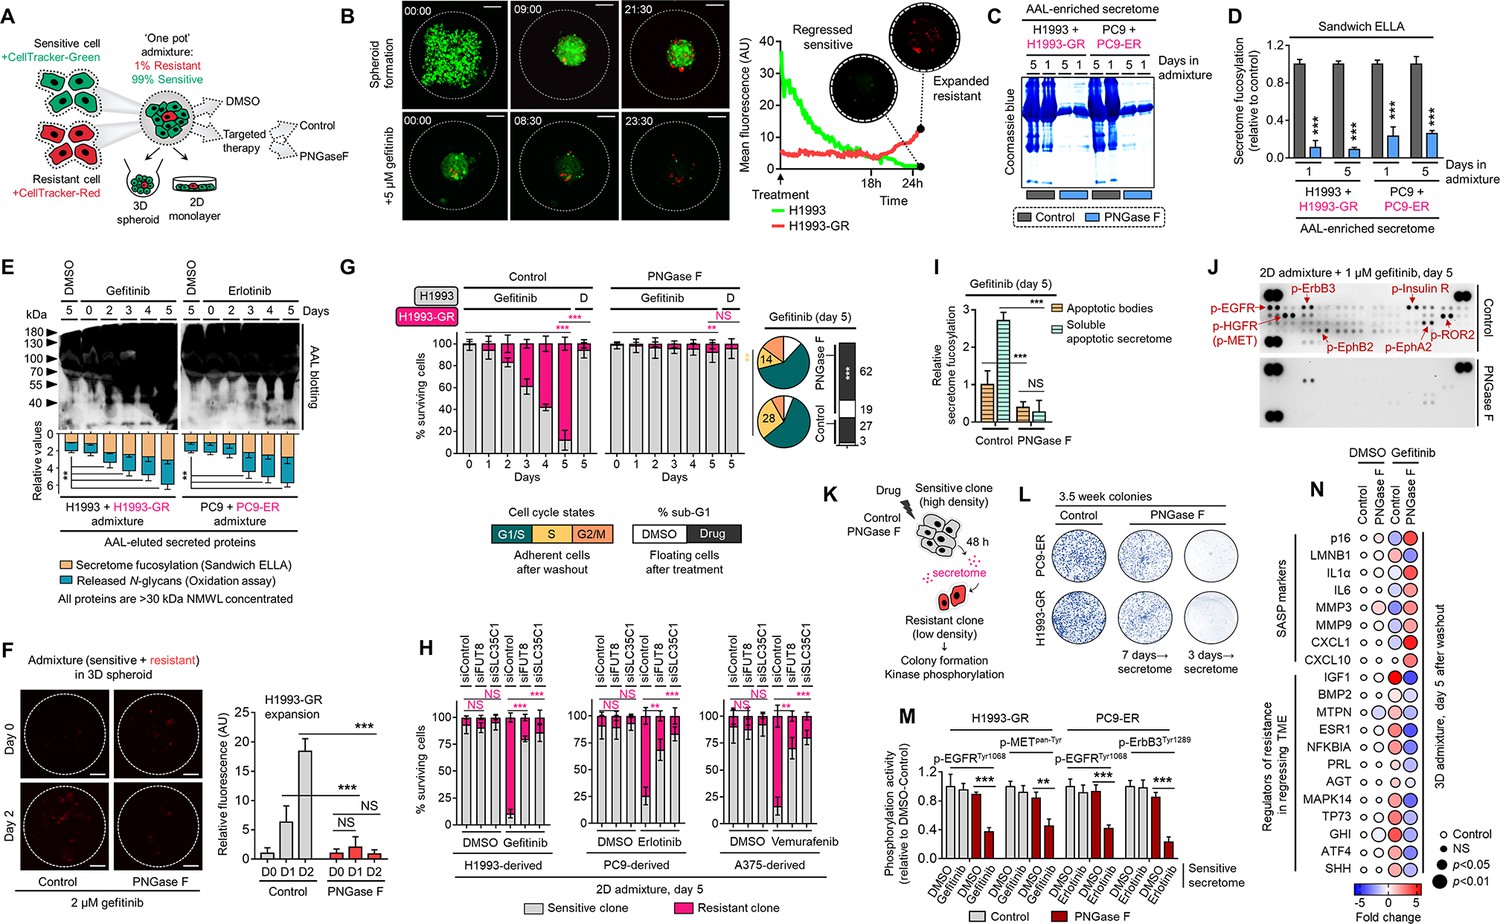
Secretome fucosylation promotes resistance rebound in regressing cell admixtures.
(A) Schematic of multi-color cell tracker assay in ‘one pot’ admixture culture. (B) Representative live-imaging confocal images of indicated 3D tumor spheroid admixture prepared as in A and treated with or without 2 µM gefitinib for 24 hr. Scale bar indicates 100 μm. Mean intensity profiles of both fluorescently tagged cells are shown. Note that the timing of live-imaging is different between the top and bottom panels. In the top panel, imaging started prior to the formation and settlement of the spheroids. In the bottom panel, imaging started after the spheroids have formed and settled. See also Figure 2—figure supplements 1–6. (C) Representative Coomassie-stained SDS-PAGE gels showing fucosylated secretome proteins from indicated 3D cell admixtures prepared as in A, treated with 2 µM gefitinib or 0.1 µM erlotinib for 1 or 5 day/s, and incubated with or without 10 µg/mL recombinant PNGase F. Secretomes were concentrated using a>3 kDa NMWL filter. Representative of two independent experiments. (D) Characterization of fucosylation by sandwich ELLA in indicated cell admixture secretomes with conditions as in C. Values are relative to non-treated secretome (means ± SD of three biological replicates). ***p<0.001, Student’s t-test. (E) Characterization of fucosylation by AAL blotting, sandwich ELLA, and N-glycan release assay in indicated 2D cell admixtures prepared as in A, treated with or without 1 µM gefitinib or 0.1 µM erlotinib, and incubated with or without 10 µg/mL recombinant PNGase F for up to 5 days. Secretomes were concentrated using a>30 kDa NMWL filter. Blots are representative of two independent experiments. Values are relative to day 0 (means ± SD of two biological replicates). **p<0.01, Student’s t-test. (F) Representative confocal images of fluorescently-tagged GR clone in 3D cell admixtures prepared as in A, treated with 2 µM gefitinib, and incubated with or without 10 µg/mL recombinant PNGase F for 24 or 48 hr. Scale bar indicates 100 μm. Intensity profiles of tracker-tagged GR clone are shown. Values are relative to day 0 (means ± SD of three biological replicates). ***p<0.001, Student’s t-test. NS, not significant. (G) Tracking of both fluorescently-tagged cells in 2D cell admixtures prepared as in A, treated with or without 1 µM gefitinib, and incubated with or without 10 µg/mL recombinant PNGase F for indicated times. Values are relative to day 0 (means ± SD of three biological replicates). Beside shows cell-cycle states of adherent cells and apoptosis of floating cells in indicated cell admixtures with same conditions at day 5. Cell cycle assays are representative of two independent experiments. **p<0.01, ***p<0.001, two-tailed Mann–Whitney U test. NS, not significant. (H) Similar tracking experiments as in G, except upon FUT8 or SLC35C1 RNAi in sensitive cells for 48 hr prior to admixing and culture for 5 days. H1993 admixture was treated with or without 1 µM gefitinib, PC9 admixture was treated with or without 0.1 µM erlotinib, and A375 admixture was treated with or without 0.1 µM vemurafenib. Values are relative to day 0 (means ± SD of two biological replicates). **p<0.01, ***p<0.001, two-tailed Mann–Whitney U test. NS, not significant. PNGase F controls are presented in Figure 2—figure supplement 2E. (I) Characterization of fucosylation by sandwich ELLA in indicated apoptotic debris and secretomes from the same cell admixtures as in G. Values are relative to control apoptotic debris (means ± SD of three biological replicates). ***p<0.001, Student’s t-test. NS, not significant. (J) Phospho-RTK array of indicated cell admixtures in the same conditions as in G. The blots reflect the phosphorylation status of 49 RTKs. Each RTK is spotted in duplicate, and the three pairs of dots in each corner are positive or negative controls. Representative of two independent experiments. (K) Schematic of CM co-culture. (L) Colony formation of indicated DR clones prepared as in K. Representative of two independent experiments. (M) ELISA sandwich-based measurement of indicated RTK phosphorylation in indicated DR clones prepared as in K. Values are relative to DMSO (means ± SD of three biological replicates). **p<0.01, ***p<0.001, Student’s t-test. (N) Dot plot visualization of indicated gene expression by qPCR analysis in 3D cell admixtures prepared as in A, treated with or without 2 µM gefitinib, and incubated with or without 10 µg/mL recombinant PNGase F for 5 days. Color indicates log-transformed fold change values relative to DMSO and normalized to GAPDH levels (means ± SD of three biological replicates) while size indicates p values; Student’s t-test. NS, not significant.
-
Figure 2—source data 1
Uncropped blots and gels (labeled and unlabeled) for Figure 2C, E and J.
- https://cdn.elifesciences.org/articles/75191/elife-75191-fig2-data1-v2.zip
-
Figure 2—source data 2
Uncropped gels (labeled and unlabeled) for Figure 2—figure supplement 4A and D.
- https://cdn.elifesciences.org/articles/75191/elife-75191-fig2-data2-v2.zip
Figure 2—figure supplement 1
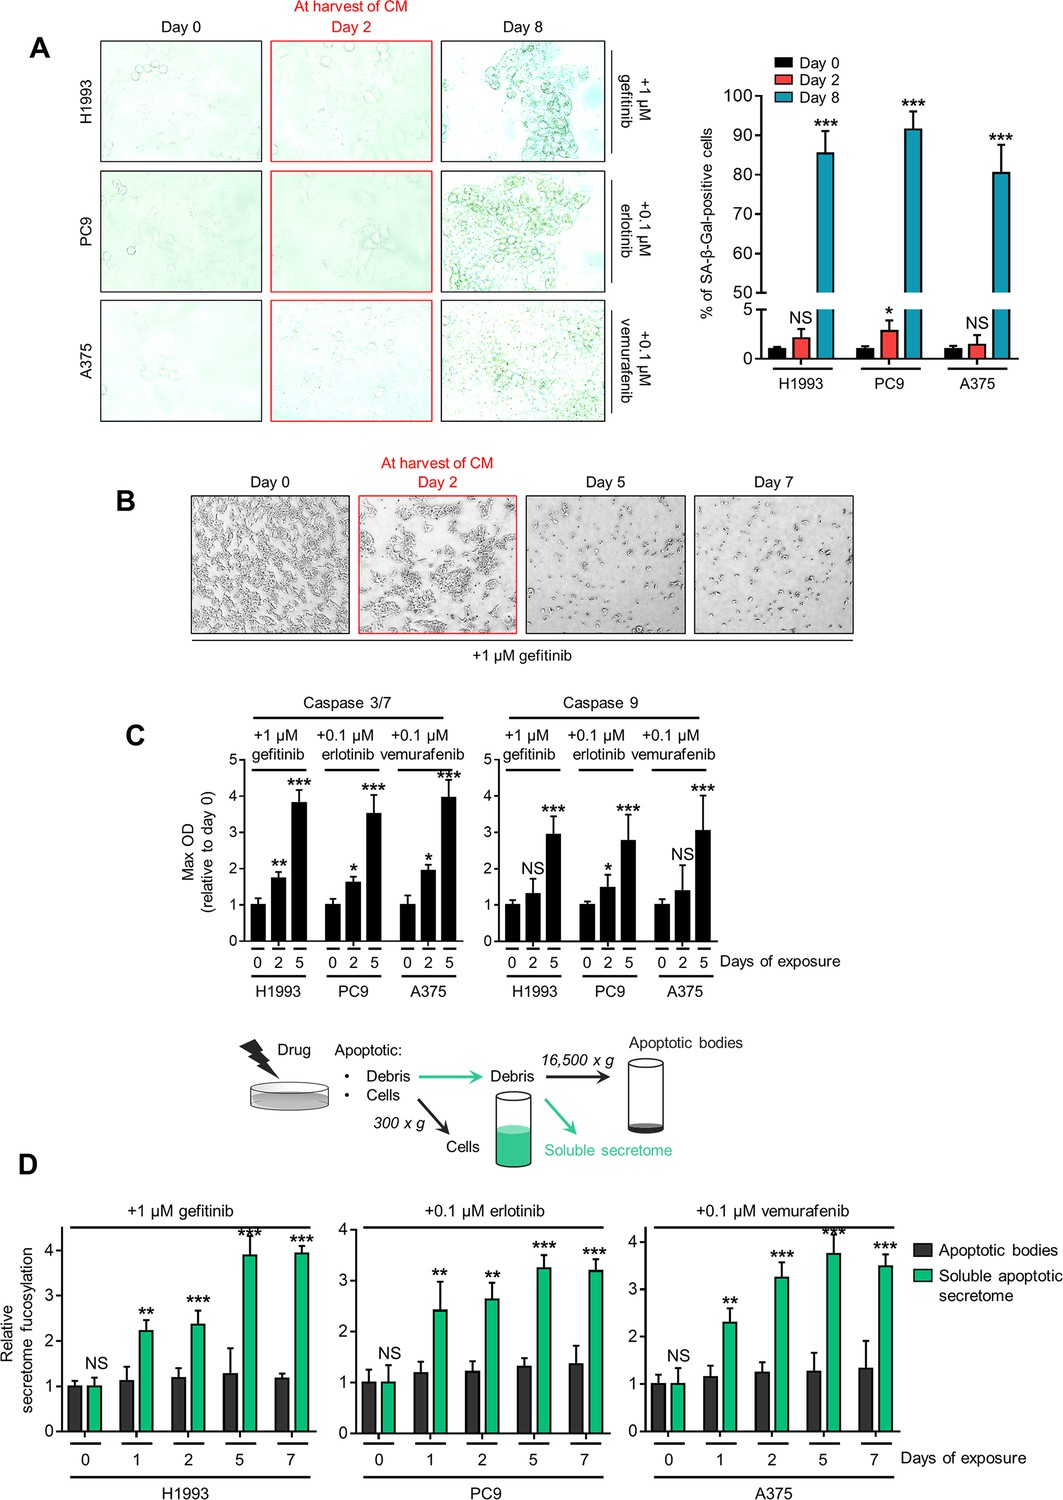
Drug-induced secretome fucosylation occurs before apoptosis and senescence.
(A) SA-β-gal staining of indicated cells treated with indicated drug concentrations for 2 or 8 days. Cells were passaged over ~8 times before the experiment. Representative images are shown (left) along with quantified data as percentage (right; means ± SD of three biological replicates). *p<0.05, ***p<0.001, Student’s t-test. NS, not significant. (B) Morphological evaluation of H1993 cells treated with 1 µM gefitinib for indicated times. (C) Caspase 3/7 DEVDase and caspase 9 activities of indicated cells and treatment conditions as in A. Values are relative to time point 0 (means ± SD of two biological replicates). *p<0.05, **p<0.01, ***p<0.001, Student’s t-test. NS, not significant. (D) Sandwich ELLA of apoptotic cell debris and secretome from indicated cells treated with indicated drug concentrations for indicated times by means of centrifugation. Samples were prepared as in the top panel. Values are relative to time point 0 (means ± SD of two biological replicates). **p<0.01, ***p<0.001, Student’s t-test. NS, not significant.
Figure 2—figure supplement 2
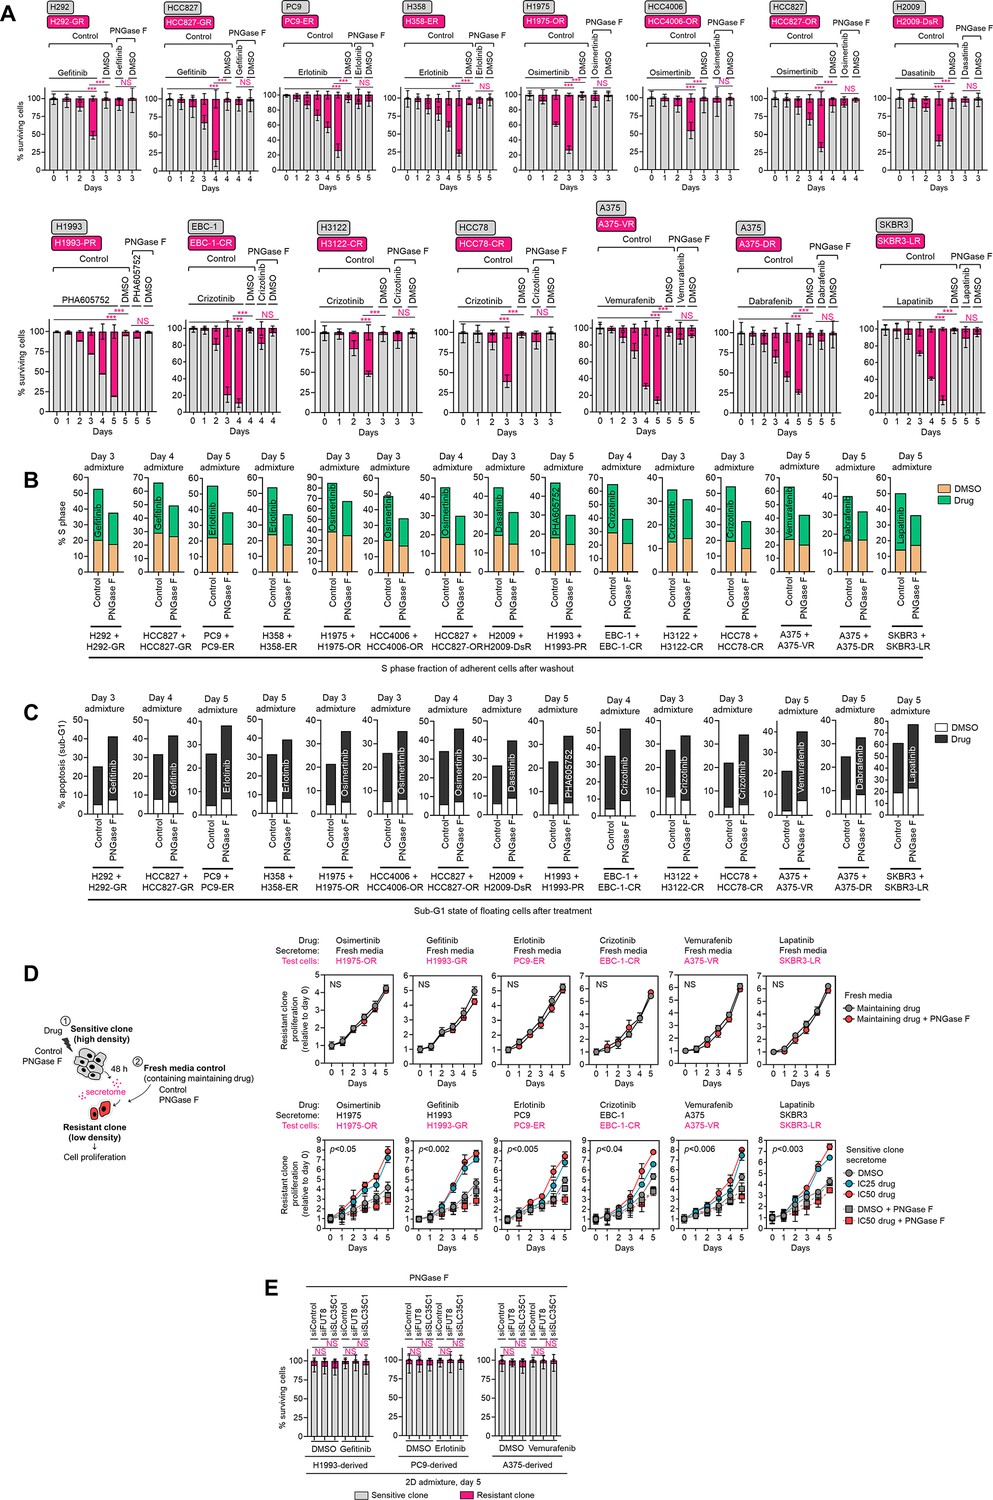
Resistance rebound and apoptosis in 2D admixtures.
(A) Tracking of both fluorescently-tagged cells in 2D cell admixtures prepared as in Figure 2A, treated with or without indicated drugs [gefitinib (1 µM in H292, 0.08 µM in HCC827), erlotinib (0.1 µM in PC9, 1 µM in H358), osimertinib (0.08 µM in H1975, 0.01 µM in HCC4006, 0.08 µM in HCC827), dasatinib (0.8 µM in H2009), PHA665752 (0.6 µM in H1993), crizotinib (0.08 µM in EBC-1, 0.5 µM in H3122, 1 µM in HCC78), vemurafenib (0.1 µM in A375), dabrafenib (0.03 µM in A375), lapatinib (0.4 µM in SKBR3)], and incubated with or without 10 µg/mL recombinant PNGase F for indicated times. Values are relative to day 0 (means ± SD of three biological replicates). *p<0.05, **p<0.01, ***p<0.001, two-tailed Mann–Whitney U test. NS, not significant. (B and C) Cell cycle states of adherent cells and apoptosis of floating cells in indicated cell admixtures with same conditions as in A at indicated times. Representative of two independent experiments. (D) Proliferation of indicated DR clones upon (1) conditioned media CM co-culture or (2) fresh media control. Test DR clones were incubated with modified CM or fresh media as indicated, with or without 10 µg/mL recombinant PNGase F for indicated times. Maintaining drug concentrations are shown in Figure 1—figure supplement 6. Values are relative to time point 0 (means ± SD of three biological replicates). For statistical analysis, Student’s t-test was used. NS, not significant. (E) Similar tracking experiments as in A, except upon FUT8 or SLC35C1 RNAi in sensitive cells for 48 hr prior to admixing and culture for 5 days. Cell admixtures treated with or without indicated drugs as in A and were incubated with or without 10 µg/mL recombinant PNGase F for indicated times. Values are relative to day 0 (means ± SD of two biological replicates). For statistical analysis, two-tailed Mann–Whitney U test was used. NS, not significant.
Figure 2—figure supplement 3
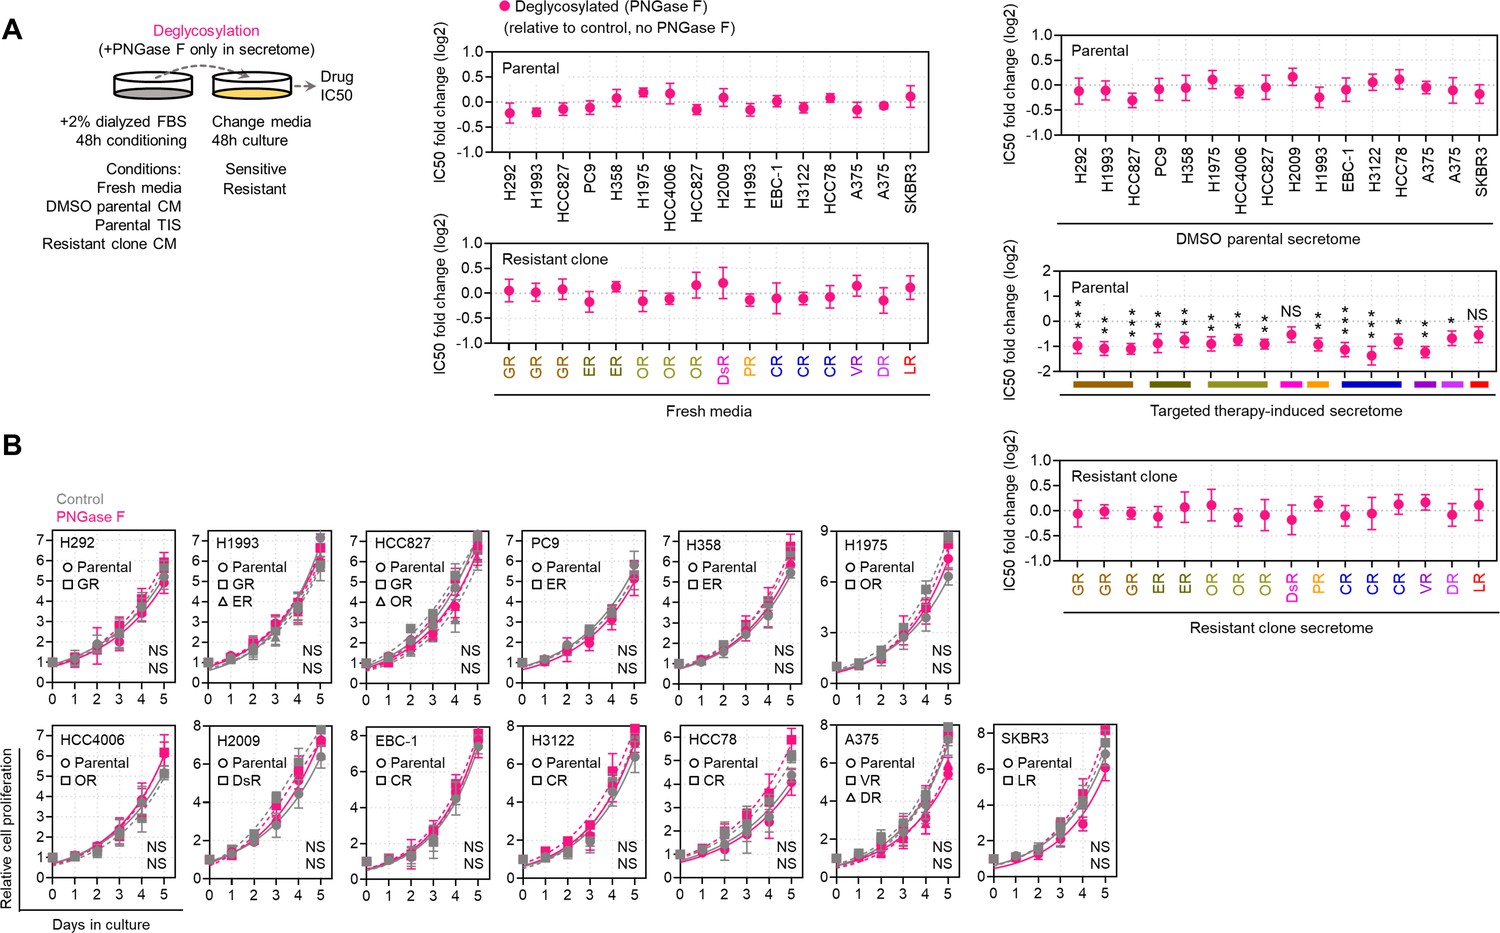
Effects of de-N-glycosylation in cell cultures.
(A) Drug sensitivity assays in indicated sensitive cells or DR clones prepared as in the schematic. Prior to CM co-culture, secretomes were exogenously treated with or without 8 U PNGase F. Cells were treated with or without drugs for 72 hr with a concentration dilution series and were assayed for SRB. Values are relative to DMSO (means ± SD of three biological replicates). *p<0.05, **p<0.01, ***p<0.001, Student’s t-test. NS, not significant. (B) Proliferation of indicated sensitive or DR clones treated with or without 10 µg/mL recombinant PNGase F for indicated times. Values are relative to time point 0 (means ± SD of three biological replicates). For statistical analysis, Student’s t-test was used. NS, not significant.
Figure 2—figure supplement 4
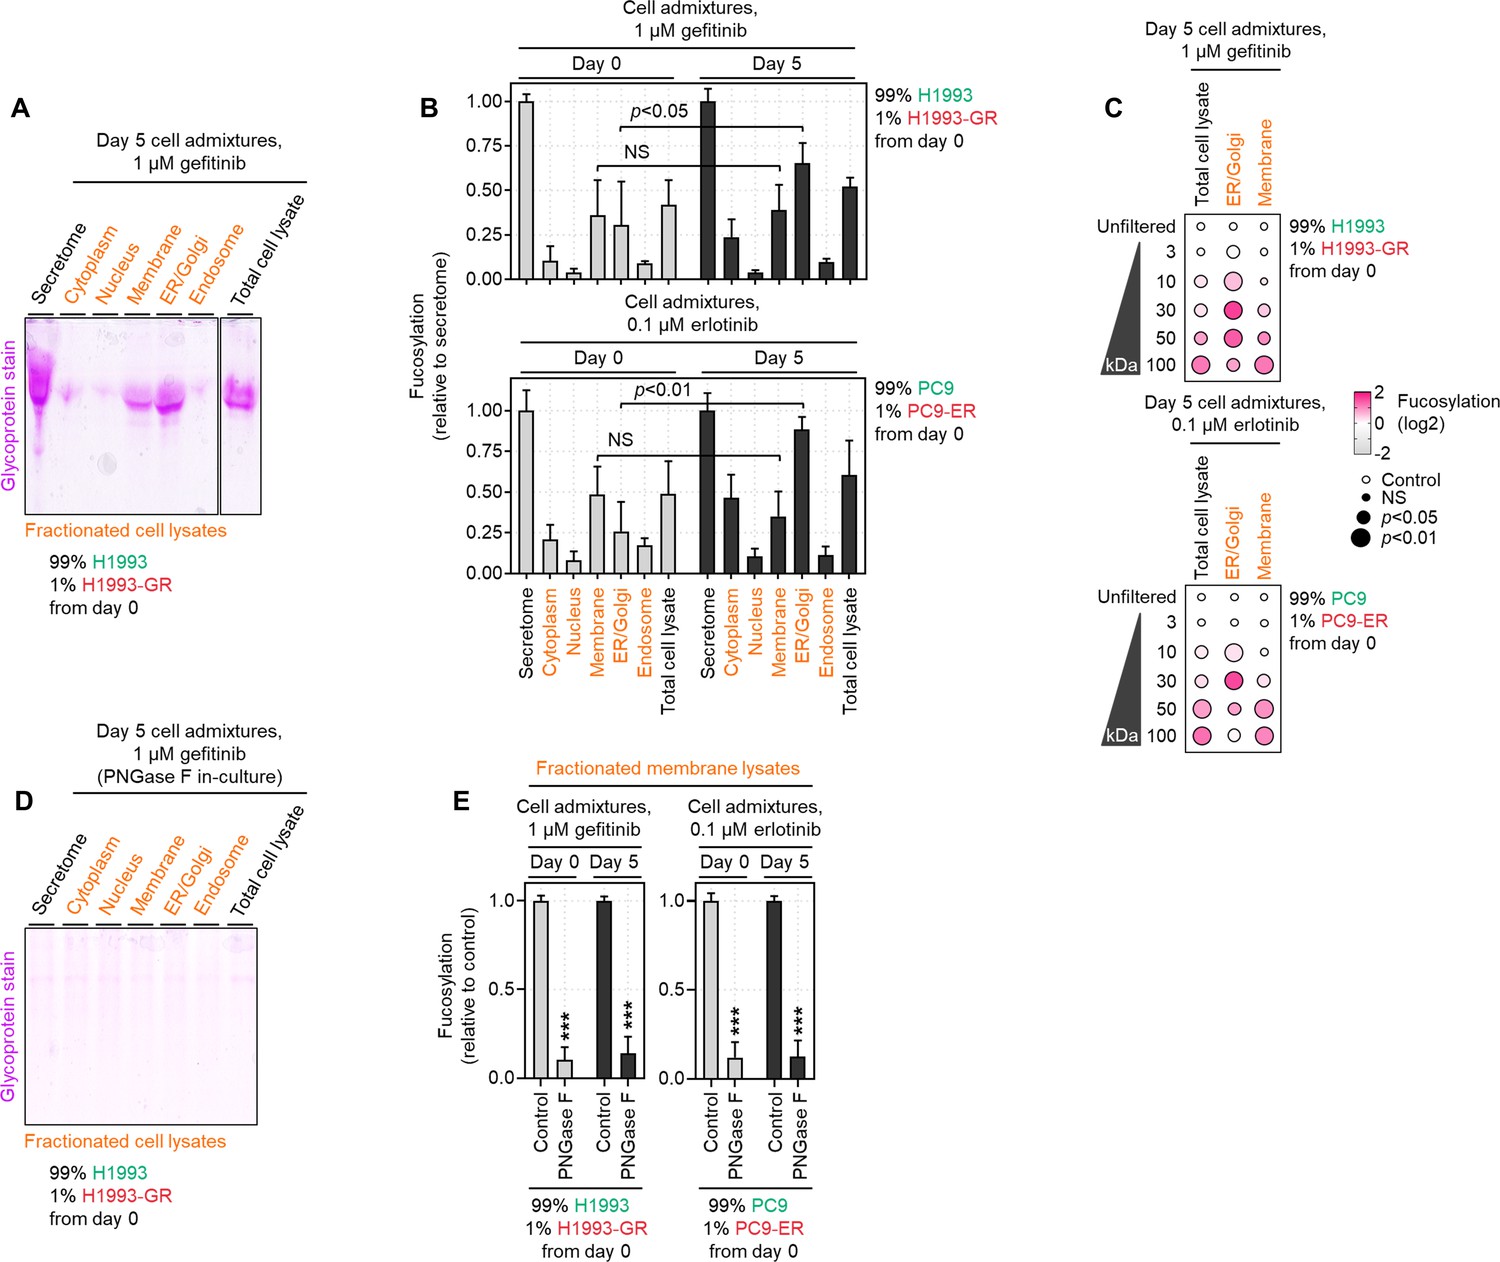
Cell membrane-bound N-glycoproteins are dispensable in promoting drug-resistant population expansion in drug-treated admixture cultures.
(A) Representative glycoprotein staining of H1993 cell admixtures at day 5 prepared as in Figure 2A, treated with 1 µM gefitinib. Cell secretomes, total cell lysates, and pooled subcellular fraction lysates were collected from cell admixtures. (B) Sandwich ELLA of indicated H1993 and PC9 cell admixtures at days 0 and 5 prepared as in Figure 2A, treated with 1 µM gefitinib and 0.1 µM erlotinib, respectively. Cell secretomes, total cell lysates, and pooled subcellular fraction lysates were collected from cell admixtures. Values are relative to cell secretome (means ± SD of three biological replicates). For statistical analysis, Student’s t-test was used. NS, not significant. (C) Dot plot visualization of fucosylation characterization by sandwich ELLA in indicated H1993 and PC9 cell admixtures as in B, except filtered according to their indicated NMWL. Color indicates log-transformed fold change values relative to unfiltered secretome/sera (means ± SD of three biological replicates) while size indicates p values; Student’s t-test. NS, not significant. (D) Representative glycoprotein staining of H1993 cell admixtures as in A, except incubated with 10 µg/mL recombinant PNGase F. Cell secretomes, total cell lysates, and pooled subcellular fraction lysates were collected from cell admixtures. (E) Sandwich ELLA of indicated H1993 and PC9 cell admixtures as in B, except incubated with 10 µg/mL recombinant PNGase F. Only results from pooled subcellular membrane fraction lysates collected from cell admixtures are shown. ***p<0.001, Student’s t-test.
Figure 2—figure supplement 5
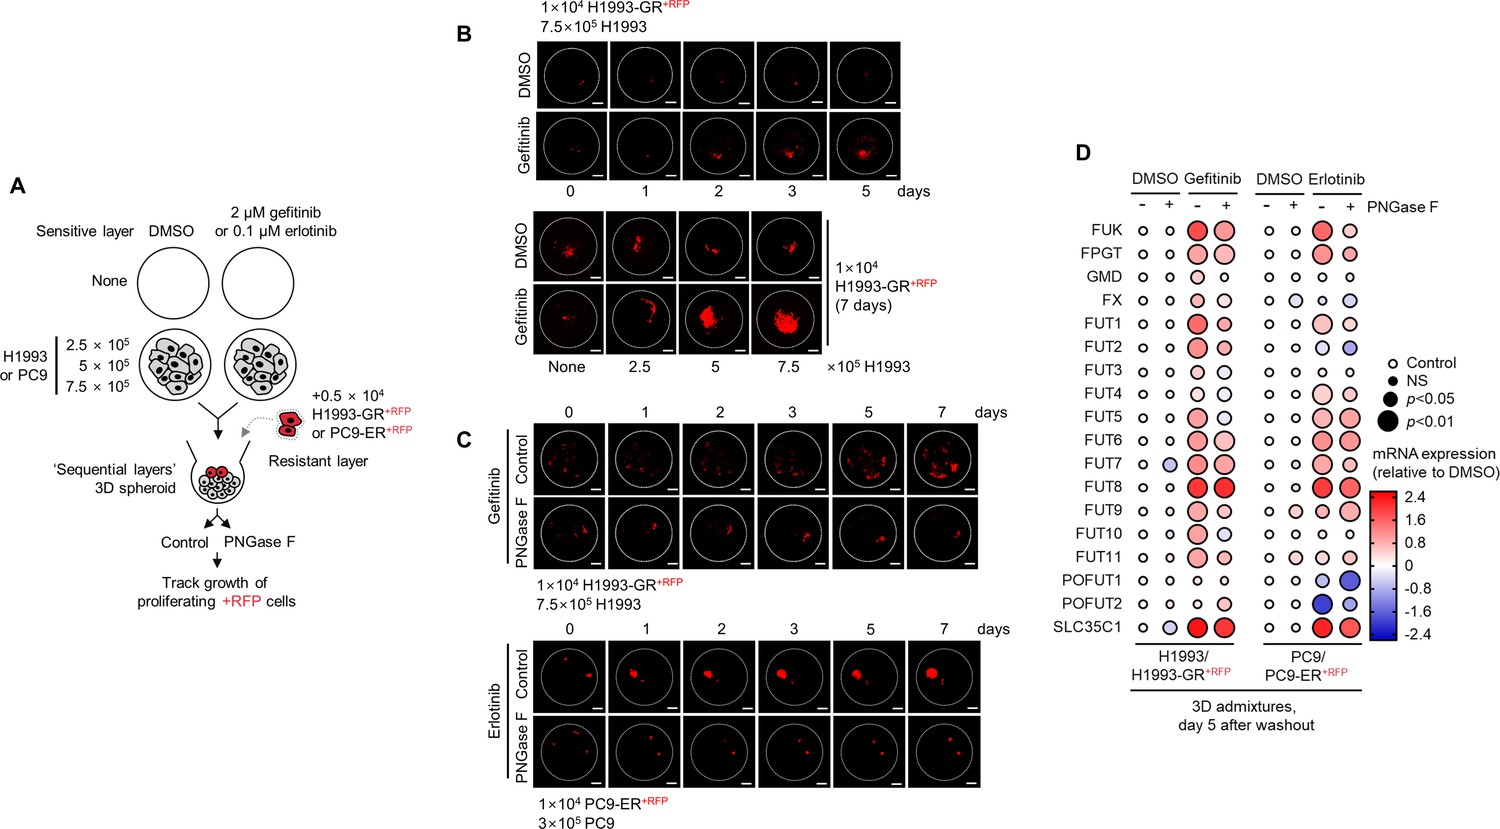
Outgrowth of DR clones in regressing 3D spheroids is associated with expression of fucose salvage genes.
(A) Schematic of ‘sequential layer’ admixture culture. (B) Representative confocal images of indicated RFP-labeled GR clones in 3D spheroid admixtures prepared as in A and treated with or without 2 µM gefitinib for indicated times. Scale bar indicates 100 μm. Representative of two independent experiments. (C) Representative confocal images of indicated RFP-labeled GR clones in 3D spheroid admixtures prepared as in A, treated with either 2 µM gefitinib or 0.1 µM erlotinib, and incubated with or without 10 µg/mL recombinant PNGase F for indicated times. Scale bar indicates 100 μm. Representative of two independent experiments. (D) Dot plot visualization of indicated gene expression by qPCR analysis in 3D cell admixtures prepared as in A, treated with or without 2 µM gefitinib or 0.1 µM erlotinib, and incubated with or without 10 µg/mL recombinant PNGase F for 5 days. Color indicates log-transformed fold change values relative to DMSO and normalized to GAPDH levels (means ± SD of three biological replicates) while size indicates P values; Student’s t-test. NS, not significant.
Figure 2—figure supplement 6
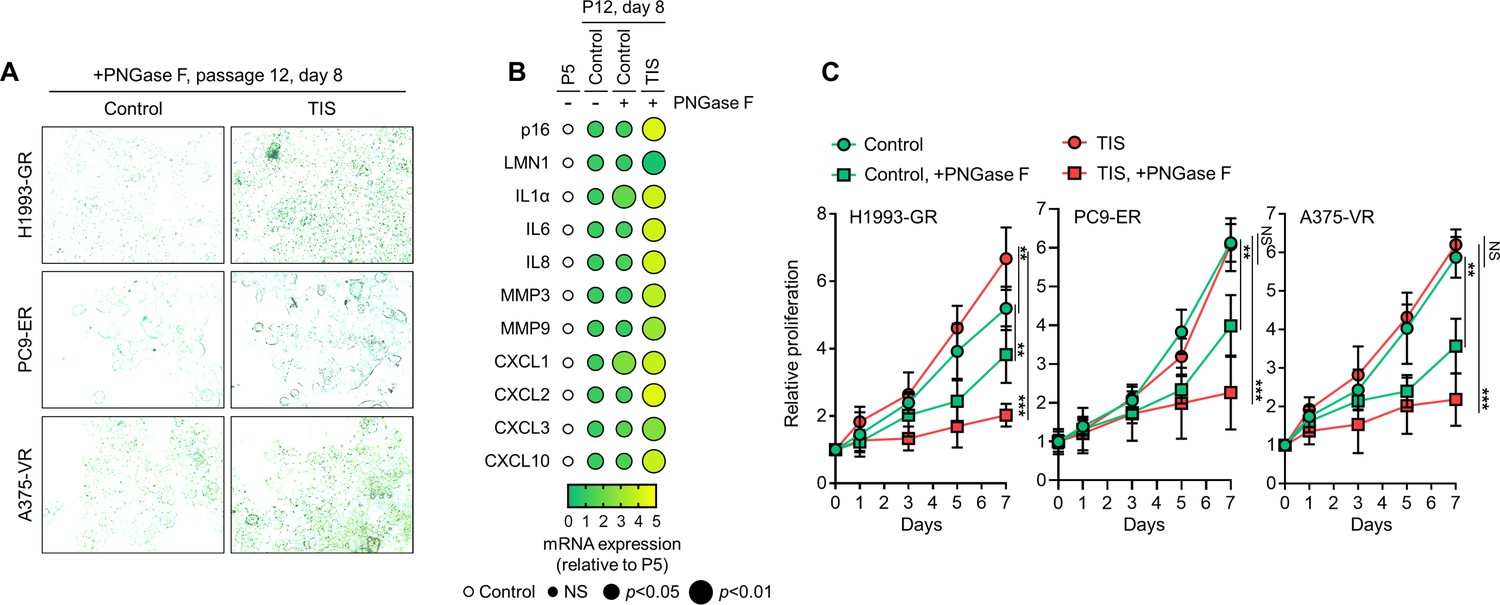
TIS de-N-glycosylation promotes senescence in long-term grown DR clones.
(A) SA-β-gal staining of indicated DR clones incubated with or without indicated TIS (secretomes derived from parental cells treated 1 µM gefitinib, 0.1 µM erlotinib, or 0.1 µM vemurafenib for 2 days) and with 10 µg/mL recombinant PNGase F for 8 days. Representative of two independent experiments. (B) Dot plot visualization of indicated SASP gene expression by qPCR analysis in GR clones as in A. Color indicates log-transformed fold change values relative to P5 and normalized to GAPDH levels (means ± SD of three biological replicates) while size indicates p values; Student’s t-test. NS, not significant. (C) Proliferation of indicated DR clones as in A. Values are relative to time point 0 (means ± SD of three biological replicates). *p<0.05, **p<0.01, ***p<0.001, Student’s t-test. NS, not significant.
Figure 3 with 3 supplements
Identification of fucosylated PON1 as a critical component of therapy-induced cancer secretomes.
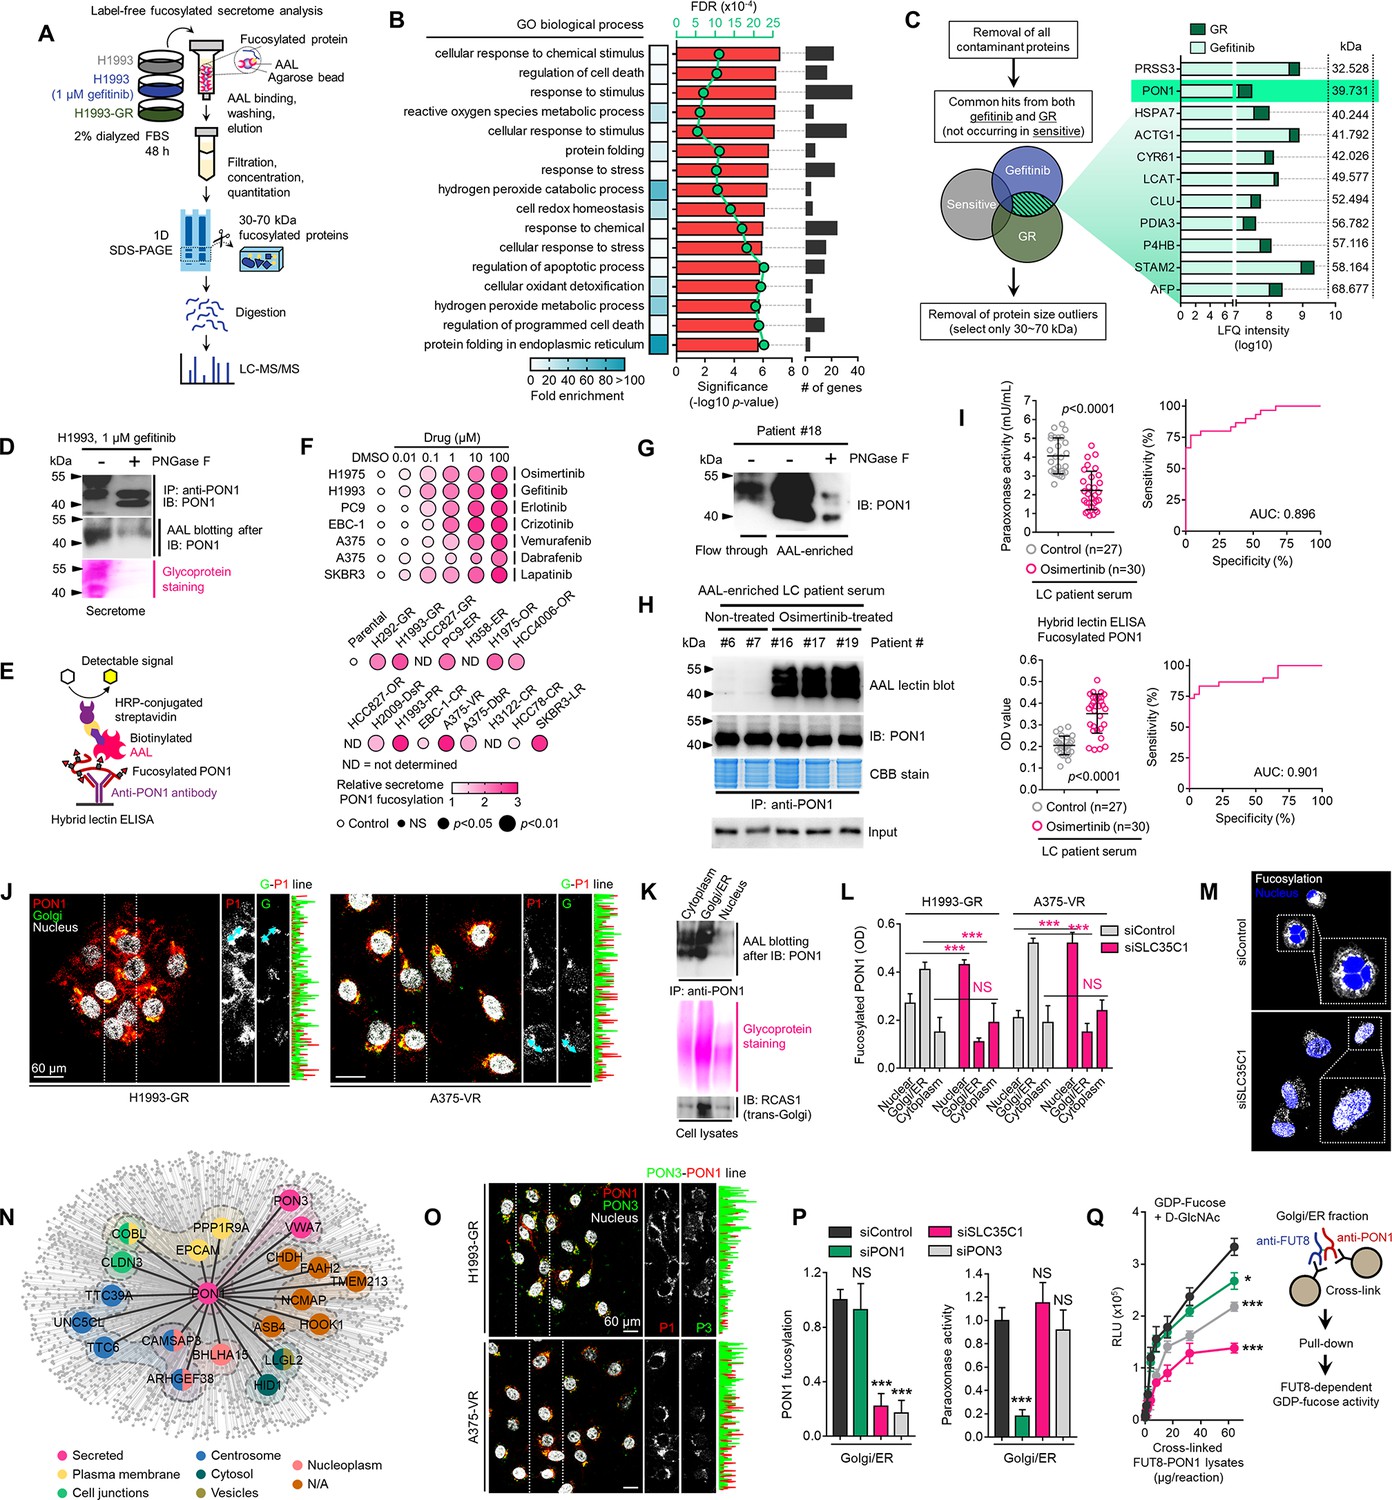
(A) Schematic of the label-free secretome analysis workflow. (B) GO enrichment analysis for overrepresented BPs in cell-specific secretomes. Fold enrichment is shown as a heatmap. -log10 p values (red), false discovery rates (green), and the number of gene components per BP (gray) are displayed. Results were analyzed from two biological replicates. (C) Protein candidate screening approach and log10 LFQ intensities (relative protein abundances) of indicated overlapped proteins in secretomes of both gefitinib-treated H1993 cells and GR clone. Top 11 protein hits with MWs between 30 and 70 kDa are shown. Results were analyzed from two biological replicates. (D) Immunoblot and AAL blot analyses of PON1 expression and fucosylation status in PON1 immunoprecipitates from 1 µM gefitinib-treated H1993 secretomes. Secretomes were exogenously treated with or without 8 U PNGase F. Bottom panel shows glycoprotein stained SDS-PAGE gel of the same PON1 immunoprecipitates. Representative of two independent experiments. (E) Schematic of HLE for detecting PON1 fucosylation. (F) Dot plot visualization of PON1 fucosylation characterization by HLE analysis in secretomes from indicated cells and DR clones treated with or without indicated drug concentrations for 48 h. Color indicates fold change values relative to DMSO or parental (means ± SD of three biological replicates) while size indicates p values; Student’s t-test. NS, not significant. (G) Immunoblot analysis of PON1 expression in indicated crude patient sera exogenously treated with or without 8 U PNGase F. Secretomes were either flow-through or enriched in AAL columns. Representative of two independent experiments. (H) AAL blot analysis of PON1 fucosylation and immunoblot analysis of PON1 expression in PON1 immunoprecipitates from indicated patient sera. Coomassie-stained SDS-PAGE gel of the same PON1 immunoprecipitates and input (10% of total protein) for PON1 immunoblot are also shown. Representative of two independent experiments. (I) HLE analysis of PON1 fucosylation in indicated crude patient sera. Values indicate the mean absorbance at 450 nm from three replicates. Representative of two independent experiments. Beside shows quantification of paraoxonase activity in the same crude patient sera. Values indicate mean fluorescence units at 412 nm from three replicates. Representative of two independent experiments. ROC curves for both PON1 fucosylation and paraoxonase activity are shown. For statistical analysis, the nonparametric Kruskal-Wallis test was used. (J) Representative confocal images of indicated DR clones stained for RCAS1 (golgi marker; green), PON1 (red), and DAPI (nuclei; white). The co-localization histogram plot of the indicated line is shown. Representative of two independent experiments. (K) AAL blot analysis of PON1 fucosylation in PON1 immunoprecipitates from indicated subcellular fractionated H1993-GR. Middle panel shows glycoprotein stained SDS-PAGE gel of subcellular fractionated cell lysates. Bottom panel shows immune blot analysis of RCAS1 in the same cell lysates. Representative of two independent experiments. (L) HLE analysis of PON1 fucosylation in indicated subcellular fractionated DR clone lysates upon SLC35C1 RNAi for 48 hr. Values indicate absorbance at 450 nm (means ± SD of three biological replicates). ***p<0.001, Student’s t-test. NS, not significant. (M) Representative confocal images of H1993-GR upon SLC35C1 RNAi for 48 hr. GR clones were stained for SLC35C1 (white) and DAPI (nuclei; blue). (N) Genes co-expression network of PON1 queried in the CCLE. All nodes represent statistically significant co-expression with a gene. Top 20 PON1 co-expressing genes are highlighted. Colored nodes indicate cellular localization of protein-coding genes queried in The Human Protein Atlas. (O) Representative confocal images of indicated DR clones stained for PON1 (red), PON3 (green), and DAPI (nuclei; white). The co-localization histogram plot of the indicated line is shown. (P) HLE analysis of PON1 fucosylation and quantification of paraoxonase activity in Golgi/ER fractionated H1993-GR lysates upon SLC35C1, PON1, or PON3 RNAi for 48 hr. Values are relative to siControl (means ± SD of three biological replicates). ***p<0.001, Student’s t-test. NS, not significant. (Q) GDP-Fuc activity analysis of FUT8 in cross-linked FUT8 and PON1 co-immunoprecipitates from Golgi/ER fractionated H1993-GR lysates. Values indicate luminescence units and are relative to control reaction (means ± SD of three biological replicates). *p<0.05, ***p<0.001, two-tailed Mann–Whitney U test.
-
Figure 3—source data 1
Uncropped blots and gels (labeled and unlabeled) for Figure 3D, G, H and K.
- https://cdn.elifesciences.org/articles/75191/elife-75191-fig3-data1-v2.zip
-
Figure 3—source data 2
Uncropped blots (labeled and unlabeled) for Figure 3—figure supplement 2A.
- https://cdn.elifesciences.org/articles/75191/elife-75191-fig3-data2-v2.zip
-
Figure 3—source data 3
Uncropped blots (labeled and unlabeled) for Figure 3—figure supplement 3D.
- https://cdn.elifesciences.org/articles/75191/elife-75191-fig3-data3-v2.zip
Figure 3—figure supplement 1
In-gel N-glycome analysis.
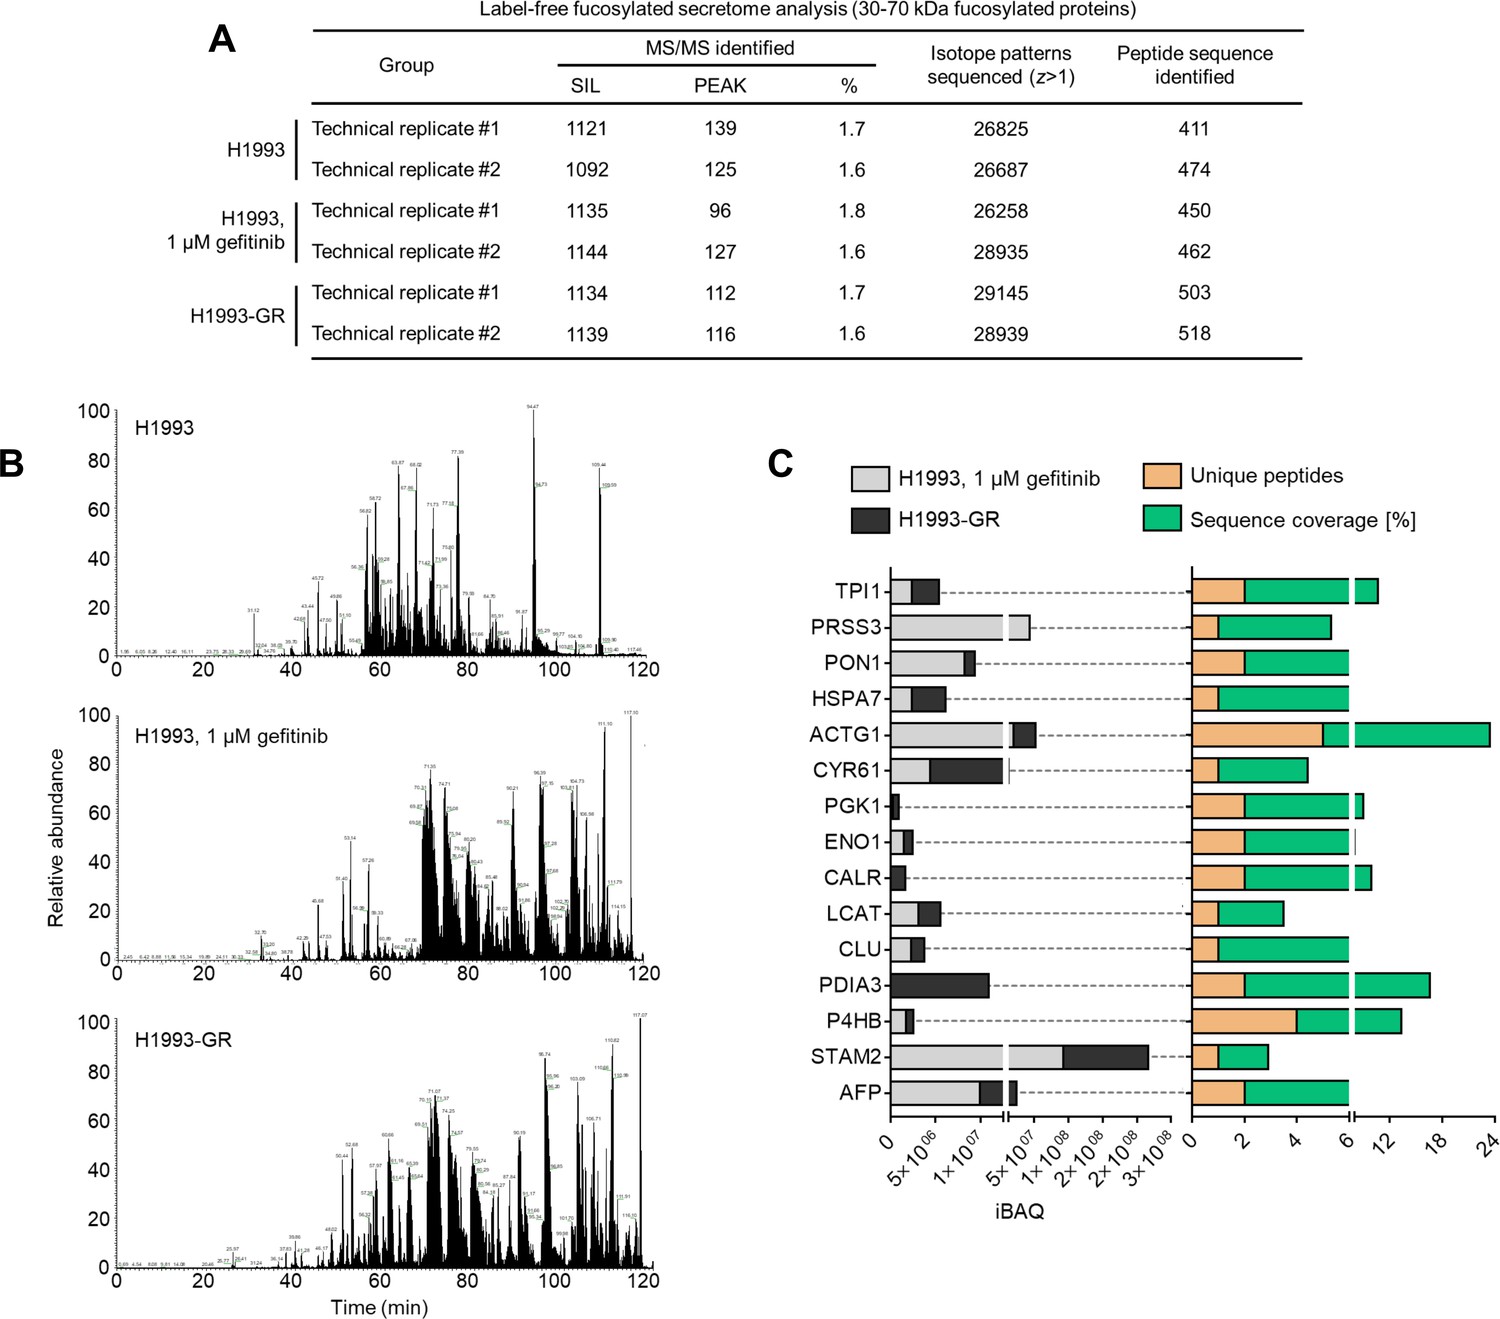
(A) Summary information on label-free secretome analysis. (B) Representative base peak chromatogram of protein digest samples from indicated cells or DR clone by a 120 min LC gradient. Selected chromatographic peaks are labeled with m/z of the underlying peptide. Representative profile of two replicates. (C) iBAQ intensities (relative protein abundances), unique peptides, and sequence coverage in percentile of indicated proteins in secretomes of gefitinib-treated H1993 cells or GR clone. Top 16 protein hits with MWs between 30 and 70 kDa are shown. Results were analyzed from two biological replicates.
Figure 3—figure supplement 2
PON1 N-glycosylation regulates PON1 secretion.
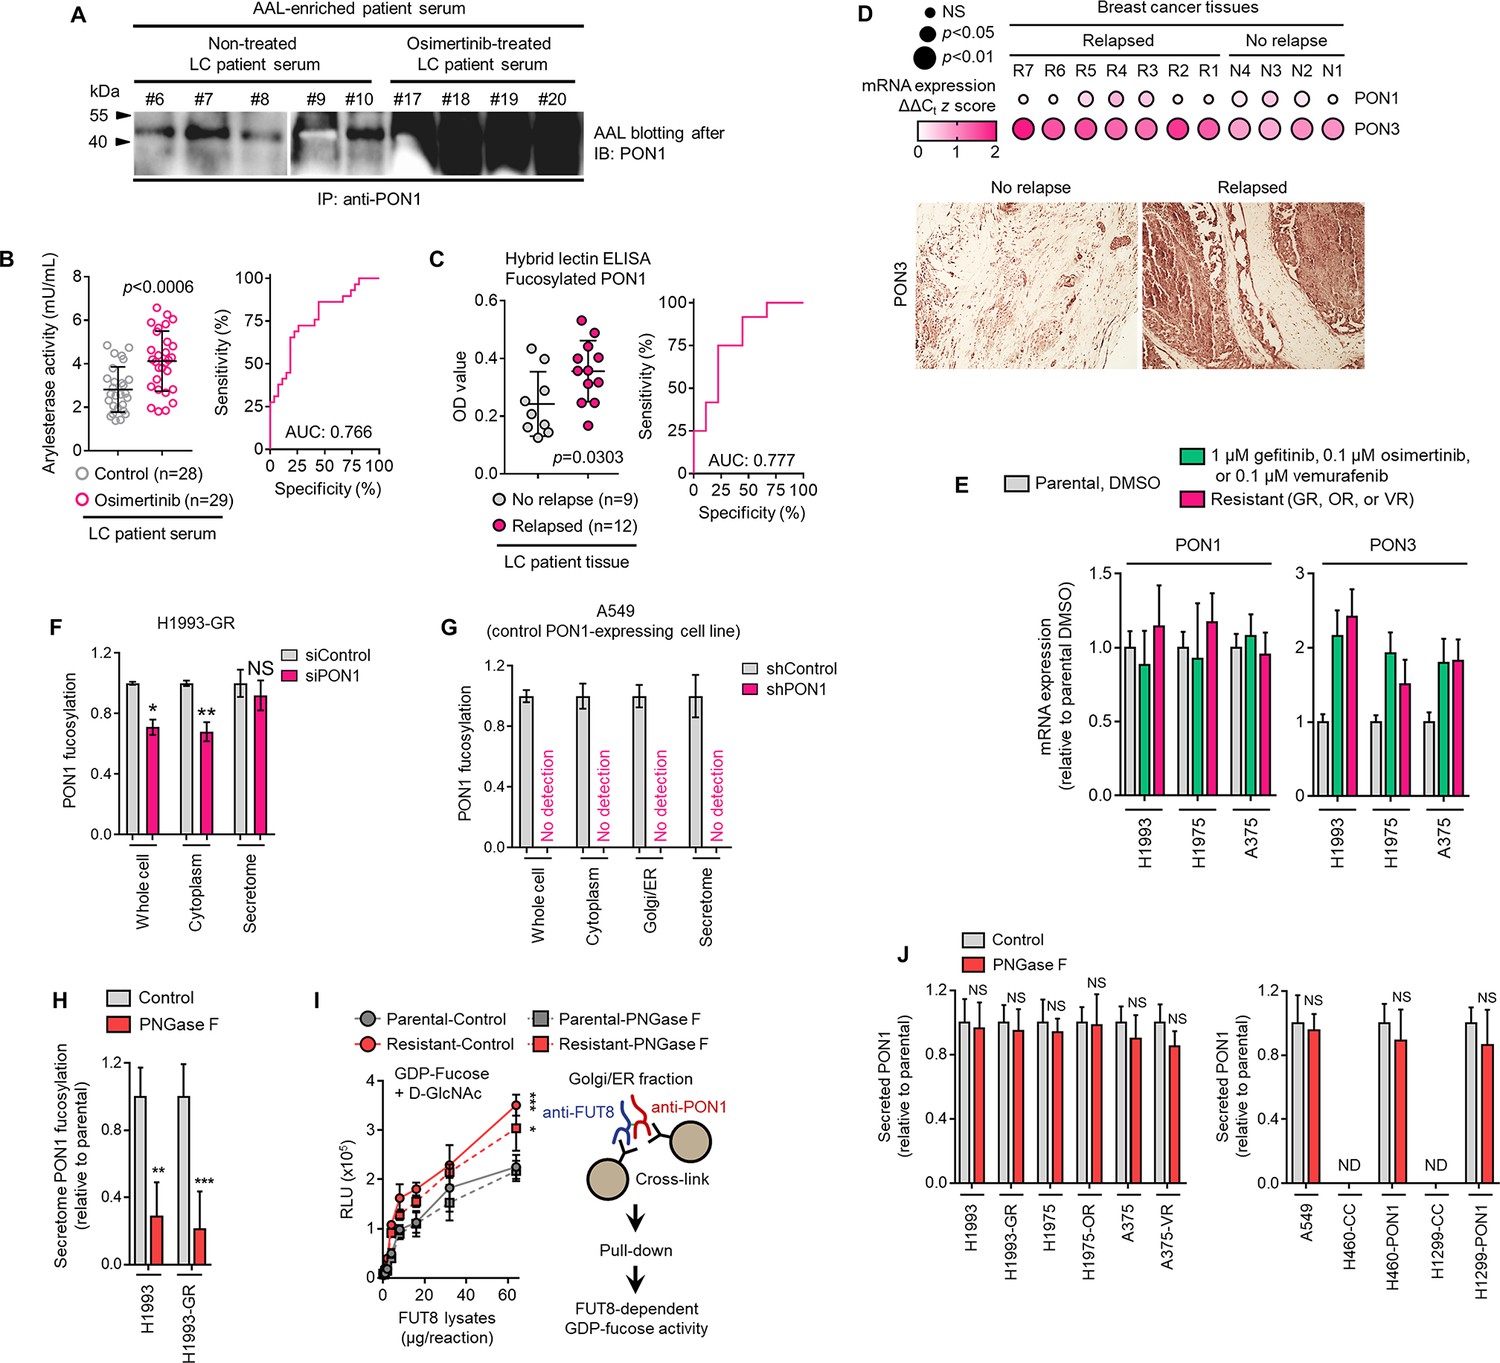
(A) Quantification of arylesterase activity in indicated crude patient sera. Values indicate mean absorbance at 217 nm from three replicates. Representative of two independent experiments. ROC curve for PON1 arylesterase activity is also shown. For statistical analysis, two-tailed Mann–Whitney U test was used. (B) HLE analysis of PON1 fucosylation in indicated tumor tissues from patients with lung cancer who underwent first-line therapy. Representative of two independent experiments. ROC curve for PON1 fucosylation is also shown. For statistical analysis, two-tailed Mann–Whitney U test was used. (C) Dot plot visualization of PON1 and PON3 gene expression by qPCR analysis in indicated FFPE tumor tissue sections from patients with breast cancer who underwent sequential multidrug therapy. Color indicates log-transformed fold change values relative to the non-relapsed sample with lowest expression for the indicated gene (not displayed in the heatmap) and normalized to GAPDH levels (means ± SD of three biological replicates) while size indicates p values; Student’s t-test. NS, not significant. Bottom panel shows PON3 immunohistochemical analysis of indicated tumor sections. All sections were photographed with an inverted phase-contrast microscope (original magnification,×200). Representative of two independent experiments. (D) qPCR analysis of PON1 and PON3 expression in indicated cells or DR clones. Values are relative to DMSO or parental (means ± SD of two biological replicates). For statistical analysis, Student’s t-test was used. NS, not significant. (E) HLE analysis of PON1 fucosylation in secretomes derived from cells or GR clone incubated with or without 10 µg/mL recombinant PNGase F for 48 hr. Values are relative to non-treated (means ± SD of two biological replicates). **p<0.01, ***p<0.001, Student’s t-test. NS, not significant. (F) GDP-Fuc activity analysis of FUT8 in cross-linked FUT8 and PON1 co-immunoprecipitates from Golgi/ER fractionated H1993 or H1993-GR lysates. Prior to fractionation, cells were incubated with or without 10 µg/mL recombinant PNGase F for 48 hr. Values indicate luminescence units and are relative to control reaction (means ± SD of three biological replicates). *p<0.05, ***p<0.001, two-tailed Mann–Whitney U test. (G) ELISA analysis of PON1 in secretomes derived from sensitive cells, DR clones, WT or PON1-edited cells. Cells were incubated with or without 10 µg/mL recombinant PNGase F for 48 hr. Values are relative to non-treated (means ± SD of three biological replicates). For statistical analysis, Student’s t-test was used. NS, not significant.
Figure 3—figure supplement 3
Transcriptional regulation of PON3 directly impacts targeted therapy-induced core fucosylation of PON1 scaffolds in the golgi prior to secretion.
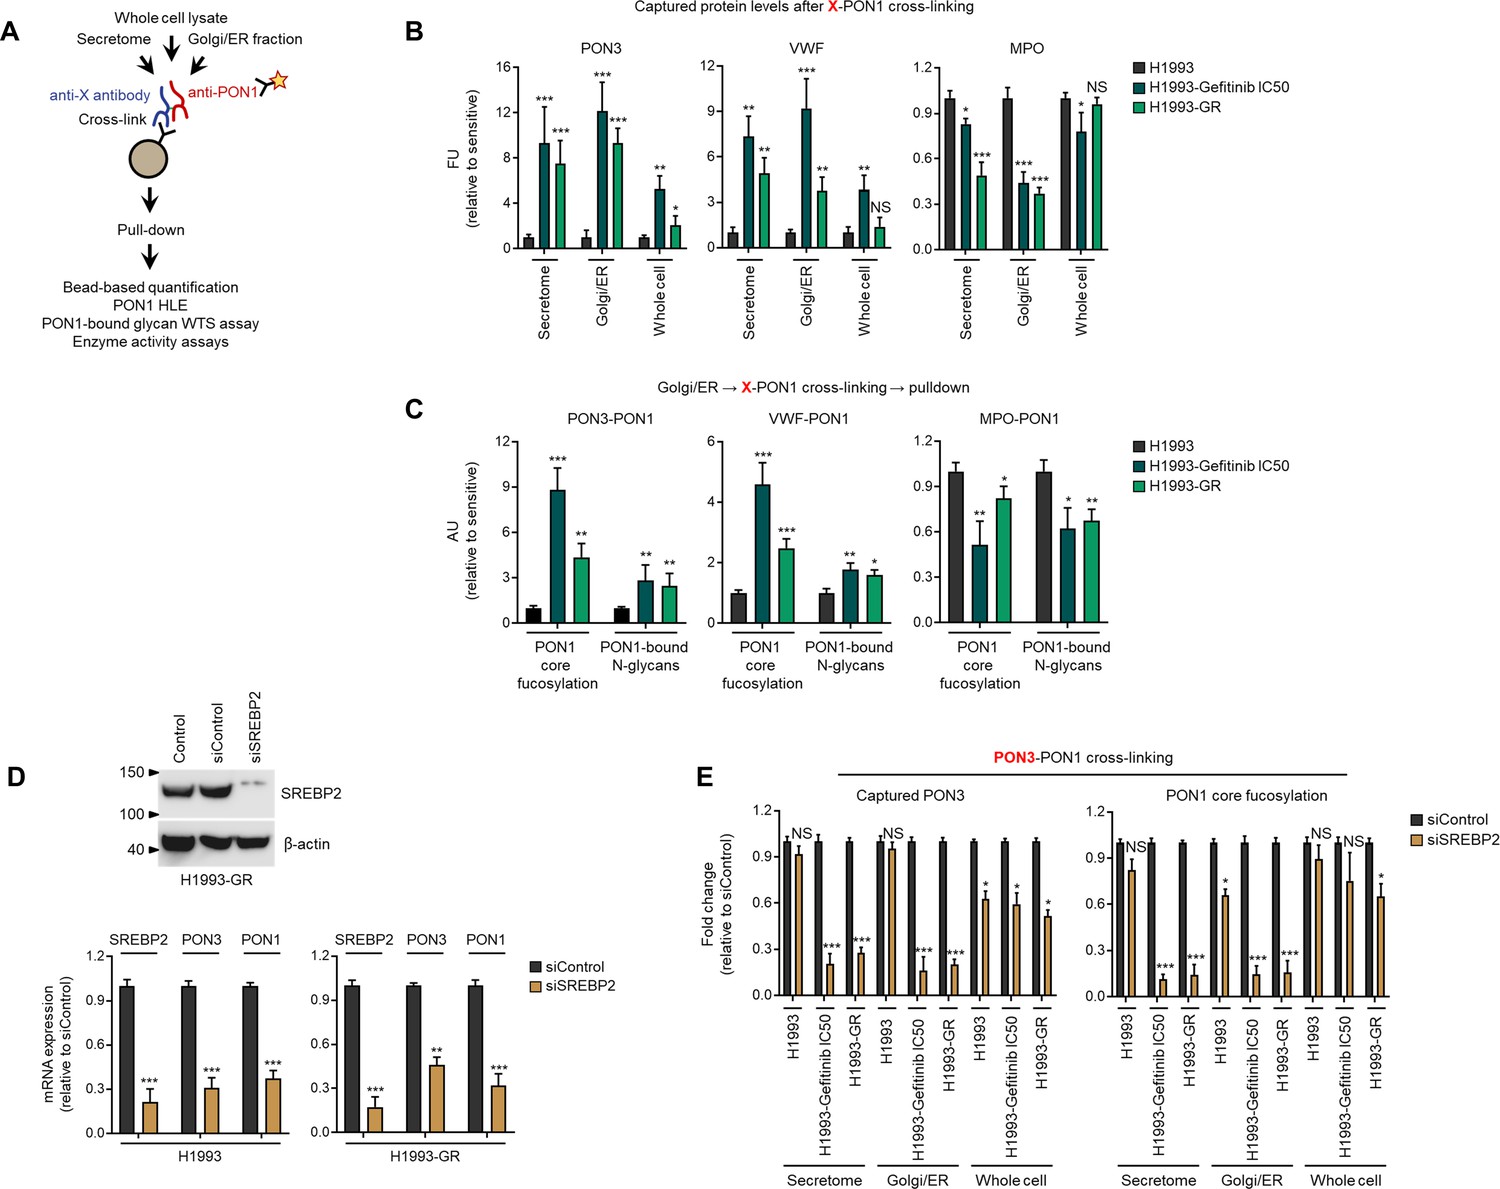
(A) Schematic of multivariate cross-linking–mediated coimmunoprecipitation procedure adopted. (B) Quantification of indicated protein found in PON1-linked complexes assed by direct ELISA from indicated cross-linked fractionated lysates of indicated cells or DR clones. Values indicate fluorescence units (FU) relative to parental sensitive (means ± SD of two biological replicates). *p<0.0 5, **p<0.01, ***p<0.001, Student’s t-test. NS, not significant. (C) Characterization of PON1 core fucosylation by HLE and quantification of PON1-bound N-glycans in PON1-PON3, PON1-VWF, and PON1-MPO linked complexes from cross-linked golgi lysates of indicated cells or DR clones. Values are plotted as arbitrary units (AU) relative to parental sensitive (means ± SD of two biological replicates). *p<0.05, **p<0.01, ***p<0.001, Student’s t-test. (D) Immunoblot analysis of SREBP2 expression in indicated H1993-GR clone upon SREBP2 RNAi for 48 hr. Representative of two independent experiments. Below shows qPCR analysis of SREBP2, PON3, and PON1 expression in indicated cells or DR clones upon SREBP2 RNAi for 48 hr. Values are relative to siControl (means ± SD of two biological replicates). *p<0.05, **p<0.01, ***p<0.001, Student’s t-test. (E) Characterization of PON1 core fucosylation by HLE and quantification of captured PON3 by direct ELISA in PON1-linked complexes from cross-linked fractionated lysates of indicated cells or DR clones upon SREBP2 RNAi for 48 hr. Values are relative to siControl (means ± SD of two biological replicates). *p<0.05, **p<0.01, ***p<0.001, Student’s t-test.
Figure 4 with 3 supplements
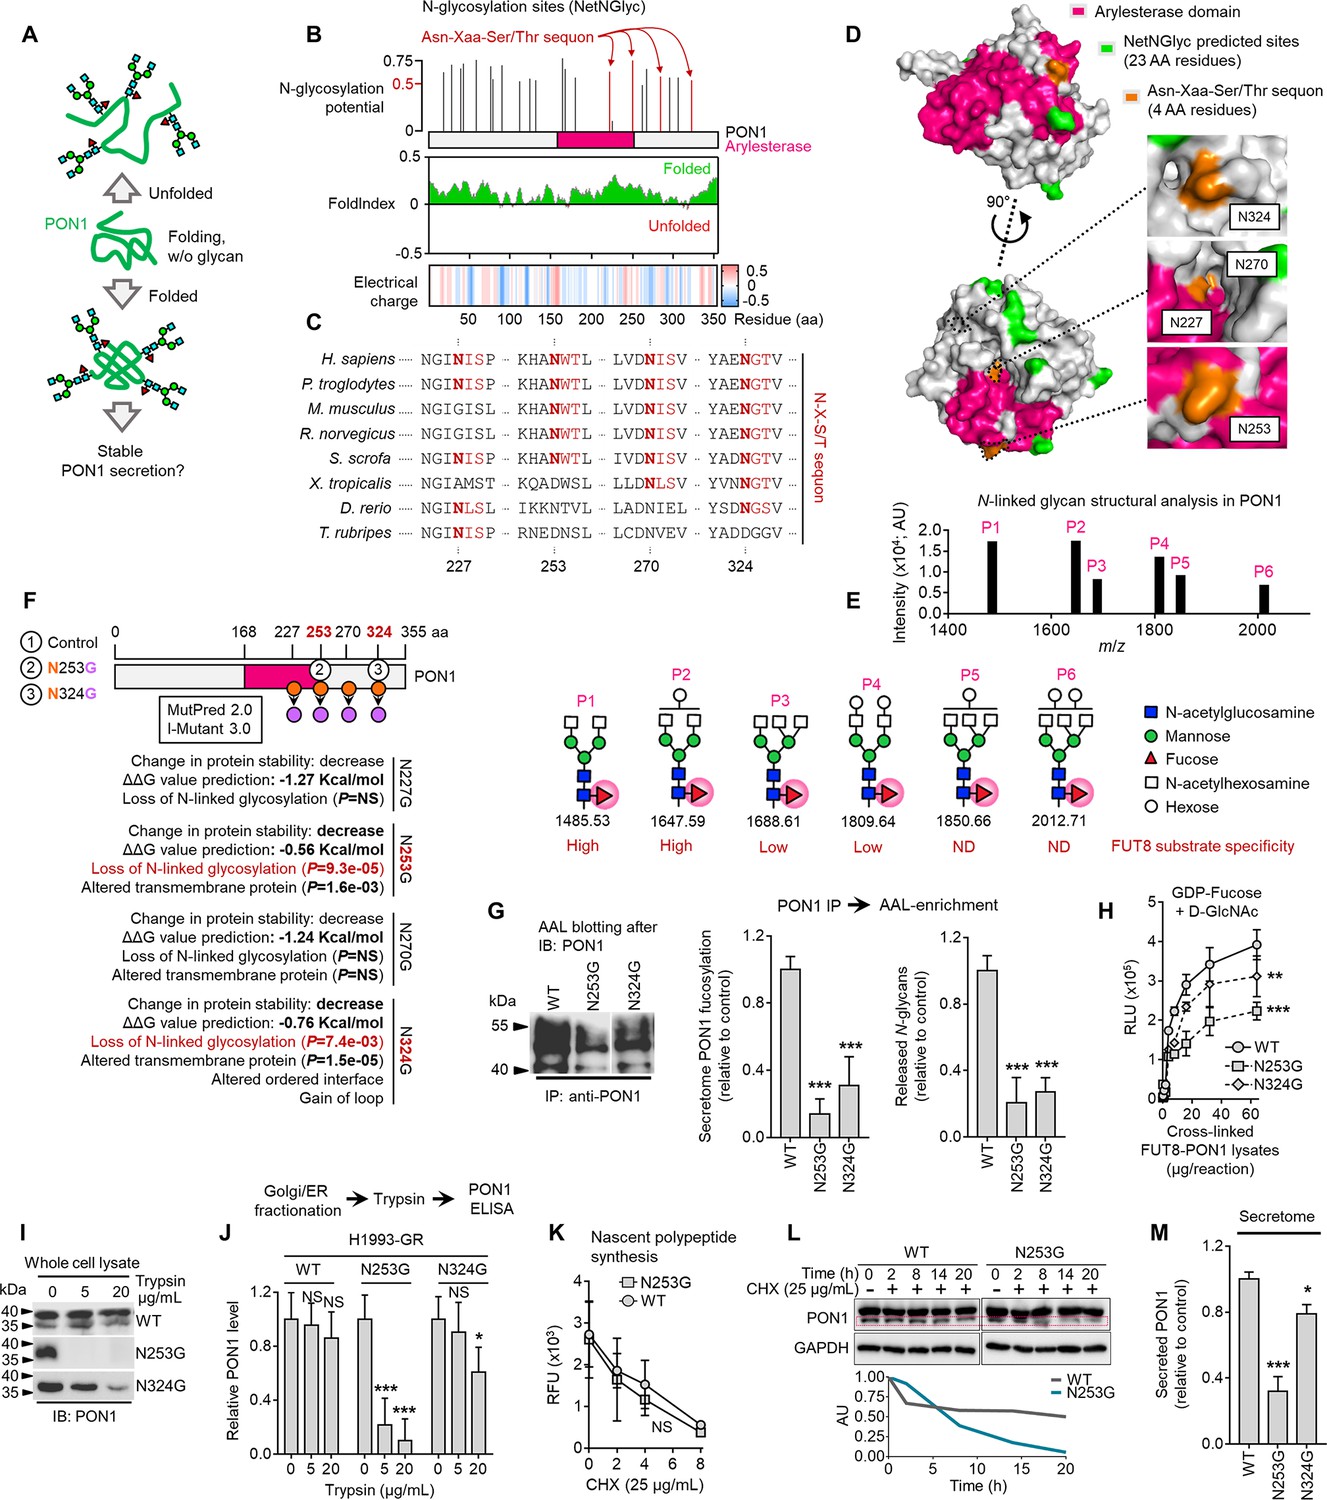
Core fucosylation impacts PON1 folding and stability prior to secretion in therapy-resistant cancer cells.
(A) Hypothetical model of N-glycosylation control of PON1 stability. (B) PON1-WT N-glycosylation site prediction using NetNGlyc 1.0, folding prediction using FoldIndex, and charge prediction using EMBOSS.>0.5 threshold score means significant glycosylation potential. Unfolded regions are depicted in red, folded regions in green. Positive charged is marked in red shades, negative charge in blue, and neutral charge in white. (C) Conservation of indicated PON1 sequons throughout species. (D) Closed conformation surface structure of PON1 (PDB ID: 1V04) highlighting arylesterase domain and predicted N-glycosylation sites and sequons. The 3D surface view was visualized using PyMOL. (E) N-glycan structural analysis of PON1 from our previous tandem MS/MS dataset. The m/z 1647.62 [(M+Na)+corresponding to GlcNAc2Man3+HexNAc2Hex1Fuc1] is the base peak (not visualized). Putative structure visualization of indicated monosaccharides and FUT8 substrate specificity were based on CID data and known glycobiology. (F) Prediction of PON1 stability, structural and functional properties upon indicated in silico N→G substitution at specific sequons using MutPred 2.0 and I-Mutant 3.0. Two N→G substituted sequons (N253G and N324G) with statistically significant potential of loss of N-glycosylation were chosen for validation experiments. (G) AAL blot analysis of PON1 immunoprecipitates from H1993-GR upon transfection with indicated PON1-WT, PON1-N253G, or PON1-N324G constructs for 36 hr. Representative of two independent experiments. Beside shows HLE analysis of secretome PON1 fucosylation and N-glycan release assay in AAL-enriched PON1 immunoprecipitates from H1993-GR upon similar transfection. Values are relative to PON1-WT (means ± SD of three biological replicates). ***p<0.001, Student’s t-test. (H) GDP-Fuc activity analysis of FUT8 in cross-linked FUT8 and PON1 co-immunoprecipitates from H1993-GR upon transfection with constructs as in G. Values indicate luminescence units and are relative to control reaction (means ± SD of three biological replicates). **p<0.01, ***p<0.001, two-tailed Mann–Whitney U test. (I) Immunoblot analysis of PON1 expression in H1993-GR upon transfection with constructs as in G. Lysates were exogenously treated with or without indicated trypsin concentration. Representative of two independent experiments. (J) ELISA analysis of PON1 expression in H1993-GR upon transfection with constructs as in G. Golgi/ER fractionated cell lysates were exogenously treated with or without indicated trypsin concentrations. Values are relative to no treatment (means ± SD of three biological replicates). *p<0.05, **p<0.01, ***p<0.001, Student’s t-test. NS, not significant. (K) EZClick labeling analysis of polypeptide synthesis in H1993-GR upon transfection with constructs as in G and treated with or without 25 µg/mL CHX concentrations for indicated times. Values indicate raw fluorescence units (means ± SD of two biological replicates). For statistical analysis, Student’s t-test was used. NS, not significant. (L) Immunoblot analysis of PON1 expression in H1993-GR upon transfection with constructs as in G and treated with or without 25 µg/mL CHX for indicated times. GAPDH was used as a loading control. Blot intensity quantification of the lower PON1 kDa isoform is shown. Representative of two independent experiments. (M) ELISA analysis of secretome PON1 expression in H1993-GR upon transfection with constructs as in G. Values are relative to WT (means ± SD of three biological replicates). *p<0.05, ***p<0.001, Student’s t-test.
-
Figure 4—source data 1
Uncropped blots and gels (labeled and unlabeled) for Figure 4G, I and L.
- https://cdn.elifesciences.org/articles/75191/elife-75191-fig4-data1-v2.zip
-
Figure 4—source data 2
Uncropped gels (labeled and unlabeled) for Figure 4—figure supplement 1B and D, 1 G, and 1 H.
- https://cdn.elifesciences.org/articles/75191/elife-75191-fig4-data2-v2.zip
Figure 4—figure supplement 1
Core fucosylation directs PON1 secretory process in DR clones and PON1-overexpressing cells.
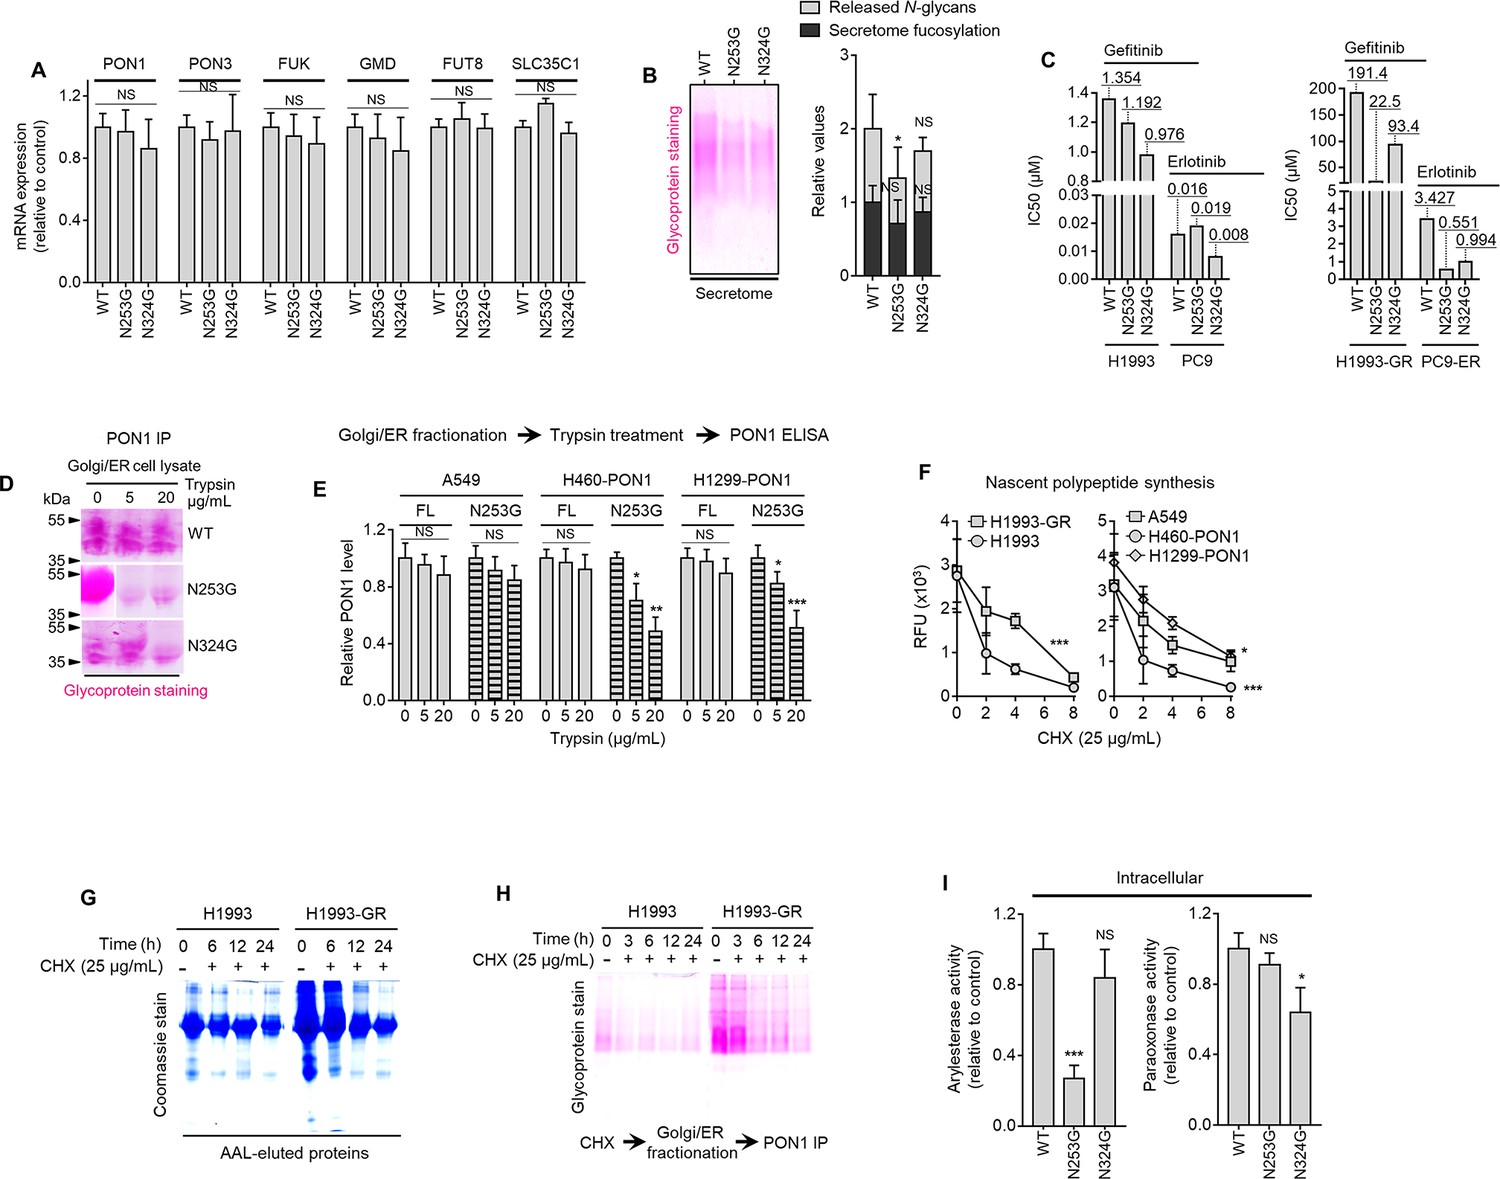
(A) qPCR analysis of indicated gene expression in indicated sensitive cells or DR clones. Cells were transfected with PON1-WT or mutant PON1 constructs for 36 hr. Values are relative to WT (means ± SD of three biological replicates). For statistical analysis, Student’s t-test was used. NS, not significant. (B) Characterization of secretome fucosylation by glycoprotein staining, sandwich ELLA, and N-glycan release assay in H1993-GR transfected with PON1-WT or mutant PON1 constructs for 36 hr. Values are relative to WT (means ± SD of three biological replicates). *p<0.05, Student’s t-test. NS, not significant. (C) Drug sensitivity assays in indicated sensitive cells or DR clones. Cells were transfected with PON1-WT or mutant PON1 constructs for 36 hr and treated with or without indicated drugs for 72 hr with a concentration dilution series and were assayed for SRB. Representative of three independent experiments. (D) Glycoprotein staining of PON1 immunoprecipitates from Golgi/ER fractionated H1993-GR lysates upon exogenous treatment with or without indicated trypsin concentrations. Prior to fractionation, cells were transfected with PON1-WT or mutant PON1 constructs for 36 hr. Representative of two independent experiments. (E) ELISA analysis of PON1 expression in indicated WT or PON1-edited cells upon transfections with PON1-WT or mutant PON1 constructs for 36 hr. Golgi/ER fractionated cell lysates were exogenously treated with or without indicated trypsin concentrations. Values are relative to no treatment (means ± SD of three biological replicates). *p<0.05, **p<0.01, ***p<0.001, Student’s t-test. NS, not significant. (F) EZClick labeling analysis of polypeptide synthesis in indicated cells, DR clones, WT or PON1-edited cells treated with or without 25 µg/mL CHX for indicated times. Values indicate raw fluorescence units (means ± SD of two biological replicates). *p<0.05, ***p<0.001, Student’s t-test. NS, not significant. (G) Representative Coomassie stained SDS-PAGE gels showing fucosylated secretome proteins from indicated cells or GR clone treated with or without 25 µg/mL CHX for indicated times. Secretomes were concentrated using a>3 kDa NMWL filter. (H) Glycoprotein staining of PON1 immunoprecipitates from Golgi/ER fractionated H1993 or H1993-GR lysates. Prior to fractionation, cells were treated with or without 25 µg/mL CHX for indicated times. Secretomes were concentrated using a>10 kDa NMWL filter. Representative of two independent experiments. (I) Quantification of intracellular arylesterase and paraoxonase activities in H1993-GR transfected with PON1-WT or mutant PON1 constructs. Values indicate mean fluorescence units at 217 and 412 nm, respectively (means ± SD of three biological replicates). *p<0.05, ***p<0.001, Student’s t-test. NS, not significant.
Figure 4—figure supplement 2
PON1 secretome fucosylation promotes TIS-induced resistance rebound in regressing cell admixtures.
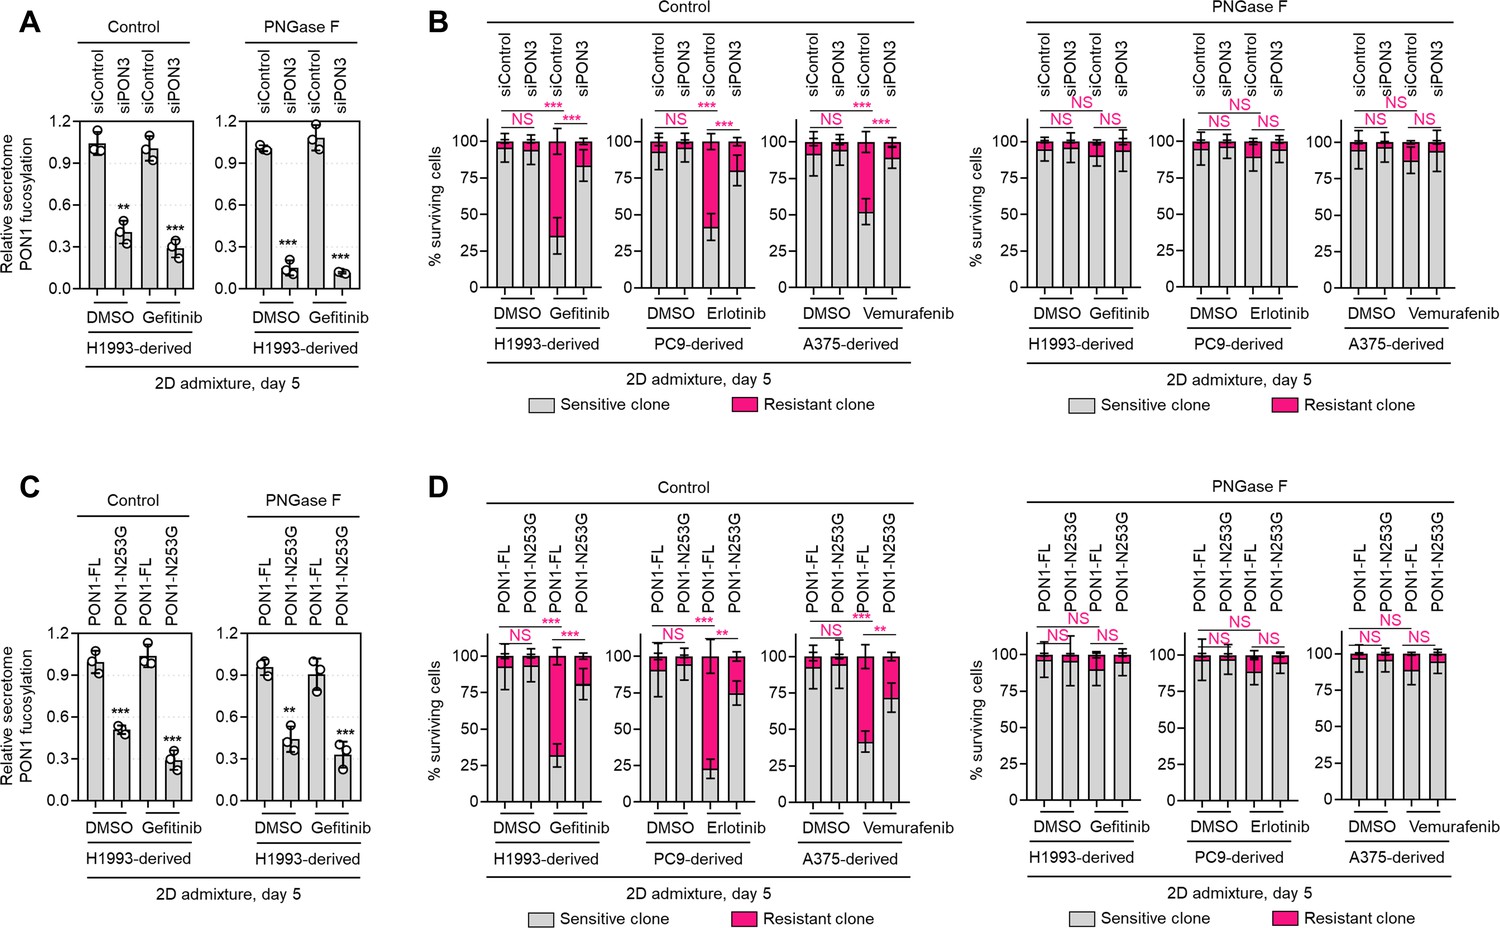
(A) HLE analysis of secretome PON1 fucosylation in indicated day 5 H1993 cell admixtures prepared as in Figure 2A. Prior to admixture, sensitive cells were transfected with PON3 RNAi for 48 hr. Cell admixtures were treated with or without 1 µM gefitinib and incubated with or without 10 µg/mL recombinant PNGase F. Values are relative to siControl (means ± SD of three biological replicates). **p<0.01, ***p<0.001, Student’s t-test. (B) Similar tracking experiments as in Figure 2G, except upon PON3 RNAi in sensitive cells for 48 hr prior to admixing and culture for 5 days. H1993 admixture was treated with or without 1 µM gefitinib, PC9 admixture was treated with or without 0.1 µM erlotinib, and A375 admixture was treated with or without 0.1 µM vemurafenib. Cell admixtures were incubated with or without 10 µg/mL recombinant PNGase F. Values are relative to day 0 (means ± SD of two biological replicates). ***p<0.001, two-tailed Mann–Whitney U test. NS, not significant. (C) HLE analysis of secretome PON1 fucosylation in indicated day 5 H1993 cell admixtures as in A, except upon transfection with full-length PON1 or PON1-N253G construct for 36 hr in sensitive cells prior to admixing and culture for 5 days. Cell admixtures were treated with or without 1 µM gefitinib and incubated with or without 10 µg/mL recombinant PNGase F. Values are relative to siControl (means ± SD of three biological replicates). **p<0.01, ***p<0.001, Student’s t-test. (D) Similar tracking experiments as in Figure 2G, except upon transfection with full-length PON1 or PON1-N253G construct for 36 hr in sensitive cells prior to admixing and culture for 5 days. Cell admixtures were treated with or without 1 µM gefitinib and incubated with or without 10 µg/mL recombinant PNGase F. Values are relative to siControl (means ± SD of three biological replicates). **p<0.01, ***p<0.001, two-tailed Mann–Whitney U test. NS, not significant.
Figure 4—figure supplement 3
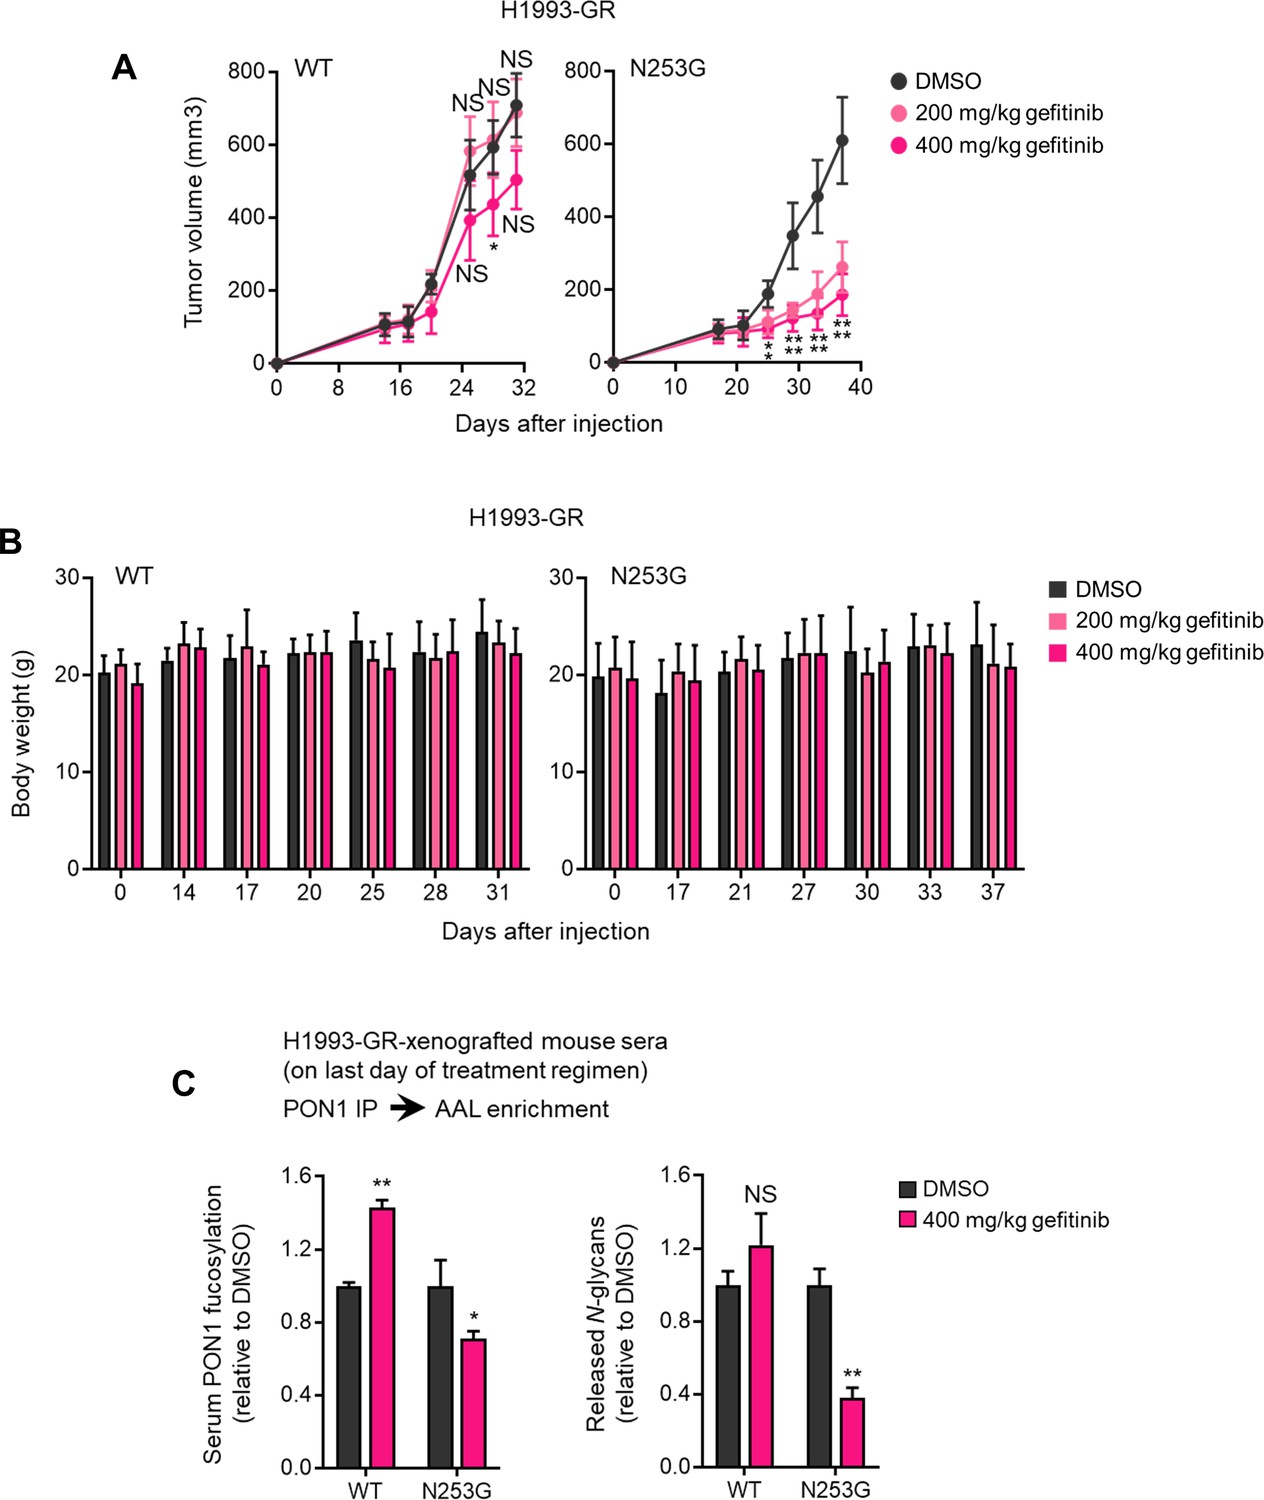
PON1-N253 sequon is important for drug resistance-promoting effect of targeted therapy-induced secretome PON1 fucosylation in vivo.
(A) Tumor growth of H1993-GR-derived PON1-WT and PON1-N253G cells upon subcutaneous injection into flanks of mice. Indicated doses of gefitinib was administered orally once daily 14 days. The control group was treated with an equal volume of DMSO vehicle. Tumor volume was measured using a digital caliper every 2~5 days and indicated time points were selected plotting (mean ± SD; n=6 mice, n=12 tumors per group). *p<0.05, **p<0.01, ***p<0.001, two-tailed Mann–Whitney U test. NS, not significant. (B) Body weight measurements at indicated time points corresponding xenograft mice as in A (mean ± SD; n=6 mice per group). (C) Characterization of PON1 core fucosylation by HLE and quantification of PON1-bound N-glycans in AAL-enriched serum PON1 immunoprecipitates from indicated xenograft mouse on the last day of treatment with or without 400 mg/kg gefitinib as in A. Values are relative to DMSO vehicle (mean ± SD; n=6 mice, n=12 tumors per group). *p<0.05, **p<0.01, two-tailed Mann–Whitney U test. NS, not significant.
Figure 5 with 2 supplements
Secretome PON1 fucosylation promotes resistance via neutralization of inflammatory response and ROS.
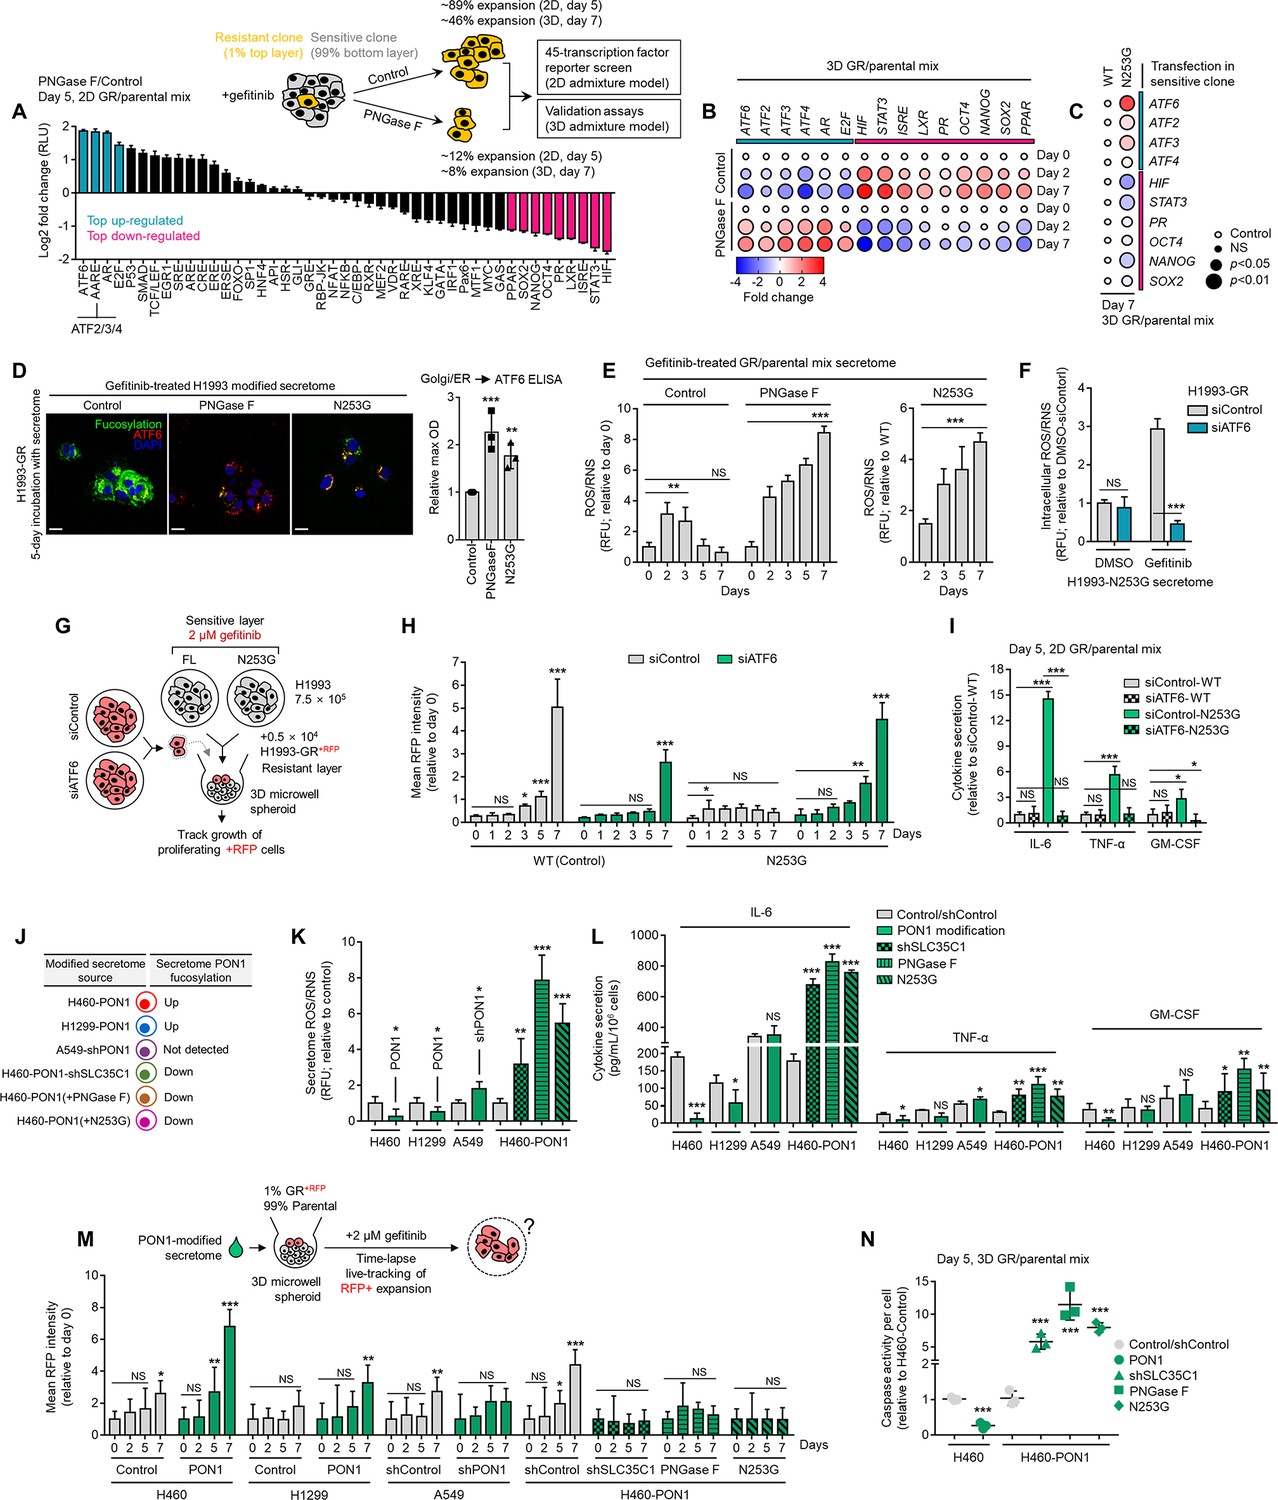
(A) Cignal 45-pathway array of reporter transcriptional activities in indicated cell admixtures treated with 1 µM gefitinib and incubated with or without 10 µg/mL recombinant PNGase F for 5 days. The reporter array is based on a dual-luciferase system that measures the activity of indicated 45 transcription factors. Log2 values were normalized by control condition and represented as fold changes in luciferase units (means ± SD of two biological replicates). Highlighted top up-/down-regulated hits are all statistically significant (p<0.001, Dunnett’s test). (B) Dot plot visualization of indicated gene expression by qPCR analysis in 3D cell admixtures with the same conditions as in A, except treated with 2 µM gefitinib for 2 or 5 days. Color indicates log-transformed fold change values relative to day 0 control and normalized to GAPDH levels (means ± SD of three biological replicates) while size indicates p values; Student’s t-test. NS, not significant. (C) Dot plot visualization of indicated gene expression by qPCR analysis in 3D cell admixtures with same conditions as in B upon transfection with PON1-WT or PON1-N253G construct for 36 hr. Color indicates log-transformed fold change values relative to WT control and normalized to GAPDH levels (means ± SD of three biological replicates) while size indicates p values; Student’s t-test. NS, not significant. (D) Representative confocal images of H1993-GR grown for 5 days in indicated secretomes from 1 µM gefitinib-treated H1993 cells exogenously treated with total 8 U PNGase F or transfected with PON1-WT or PON1-N253G construct for 36 hr. GR clones were stained for fluorescein-conjugated AAL (core fucosylation; green), ATF6 (red), and DAPI (nuclei; blue). Beside shows ELISA analysis of ATF6 expression in Golgi/ER fractionated H1993-GR with the same conditions. Values are relative to WT (means ± SD of three biological replicates). **p<0.01, ***p<0.001, Student’s t-test. (E) ROS/RNS detection in secretomes from 1 µM gefitinib-treated cell admixtures as in A or C. Values are relative to day 0 or WT (means ± SD of two biological replicates). **p<0.01, ***p<0.001, Student’s t-test. NS, not significant. (F) Intracellular ROS/RNS detection in H1993-GR upon ATF6 RNAi for 48 hr and grown in secretomes from PON1-N253G-transfected H1993 cells treated with or without 1 µM gefitinib for 72 hr. Values are relative to DMSO siControl (means ± SD of two biological replicates). ***p<0.001, Student’s t-test. NS, not significant. (G) Schematic of sequentially layered admixture. (H) Tracking of RFP-tagged H1993-GR upon ATF6 RNAi in 3D cell admixtures as in G. Sensitive cells were transfected with PON1-WT or PON1-N253G for 36 hr. Values are relative to day 0 (means ± SD of two biological replicates). *p<0.05, **p<0.01, ***p<0.001, two-tailed Mann–Whitney U test. NS, not significant. (I) Sandwich ELISA analysis of indicated cytokines in secretomes from cell admixtures prepared as in D, except in 2D. Values are relative to siControl WT (means ± SD of two biological replicates). *P<0.05, ***P<0.001, Student’s t-test. NS, not significant. (J) Modified secretomes from PON1-edited cells with varying PON1 fucosylation. (K) ROS/RNS detection in secretomes described as in J. Values are relative to control (means ± SD of three biological replicates). *p<0.05, **p<0.01, ***p<0.001, Student’s t-test. (L) Sandwich ELISA analysis pf indicated cytokines in secretomes described as in J. Values are relative to control/shControl (means ± SD of two biological replicates). *p<0.05, **p<0.01, ***p<0.001, Student’s t-test. NS, not significant. (M) Tracking of RFP-tagged H1993-GR in 3D cell admixtures described in the schematic. Admixtures were grown in secretomes described as in J. Values are relative to day 0 (means ± SD of two biological replicates). *p<0.05, **p<0.01, ***p<0.001, two-tailed Mann–Whitney U test. NS, not significant. (N) Caspase activity analysis in 3D cell admixtures as in M and grown in secretomes described as in J for 5 days. Values are relative to control/shControl (means ± SD of two biological replicates). ***<0.001, Student’s t-test.
-
Figure 5—source data 1
Uncropped blots (labeled and unlabeled) for Figure 5—figure supplement 1D.
- https://cdn.elifesciences.org/articles/75191/elife-75191-fig5-data1-v2.zip
Figure 5—figure supplement 1
Inhibition of TIS-specific PON1 fucosylation prevents resistance rebound via suppression of kinase phospho-proteome and induction of UPR target genes.
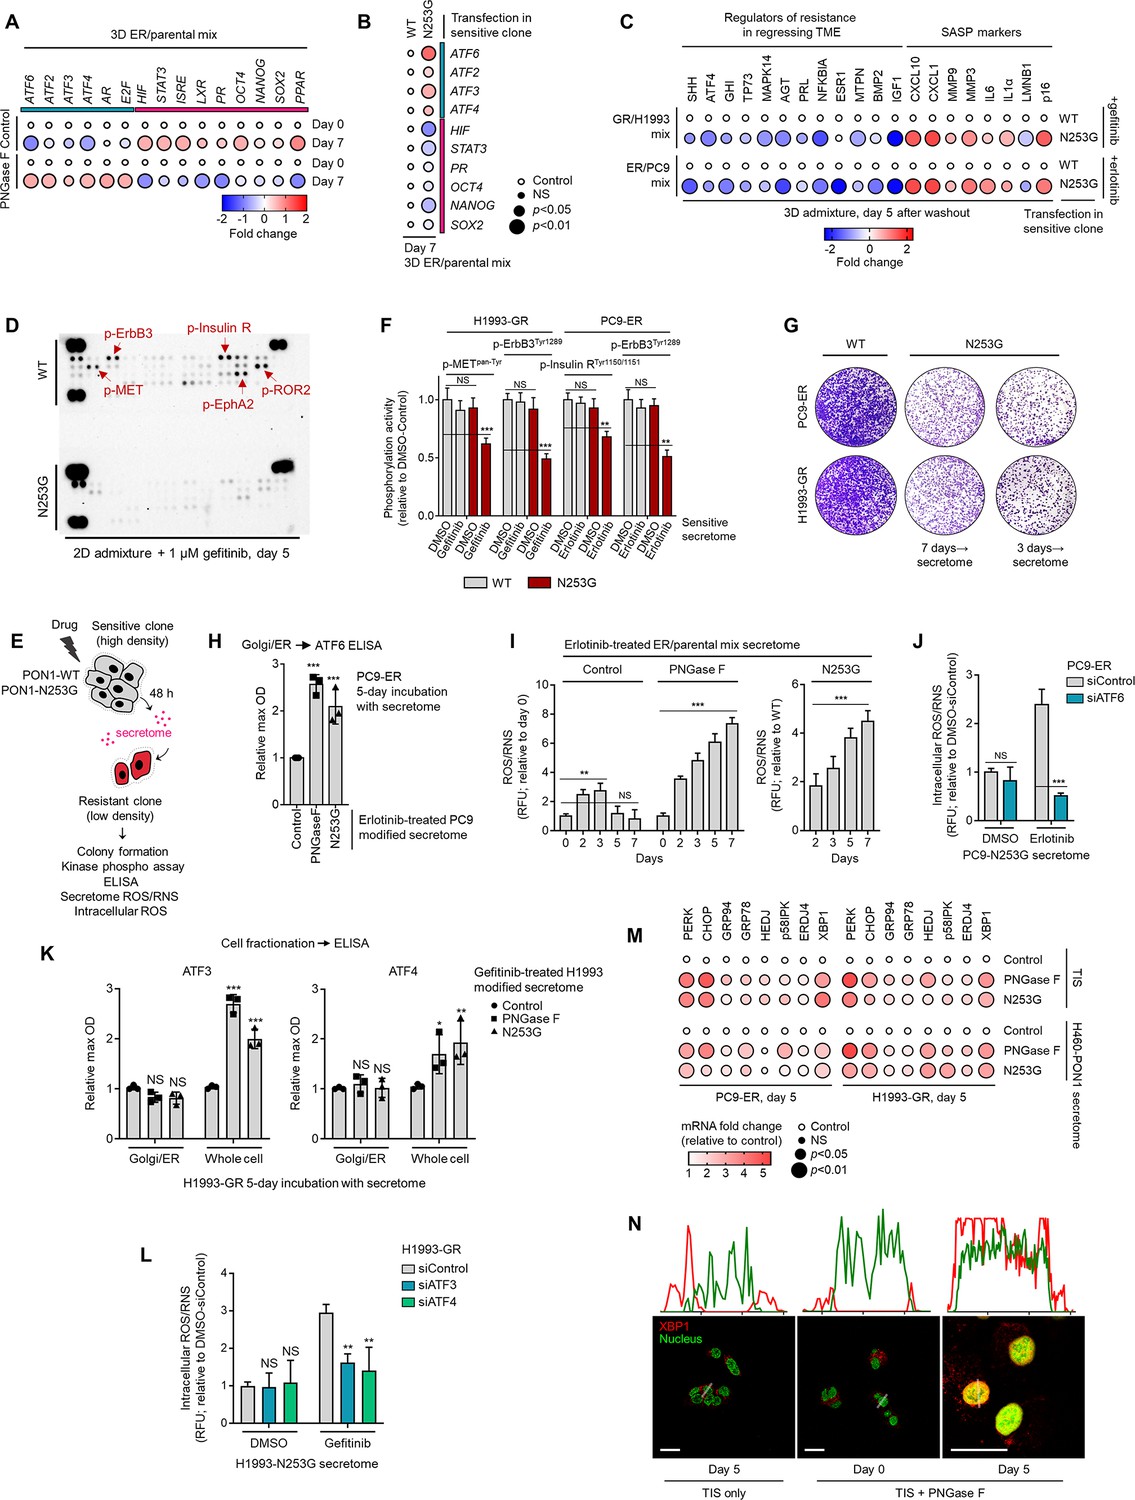
(A) Dot plot visualization of indicated gene expression by qPCR analysis in 3D cell admixtures with same conditions as in Figure 5A, except treated with or without 0.1 µM erlotinib for 7 days. Color indicates log-transformed fold change values relative to day 0 control and normalized to GAPDH levels (means ± SD of three biological replicates) while size indicates p values; Student’s t-test. NS, not significant. (B) Dot plot visualization of indicated gene expression by qPCR analysis in 3D cell admixtures with same conditions as in A upon transfection with PON1-WT or PON1-N253G construct for 36 hr and treatment with or without 0.1 µM erlotinib. Color indicates log-transformed fold change values relative to WT control and normalized to GAPDH levels (means ± SD of three biological replicates) while size indicates p values; Student’s t-test. NS, not significant. (C) Dot plot visualization of indicated gene expression by qPCR analysis in 3D cell admixtures with same conditions as in Figure 5A, except transfected with PON1-WT or PON1-N253G construct for 36 h and treated with 2 µM gefitinib or 0.1 µM erlotinib for 5 days. Color indicates log-transformed fold change values relative to WT control and normalized to GAPDH levels (means ± SD of three biological replicates) while size indicates p values; Student’s t-test. NS, not significant. (D) Phospho-RTK array of indicated 2D cell admixtures and conditions as in Figure 2G, except sensitive cells were transfected with PON1-WT or PON1-N253G construct for 36 hr. The blots reflect the phosphorylation status of 49 RTKs. Each RTK is spotted in duplicate, and the three pairs of dots in each corner are positive or negative controls. Representative of two independent experiments. (E) Schematic of CM co-culture. (F) ELISA sandwich-based measurement of indicated RTK phosphorylation in indicated DR clones prepared as in E. Values are relative to DMSO (means ± SD of three biological replicates). **p<0.01, ***p<0.001, Student’s t-test. NS, not significant. (G) Colony formation of indicated DR clones prepared as in E. Representative of two independent experiments. (H) ELISA analysis of ATF6 expression in Golgi/ER fractionated PC9-ER grown for 5 days in indicated secretomes from 0.1 µM erlotinib-treated PC9 cells exogenously treated with total 8 U PNGase F or transfected with PON1-WT or PON1-N253G construct for 36 hr as in E. Values are relative to WT (means ± SD of three biological replicates). ***p<0.001, Student’s t-test. (I) ROS/RNS detection in secretomes from 0.1 µM erlotinib-treated cell admixtures as in E, except at indicated times. Values are relative to WT (means ± SD of three biological replicates). **p<0.01, ***p<0.001, Student’s t-test. NS, not significant. (J) Intracellular ROS/RNS detection in PC9-ER upon ATF6 RNAi for 48 hr and grown in secretomes from PON1-N253G-transfected PC9 cells treated with or without 0.1 µM erlotinib for 72 hr. Values are relative to DMSO siControl (means ± SD of two biological replicates). ***p<0.001, Student’s t-test. NS, not significant. (K) ELISA analysis of ATF3 and ATF4 expression in whole cell or Golgi/ER fractionated H1993-GR grown for 5 days in indicated secretomes from 1 µM gefitinib-treated H1993 cells exogenously treated with total 8 U PNGase F or transfected with PON1-WT or PON1-N253G construct for 36 hr as in E. Values are relative to WT (means ± SD of three biological replicates). *p<0.05, **p<0.01, ***p<0.001, Student’s t-test. NS, not significant. (L) ROS/RNS detection in secretomes from 1 µM gefitinib-treated cell admixtures as in E, except at indicated times. Values are relative to WT (means ± SD of three biological replicates). **p<0.01, Student’s t-test. NS, not significant. (M) Dot plot visualization of indicated gene expression by qPCR analysis in 3D cell admixtures with same conditions as in Figure 5A, or admixtures grown in H460-PON1-derived secretomes. Sensitive cells were transfected with PON1-WT or PON1-N253G construct for 36 hr as in E; or incubated with or without 10 µg/mL recombinant PNGase F for 5 days. Color indicates fold change values relative to WT control and normalized to GAPDH levels (means ± SD of three biological replicates) while size indicates p values; Student’s t-test. NS, not significant. (N) Representative confocal images of H1993-GR grown for 5 days in indicated secretomes from 1 µM gefitinib-treated H1993 cells exogenously treated with or without total 8 U PNGase F. GR clones were stained for XBP1 (red) and DAPI (nuclei; green). Orientation to the imaging plane (white boxes) were analyzed by line profiles across each cell.
Figure 5—figure supplement 2
Validation of target gene control upon RNAi or stable overexpression in cells.
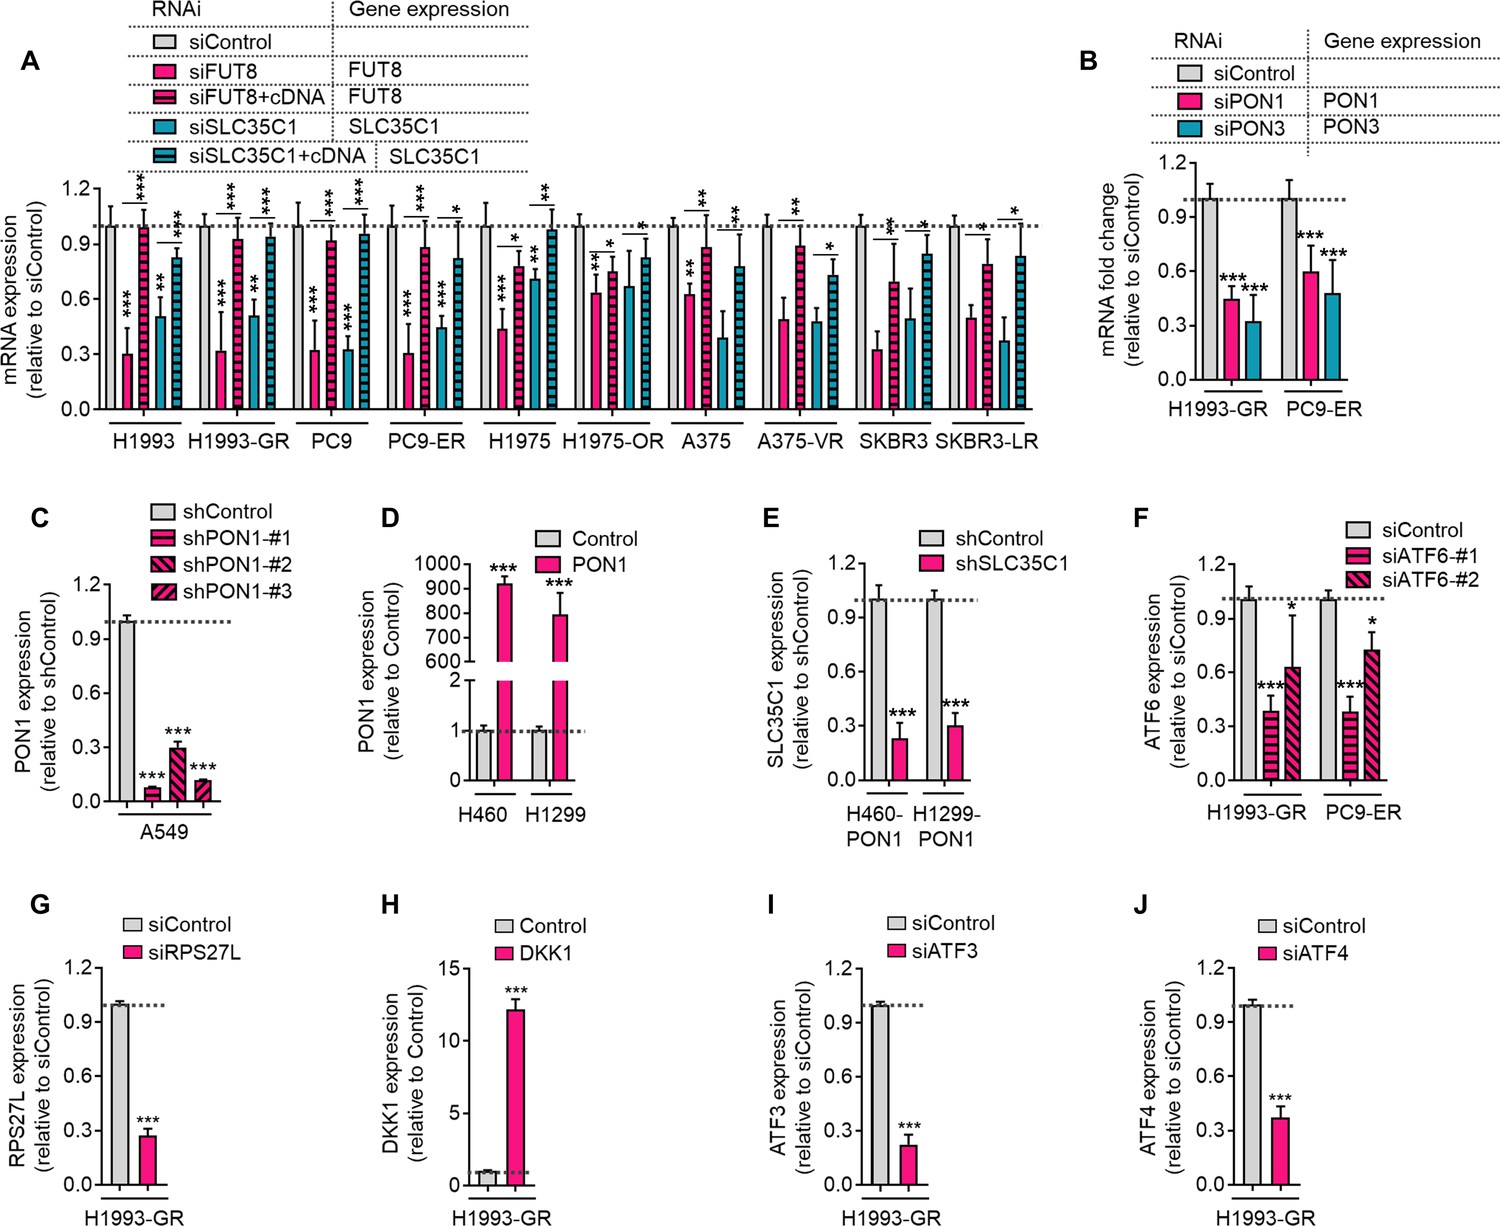
(A) qPCR analysis of FUT8 or SLC35C1 expression in indicated cells or DR clones upon indicated RNAi for 48 h. Values are relative to siControl (means ± SD of two biological replicates). *P<0.05, **P<0.01, ***P<0.001, Student’s t-test. (B) qPCR analysis of PON1 or PON3 expression in indicated DR clones upon indicated RNAi for 48 h. Values are relative to siControl (means ± SD of three biological replicates). ***P<0.001, Student’s t-test. (C) qPCR analysis of PON1 expression in A549 cells upon stable PON1 knockout. Values are relative to shControl (means ± SD of three biological replicates). *P<0.05, ***P<0.001, Student’s t-test. (D) qPCR analysis of PON1 expression in H460 or H1299 cells upon stable PON1 overexpression. Values are relative to control (means ± SD of three biological replicates). ***P<0.001, Student’s t-test. (E) qPCR analysis of PON1 expression in PON1-overexpressing H460 or H1299 cells upon stable SLC35C1 knockout. Values are relative to shControl (means ± SD of two biological replicates). ***P<0.001, Student’s t-test. (F) qPCR analysis of ATF6 expression in indicated DR clones upon ATF6 RNAi for 48 h. Values are relative to siControl (means ± SD of three biological replicates). *P<0.05, ***P<0.001, Student’s t-test. (G) qPCR analysis of RPS27L expression in H1993-GR clones upon RPS27L RNAi for 48 h. Values are relative to siControl (means ± SD of two biological replicates). ***P<0.001, Student’s t-test. (H) qPCR analysis of DKK1 expression in H1993-GR clones upon stable DKK1 overexpression. Values are relative to control (means ± SD of two biological replicates). ***P<0.001, Student’s t-test. (I) qPCR analysis of ATF3 expression in H1993-GR clones upon ATF3 RNAi for 48 h. Values are relative to siControl (means ± SD of two biological replicates). ***P<0.001, Student’s t-test. (J) qPCR analysis of ATF4 expression in H1993-GR clones upon ATF4 RNAi for 48 h. Values are relative to siControl (means ± SD of two biological replicates). ***P<0.001, Student’s t-test.
Figure 6 with 3 supplements
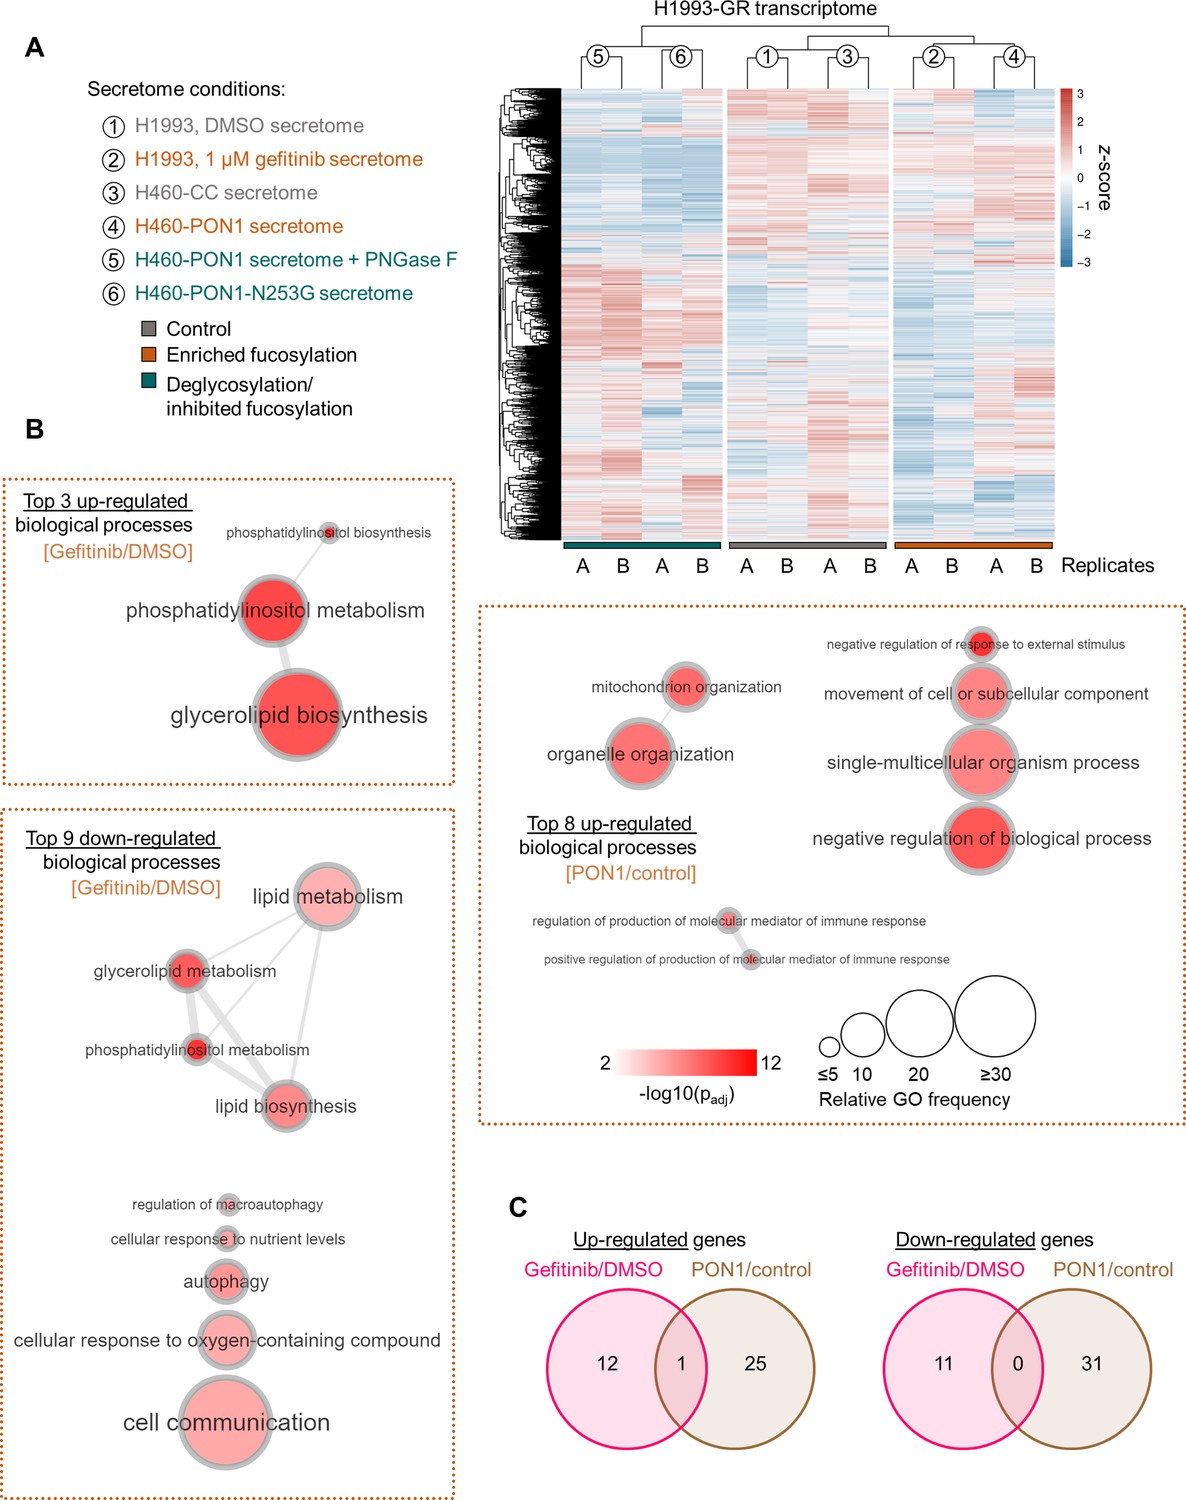
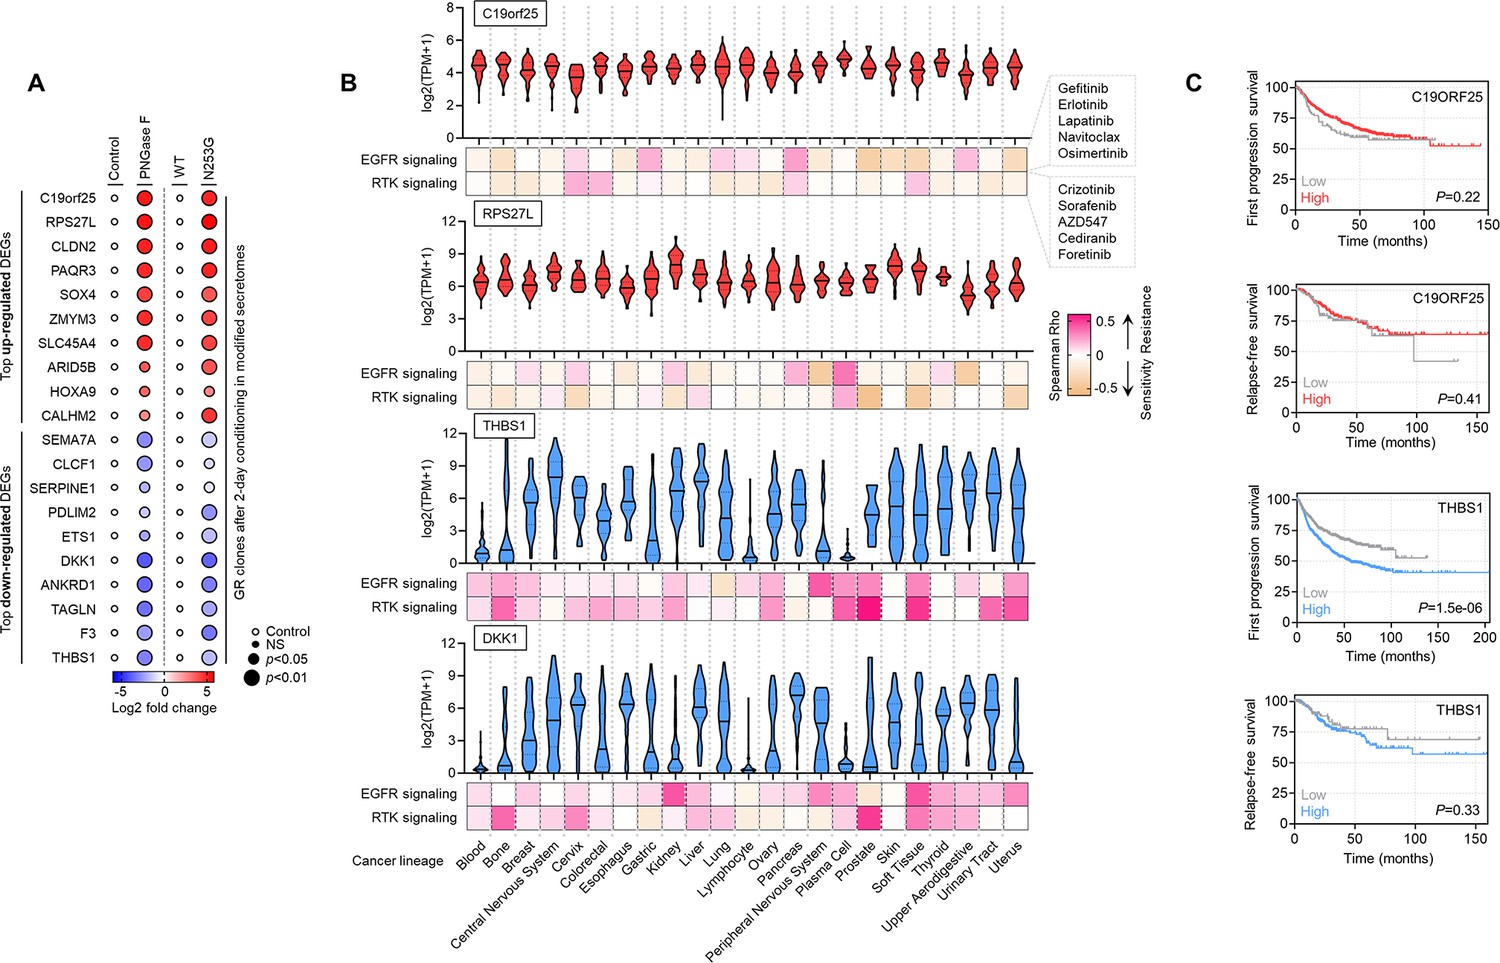
Transcriptome-wide analysis reveals modulator genes associated with secretome PON1 fucosylation-induced therapy resistance.
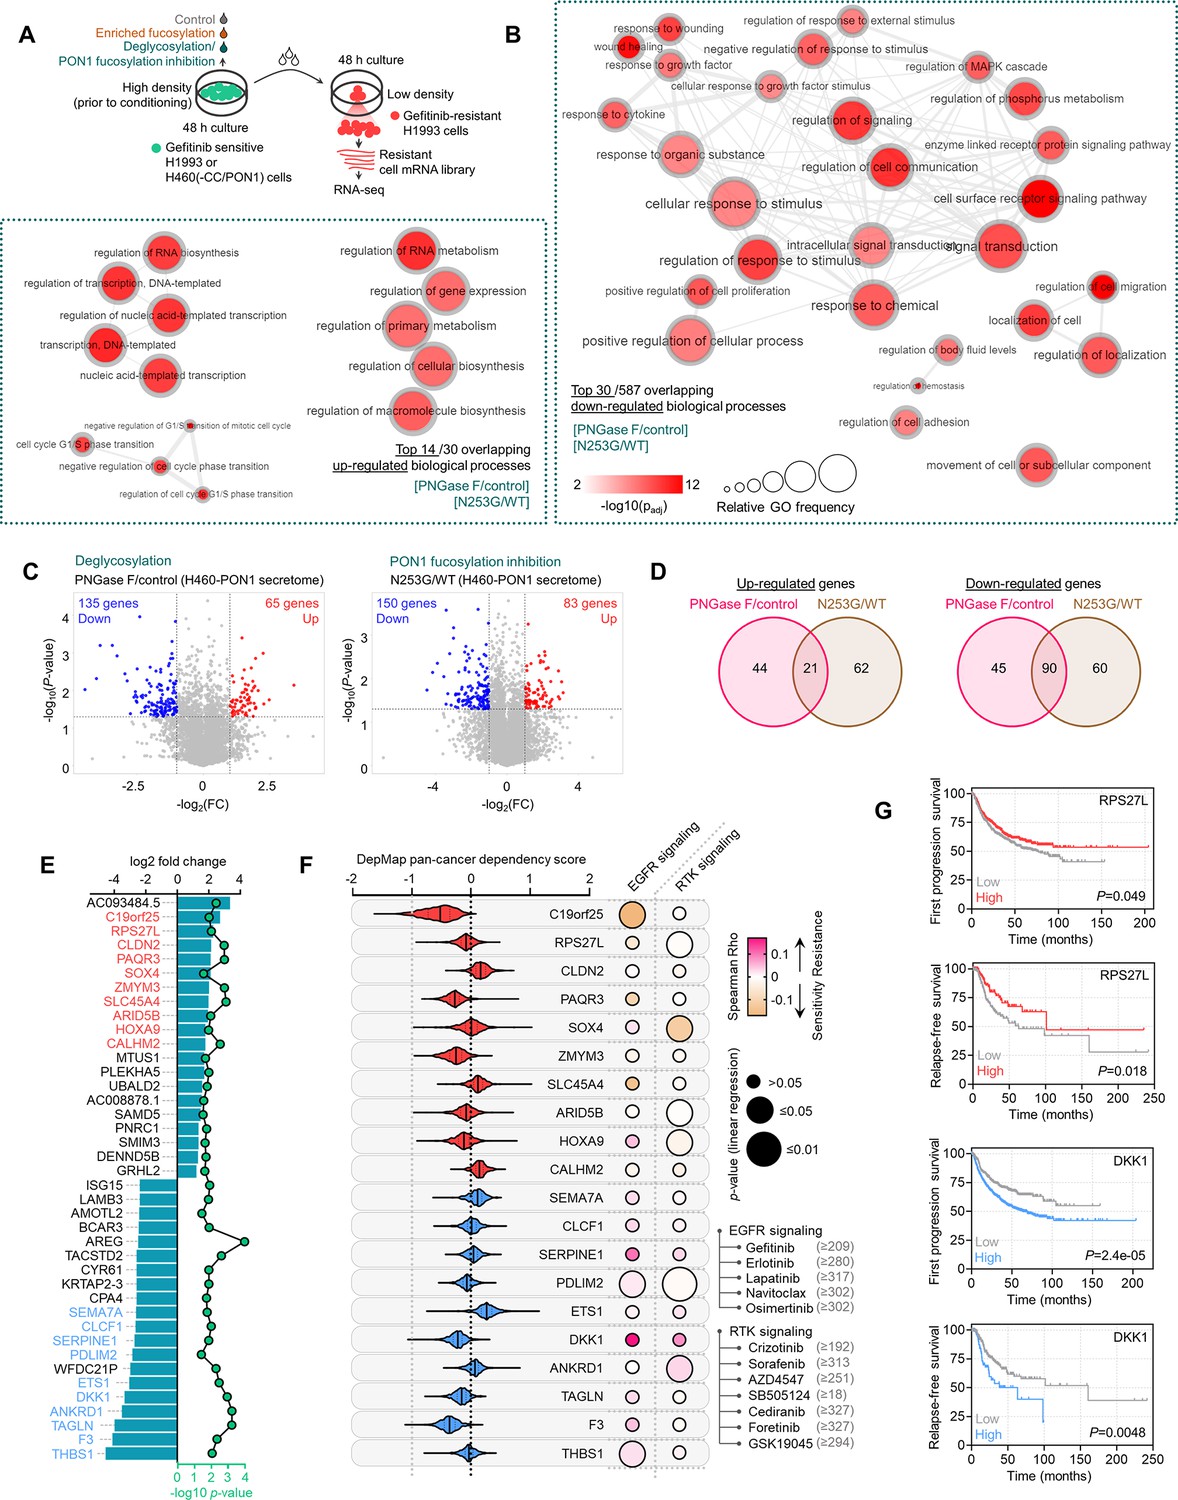
(A) Schematic of co-culture conditions and preparation of transcript library from H1993-GR for RNA-seq. (B) GO analysis of gene expression changes in H1993-GR grown in indicated conditions showing enriched GO terms. The size of the circle indicates the frequency of the GO term in the underlying GOA database while color indicates adjusted -log10 p-value. Highly similar GO terms are linked by edges in the graph, where the line width indicates the degree of similarity. (C) Volcano plots showing differentially expressed genes deregulated by indicated conditions. Significantly up-regulated genes are in red, while down-regulated genes in blue. (D) Venn diagram indicating overlap of up-regulated or down-regulated genes in indicated conditions. (E) Log2 fold changes and -log10 p values of indicated top 20 overlapped up-regulated or down-regulated genes in indicated conditions as in D. Data are means. p Values were calculated using a two-tailed Mann–Whitney U test. (F) Violin plots depicting dependency scores of indicated top differentially expressed genes from two conditions as in D. Scores reflect data from 23 different cancer lineages. Central lines indicate the median. Data was obtained from the DepMap RNAi screen. Beside shows plot visualization of the correlation between indicated pan-cancer gene dependency and drug response screened in GDSC. Size of circle refers to linear regression p-value while color corresponds to Spearman’s rank coefficients. (G) Kaplan-Meier plots of FP or RFS in multiple lung cancer patient cohorts. Patient survival data were stratified by indicated gene expression (low or high) in their primary tumors based on the microarray (FP) or RNA-seq (RFS) data. p Values were calculated using a log-rank test.
Figure 6—figure supplement 1
RNA-seq of DR clones cultured in PON1 fucosylation-modified secretomes.
(A) Heatmap of unsupervised hierarchical clustering from RNA-seq data. Gain and loss signatures correspond to all available genes identified that display indicated z-score. (B) GO analysis of gene expression changes in H1993-GR grown in indicated conditions showing enriched GO terms. Size of circle indicates frequency of the GO term in the underlying GOA database while color indicates adjusted -log10 p-value. Highly similar GO terms are linked by edges in the graph, where the line width indicates the degree of similarity. (C) Venn diagram indicating overlap of up-regulated or down-regulated genes in indicated conditions.
Figure 6—figure supplement 2
Expression validation and pharmacogenomics data on identified PON1 fucosylation-associated resistance modulator genes.
(A) Dot plot visualization of indicated top differentially expressed genes (DEGs) from two conditions as in Figure 6D. Color indicates log-transformed fold change values relative to control or WT and normalized to GAPDH levels (means ± SD of three biological replicates) while size indicates p values; Student’s t-test. NS, not significant. (B) Violin plots depicting pan-cancer expression of indicated top DEGs from two conditions as in Figure 6D, in 23 different cancer lineages. Data was obtained from DepMap portal. Bottom shows heatmap of correlation between indicated gene expression and drug response screened in GDSC. (C) Kaplan-Meier plots of FP or RFS in multiple lung cancer patient cohorts. Patient survival data were stratified by indicated gene expression (low or high) in their primary tumors based on microarray (FP) or RNA-seq (RFS) data. p-Values were calculated using a log-rank test.
Figure 6—figure supplement 3
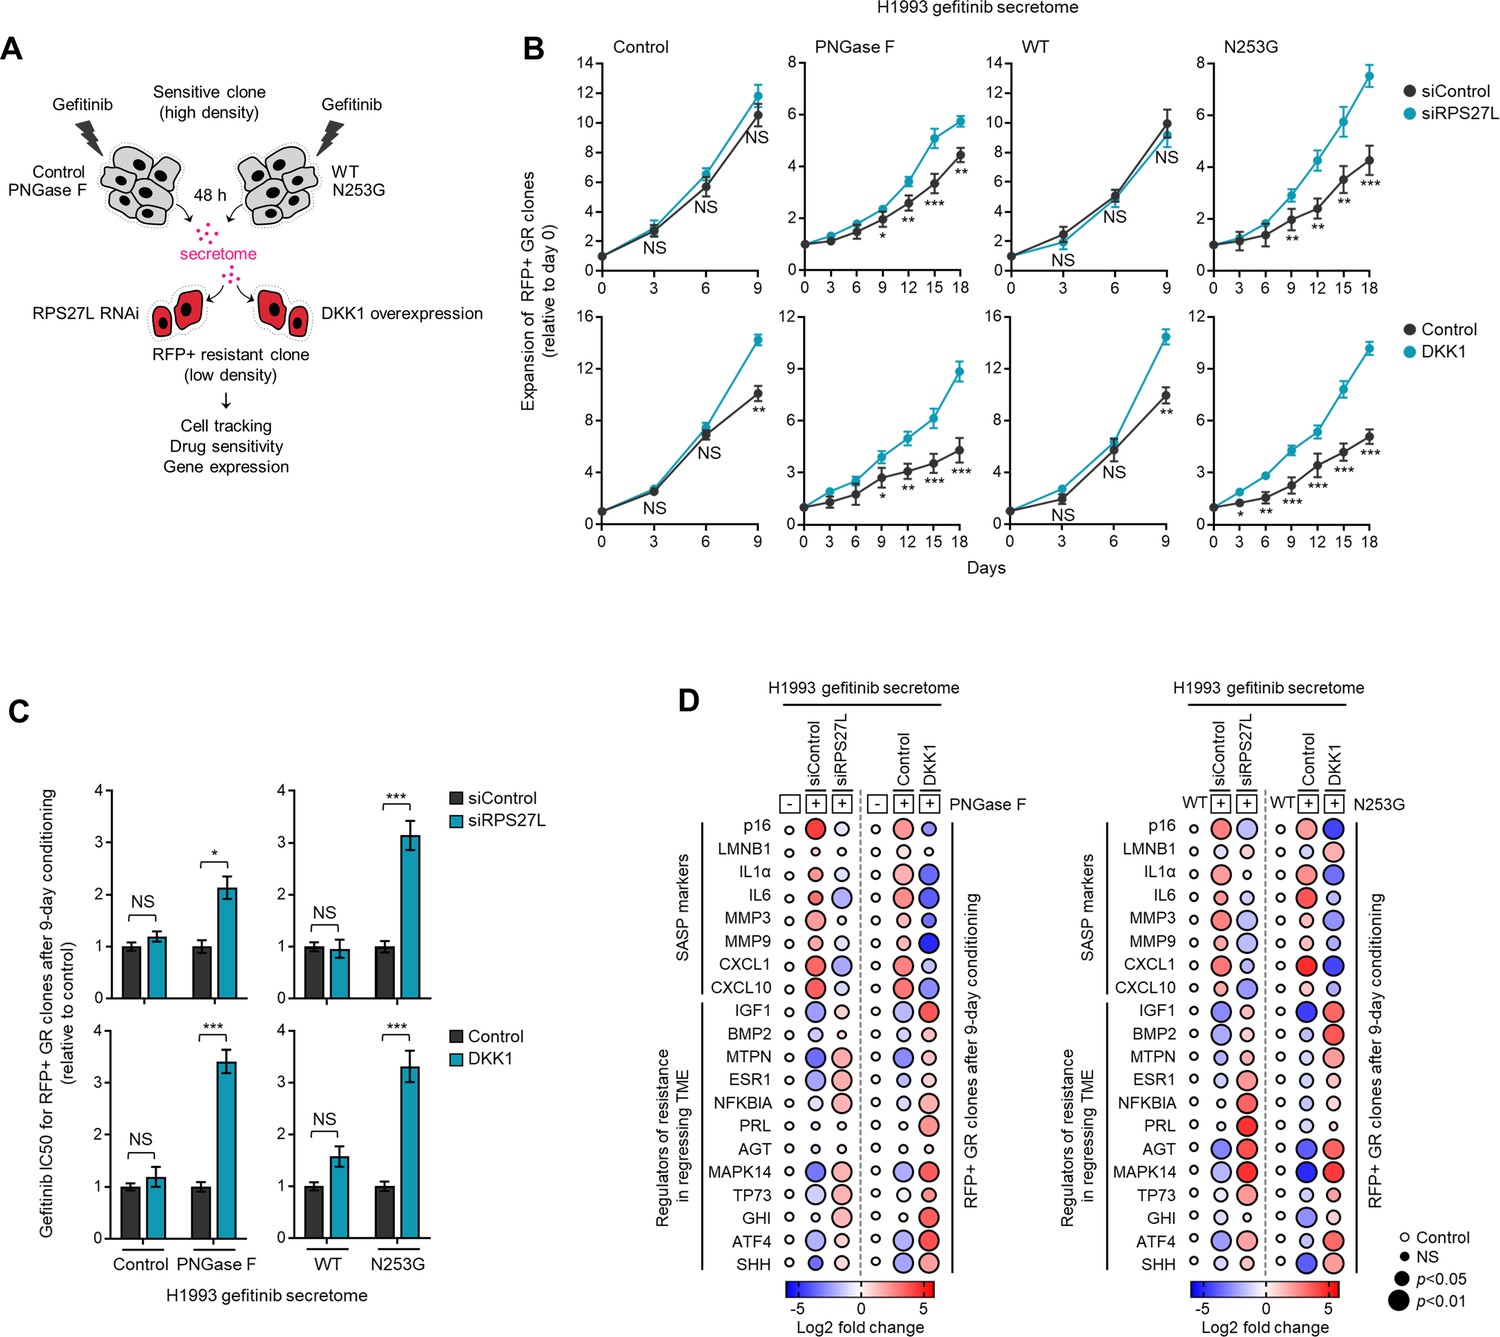
PON1 fucosylation-associated resistance modulator genes control the expansion of DR clones in response to fucosylated TIS.
(A) Schematic of CM co-culture. (B) Tracking of RFP-tagged H1993-GR clones upon RPS27L RNAi or DKK1 overexpression prepared as in A. Values are relative to day 0 (means ± SD of three biological replicates). *p<0.05, **p<0.01, ***p<0.001, two-tailed Mann–Whitney U test. NS, not significant. (C) Drug sensitivity assays in RFP-tagged H1993-GR clones upon RPS27L RNAi or DKK1 overexpression prepared as in A. GR clones were conditioned for 9 days prior to assay. Cells were treated with or without drugs for 72 hr with a concentration dilution series and were assayed for SRB. Values are relative to siControl or control (means ± SD of three biological replicates). *p<0.05, **p<0.01, ***p<0.001, Student’s t-test. NS, not significant. (D) Dot plot visualization of gene expression in RFP-tagged H1993-GR clones upon RPS27L RNAi or DKK1 overexpression prepared as in A. Color indicates log-transformed fold change values relative to control (no PNGase F) or WT and normalized to GAPDH levels (means ± SD of two biological replicates) while size indicates p values; Student’s t-test. NS, not significant.
Figure 7
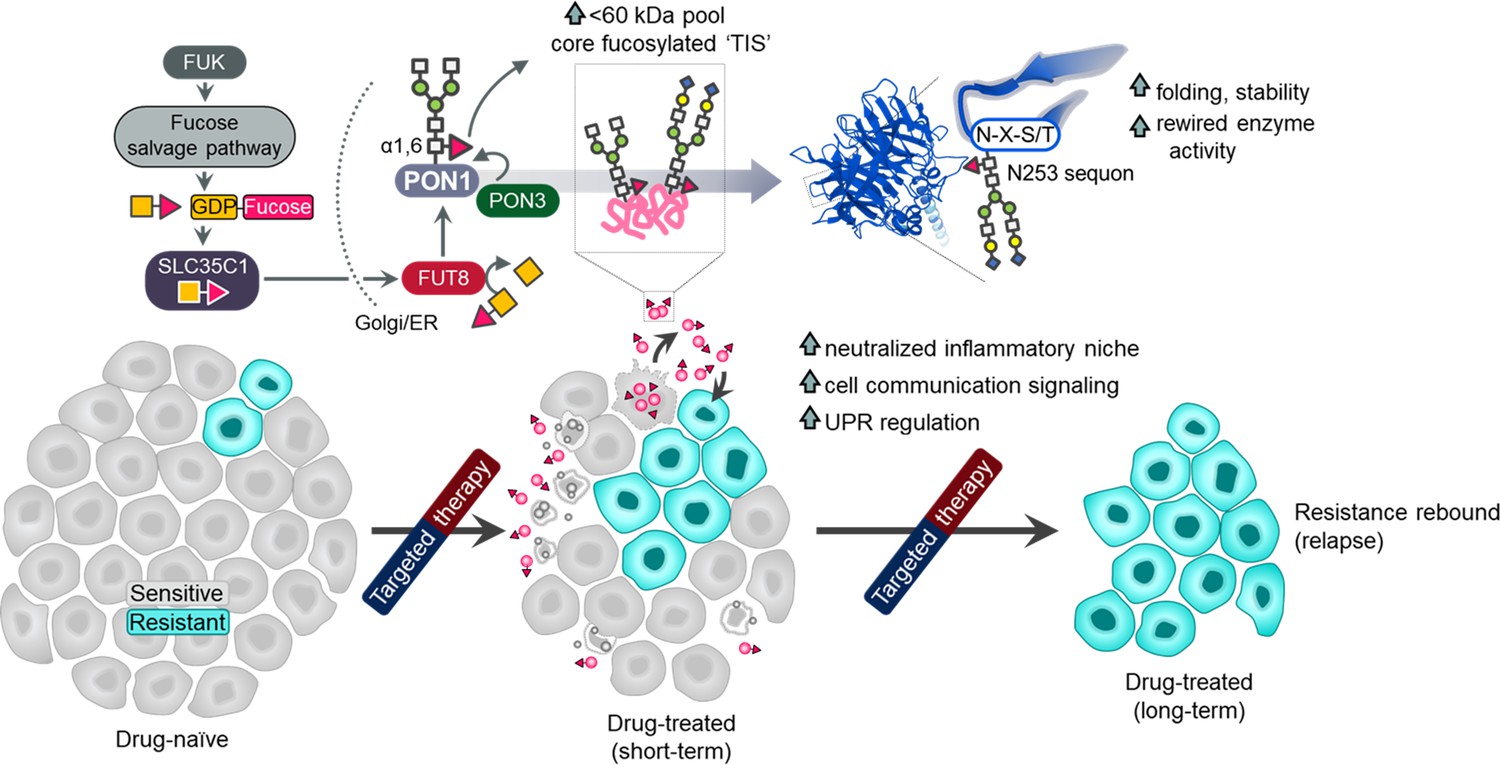
Schematic summary of the model proposed in this study.
Drug-sensitive cancer cells responding to kinase inhibitors induce a core fucosylated, complex secretome of mostly <60 kDa proteins stimulating the clonal expansion of DR cancer cells, potentially contributing to disease relapse. Secretome core fucosylation is driven by the fucose salvage-SLC35C1-FUT8 axis. Among such secreted proteins that are heavily core fucosylated is the antioxidant PON1. Prior to secretion, PON1 is differentially fucosylated at multiple sites with the sequon at N253 critical for protein folding and stability. PON1 core fucosylation is tightly regulated by PON3 in the golgi, resulting to a more stable, degradation-resistant PON1 with a rewired enzyme activity in the secretion. Minority DR clones respond to the globally fucosylated TIS or core fucosylated secretome PON1 via activation of TF and gene effectors important for UPR, cell communication regulation and inflammatory niche neutralization.
Author response image 1
Author response image 2
Author response image 3
Author response image 4

Videos
Video 1
Movie showing 3D spheroid formation of CellTracker-Green-labeled H1993 and CellTracker-Red-labeled H1993-GR admixture within 24 hr.
Video 2
Movie showing live-imaging of CellTracker-Green-labeled H1993 and CellTracker-Red-labeled H1993-GR admixture upon treatment with 2 µM gefitinib within 24 h.
Video 3
Movie showing live-imaging of CellTracker-Green-labeled PC9 and CellTracker-Red-labeled PC9-ER admixture upon treatment with 0.1 µM erlotinib within 24 h.
Additional files
-
Supplementary file 1
Patient clinical information.
(a) Information of human lung cancer patients (cohort #1). (b) Clinicopathologic information of human lung cancer patients (cohort #2). (c) Clinicopathologic information of human breast cancer patients (cohort #3). (d) List of siRNA and shRNA sequences. (e) List of oligonucleotide qPCR primers.
- https://cdn.elifesciences.org/articles/75191/elife-75191-supp1-v2.docx
-
Transparent reporting form
- https://cdn.elifesciences.org/articles/75191/elife-75191-transrepform1-v2.docx
Download links
A two-part list of links to download the article, or parts of the article, in various formats.
Downloads (link to download the article as PDF)
Open citations (links to open the citations from this article in various online reference manager services)
Cite this article (links to download the citations from this article in formats compatible with various reference manager tools)
Multi-targeted therapy resistance via drug-induced secretome fucosylation
eLife 12:e75191.
https://doi.org/10.7554/eLife.75191


