Kv3.3 subunits control presynaptic action potential waveform and neurotransmitter release at a central excitatory synapse
- Auditory Neurophysiology Laboratory, Department of Neuroscience, Psychology and Behaviour, College of Life Sciences, University of Leicester, United Kingdom
- Division of Neurobiology, Faculty of Biology, Ludwig-Maximilians-University, Germany
- Autifony S.r.l., Istituto di Ricerca Pediatrica Citta’della Speranza, Corso Stati Uniti, Italy
- Computing Science and Mathematics, Faculty of Natural Sciences, University of Stirling, United Kingdom
Figures
Figure 1 with 4 supplements
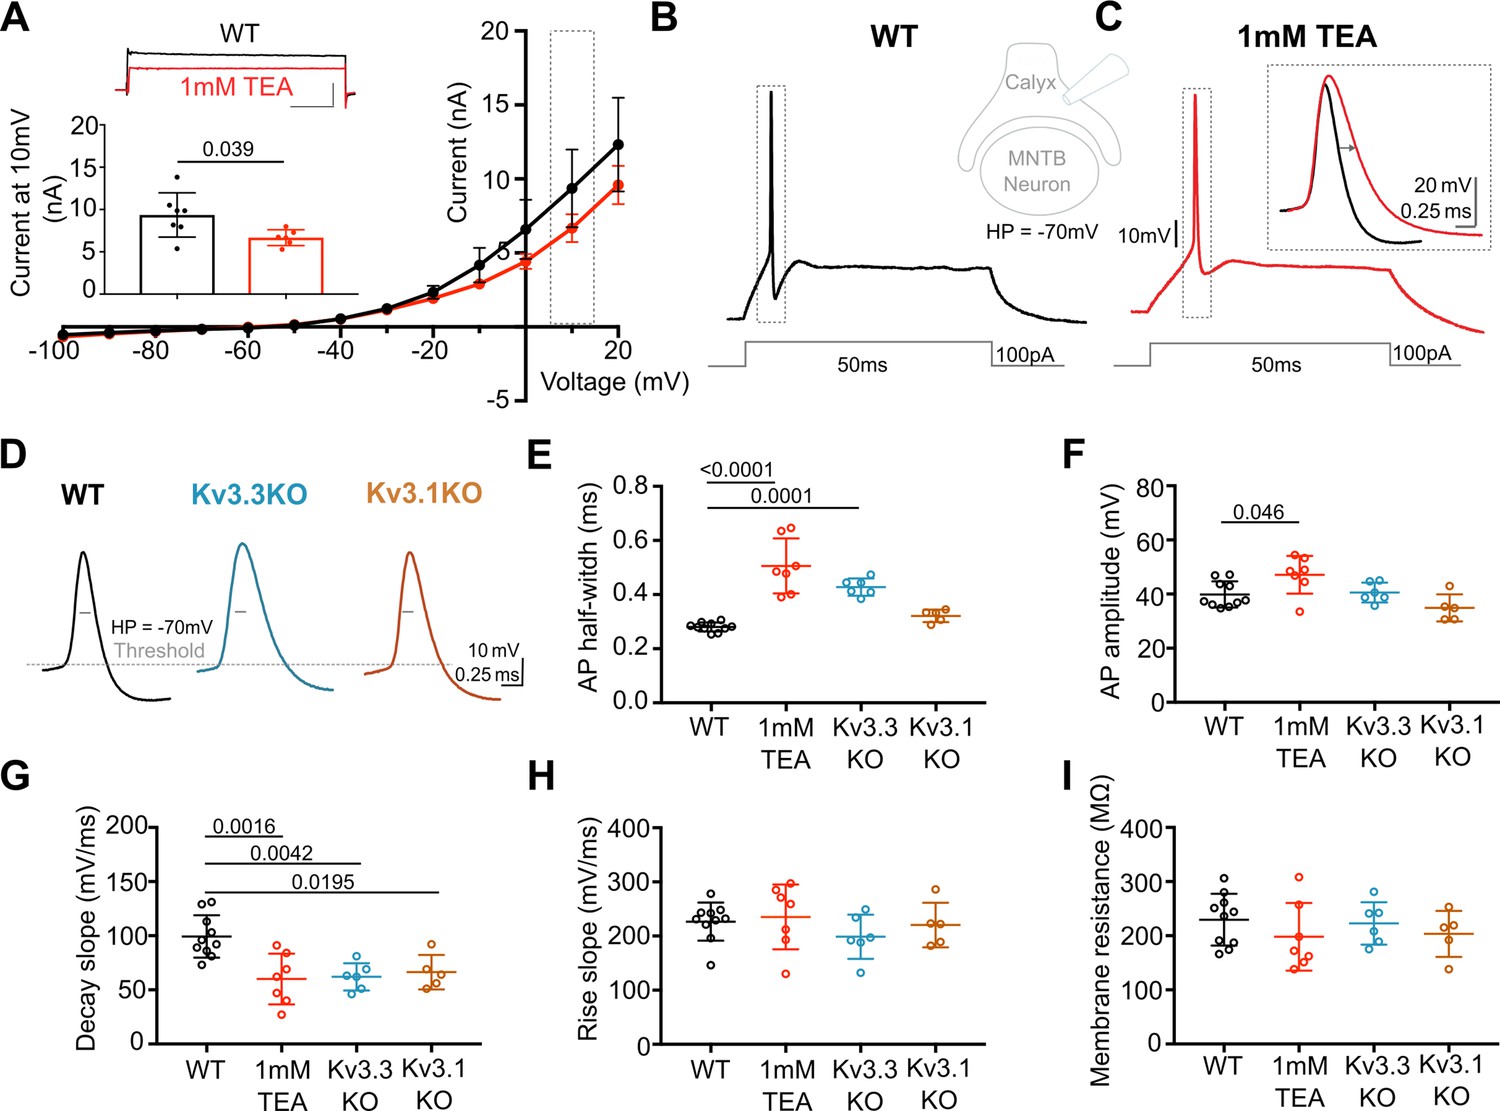
Presynaptic AP duration is increased by TEA or Kv3.3 deletion.
(A) Current-Voltage (I–V) relationship for potassium currents in the calyx of Held terminal of WT mice (P10–P12) in control (black; n=7 terminals, 4 mice) and TEA, 1 mM (red, n=6 terminals, 5 mice; HP = –70 mV). Inset (top): Example current traces in response to voltage command of +10 mV step (grey box in IV) in WT (black) and WT +1 mM TEA (red). Scale bars = 5 nA and 20ms. Inset (lower): Bar graph of mean currents ± SD, measured on step depolarisation to +10 mV (from HP –70 mV) ±1 mM TEA. Outward Currents are significantly reduced by TEA (student’s t-test, unpaired, P=0.0386). (B) WT calyx AP (black trace) evoked by 100 pA step current injection; inset - diagram of recording configuration. (C) WT calyx AP in the presence of TEA (1 mM, red trace); inset – overlaid WT APs ±TEA (red) as indicated by dotted box (grey) around APs in B and C. (D) Representative AP traces from calyx terminals of WT (black), Kv3.3KO (blue), and Kv3.1KO (orange); double arrows indicate the half-width of WT AP. AP threshold is indicated by the grey dashed line. (E) AP half-width measured as time difference between rise and decay phases at 50% maximal amplitude. Half-width is significantly increased in TEA and in Kv3.3KO; N is individual terminals: WT N=9 from 6 animals; TEA = 7 from 5 mice; Kv3.3KO = 6 from 3 mice and Kv3.1KO = 5 from 3 mice. (F) AP amplitude, (G) AP Decay slope, (H) AP rise slope (10–90%) and (I) membrane resistance for calyceal recordings. Average data presented as mean ± SD. Statistical test (parts E-I) were one-way ANOVAs and Tukey’s post hoc for multiple comparisons, with significant Ps indicated on the graph.
-
Figure 1—source data 1
Relates to Figure 1.
- https://cdn.elifesciences.org/articles/75219/elife-75219-fig1-data1-v3.xlsx
Figure 1—figure supplement 1
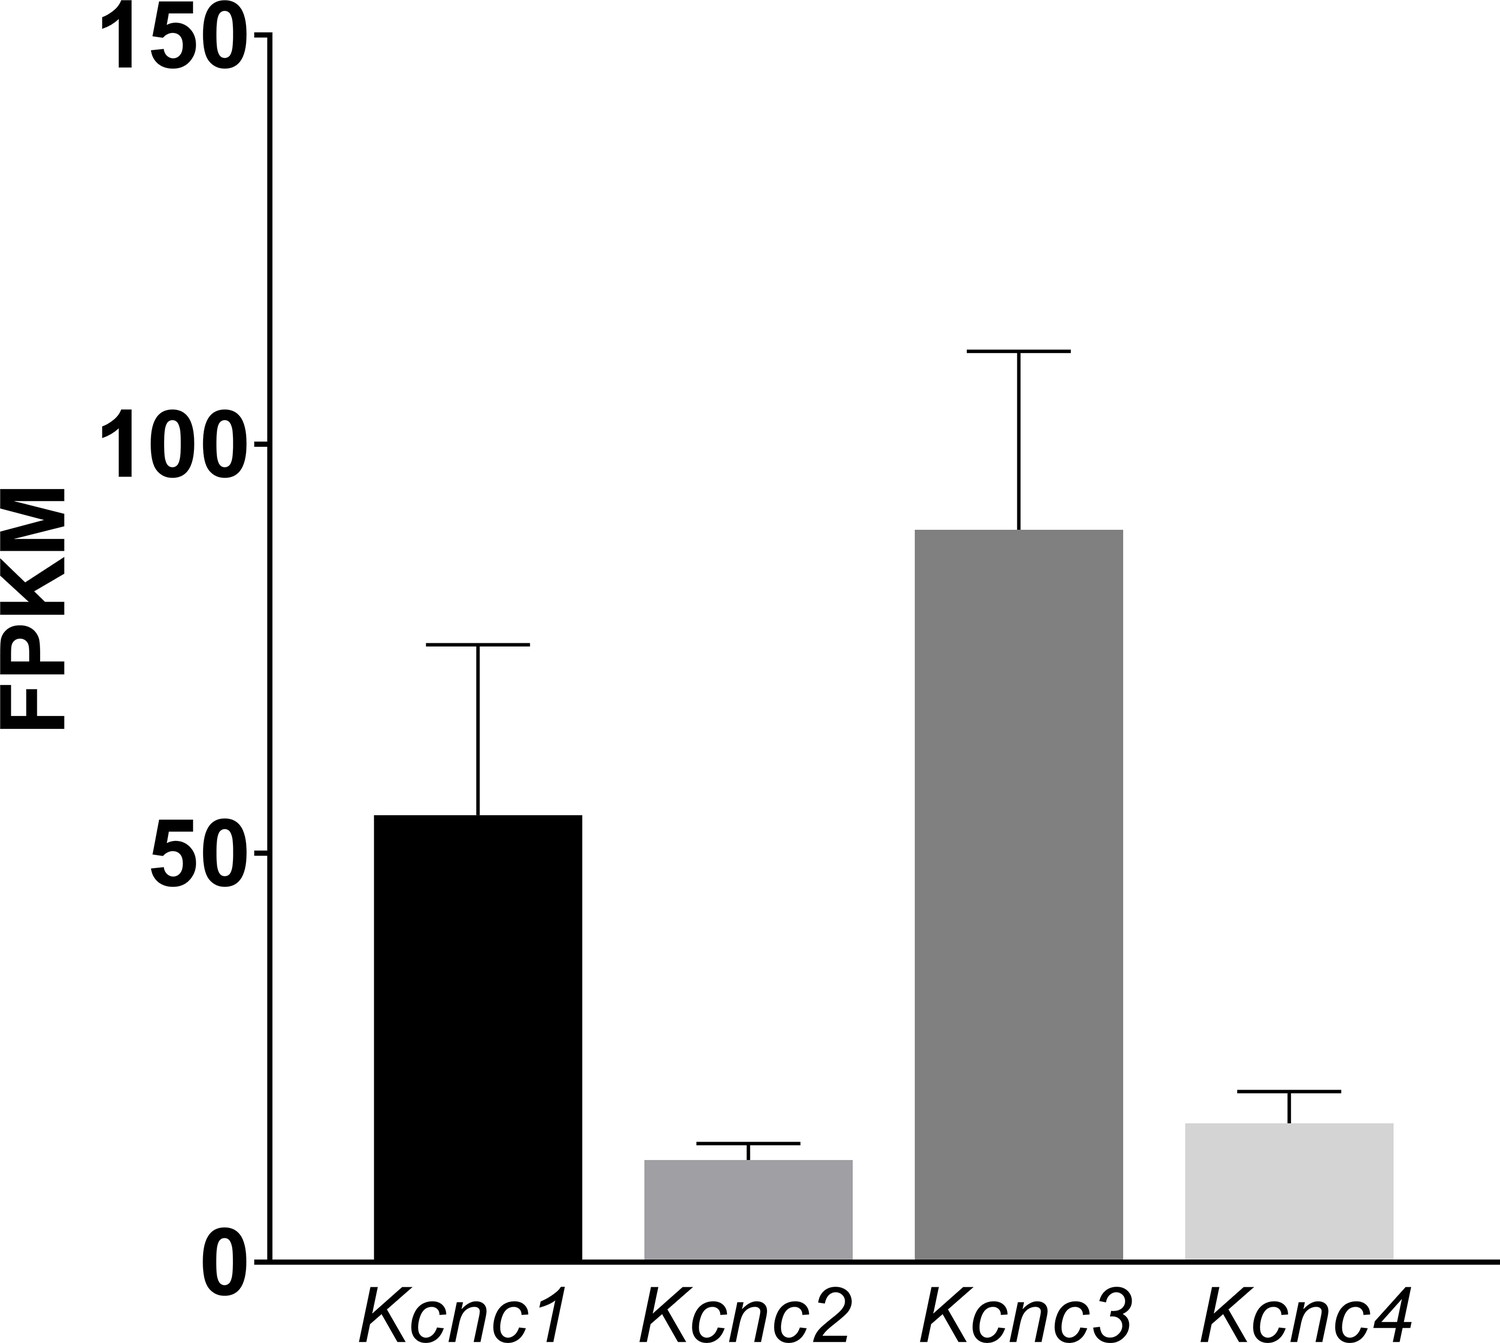
WT mRNA Levels for Kcnc family genes in the cochlear nucleus which show a similar pattern of expression to those measured previously for the MNTB (Choudhury et al., 2020).
The data shows predominance of Kcnc1 (Kv3.1) and Kcnc3 (Kv3.3). Mean ± SD is plotted for 9 measured samples, with each sample containing 3 cochlear nuclei. Data is presented as Fragments per kilobase of transcript per million mapped reads (FPKM).
-
Figure 1—figure supplement 1—source data 1
Relates to Figure 1—figure supplement 1.
- https://cdn.elifesciences.org/articles/75219/elife-75219-fig1-figsupp1-data1-v3.xlsx
Figure 1—figure supplement 2
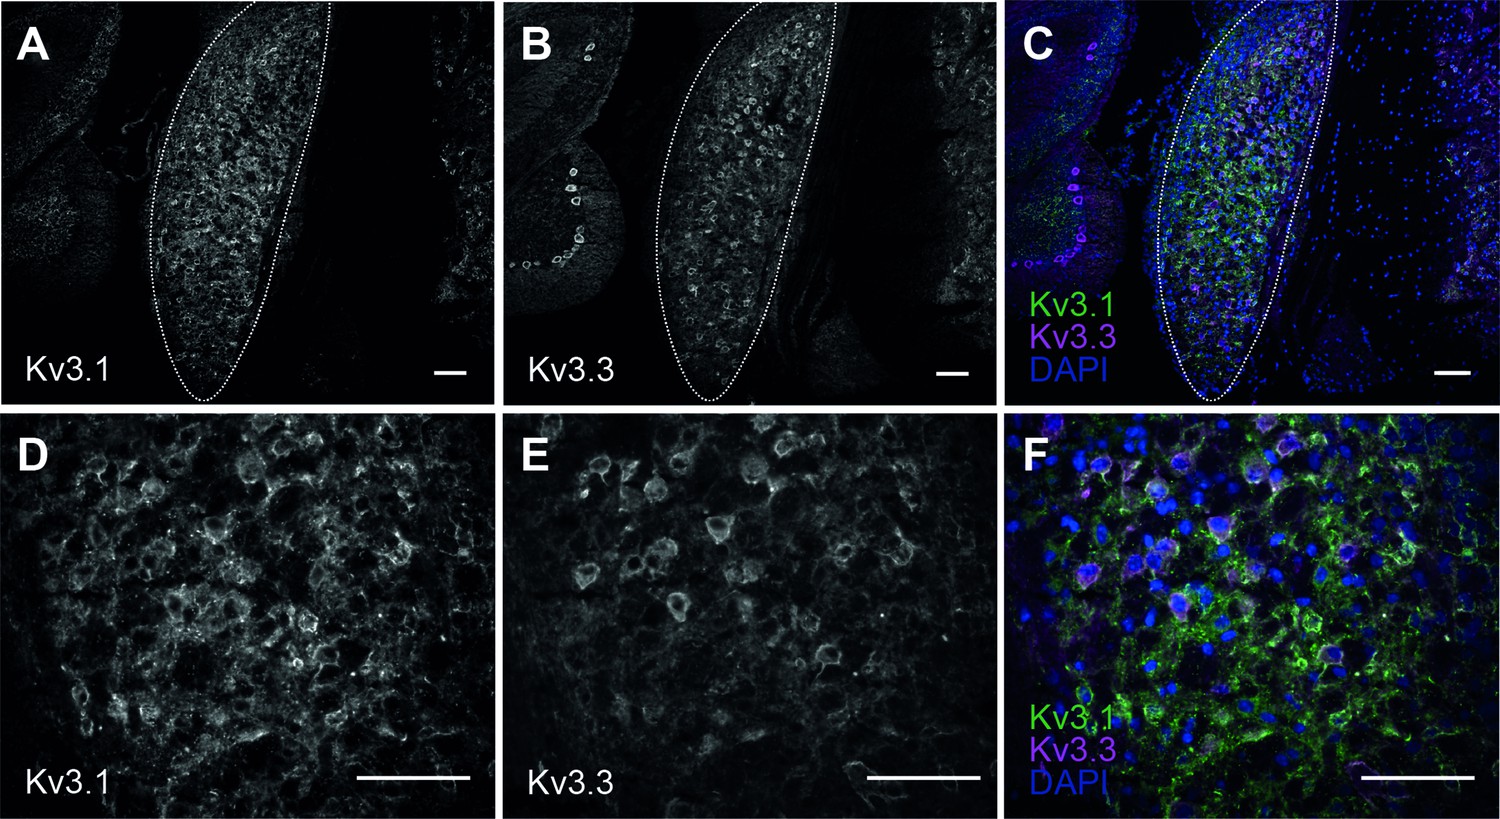
Kv3.1 and Kv3.3 immunoreactivity in the cochlear nucleus of CBA WT mice.
(A) Kv3.1 in the cochlear nucleus (outlined) of WT mouse at 1 month of age. (B) Kv3.3 in the same section of cochlear nucleus (outlined). (C) Overlay of Kv3.1 (green) and Kv3.3 (magenta) with DAPI (blue). (D–F) magnified section of cochlear nucleus showing Kv3.1 (D) and Kv3.3 (E) immunoreactivity. Images are overlayed in F. All scale bars = 100 µm. Antibodies and conditions have been independently validated previously using Kv3.1KO and Kv3.3KO tissues (Choudhury et al., 2020).
Figure 1—figure supplement 3
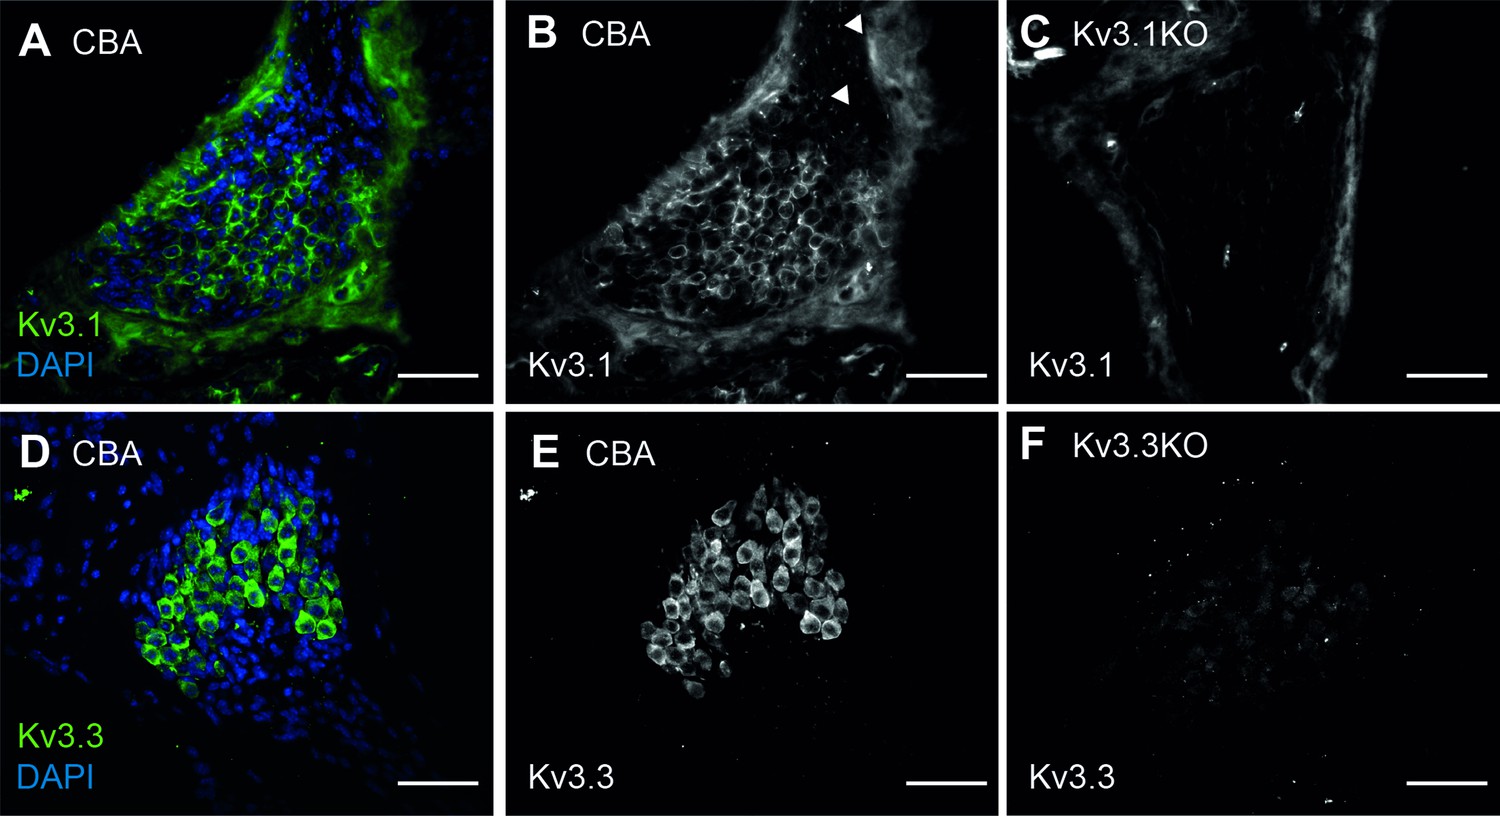
Kv3.1 and Kv3.3 are present in spiral ganglion neurons of CBA WT mice.
(A–B) Kv3.1 immunoreactivity spiral ganglion neurons in the WT mouse at 1 month of age. In addition to the spiral ganglion cell membranes, Kv3.1 was also present at the nodes of Ranvier (B, arrows). (C) No Kv3.1 staining was observed in the spiral ganglion cell bodies of Kv3.1KO mice. Non-specific signal was associated with the bony tissues of the modiolus, and assumed to be autofluorescence from the collagen fibers. (D–E) Kv3.3 immunoreactivity spiral ganglion neurons in the WT mouse at 1 month of age. Strong immunoreactivity was observed in the cell bodies. (F) Faint non-specific signal was observed in Kv3.3KO tissues, but did not appear to be associated with the spiral ganglion neurons. All scale bars = 100 µm.
Figure 1—figure supplement 4
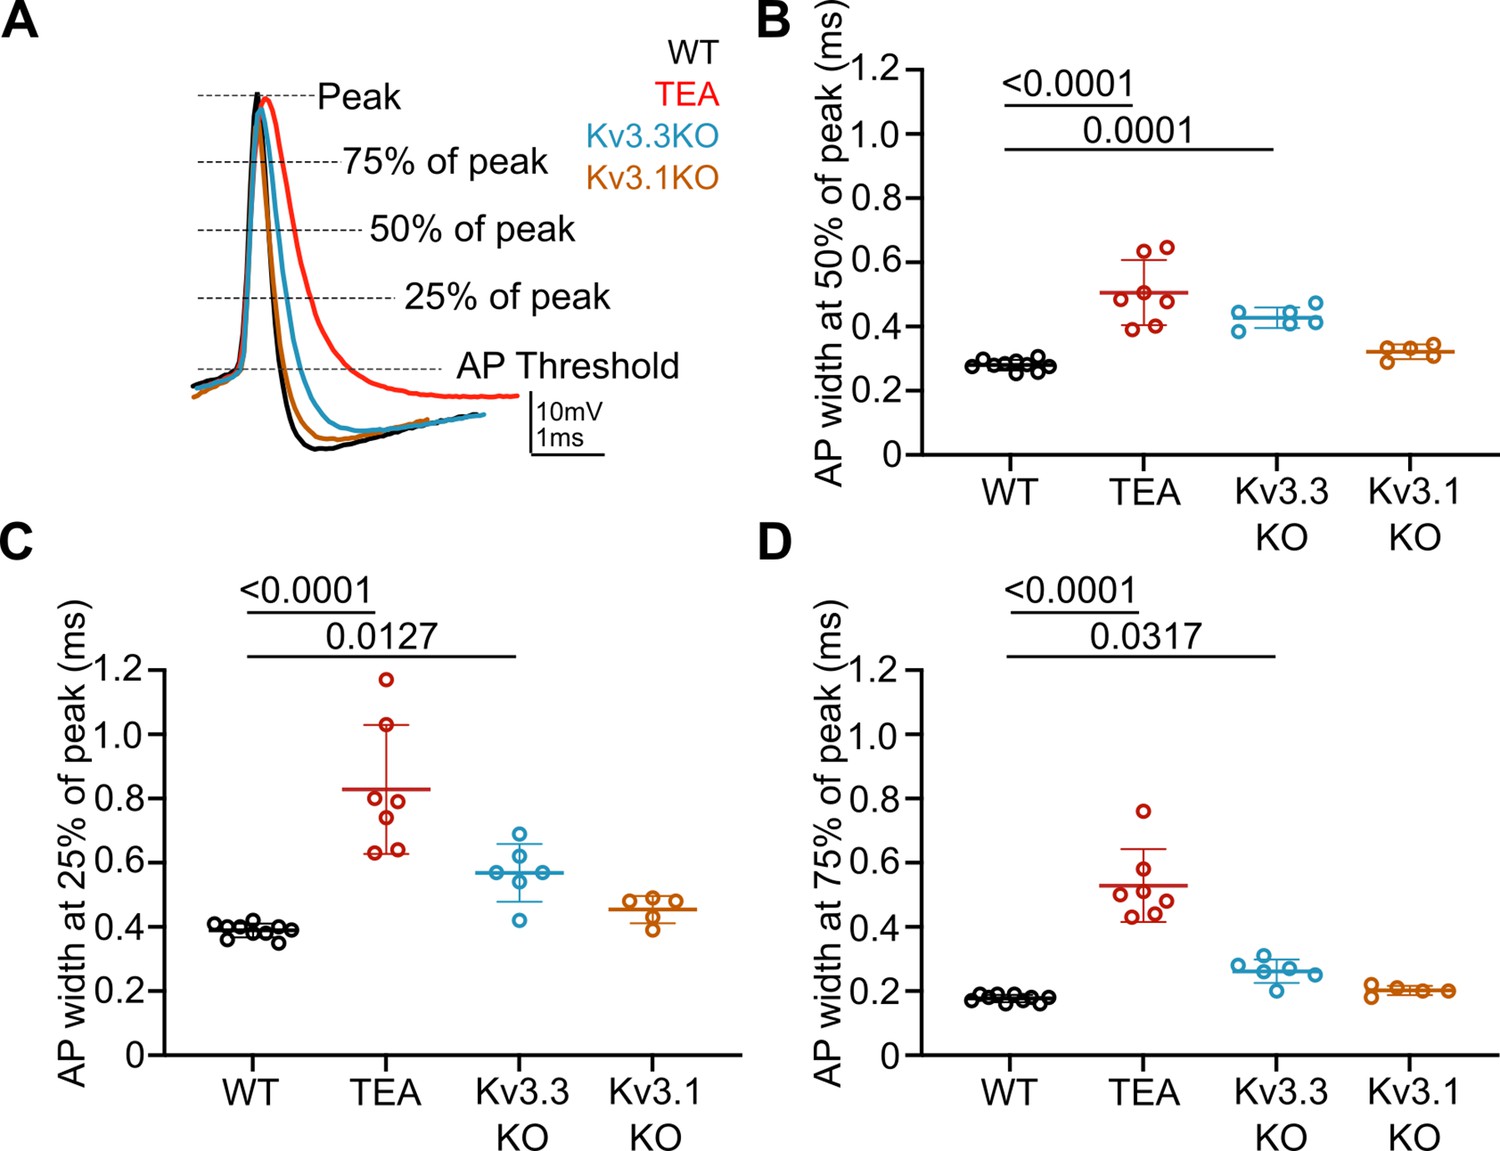
Repolarisation of the presynaptic AP is slowed during the entire length of the downstroke in the presence of 1 mM TEA and in Kv3.3KOs.
(A) Representative presynaptic AP traces from WT (black), WT +TEA (red), Kv3.3KO (blue) and Kv3.1KO (orange) calyces illustrating where measurements for AP duration at 75%, 50%, and 25% peak amplitude. (B) Reproduction of data from Figure 1E showing significant increase in presynaptic AP half-width, measured at 50% of peak amplitude, in the presence of 1 mM TEA and in Kv3.3KOs. N represents individual calyces. WT N=9 from 6 animals; TEA = 7 from 5 mice; Kv3.3KO = 6 from 3 mice and Kv3.1KO = 5 from 3 mice. (C) AP width at 25% and (D) AP width at 75% of peak amplitude. AP width is significantly increased in the presence of TEA and in Kv3.3KOs at both 25% and 75% of peak. Data is presented as average ± SD and comparisons are using a one-way ANOVA with Tukey’s post hoc test. Significant p-values are shown on the graph.
-
Figure 1—figure supplement 4—source data 1
Relates to Figure 1—figure supplement 4.
- https://cdn.elifesciences.org/articles/75219/elife-75219-fig1-figsupp4-data1-v3.xlsx
Figure 2
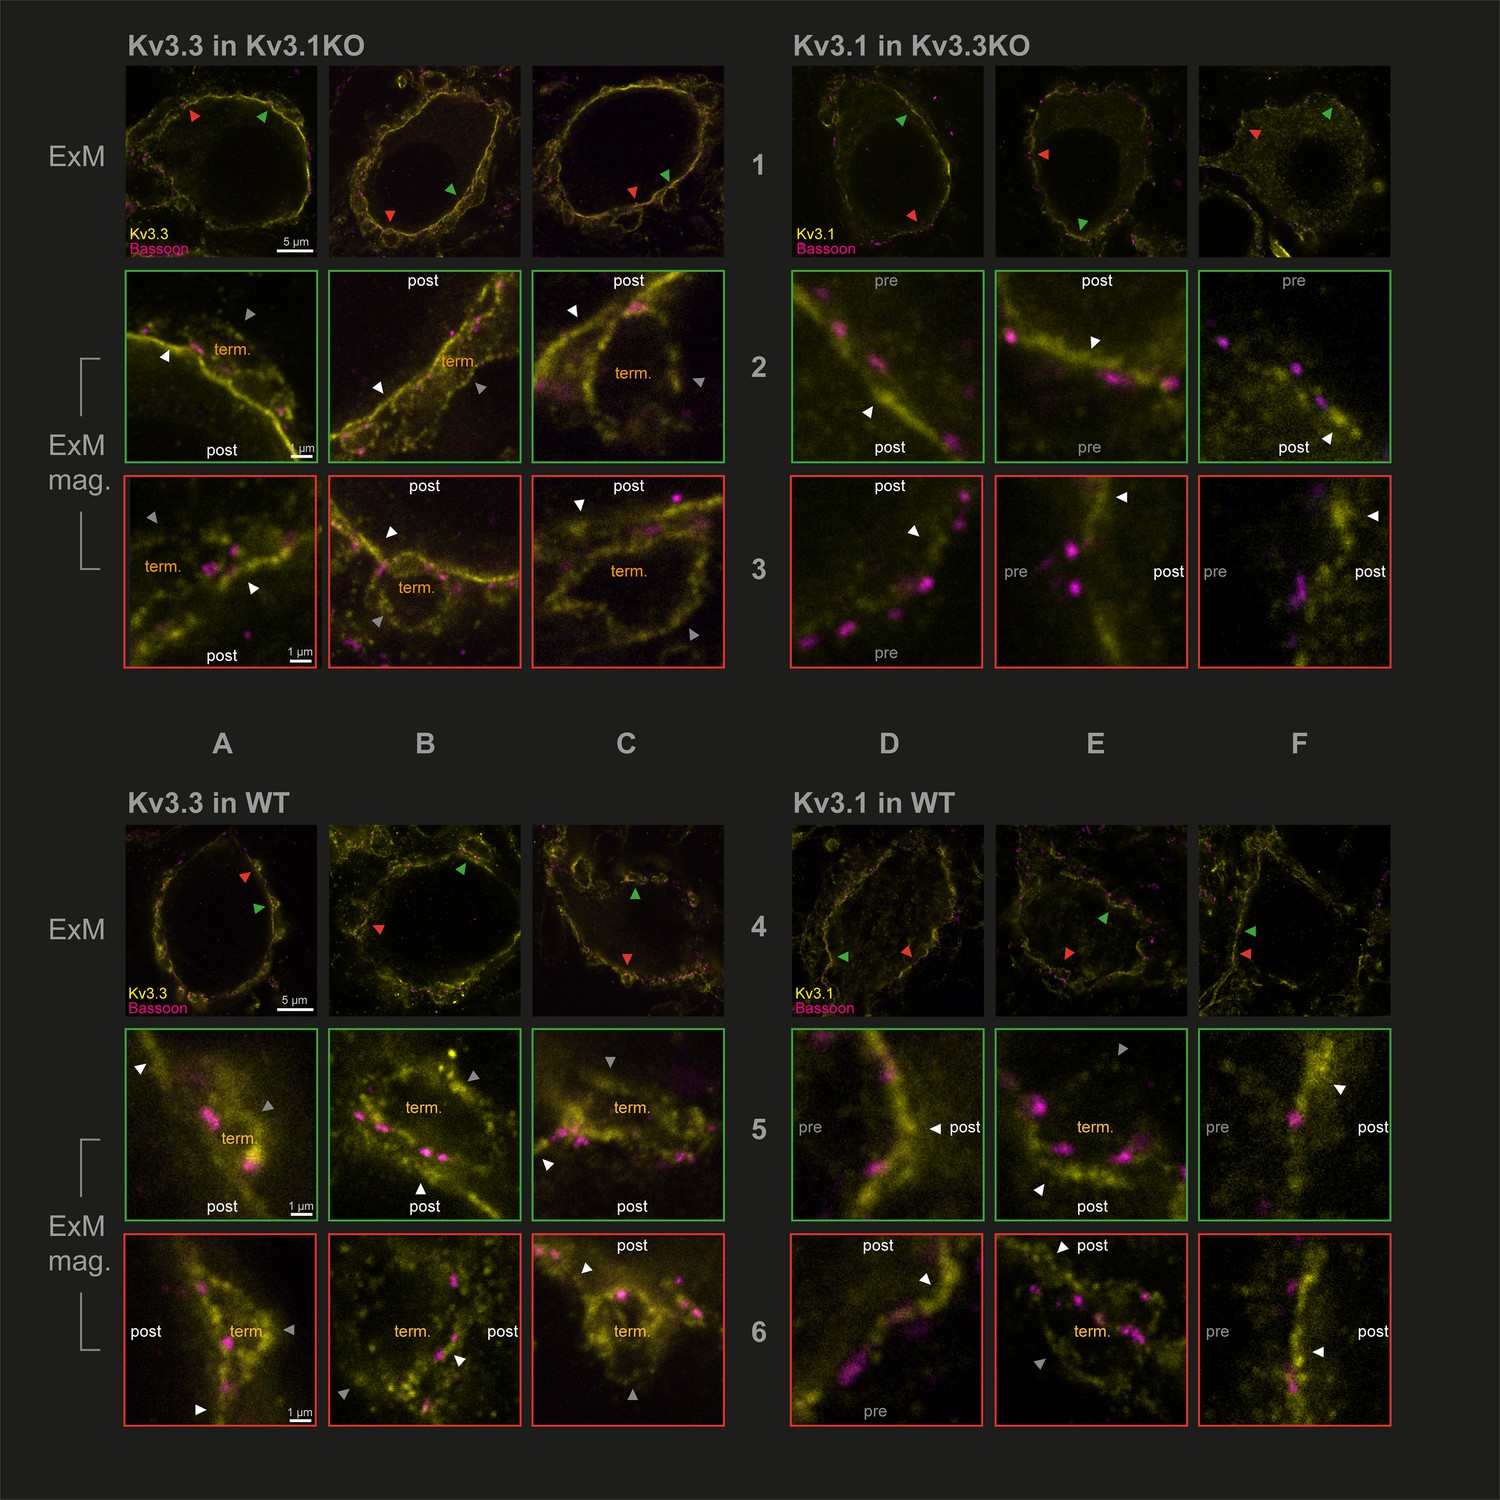
Protein-retention Expansion Microscopy (proExM) with confocal fluorescence imaging shows that Kv3.3 subunits are present in calyx of Held presynaptic terminal membrane.
Individual images are identified in rows 1–6 and columns A-F, as indicated by the central labels. Four quadrants of 9 images are shown, each 3 × 3 matrix is from the named genotype and stained as specified in the title of each quadrant. The top row of each quadrant (rows 1 and 4) are single optical sections from 3 different MNTB neurons, in which their calyceal synaptic profiles are labelled with bassoon (purple) and co-labelled with either Kv3.1 or Kv3.3 antibodies (yellow): from Kv3.1KO and stained for Kv3.3 (A1-C1); the Kv3.3KO stained for Kv3.1 (D1-F1); WT stained for Kv3.3 (A4-C4); WT stained for Kv3.1 (D4-F4). In each MNTB neuron (rows 1 & 4) two synaptic regions of interest (ROI) containing bassoon are indicated by the red and green arrowheads. These magnified ROIs are displayed below (in rows 2+3 or 5+6) bordered by the same colour, respectively. The neuronal compartments are labelled: ‘post’ – postsynaptic; ‘pre’ – presynaptic; ‘term’ – synaptic terminal. In each image, the dark grey arrows point to presynaptic Kv3 labelling, and the white arrows point to postsynaptic Kv3 labelling. Scale bars are indicated for each row in column A (5 µm in rows 1 and 4: 1 µm in rows 2,3,5, and 6). Tissue was used from mice aged P28-P30.
Figure 3 with 1 supplement
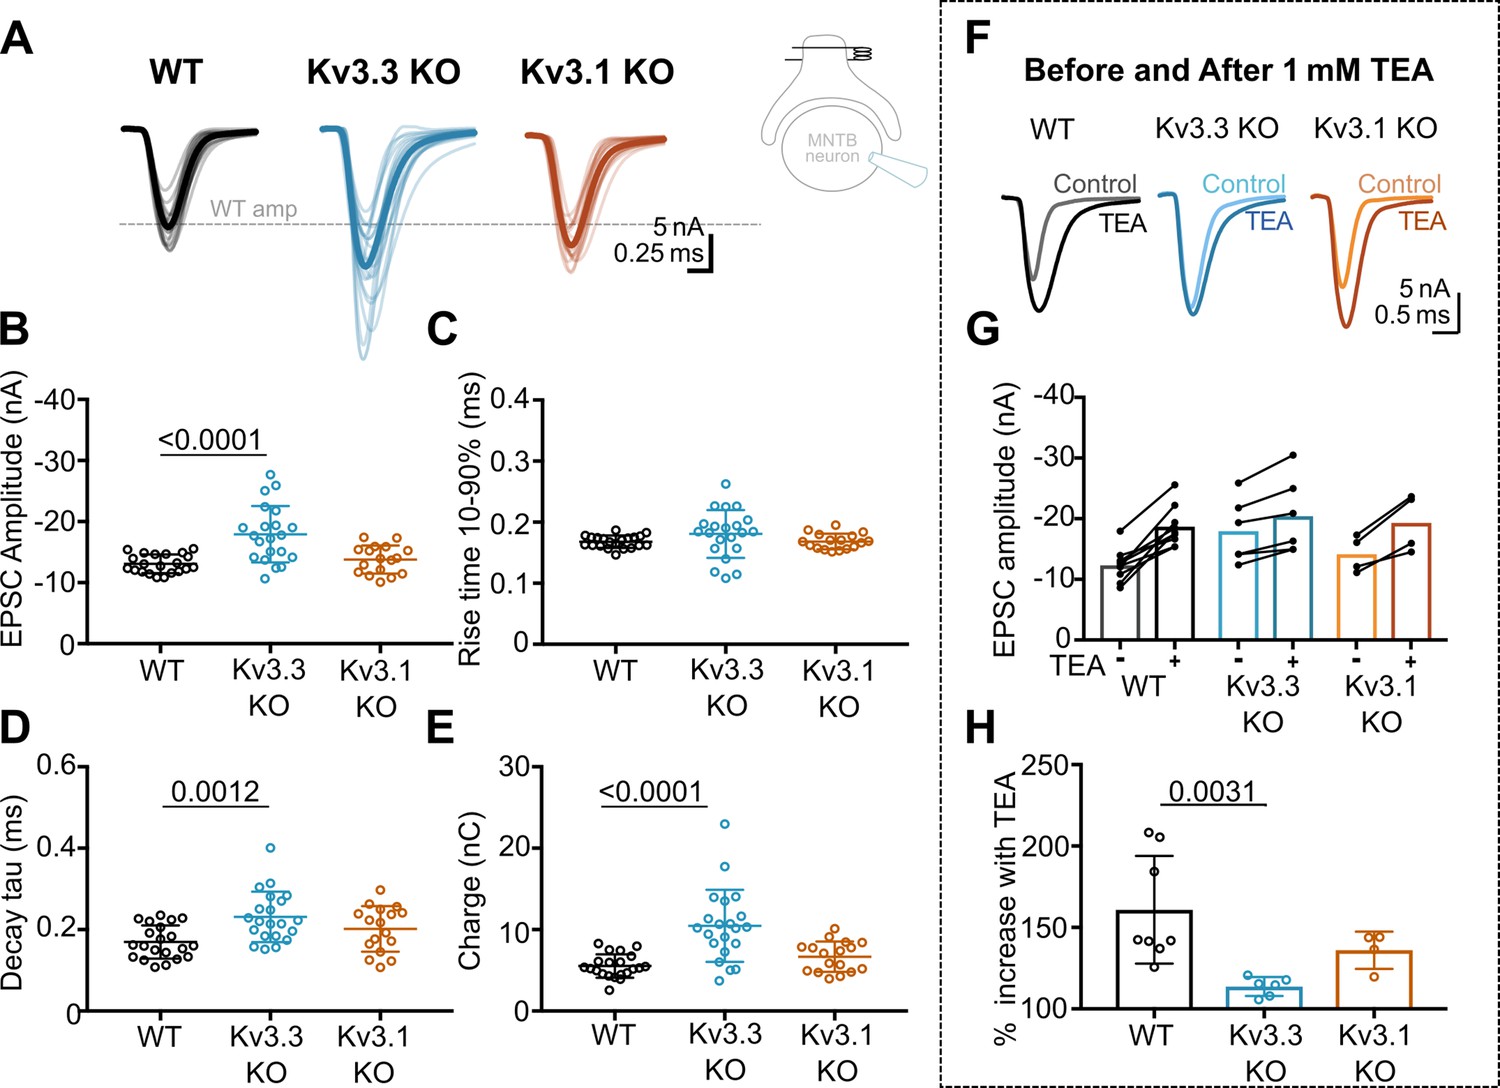
Kv3.3 deletion increases EPSC amplitude and occludes block by TEA.
(A) Superimposed calyceal EPSCs generated from each genotype (age P21-P25): wildtype (WT; black), Kv3.3KO (blue), and Kv3.1KO mice (orange). Thin lines show traces from individual neurons (each is mean of 5 EPSCs) with thick line showing the population mean for each genotype. Grey dashed line indicates the average WT amplitude; N=WT, 22 neurons (11 mice); Kv3.3KO, 22 neurons (10 mice); Kv3.1KO, 17 neurons (8 mice). Inset shows recording and stimulation configuration. (B) EPSC amplitude increased in the Kv3.3KO. (C) EPSC rise time (10–90%) no difference was found between groups (one-way ANOVA, p=0.1576). (D) EPSC decay tau and (E) EPSC total charge were increased in the Kv3.3KO relative to WT. (F) EPSC traces from WT, Kv3.3KO, and Kv3.1KO mice, before and after the addition of 1 mM TEA. (Centre): EPSC amplitudes recorded before and after perfusion of TEA (1 mM); n=WT, 9 neurons (7 mice); Kv3.3KO, 6 neurons (3 mice); Kv3.1KO, 5 neurons (3 mice). (G) Increase in EPSC amplitude by 1 mM TEA. (H). The amplitude increase induced by TEA was significantly reduced in Kv3.3KO mice compared to WT. Average data presented as mean ± SD; statistics was using one-way ANOVA with Tukey’s post hoc for multiple comparisons. Kruskal-Wallis ANOVA with Dunn’s multiple corrections was used to compare change to EPSC amplitude in TEA due to a non-gaussian distribution in WT.
-
Figure 3—source data 1
Relates to Figure 3.
- https://cdn.elifesciences.org/articles/75219/elife-75219-fig3-data1-v3.xlsx
Figure 3—figure supplement 1
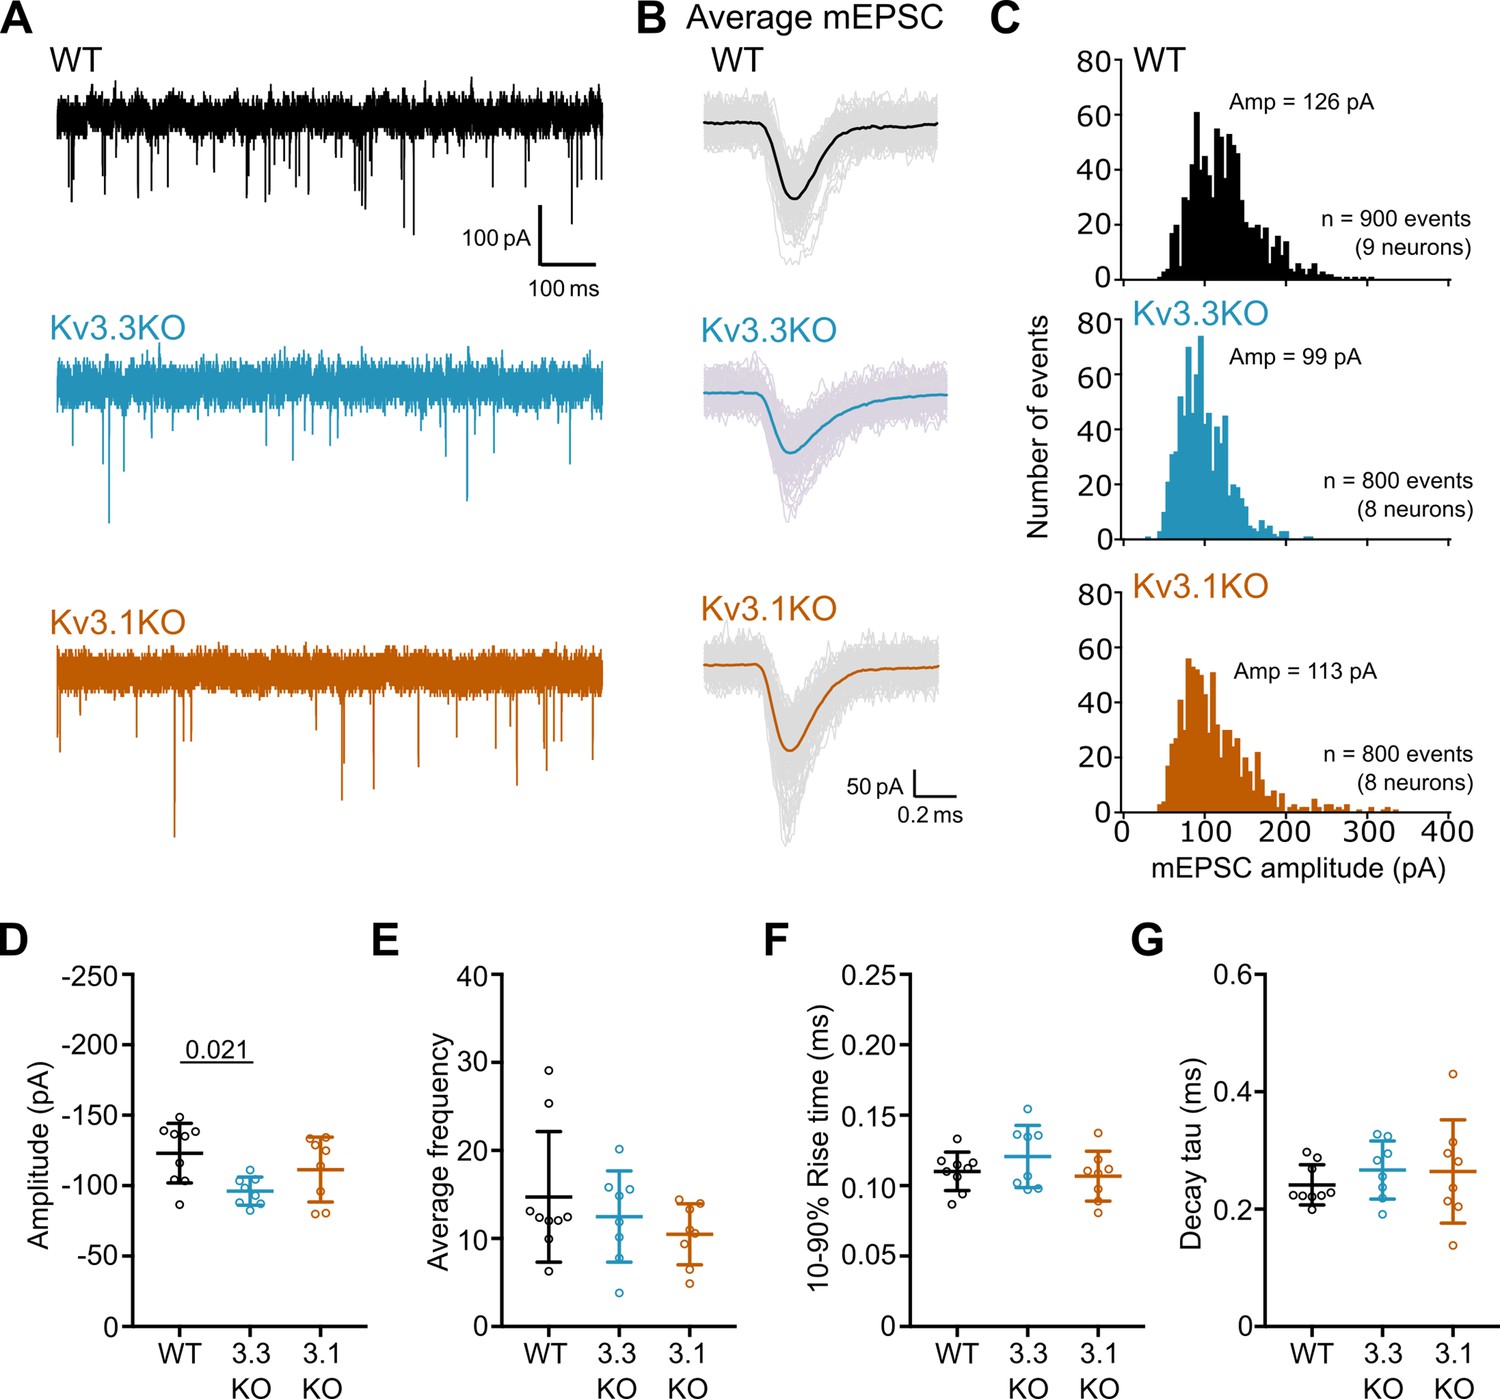
mEPSCs recorded from Kv3.3KO mice have a decreased amplitude.
(A) Representative mEPSC traces recorded from MNTB neurons in WT (black), Kv3.3KO (blue) and Kv3.1KO (orange) mice at a holding potential –60 mV. The first 1 s of a 30 s recording is shown. (B) Average mEPSC traces recorded from a single neuron in WT (black), Kv3.3KO (blue), and Kv3.1KO mice (orange). Coloured traces show the average mEPSC from the first 100 events recorded in a single neuron. Lighter grey traces are the 100 individual events. (C) mEPSC amplitude distributions recorded from MNTB neurons in WT, Kv3.3KO, and Kv3.1KO mice. The distribution was shifted to the left in Kv3.3KO mice. Distributions were calculated from the first 100 mEPSC events recorded from each neuron. Average amplitudes are denoted at the top of each graph. WT: 900 events from 9 neurons (4 mice); Kv3.3KO: 800 events from 8 neurons (4 mice); Kv3.1KO: 800 events from 8 neurons (4 mice). Amplitudes are grouped into 5 pA bins. (D) mEPSC amplitude was significantly decreased in Kv3.3KO mice (one-way ANOVA, Tukey’s post hoc p=0.021) but average frequency (E), rise time (F) and decay tau (G) were unchanged (p≥0.05). Average frequency was calculated by number of events recorded in 30 s divided by the recording period (30 s). WT: 9 neurons (4 mice), Kv3.3KO: 8 neurons (4 mice), Kv3.1KO: 8 neurons (4 mice). Data is presented as average ± SD and comparisons done using one-way ANOVA and Tukey’s test for multiple comparisons.
-
Figure 3—figure supplement 1—source data 1
Relates to Figure 3—figure supplement 1.
- https://cdn.elifesciences.org/articles/75219/elife-75219-fig3-figsupp1-data1-v3.xlsx
Figure 4
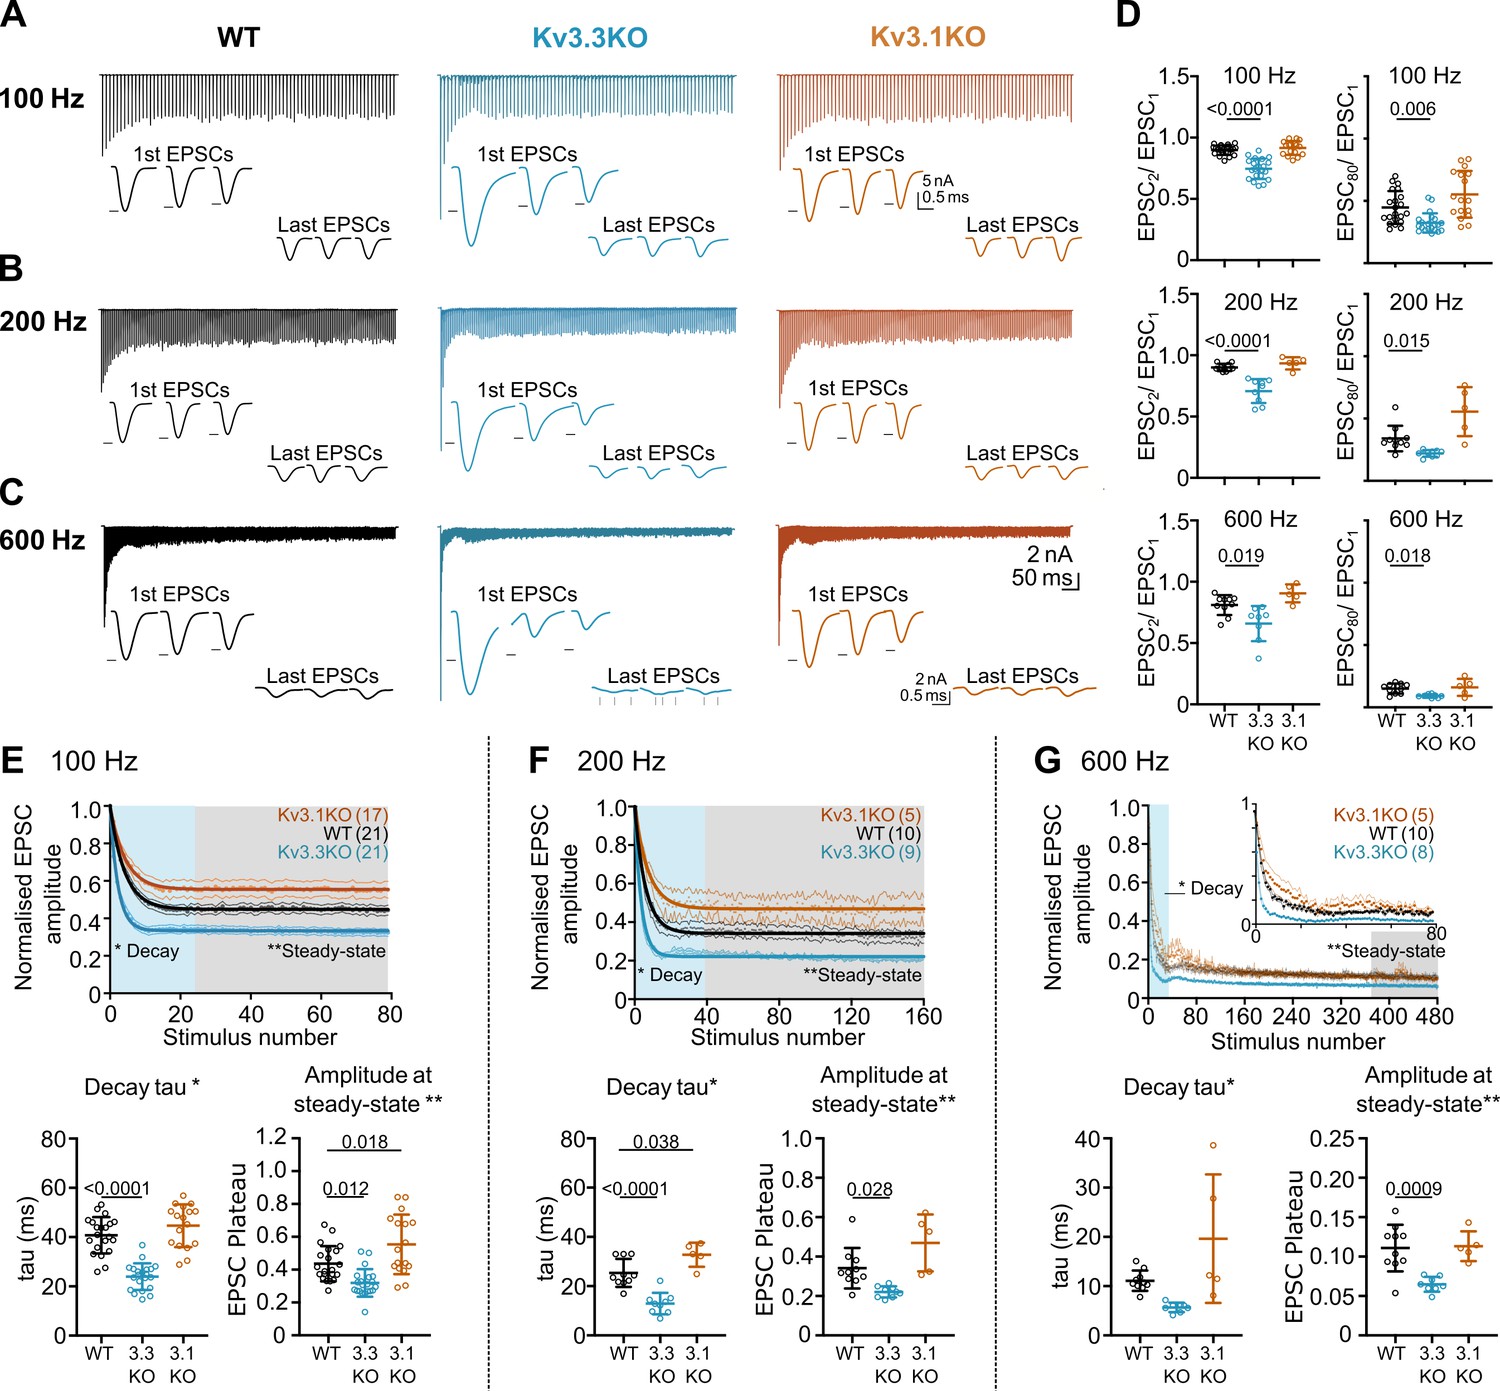
Evoked EPSC short-term depression is faster and more pronounced in the Kv3.3KO.
(A,B,C) Example MNTB EPSC trains (800ms) on stimulation at (A) 100, (B) 200 or (C) 600 Hz for WT (left, black), Kv3.3KO (middle, blue), and Kv3.1KO (right, orange) mice (aged P21-P25). Each trace shows an average of 5 trials from a single neuron with stimulus artefacts removed for clarity. Lower insets: The first and last three EPSC traces are shown below each train. Black arrows show EPSC amplitudes from the WT mouse (left). Vertical grey arrows indicate multiple, asynchronous responses in the final EPSCs of Kv3.3KO traces. (D) Paired-pulse ratios for EPSC2/EPSC1 (left) and EPSC80/EPSC1 (right) generated in response to 100 Hz (top), 200 Hz (middle), and 600 Hz (bottom); in each case the ratio is significantly decreased in Kv3.3KO with respect to WT. For 100 Hz - WT: N=21 cells (11 mice); Kv3.3KO: N=21 (10 mice); Kv3.1KO: N=17 (8 mice); for 200 and 600 Hz - WT: N=10 (6 mice); Kv3.3KO: N=9 (4 mice); Kv3.1KO: N=5 (3 mice). Data shows mean ± SD and statistical significance estimated by one-way ANOVAs with Tukey’s post hoc for multiple comparisons or Kruskal-Wallis with Dunn’s multiple comparison (EPSC80/EPSC1 at 100 and 200 Hz due to non-gaussian data distributions), significant P values given on the respective graphs. (E, F, G) Normalised EPSCs, short-term depression is faster and larger in Kv3.3KO mice (compared to WT and Kv3.1KO mice) (E) 100 Hz F: 200 Hz G: 600 Hz. The rate of EPSC depression is plotted as a single exponential tau (lower left) and normalised EPSC amplitudes at steady-state are plotted (lower right) for each genotype and stimulus frequency. N numbers are presented in brackets on normalised EPSC amplitude graphs (and are the same neurons as used in D). One-way ANOVAs with Tukey’s post hoc for multiple comparison correction were used to test significance, p values reported on graphs. All data plotted as mean ± SD, except in graphs of normalised EPSC amplitudes (E, F, and G, top) where data is plotted as mean ± SEM for clarity.
-
Figure 4—source data 1
Relates to Figure 4.
- https://cdn.elifesciences.org/articles/75219/elife-75219-fig4-data1-v3.xlsx
Figure 5

Recovery from short-term depression is accelerated on deletion of Kv3.3.
(A) WT (black),(B) Kv3.3KO (blue),(C) Kv3.1KO (orange). A representative example is shown for each genotype. A conditioning train of 100 Hz (800ms duration) evoked EPSCs displaying short-term depression. The recovery was estimated by delivery of single stimuli at intervals following the conditioning train (50ms, 100ms, 500ms, 1 s, 2 s, 5 s, 10 s, 20 s, and 30 s. Recovery intervals not to scale).(D) The mean EPSC amplitude during the recovery is plotted for each genotype (mean ± SD. WT, black; Kv3.3KO, blue; Kv3.1KO, orange) over the 30 s recovery period. The mean amplitude at the end of the conditioning train, from which the recovery starts, is shown by the respective coloured arrow. A double exponential was fit to each individual recovery curve and the mean curve is plotted for the respective genotype. Values are plotted as raw data and mean ± SD in E-G; N values from part D also apply here. (E) The percent contribution of the fast component is similar between genotypes. (F) The fast time-constant significantly accelerated from 0.4 s in WT to 0.2 s in the Kv3.3KO. (G) The slow time-constant at around 5 s was unchanged between genotypes.
-
Figure 5—source data 1
,Relates to Figure 5.
- https://cdn.elifesciences.org/articles/75219/elife-75219-fig5-data1-v3.xlsx
Figure 6
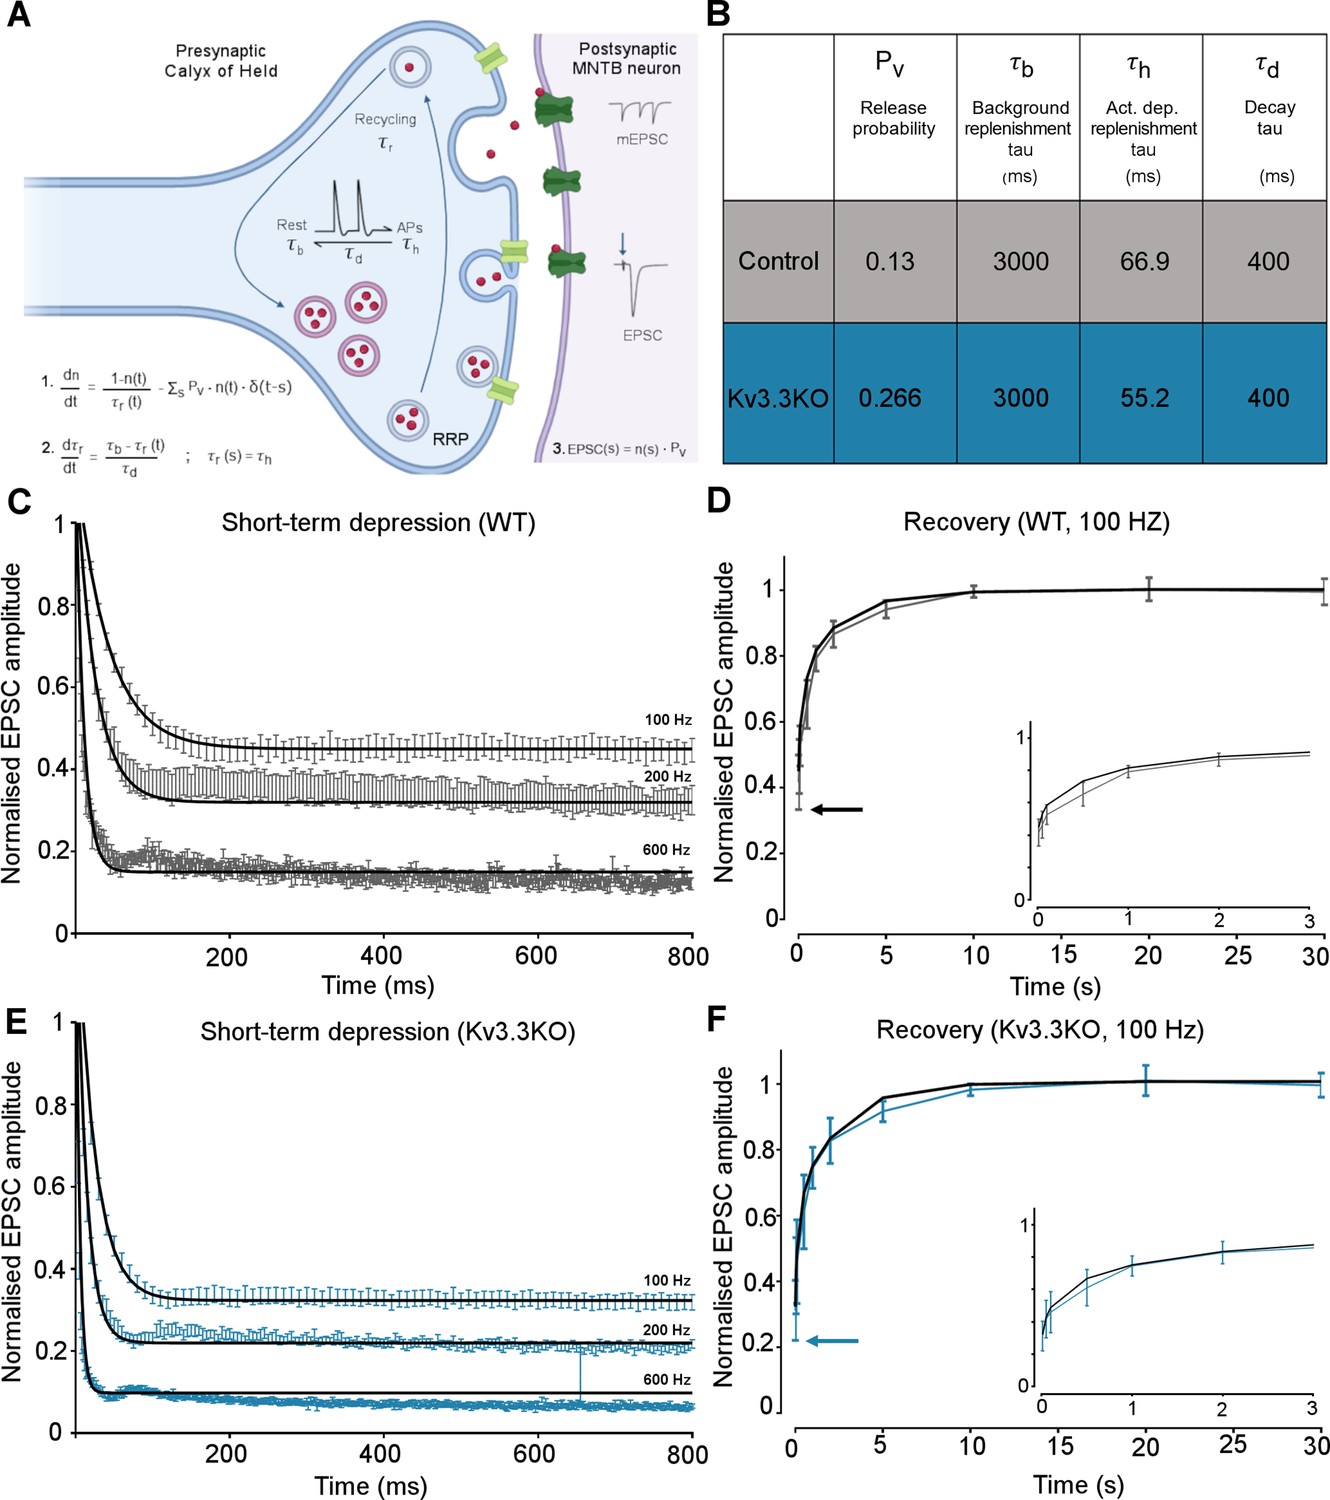
Kv3.3 deletion increases release probability and speeds a fast component of vesicle recycling, based on computational modelling.
(A) Model illustration: Vesicles are released from the readily releasable pool (RRP; normalized size n) with a probability Pv; the RRP is replenished with the recycling time-constant tr. In the absence of APs τr = τb – the background replenishment time-constant, which decreases (accelerates) to τh following a presynaptic AP, and decays back to τb with a time-constant τd. Model parameters were fit to WT data for evoked EPSC trains (100–600 Hz) and their 100 Hz recovery curves. Schematic created with BioRender.com. (B) Table showing the model parameters for fitting WT and Kv3.3KO data. Increasing Pv from 0.13 to 0.266 and accelerating τh from 66.9 to 52.2 were sufficient to fit the changes observed on Kv3.3 deletion. (C) WT - EPSC amplitude data (mean ± SEM) during the conditioning train (100, 200, and 600 Hz, grey) are plotted with superimposed model prediction curves (black). (D) WT 100 Hz: Recovery of the EPSC (mean ± SEM) over 30 s. Inset shows data and fit for the first 3 s. Model fit is the superimposed black line. Horizontal arrow indicates EPSC amplitude at the end of the conditioning train. (E )Kv3.3KO: EPSC amplitude data (mean ± SEM) during the conditioning trains are plotted (blue) with superimposed model prediction curves (black). (F) Kv3.3KO 100 Hz: Recovery of the EPSC amplitude (mean ± SEM) over 30 s. Inset shows data and fit for the first 3 s. Model fit is the superimposed line. Horizontal arrow indicates EPSC amplitude at the end of the conditioning train.
-
Figure 6—source data 1
Relates to Figure 6.
- https://cdn.elifesciences.org/articles/75219/elife-75219-fig6-data1-v3.xlsx
Figure 7

Kv3.3 deletion reduced ability to sustain MNTB AP firing at high frequencies.
(A) Percent firing success of MNTB neurons for 600 Hz calyceal stimulation is reduced for both Kv3.3KO and Kv3.1KO.(B) A representative AP train recorded for an MNTB neuron in response to 600 Hz synaptic stimulation lasting 800ms. Three phases of input:output firing defined: Phase I (green) 1:1 AP firing calyx:MNTB for each EPSC is prevalent early in the train. Phase II (dark blue) follows phase I where some EPSCs drop below threshold, and AP firing becomes less probable and chaotic. Phase III (black) MNTB AP firing becomes regular again but is now firing to alternate input EPSCs, restoring information transmission. Expanded sections (boxed) of each phase of AP firing are shown below the full trace, APs are indicated by ‘*’ and EPSPs that are below threshold are indicated by ‘.’. (C) Phase I duration across stimulation frequencies (100–600 Hz) for each genotype (WT, black; Kv3.3KO, blue; Kv3.1KO, orange): Phase I firing lasts throughout the train at frequencies up to 300 Hz but declines to only a few milliseconds at 600 Hz synaptic stimulation, but there were no significant differences between the genotypes. (D) The time spent in each phase for 600 Hz stimulation train (with each genotype indicated by the same colours as in C). The MNTB neuron is unable to maintain Phase I and Phase II dominates for each genotype. However, Phase III is only achieved briefly on 1 of 6 observations in the Kv3.3KO.(E) A sustained depolarized plateau was also observed, in the MNTB AP trains, as indicated by the shaded regions in this data from 300 Hz, and was particularly large the Kv3.1KO. (F) The amplitude of the depolarisation plateau increased in magnitude with stimulation frequency for each genotype, but was significantly larger in the Kv3.1KO at all frequencies above 100 Hz. (G) A slowly decaying depolarisation following the end of the synaptic train, as shown for representative traces from each genotype. (H) This decaying depolarisation is quantified as the time to half-decay and was significantly longer in the Kv3.1KO compared to WT in a 300 Hz AP train. (I) The postsynaptic MNTB neuron membrane time constant was unchanged across all genotypes (genotype: WT, black; Kv3.3KO, blue; Kv3.1KO, orange).
-
Figure 7—source data 1
Relates to Figure 7.
- https://cdn.elifesciences.org/articles/75219/elife-75219-fig7-data1-v3.xlsx
Figure 8
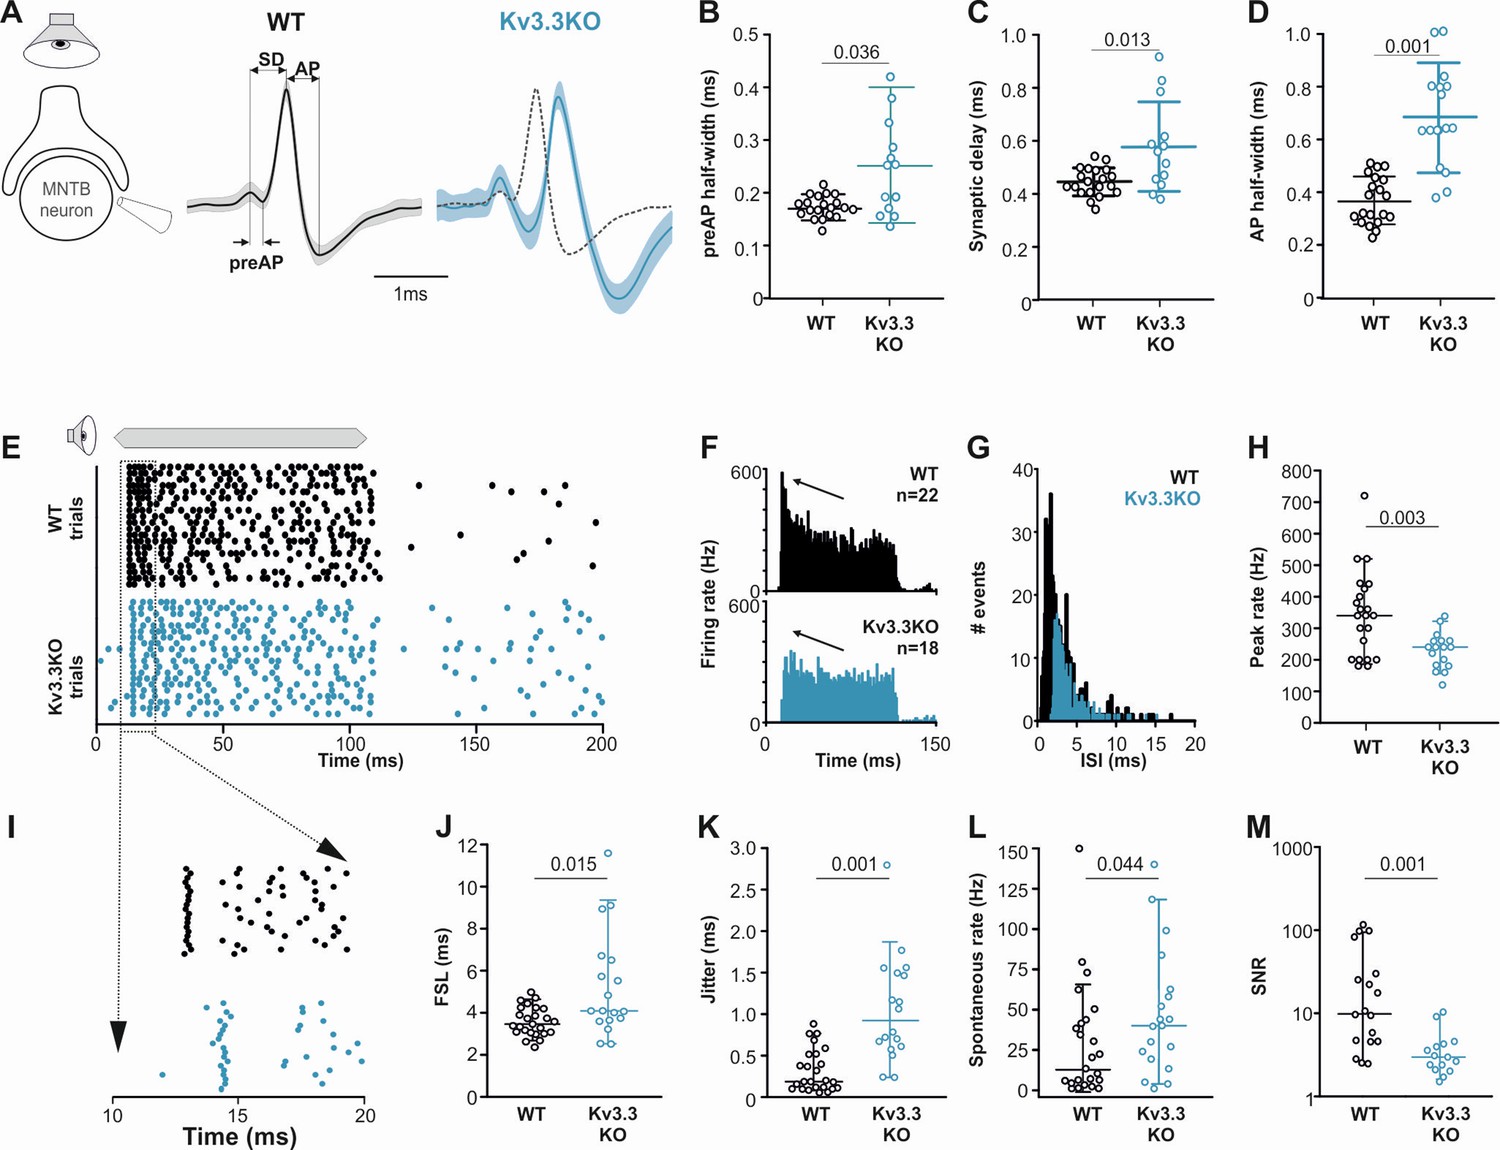
Presynaptic Kv3.3 accelerates the brainstem response to sound and improves timing and signal-to-noise ratio.
(A) Extracellular recording from Calyx/MNTB in vivo shows complex APs (presynaptic and postsynaptic) from WT (black) and Kv3.3KO (blue) mice in response to sound; overlay of APs (right) shows delayed and longer APs in the KO. (B, C, D) Presynaptic AP half-width, synaptic delay and postsynaptic AP half-width are all longer in the Kv3.3KO (blue) than WT (black).(E) Raster display of MNTB AP response to sound (20 trials, 100ms duration) and spontaneous firing for both WT (black, upper) and Kv3.3KO (blue, lower). (F, G, H) Peri Stimulus Time Histogram (PSTH) of the evoked APs (grand avg. over all neurons, 1ms bins) show reduced peak firing rates (F, black arrow) due to longer interspike intervals (ISIs) and increased jitter (I, K) in the Kv3.3KO (blue) and the peak (0–10ms of the response) firing rate is significantly reduced. (I, J, K) Expansion of first 20ms of the Raster plot shows increased first spike latency and jitter (latency SD) in the Kv3.3KO (blue). (L, M) The mean spontaneous firing rate was higher in the Kv3.3KO (blue) and overall, these changes degraded signal-to-noise ratio in Kv3.3KO (blue) relative to WT (black). Data is presented as median and inter-quartiles. p Values calculated using Mann-Whitney Rank Sum Test and statistically significant values displayed on each graph.
-
Figure 8—source data 1
Relates to Figure 8.
- https://cdn.elifesciences.org/articles/75219/elife-75219-fig8-data1-v3.xlsx
Tables
Table 1
Short-term depression was accelerated and enhanced in mice lacking Kv3.3.
Values shown are for parameters measured from data presented in Figure 3 for WT, Kv3.3KO and Kv3.1KO genotypes at 100 Hz to 600 Hz range. Paired pulse depression of EPSC responses recorded in MNTB neurons (EPSC2/EPSC1) was increased in Kv3.3 KO animals during high frequency stimulation of the calyx. The increased depression was maintained throughout the stimulation train (EPSC80/EPSC1) across all frequencies. The rate of short term-depression in EPSC amplitudes during EPSC trains (duration 800ms), measured as short-term depression (STD) decay tau was significantly increased in Kv3.3 KOs at 100 and 200 Hz compared to WT. This STD was more severe in mice lacking Kv3.3, as shown by decreased normalized steady-state EPSC amplitudes compared to WT. STD tau and steady state amplitudes were measured using a single exponential fit to normalized EPSC amplitudes throughout the 800ms stimulation trains. n=number of neurons. Values in bold are significantly different to WT (see statistics table for more detail). Data represented as mean ± SD.
| WT | Kv3.3KO | Kv3.1KO | ||
|---|---|---|---|---|
| 100 Hz | EPSC2/EPSC1 Ratio | 0.90±0.04 (n=21) | 0.75±0.08 (n=21) | 0.92±0.06 (n=17) |
| EPSC80/EPSC1 Ratio | 0.45±0.13 (n=21) | 0.32±0.08 (n=21) | 0.55±0.19 (n=17) | |
| STD tau (ms) | 41±7 (n=21) | 24±5 (n=21) | 45±2 (n=17) | |
| Norm. steady-state amp | 0.4±0.1 (n=21) | 0.3±0.08 (n=21) | 0.6±0.2 (n=17) | |
| 200 Hz | EPSC2/EPSC1 Ratio | 0.90±0.03 (n=10) | 0.71±0.1 (n=9) | 0.93±0.05 (n=5) |
| EPSC80/EPSC1 Ratio | 0.34±0.10 (n=10) | 0.22±0.03 (n=9) | 0.56±0.20 (n=5) | |
| STD tau (ms) | 25±6 (n=10) | 13±4 (n=9) | 33±5 (n=5) | |
| Norm. steady-state amp | 0.3±0.10 (n=10) | 0.2±0.03 (n=9) | 0.5±0.1 (n=5) | |
| 400 Hz | EPSC2/EPSC1 Ratio | 0.91±0.06 (n=8) | 0.68±0.10 (n=9) | 0.91±0.15 (n=6) |
| EPSC80/EPSC1 Ratio | 0.25±0.19 (n=8) | 0.1±0.02 (n=9) | 0.18±0.042 (n=6) | |
| STD tau (ms) | 7±5 (n=7) | 3±1 (n=6) | 5±2 (n=4) | |
| Norm. steady-state amp | 0.26±0.12 (n=6) | 0.12±0.04 (n=7) | 0.12±0.04 (n=3) | |
| 600 Hz | EPSC2/EPSC1 Ratio | 0.8±0.08 (n=10) | 0.7±0.1 (n=8) | 0.9±0.07 (n=5) |
| EPSC80/EPSC1 Ratio | 0.15±0.04 (n=10) | 0.09±0.01 (n=8) | 0.16±0.07 (n=5) | |
| STD tau (ms) | 11±2 (n=10) | 6±1 (n=8) | 20±13 (n=5) | |
| Norm. steady-state amp | 0.11±0.03 (n=10) | 0.07±0.01 (n=8) | 0.11±0.02 (n=5) | |
Key resources table
| Reagent type (species) or resource | Designation | Source or reference | Identifiers | Additional information |
|---|---|---|---|---|
| Genetic reagent (M. musculus) | CBA/Crl | Charles River | Strain code: 609 | Leicester breeding colony |
| Genetic reagent (M. musculus) | Kv3.1 knockout mouse on CBA back-ground (Kv3.1KO) | Ho et al, PNAS 94, 1533–1,538. 1997. | CBA/CaCrl.Kcnc1tm1Joho/UoL | Strain originally created on 129/SV background and backcrossed onto CBA for >10 generations at the Preclinical Research Facility – University of Leicester |
| Genetic reagent (M. musculus) | Kv3.3 knockout mouse on CBA back-ground (Kv3.3KO) | Espinosa et al., J Neurosci 21, 6657–6,665. 2001 | CBA/CaCrl. Kcnc3tm1Echa/UoL | Strain was originally created on C57BL/6 background and backcrossed onto CBA for >10 generations at the Preclinical Research Facility – University of Leicester |
| Commercial assay or kit | Illumina NextSeq500 High Output | Illumina | FC-404–2002 | Used for Cochlear Nucleus |
| Chemical compound, drug | Strychnine hydrochloride | Sigma Aldrich (MERCK) | S8753-25G | (0.5 µM) |
| Chemical compound, drug | Tetraethylammonium | Sigma Aldrich (MERCK) | 86614–25 G | (1 mM) |
| Chemical compound, drug | Fentanyl | Janssen | 6,001 | (0.05 mg/kg) |
| Chemical compound, drug | Midazolam | B Braun | 17206034 | (5.0 mg/kg) |
| Chemical compound, drug | Medetomidine | Vetoquil GmbH | Domitor | (0.5 mg/kg) |
| Antibody | Anti-Kv3.1b (rabbit polyclonal) | Alomone | APC-014 | (1:1000) |
| Antibody | Anti-Kv3.3 (mouse monoclonal) | Neuromab | 75–354 | (1:3000) |
| Antibody | Alexafluor488 Goat anti-rabbit (Goat polyclonal) | Thermofisher | A-11008 | (1:1000) |
| Antibody | Alexafluor546 Goat anti-mouse (Goat polyclonal) | Thermofisher | A-11003 | (1:1000) |
| Antibody | Anti-Kv3.1b (rabbit polyclonal) | Synaptic systems | 242 003 (Lot# 1–2) | (1:300) |
| Antibody | Anti-Kv3.3 (rabbit polyclonal) | Alomone | APC-102 (Lot# APC 102AN0502) | (1:300) |
| Antibody | Anti-Bassoon (mouse monoclonal) | Synaptic systems | 141 111 (Lot# 1–2) | (1:300) |
| Antibody | Alexafluor488 Goat anti-mouse (goat polyclonal) | Invitrogen | A11001 (Lot# 21 40660) | (1:300) |
| Antibody | Alexafluor546 Goat anti-rabbit (goat polyclonal) | Invitrogen | A11010 (Lot# 21 89179) | (1:300) |
| Software, algorithm | Graphpad Prism 9.0.2 | Graphpad | RRID:SCR _002798 | |
| Software, algorithm | pClamp 10 software suite | Molecular Devices | RRID:SCR _011323 | |
| Software, algorithm | Zen Blue, 3.1 | Zeiss | RRID:SCR _013672 | |
| Software, algorithm | ABR Averager (Custom) | Wellcome Trust Sanger Institute | ||
| Software, algorithm | AudioSpike | HoerrTech | https://audiospike.hz-ol.de/ | |
| Software, algorithm | MATLAB R2010a | Mathworks | RRID:SCR_001622 | |
| Software, algorithm | Fiji | NIH ImageJ | RRID:SCR_002285 | |
| Other | Custom concentric bipolar stimulating electrodes | FHC | CBASD75 | |
| Other | Borosilicate glass capillaries | WPI | GC150F-7.5 |
Additional files
-
Supplementary file 1
Summary table of averaged data and statistical tests presented in the figures, including significant (red) and non-significant values (black).
Data are presented in the same order as figures appear in the article. Details are provided about the number of animals, number of cells, statistical test used and calculated p values.
- https://cdn.elifesciences.org/articles/75219/elife-75219-supp1-v3.xlsx
-
Transparent reporting form
- https://cdn.elifesciences.org/articles/75219/elife-75219-transrepform1-v3.docx
Download links
A two-part list of links to download the article, or parts of the article, in various formats.
Downloads (link to download the article as PDF)
Open citations (links to open the citations from this article in various online reference manager services)
Cite this article (links to download the citations from this article in formats compatible with various reference manager tools)
Kv3.3 subunits control presynaptic action potential waveform and neurotransmitter release at a central excitatory synapse
eLife 11:e75219.
https://doi.org/10.7554/eLife.75219


