Proteogenomic analysis of cancer aneuploidy and normal tissues reveals divergent modes of gene regulation across cellular pathways
- Institute for Systems Genetics and Department of Biochemistry and Molecular Pharmacology, NYU School of Medicine, United States
- Moores Cancer Center, University of California San Diego, United States
- Würzburg Institute of Systems Immunology, Max Planck Research Group at the Julius-Maximilians-Universität Würzburg, Germany
- International Max Planck Research School for Immunobiology, Epigenetics, and Metabolism, Germany
- Faculty of Biology, University of Freiburg, Germany
- Department of Pathology, NYU School of Medicine, United States
- Helmholtz Institute for RNA-based Infection Research (HIRI), Helmholtz-Center for Infection Research, Germany
Figures
Figure 1 with 2 supplements

RNA-level and protein-level gene compensation after somatic copy number alteration (SCNA) across tumor types.
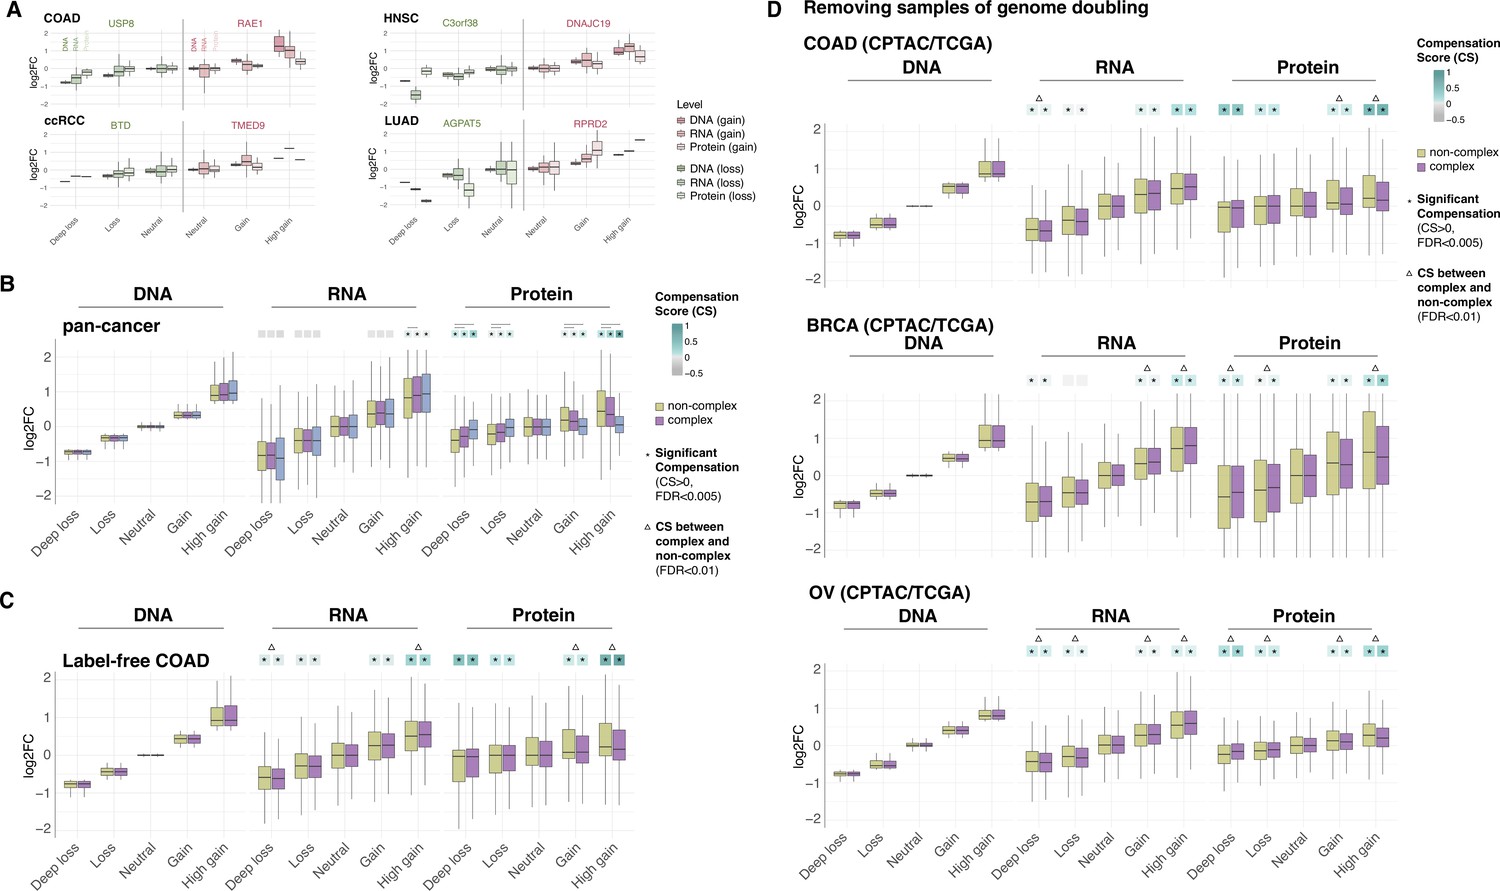
(A) Schematic of RNA-level and protein-level gene compensation as a result of DNA gains (red) or losses (light blue). RNA and protein abundance change proportionally to the DNA change when gene compensation is absent. (B) Box plots showing the Clinical Proteomic Tumor Analysis Consortium (CPTAC) pan-cancer profile of DNA, RNA, and protein log2 fold change (log2FC) in five groups based on the copy number change: deep loss, loss, neutral, gain, and high gain. The genes of each group were separated in protein complex genes (purple) and non-complex genes (yellow). The median of the compensation score (CS) in each condition, which represents the degree of gene compensation, is shown at the top of the box plot (cyan/gray squares). CS is positive when compensation happens (cyan) and is proportional to the degree of compensation. To test whether CS were significantly positive, we used a bootstrapping test and p-values were corrected for false discovery rate (FDR). An asterisk in the square indicates significant CS (CS > 0 and FDR < 0.005). A triangle above the squares indicates that the CS of complex and non-complex genes is significantly different by bootstrapping test (FDR < 0.005). (C) Box plots showing the profiles of DNA, RNA, and protein log2FC of the indicated cancer types grouped in five groups as in (B). The median CS is shown at the top of the box plots (cyan/gray squares). An asterisk in the square represents significant compensation (CS > 0 and FDR < 0.005). A triangle above the squares indicates that the CS of complex and non-complex genes is significantly different by bootstrapping test (FDR < 0.005). (D) Heatmap showing the RNA-level and protein-level CS of different cancers. Cancers were clustered by Euclidean distance and hierarchical clustering. For all box plots, box sizes represent the interquartile range (IQR), whiskers expand to± 1.5*IQR of the box limits, and outliers beyond the whisker limits are not shown.
Figure 1—figure supplement 1
Gene compensation is not biased by genes encoding ribosome subunits, technical limitations of proteome detection, or genome doubling.
(A) Box plots showing the profiles of DNA, RNA, and protein log2 fold change (log2FC) of representative genes for the indicated cancer type. Samples were separated in different groups based on the copy number change as in Figure 1B. DNA, RNA, and protein log2FC in each group are shown for genes that are gained (shades of red) or lost (shades of green). (B) Box plots showing the Clinical Proteomic Tumor Analysis Consortium (CPTAC) pan-cancer profile of DNA, RNA, and protein log2FC in five groups of DNA change. The genes of each group were separated in non-ribosome protein complex genes (purple), ribosome complex genes (blue), and non-complex genes (yellow). (C) Box plots showing the colon adenocarcinoma (COAD) profile of DNA, RNA, and protein log2FC in five groups of DNA change. The proteome was measured by a label-free method. (D) Box plots showing the profiles of DNA, RNA, and protein log2FC of the indicated cancer types grouped in five groups of DNA change. The samples of genome doubling were removed from the analysis. The median of compensation score (CS) in each condition is shown at the top of the box plot (cyan/gray squares). An asterisk in the square indicates significant CS (CS > 0 and false discovery rate [FDR] < 0.005). A line (B) or triangle (C, D) above the squares indicates that the CS of complex and non-complex genes is significantly different by bootstrapping test (FDR < 0.005). For all box plots, box sizes represent the interquartile range (IQR), whiskers expand to± 1.5*IQR of the box limits, and outliers beyond the whisker limits are not shown.
Figure 1—figure supplement 2
Gene compensation at the RNA and protein levels in cancer cell lines and isogenic human colon epithelial cell (hCEC).
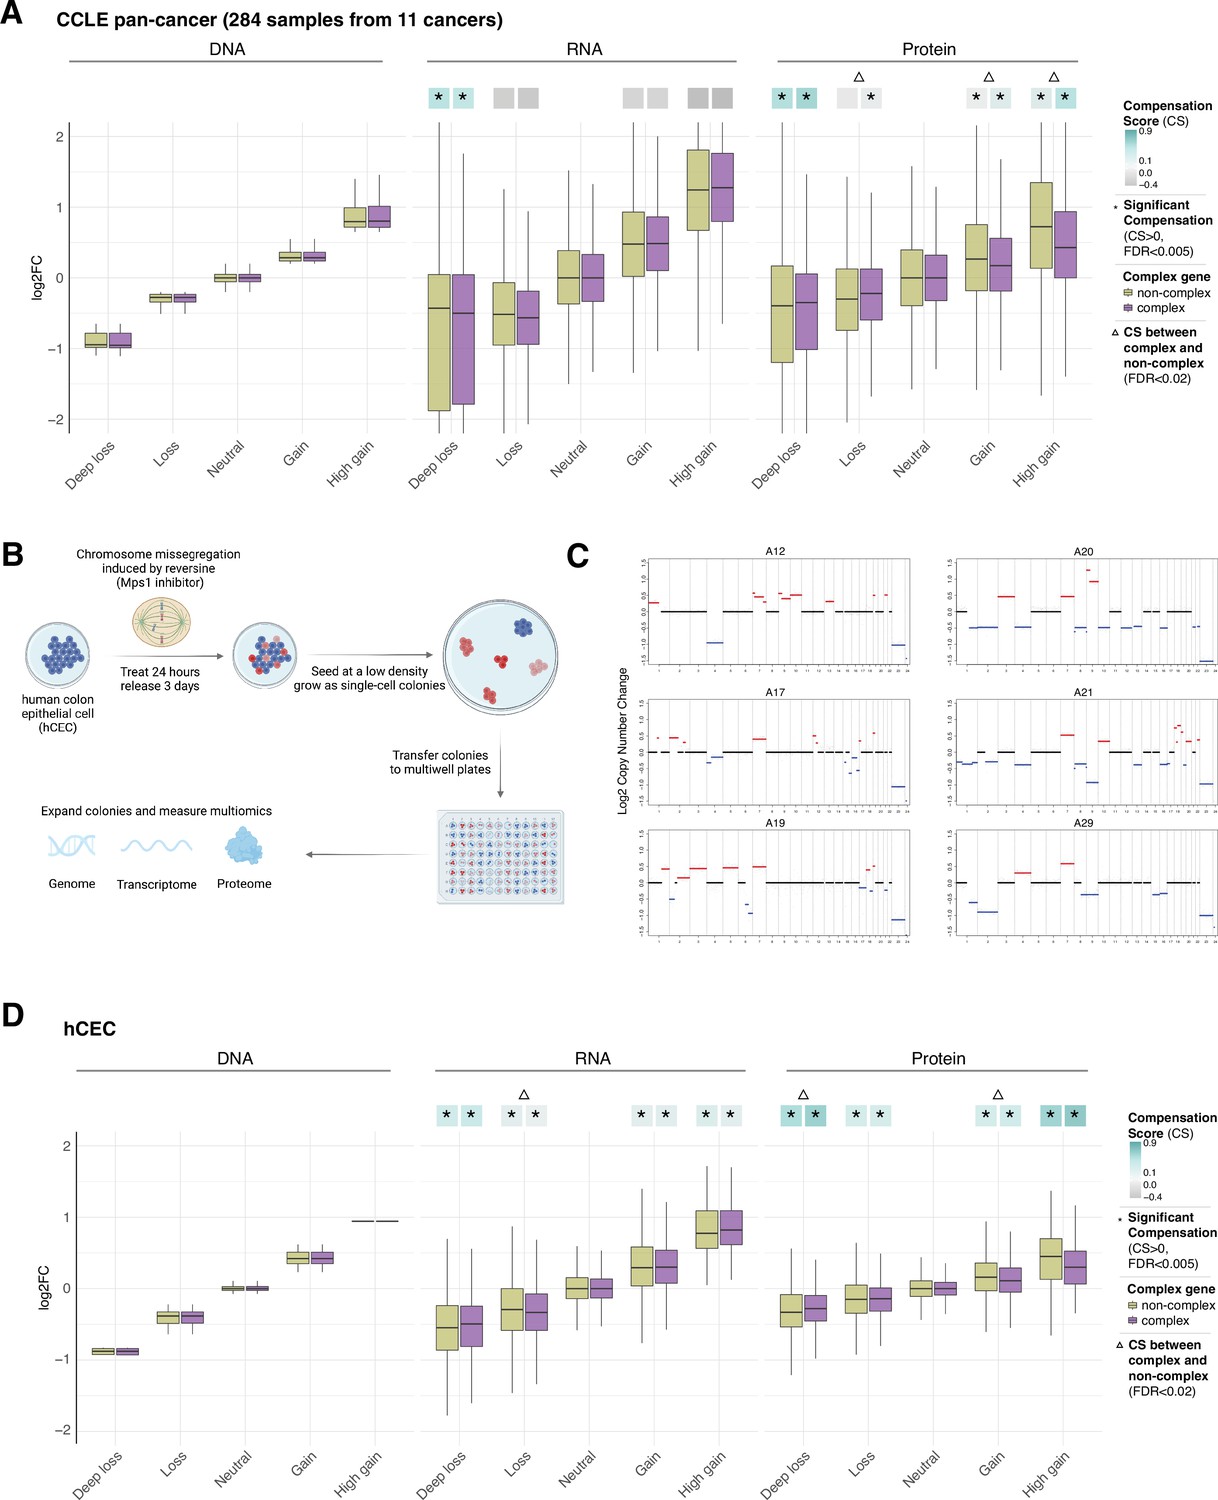
(A) Box plots showing the Cancer Cell Line Encyclopedia (CCLE) pan-cancer profile of DNA, RNA, and protein log2 fold change (log2FC) in five groups of DNA change. The genes of each group were separated in complex genes (purple) and non-complex genes (yellow). (B) Schematic of the generation of isogenic immortalized non-transformed hCEC with aneuploidy. hTERT-immortalized TP53-KO non-tumorigenic hCEC were treated by reversine; the cells were plated at a low density and grew until the colonies formed. To identify the levels and patterns of aneuploidy, the clones were sequenced by shallow whole-genome sequencing. Transcriptome and proteome were measured by RNA-sequencing and mass spectrometry. (C) The CNV profile of hCEC clones where red represents DNA gains while blue represents DNA losses (see also Supplementary file 1H). (D) Box plots showing the hCEC profile of DNA, RNA, and protein log2FC in five groups of DNA change. The genes of each group were separated to complex genes (purple) and non-complex genes (yellow). In (A) and (D), the median CSs in each condition are shown at the top of the box plot (cyan/gray squares). CS is positive when compensation occurs (cyan). An asterisk in the square represents significant compensation by bootstrapping test (false discovery rate [FDR] < 0.005). A triangle above the squares indicates that the CS of complex and non-complex genes is significantly different by bootstrapping test (FDR < 0.02). For all box plots, box sizes represent the interquartile range (IQR), whiskers expand to± 1.5*IQR of the box limits, and outliers beyond the whisker limits are not shown.
Figure 2 with 1 supplement
Protein complex genes have a stronger protein-level regulation but a weaker RNA-level regulation than non-complex genes.
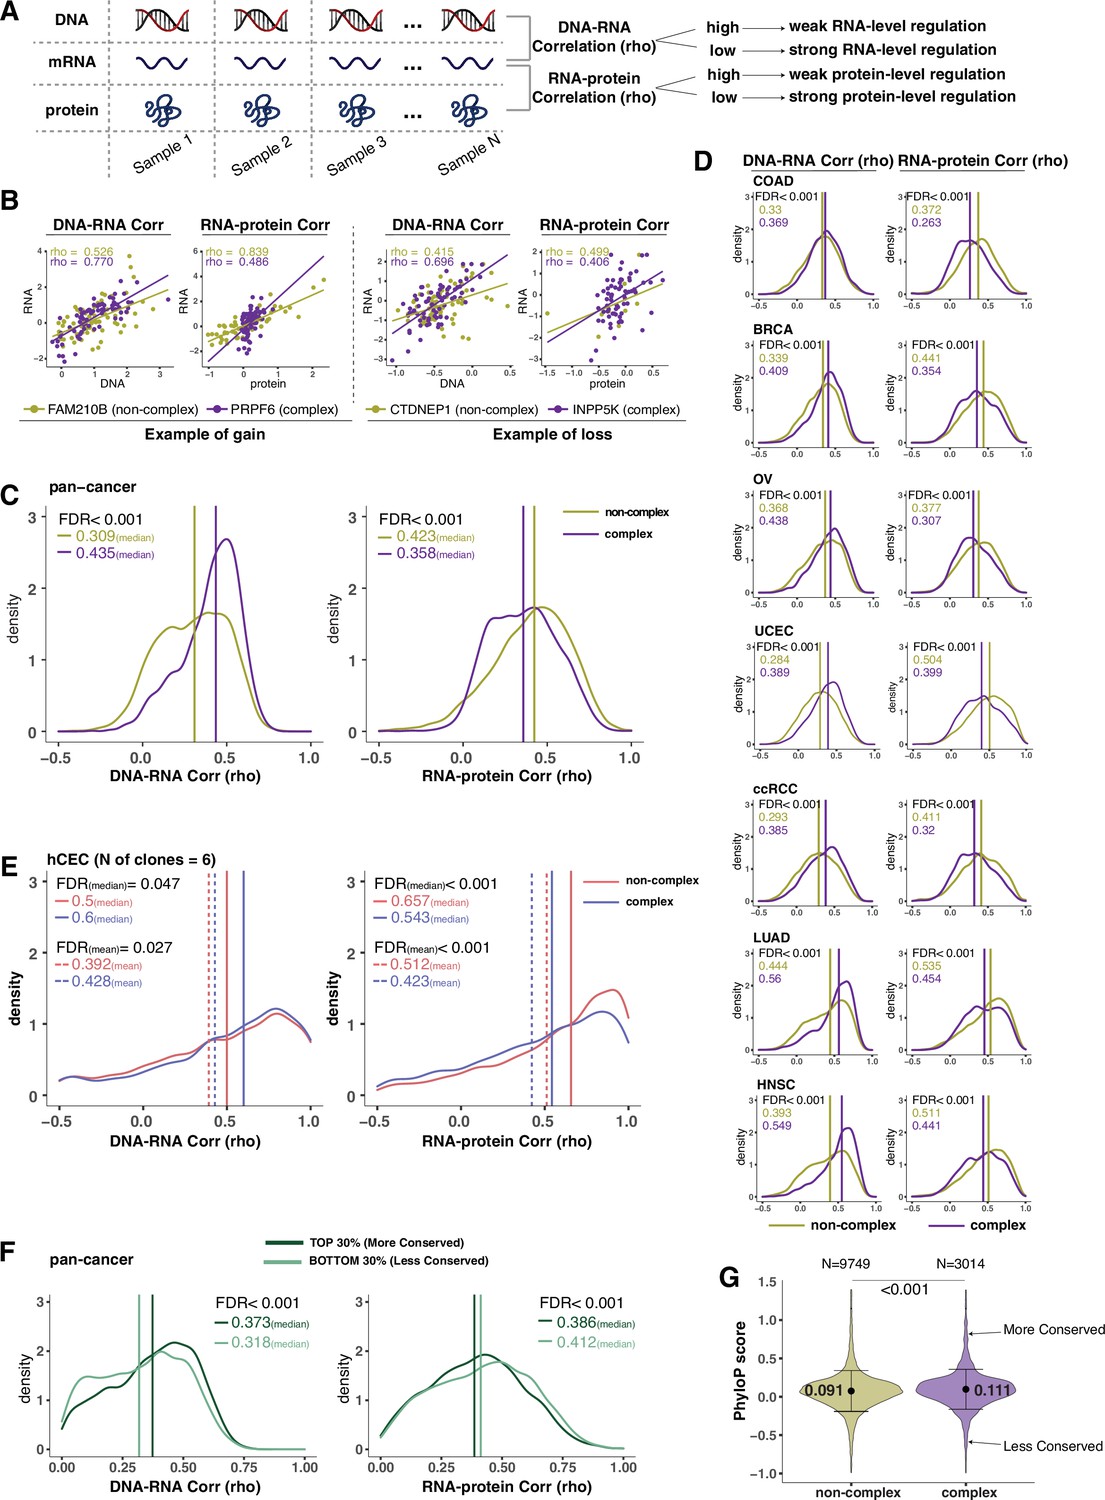
(A) Schematic representing the strategy to infer the degree of RNA- or protein-level regulation by Spearman’s correlation analysis between DNA and RNA (DNA–RNA) or between RNA and protein (RNA–protein). A high (versus low) correlation indicates a weak (versus strong) regulation. (B) DNA–RNA and RNA–protein correlations for representative complex and non-complex genes frequently gained (FAM210B and PRPF6) or lost (CTDNEP1 and INPP5K) in colon adenocarcinoma (COAD). Dots represent different samples; solid lines indicate the linear regression line between DNA–RNA and RNA–protein; Spearman’s correlation is shown for each gene. (C) Density distribution of DNA–RNA and RNA–protein correlations for pan-cancer analysis (protein complex genes in purple and non-complex genes in golden yellow). Vertical lines and numbers in the top left represent the median correlation of protein complex genes or non-complex genes. Difference of the median correlation coefficients between protein complex genes and non-complex genes was evaluated by bootstrapping, and p-values were adjusted for false discovery rate (FDR). (D) Density distribution of DNA–RNA and RNA–protein correlations for individual Clinical Proteomic Tumor Analysis Consortium (CPTAC) cancer types as in (C). (E) Density distribution of DNA–RNA and RNA–protein correlations for human colon epithelial cell (hCEC) cell lines (protein complex genes in blue and non-complex genes in red). Blue/red vertical solid (or dashed) lines and numbers in the top left represent the median (or mean) correlation of protein complex or non-complex genes. Difference of the median correlation coefficients between protein complex genes and non-complex genes was evaluated by bootstrapping, and p-values were adjusted for FDR. (F) Density distribution of DNA–RNA and RNA–protein correlations for evolutionally more conserved genes (dark green; genes in the top 30% of phyloP scores) and less conserved genes (light green; genes in the bottom 30% of phyloP scores). Dark green or light green vertical lines and numbers in the top right represent the median of the more conserved or less conserved genes, respectively. Difference of the median correlation coefficients between more and less conserved genes was evaluated by bootstrapping, and p-values were adjusted for FDR. (G) The phyloP score difference between protein complex genes and non-complex genes. Difference between protein complex genes and non-complex genes was evaluated by bootstrapping, and p-values were adjusted for FDR. The error bars represent standard deviation.
Figure 2—figure supplement 1
DNA–RNA and RNA–protein correlations across complex and non-complex genes among cell lines and normal tissues.
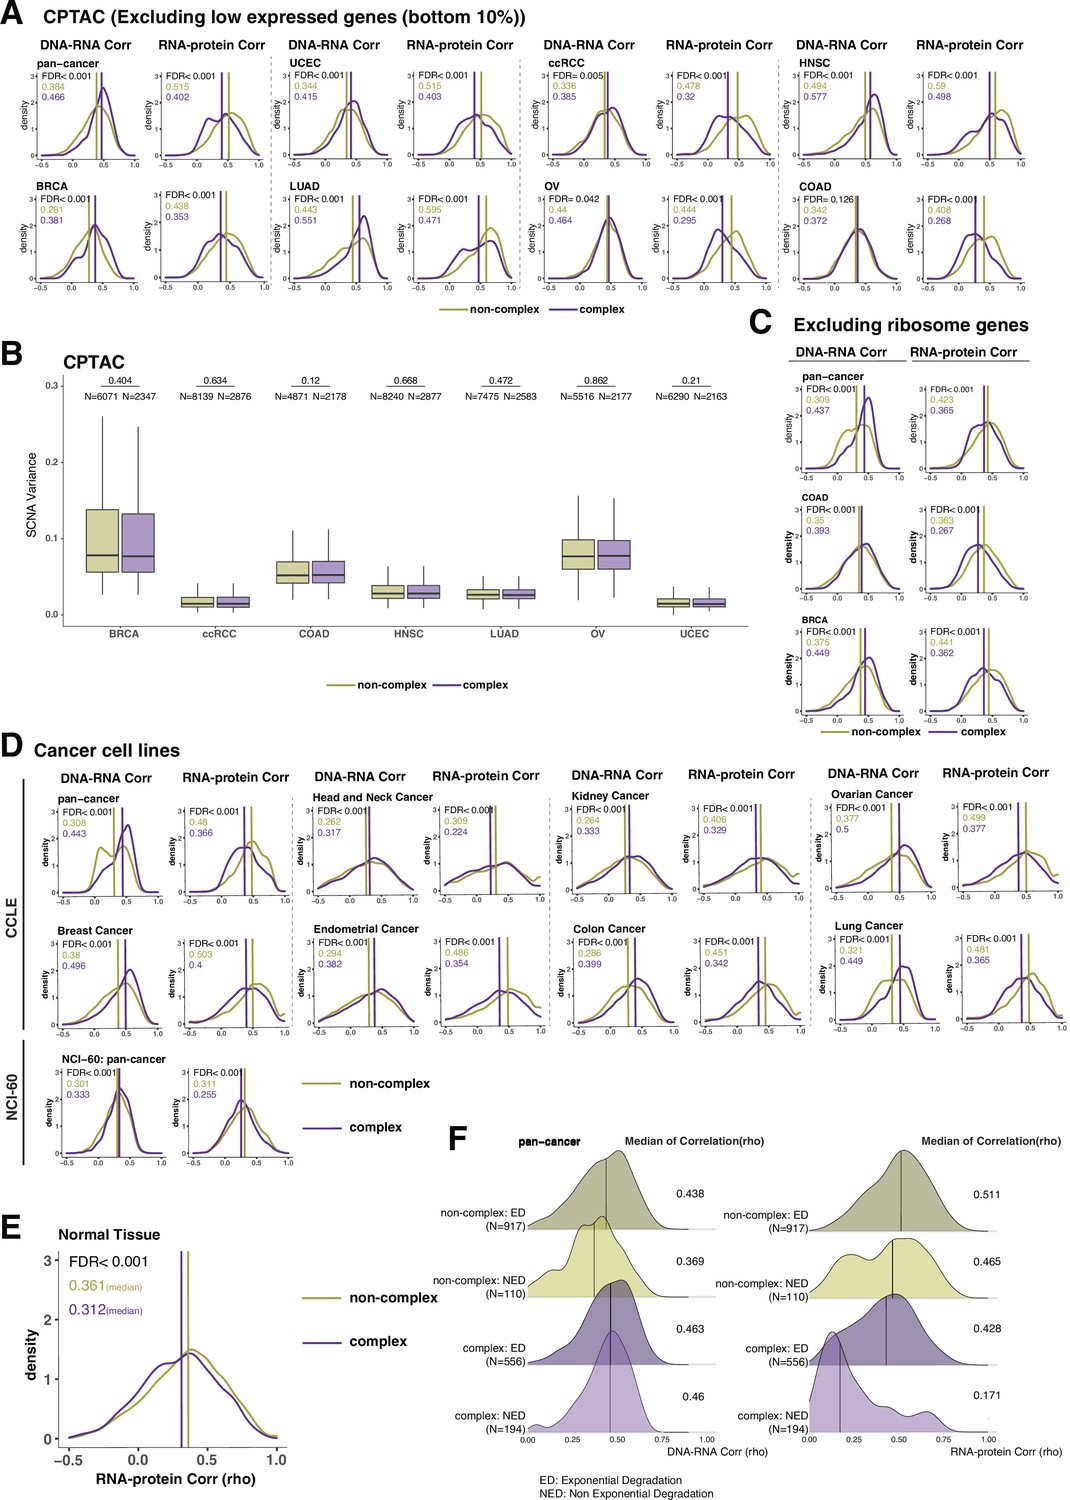
(A) Density distribution of DNA–RNA and RNA–protein correlations among different Clinical Proteomic Tumor Analysis Consortium (CPTAC) cancer types after removing bottom 10% of low expressed genes. (B) Box plot showing the somatic copy number alteration (SCNA) variance among complex and non-complex genes across different cancer types in CPTAC. p-Values comparing SCNA variance in complex and non-complex genes were calculated using the Wilcoxon test. Box sizes represent the interquartile range (IQR), whiskers expand to± 1.5*IQR of the box limits, and outliers beyond the whisker limits are not shown. (C) Density distribution of DNA–RNA and RNA–protein correlations (CPTAC pan-cancer, colon adenocarcinoma [COAD] and breast cancer [BRCA]) after removing ribosome complex genes. (D) Density distributions of DNA–RNA and RNA–protein correlations among different cell lines (Cancer Cell Line Encyclopedia [CCLE] and NCI-60). (E) Density distribution of RNA–protein correlations for normal tissue (Wang et al., 2019). In (A, C–E), purple or golden yellow lines and numbers in the top left represent the median correlation of complex or non-complex genes, respectively. The difference between complex and non-complex genes was statistically evaluated based on bootstrapping test and adjusted for false discovery rate (FDR). (F) Density plots of DNA–RNA and RNA–protein correlations for exponential degradation (ED) and non-exponential degradation (NED) genes based on McShane et al., 2016. Numbers at the right side of the figure represent the median of the correlation value of the density.
Figure 3 with 2 supplements
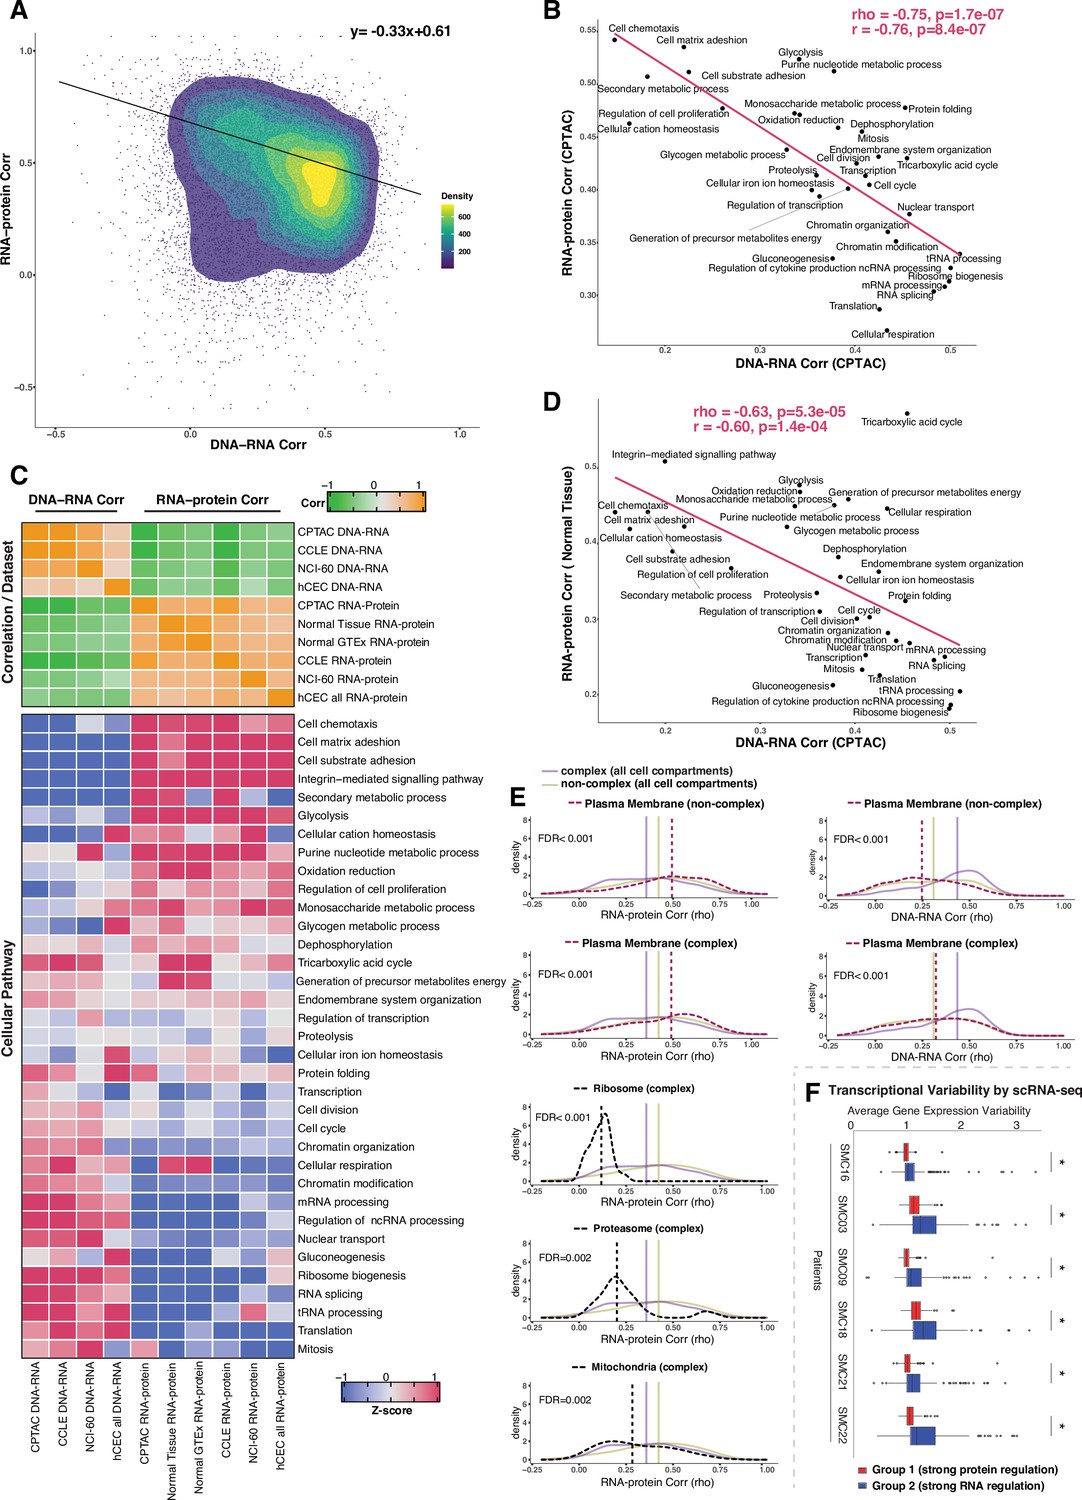
Negative association between RNA- and protein-level regulation across genes and pathways.
(A) Dot plot showing the association between DNA–RNA and RNA–protein correlation, where each point is a gene. Density distribution is shown and a density distribution-dependent slope was calculated to estimate the association between the DNA–RNA and RNA–protein correlations. (B) A pathway-level analysis for the association between DNA–RNA and RNA–protein correlations (pan-cancer analysis, Clinical Proteomic Tumor Analysis Consortium [CPTAC]). The DNA–RNA (x-axis) and RNA–protein (y-axis) correlation for each cellular pathway was calculated using the median rho value across all genes belonging to the pathway (pathway database: msigdbr, v7.4.1, category = C5). Spearman’s (rho) and Pearson’s (r) correlation coefficients are shown at the top right of the panel. (C) Top panel: a heatmap showing Spearman’s correlations among different proteogenomic datasets. For each dataset, we first calculated the DNA–RNA and RNA–protein rho values for each gene, and then we calculated the Spearman’s correlation between these rho values (DNA–RNA rho or RNA–protein rho) across datasets. Bottom panel: a heatmap showing the pathway-level DNA–RNA and RNA–protein correlation score among different datasets. The pathway-level score was calculated by the median value across all genes in the same pathway and then Z-score transformed (pathway database: msigdbr, v7.4.1, category = C5). (D) A pathway-level analysis for the DNA–RNA (CPTAC) and RNA–protein (normal tissues, Wang et al., 2019) correlations. The DNA–RNA (x-axis) and RNA–protein (y-axis) correlation for each cellular pathway was calculated using the median rho value across all genes belonging to the pathway (pathway database: msigdbr, v7.4.1, category = C5). Spearman’s (rho) and Pearson’s (r) correlation coefficients are shown at the top right of the panel. (E) Density distribution of DNA–RNA correlations for genes belonging plasma membrane and RNA–protein correlations for genes belonging to ribosome, proteasome, mitochondria, and plasma membrane. The dashed line represents the specific cell compartment as indicated, the transparent purple or golden yellow line represents the median of complex (all cell compartments) or non-complex genes (all cell compartments). Significance between the genes in the specific cell compartment and complex or non-complex genes of all cell compartments was evaluated based on bootstrapping test and adjusted for false discovery rate (FDR). For example, the FDR in the top left panel was evaluated based on the difference between plasma membrane (non-complex) and complex genes from all cell compartments. (F) Gene-wise variability levels of scRNAseq data from Korean colorectal cancer patients (Lee et al., 2020) estimated by VarID (Grün, 2020). Genes were grouped according to their preferential regulation at the protein level (Group 1) or RNA level (Group 2). The averages of corrected variance estimates per gene are shown (‘Methods’). Box sizes represent the interquartile range (IQR), whiskers expand to± 1.5*IQR of the box limits, and outliers beyond the whisker limits are also shown. p-adjusted value: *<0.001 (one-sided Wilcoxon test with Bonferroni correction).
Figure 3—figure supplement 1
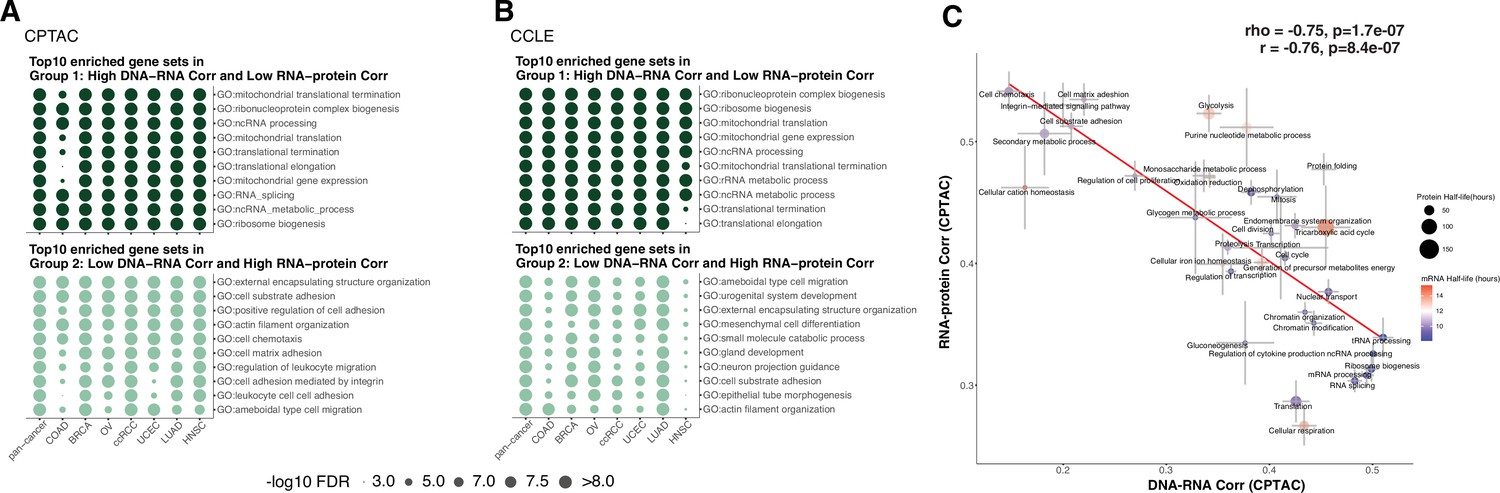
Enriched gene sets among genes with different regulation in primary tumors and cell lines.
(A) Top 10 Gene Ontology enriched gene sets of genes in Group 1 (high DNA–RNA correlation, low RNA–protein correlation; high protein-level regulation) in dark green and in Group 2 (low DNA–RNA correlation, high RNA–protein correlation; high RNA-level regulation) in light green among different cancer types (Clinical Proteomic Tumor Analysis Consortium [CPTAC]) (see text and ‘Methods’). Dot size represents the significance of the false discovery rate (FDR) as indicated. (B) Top 10 Gene Ontology enriched gene sets in Group 1 and 2 genes as (A) among different cancer cell lines (Cancer Cell Line Encyclopedia [CCLE]). Dot size represents the significance of the FDR. (C) A pathway-level analysis calculated and shown as Figure 3B but also displaying the standard error (SE) calculated among the genes in the same pathway. The pathway dot size and color represent the half-life of protein (h) and mRNA (h), respectively. The error bars represent standard error of the mean.
Figure 3—figure supplement 2
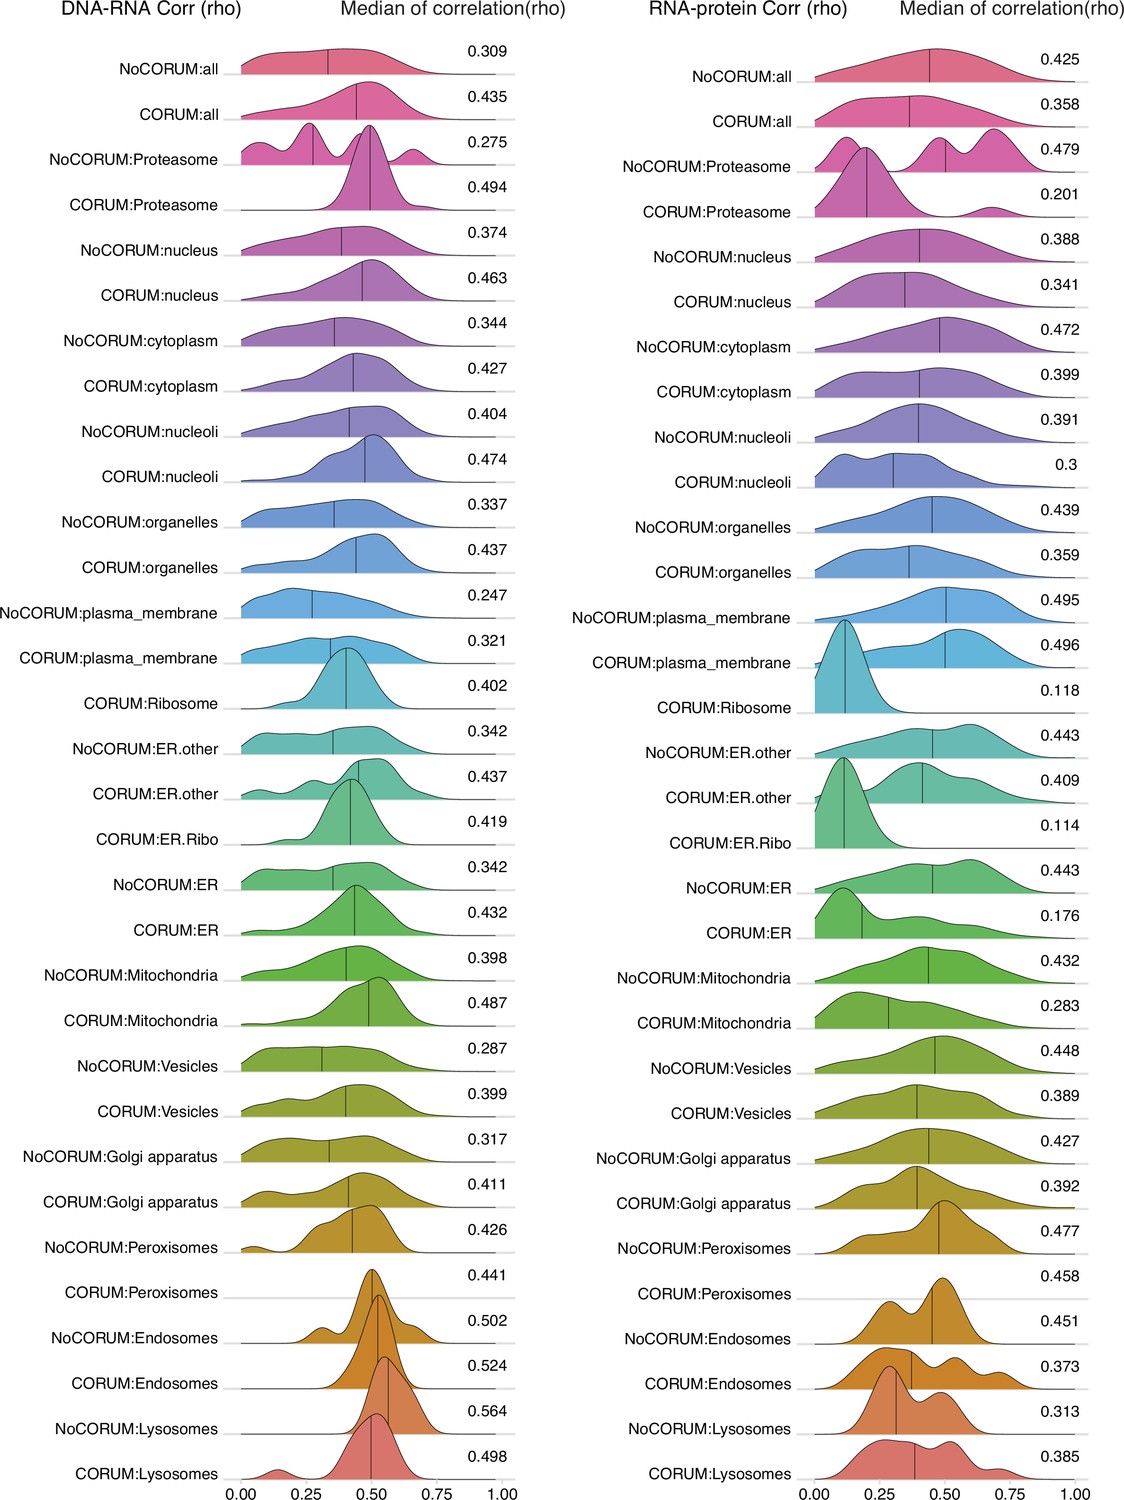
DNA–RNA and RNA–protein correlations among genes localized in different cellular compartments.
Density plots of DNA–RNA and RNA–protein correlations for all cell compartments in Clinical Proteomic Tumor Analysis Consortium (CPTAC) pan-cancer analysis. Numbers at the right side of the figure represent the median of the correlation value of the density.
Figure 4
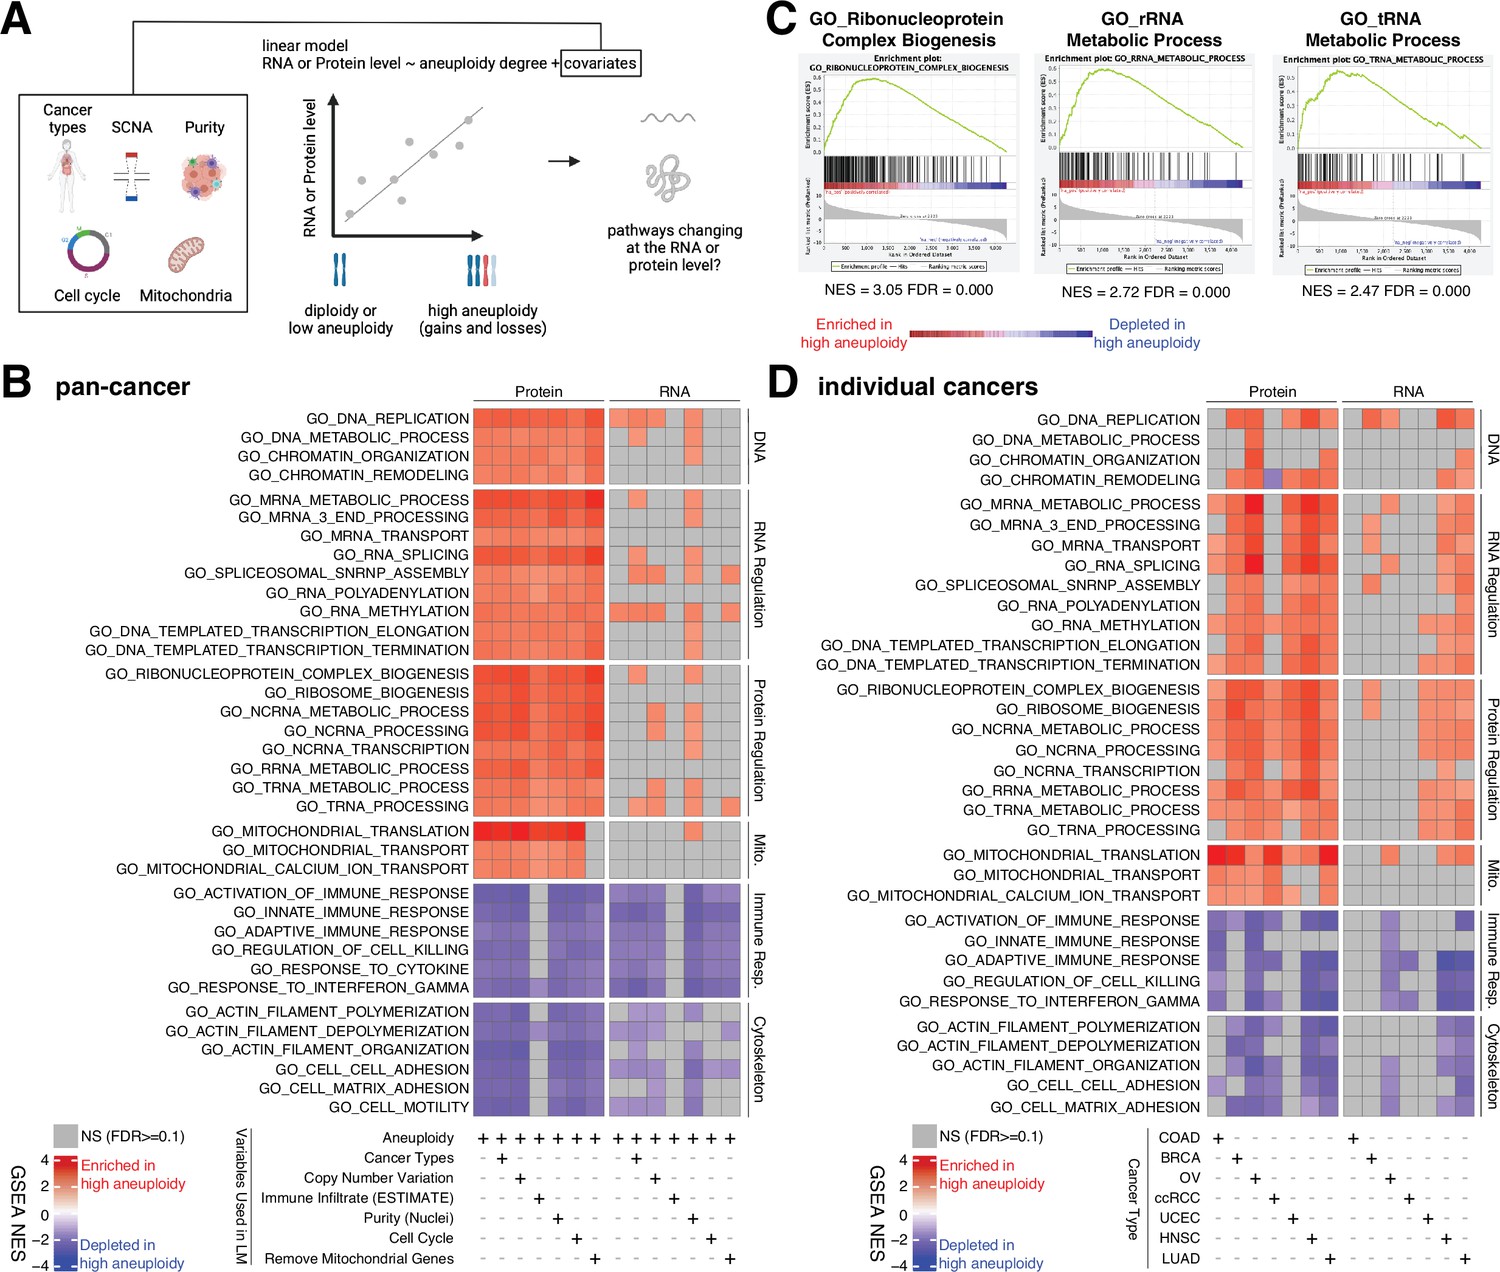
Analysis of pathways dysregulated at the RNA and protein levels in high aneuploidy tumor samples.
(A) Schematic of the method used to identify pathways changing at the RNA and protein levels in samples of high aneuploidy. The aneuploidy degree of primary tumors (Clinical Proteomic Tumor Analysis Consortium [CPTAC]) was used to fit the RNA or protein level of each gene by linear models. Several covariates were included in the model one by one, including cancer type, gene-level copy number variation, purity, cell cycle, and mitochondria. t-values associated to the aneuploidy score were used to rank genes for Gene Set Enrichment Analysis (GSEA). (B) A heatmap showing the enrichment score for the indicated pathways significantly enriched (red) or depleted (blue) in high versus low aneuploidy tumor samples. Specific gene sets related to DNA, RNA, and protein regulation and mitochondria are enriched, and those related to immune response and cytoskeleton are depleted at the protein level in aneuploid tumor tissues. Covariates were included in the model to control for cancer types, gene-level copy number variation, purity, and cell cycle scores. Mitochondrial genes were removed in the last column. The gene sets whose false discovery rate (FDR) are larger than 0.1 are shown in gray. (C) Enrichment plots of three pathways related to protein translation in tumor tissues at the protein level: ribonucleoprotein complex biogenesis, rRNA metabolic process, and tRNA metabolic process. The normalized enrichment scores and FDR are shown below the corresponding enrichment plots. (D) A heatmap showing the enrichment of the same gene sets as (B) in individual cancer types. RNA or protein expression for each gene was fit by the aneuploidy degree without the inclusion of other covariates. Gene sets enriched in high aneuploid samples are in red while those depleted in high aneuploid samples are in blue. The gene sets whose FDR are larger than 0.1 are shown in gray.
Figure 5
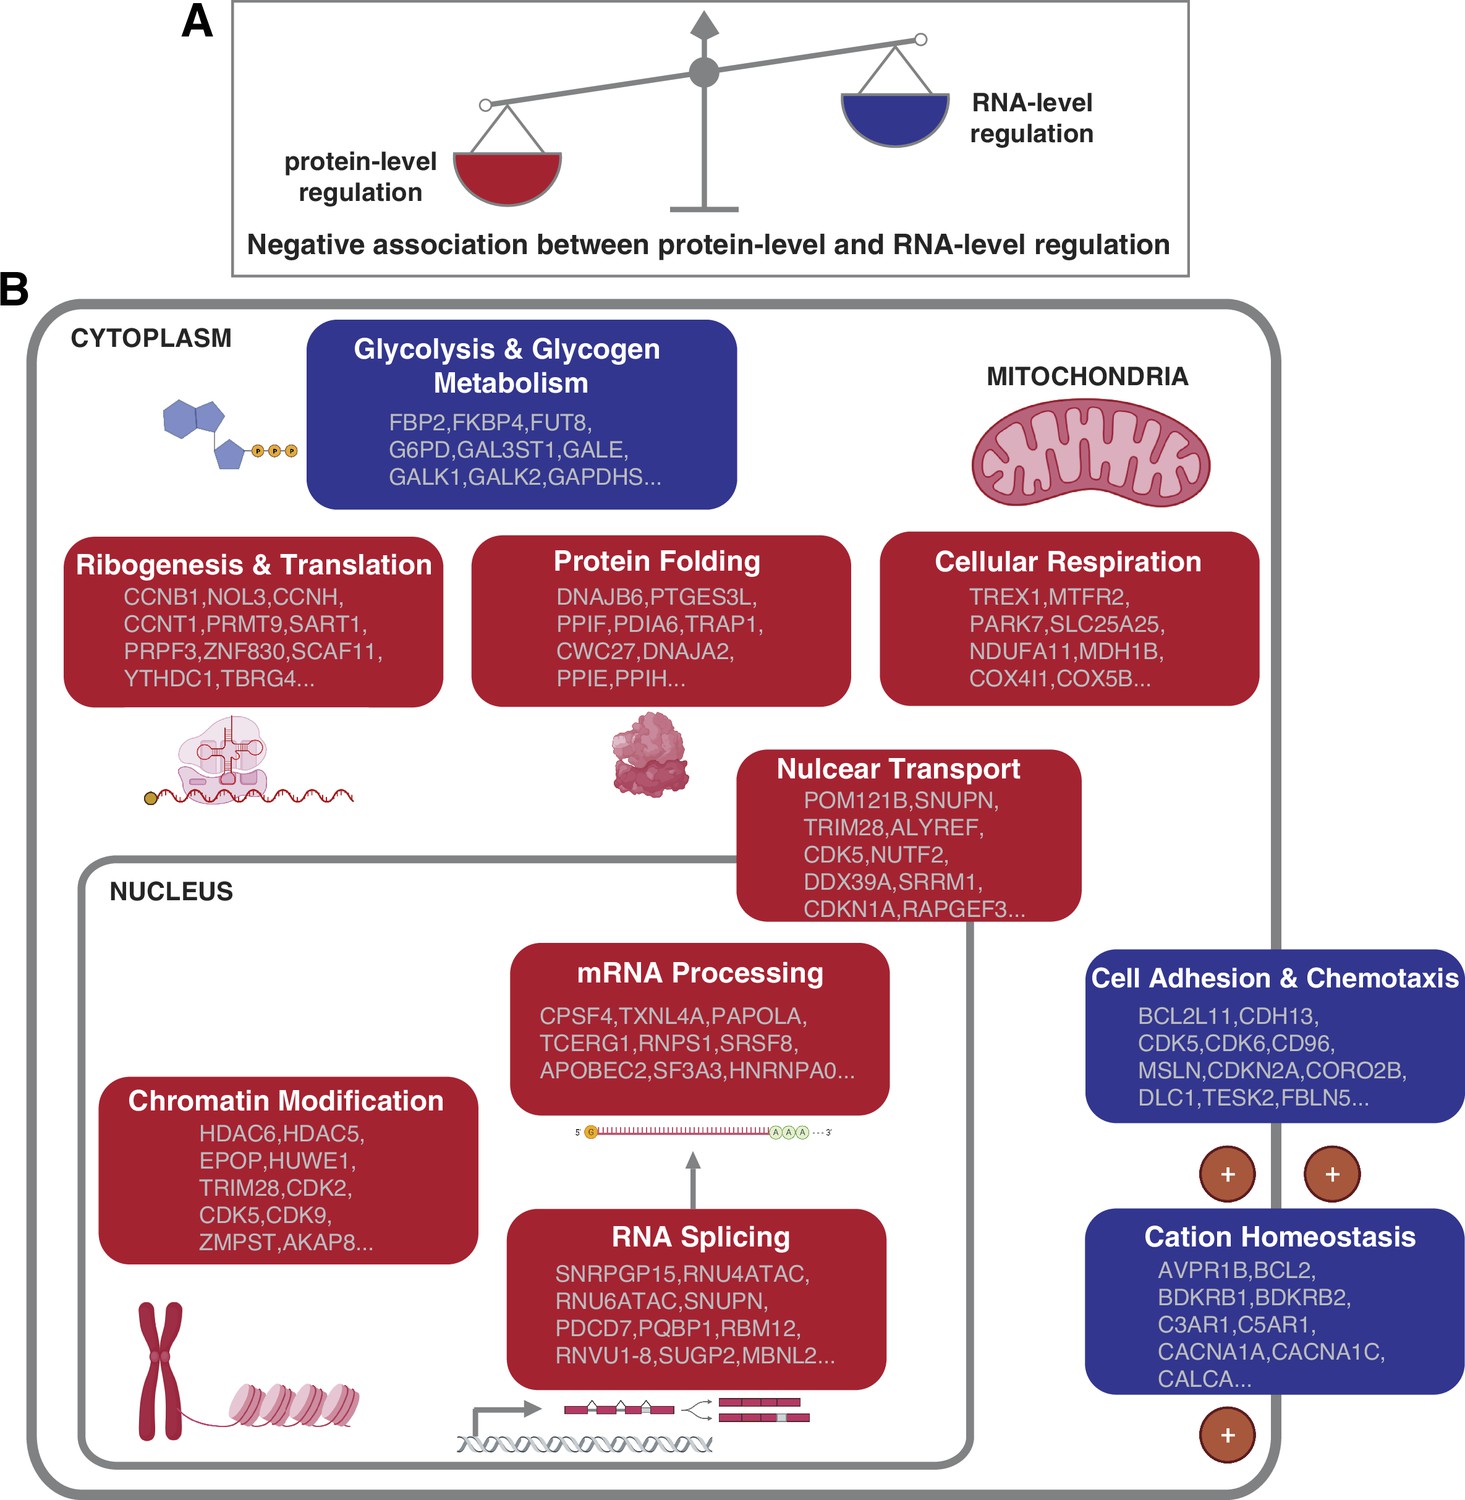
Negative association between RNA- and protein-level regulation across cellular pathways.
(A) Schematics representing the negative correlation between protein-level regulation and RNA-level regulation across pathways (see also Figure 3B). (B) Schematics of representative cellular pathways showing a preferential regulation at the RNA level (blue) or protein level (red). For each pathway, approximately 10 representative genes are shown. See also Figure 3.
Author response image 1
Additional files
-
Supplementary file 1
Gene compensation analysis for Figure 1, Figure 1—figure supplement 1, and Figure 1—figure supplement 2.
- https://cdn.elifesciences.org/articles/75227/elife-75227-supp1-v3.xlsx
-
Supplementary file 2
DNA–RNA correlation and RNA–protein correlation analysis for Figure 2 and Figure 2—figure supplement 1.
- https://cdn.elifesciences.org/articles/75227/elife-75227-supp2-v3.xlsx
-
Supplementary file 3
Complete list of cellular pathways and related analyses for Figure 3, Figure 3—figure supplement 1, and Figure 3—figure supplement 2.
- https://cdn.elifesciences.org/articles/75227/elife-75227-supp3-v3.xlsx
-
Supplementary file 4
Complete list of t-value and Gene Set Enrichment Analysis (GSEA) results for Figure 4.
- https://cdn.elifesciences.org/articles/75227/elife-75227-supp4-v3.xlsx
-
Transparent reporting form
- https://cdn.elifesciences.org/articles/75227/elife-75227-transrepform1-v3.docx
Download links
A two-part list of links to download the article, or parts of the article, in various formats.
Downloads (link to download the article as PDF)
Open citations (links to open the citations from this article in various online reference manager services)
Cite this article (links to download the citations from this article in formats compatible with various reference manager tools)
Proteogenomic analysis of cancer aneuploidy and normal tissues reveals divergent modes of gene regulation across cellular pathways
eLife 11:e75227.
https://doi.org/10.7554/eLife.75227


