Boosting of cross-reactive antibodies to endemic coronaviruses by SARS-CoV-2 infection but not vaccination with stabilized spike
- Department of Microbiology and Immunology, Geisel School of Medicine at Dartmouth, Dartmouth College, United States
- Thayer School of Engineering, Dartmouth College, United States
- Biomedical Data Science, Dartmouth College, United States
- Department of Pediatrics, Geisel School of Medicine at Dartmouth, Dartmouth-Hitchcock Medical Center, United States
- Department of Pathology, Johns Hopkins School of Medicine, United States
- Department of Medicine, Division of Infectious Diseases, Johns Hopkins School of Medicine, United States
- Division of Intramural Research, National Institute of Allergy and Infectious Diseases, National Institutes of Health, United States
- Hadassah University Medical Center, Israel
- Institute for Medical Immunology, Université libre de Bruxelles, Belgium
- Pediatric Department, CHU St Pierre, Belgium
Figures
Figure 1 with 1 supplement
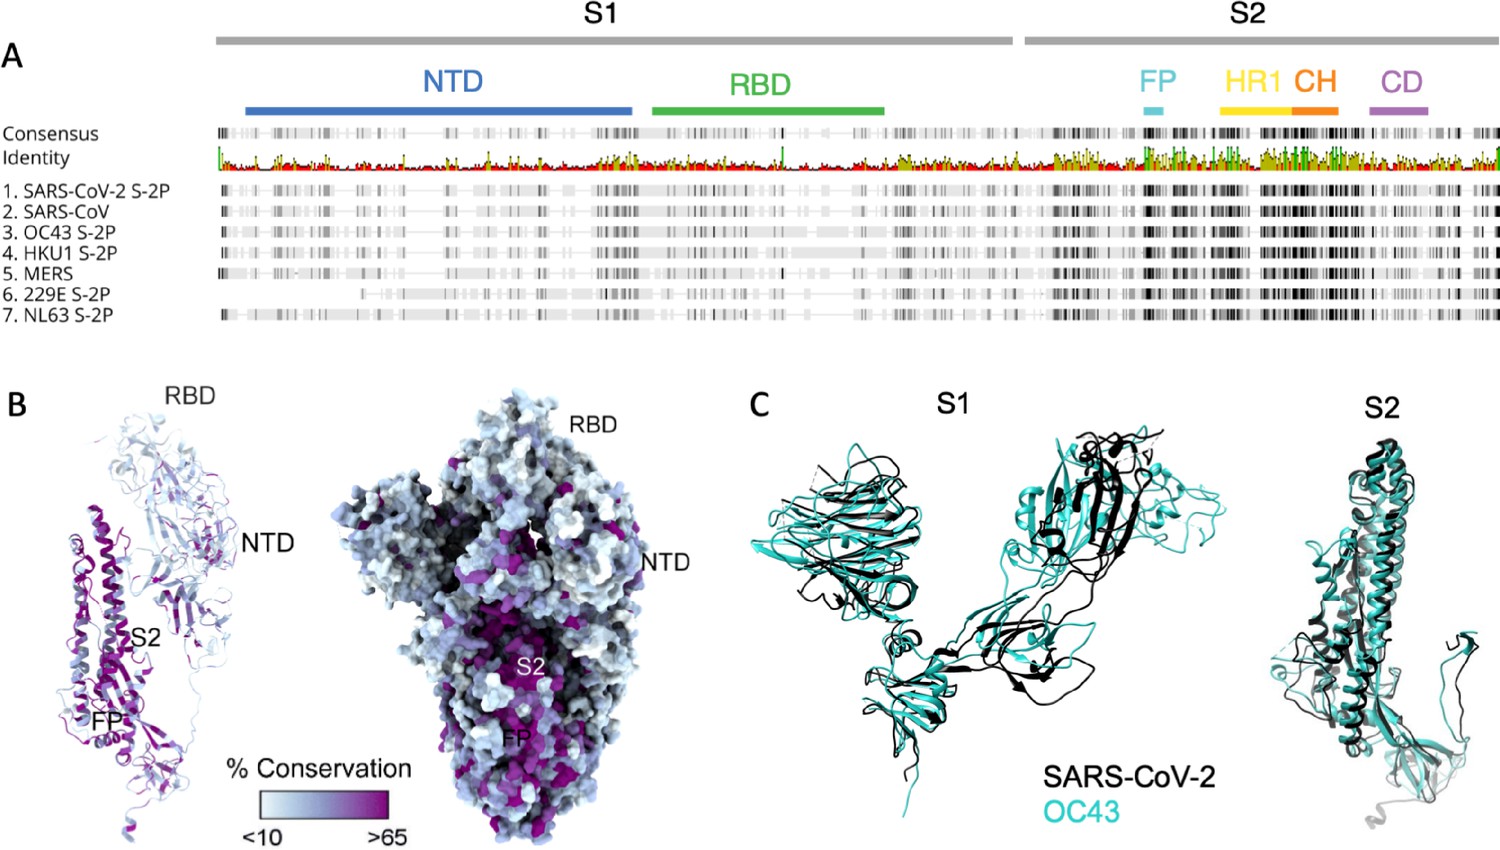
Sequence and structural differences between the spike ectodomain of SARS-CoV-2 and endemic strains.
(A) Sequence alignment of SARS-CoV-2 spike protein to other human coronaviruses. Consensus identity is shown on a scale from red (least conserved) to green (most conserved). Color bars are used to indicate different regions of the spike protein: N-terminal domain (NTD, blue), receptor-binding domain (RBD, green) in the S1 domain and fusion peptide (FP, cyan), heptad repeat 1 (HR1, yellow), central helix (CH, orange), and connector domain (CD, purple) in the S2 domain. (B) Structural model of the spike protein monomer colored by percent sequence conservation across deposited coronaviridae sequences shown as a ribbon model for one protomer (left) and spacefill for the spike trimer (right). (C) Superimposed structural model of the spike protein S1 (left) and S2 (right) domains for SARS-CoV-2 (black) and OC43 (teal).
Figure 1—figure supplement 1
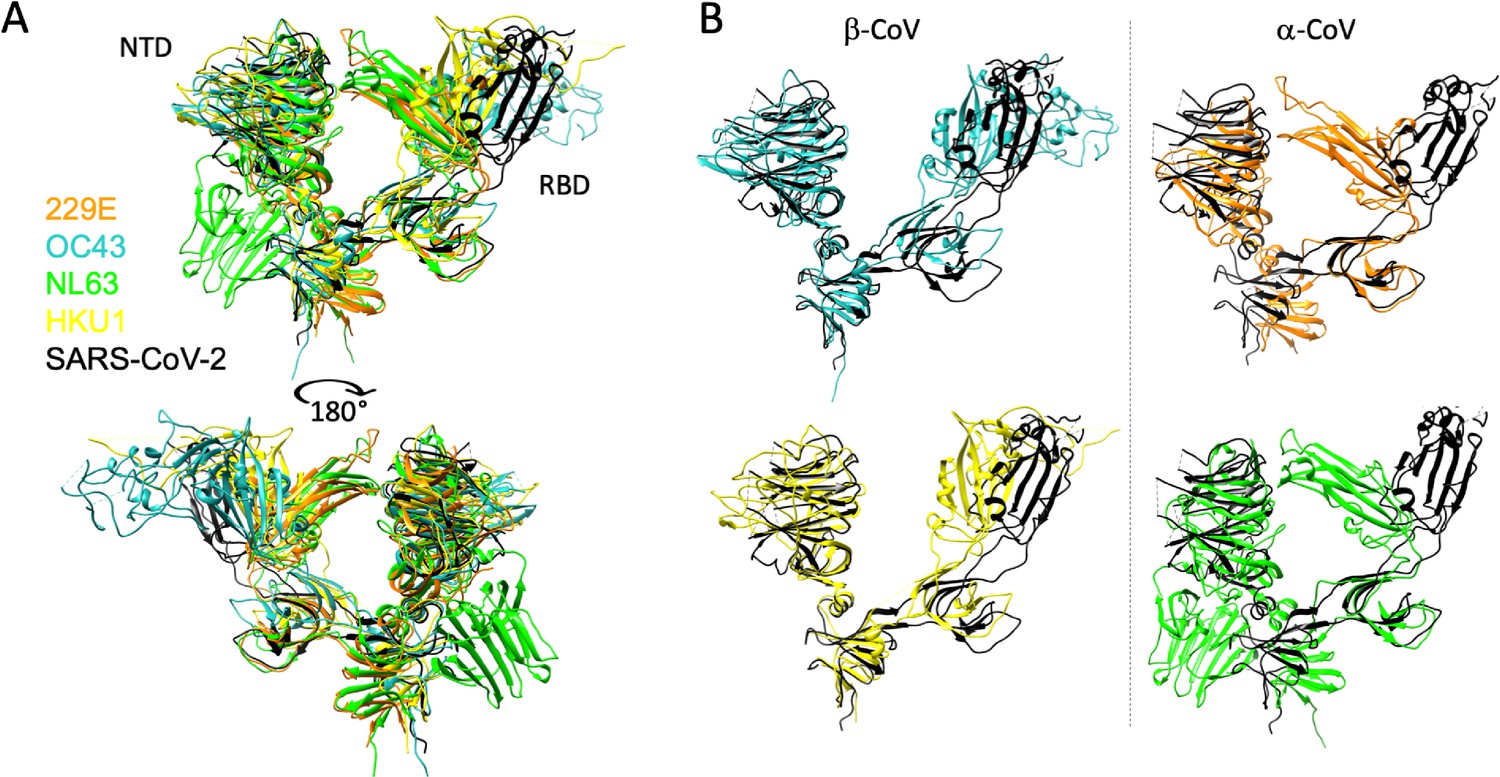
Structural differences between the S1 domain of SARS-CoV-2 and endemic strains.
(A) Structural models of the N-terminal domain (NTD) and receptor-binding domain (RBD) as ribbons, colored by strain: SARS-CoV-2 (black), 229E (orange), OC43 (blue), NL63 (green), and HKU1 (yellow). Structural alignments were restricted to the residues of the S1 domain. Right alignments between SARS-CoV2 and the endemic S1 domains shown individually rather than overlayed, with β-CoV at left, and α-CoV at right.
Figure 2 with 3 supplements
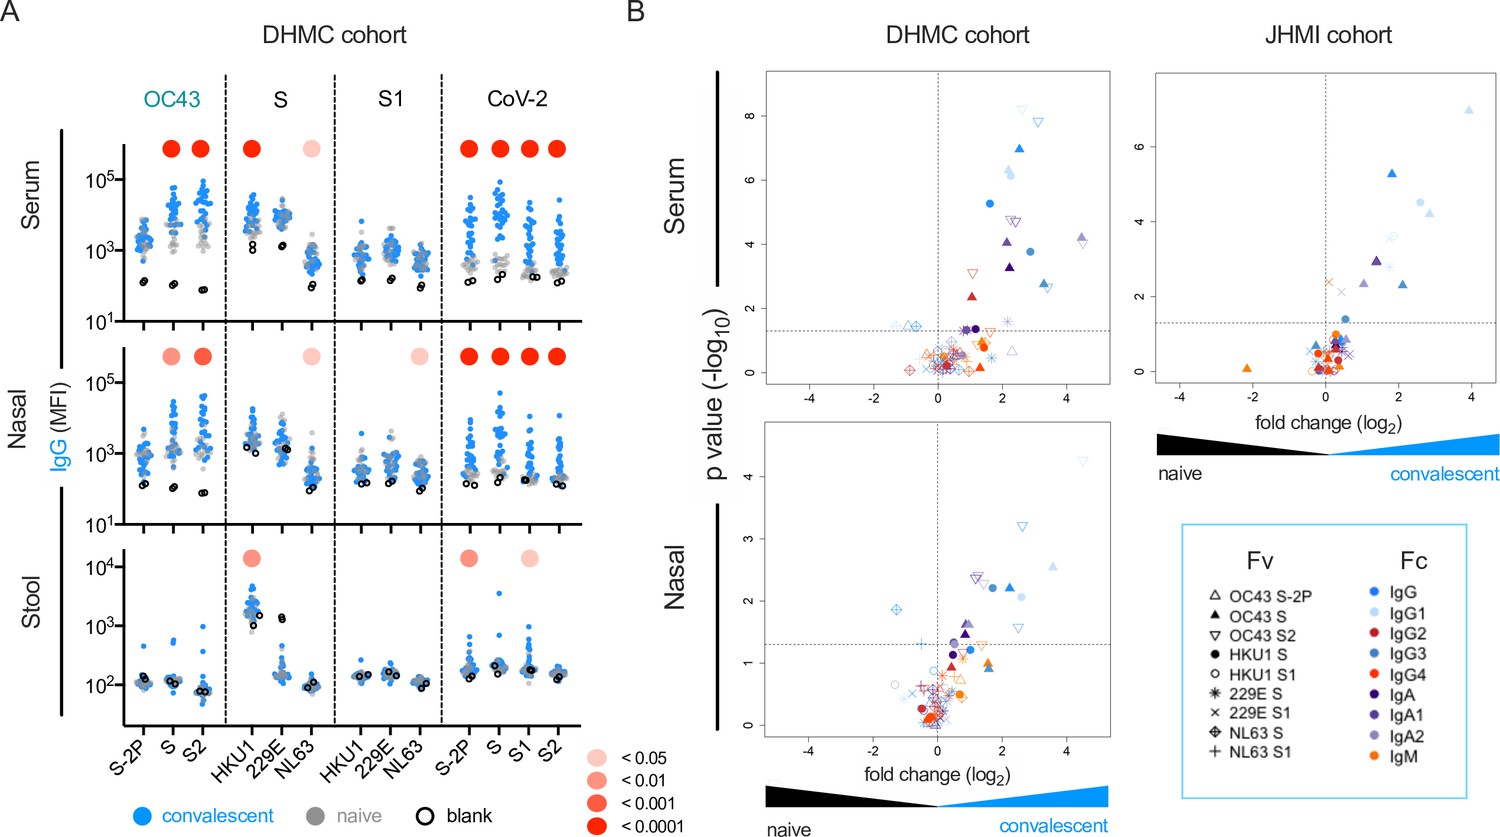
this SARS-CoV-2 infection is associated with elevated IgG and IgA responses to endemic CoV.
(A) IgG responses in serum (top), nasal wash (middle), and stool (bottom) across antigens from CoV-2, OC43, and other endemic CoV S, and S1 proteins in the Dartmouth-Hitchcock Medical Center (DHMC) convalescent cohort. Samples from naïve subjects are indicated in gray, SARS-CoV-2 convalescents at 1 month post infection in blue, and buffer blanks in hollow circles. (B) Volcano plot of fold change and significance (unpaired t-test) of differences between antibody responses observed in convalescent subjects of the DHMC (left) and Johns Hopkins Medical Institutions (JHMI) (right) cohorts 1 month post infection and naïve subjects in serum (top) and nasal wash (bottom). Each symbol represents an antibody response feature, with Fc domain characteristics represented by color and Fv antigen specificity indicated by shape. Dotted horizontal line illustrates p=0.05. Statistical significance was defined by Mann–Whitney U-test.
Figure 2—figure supplement 1
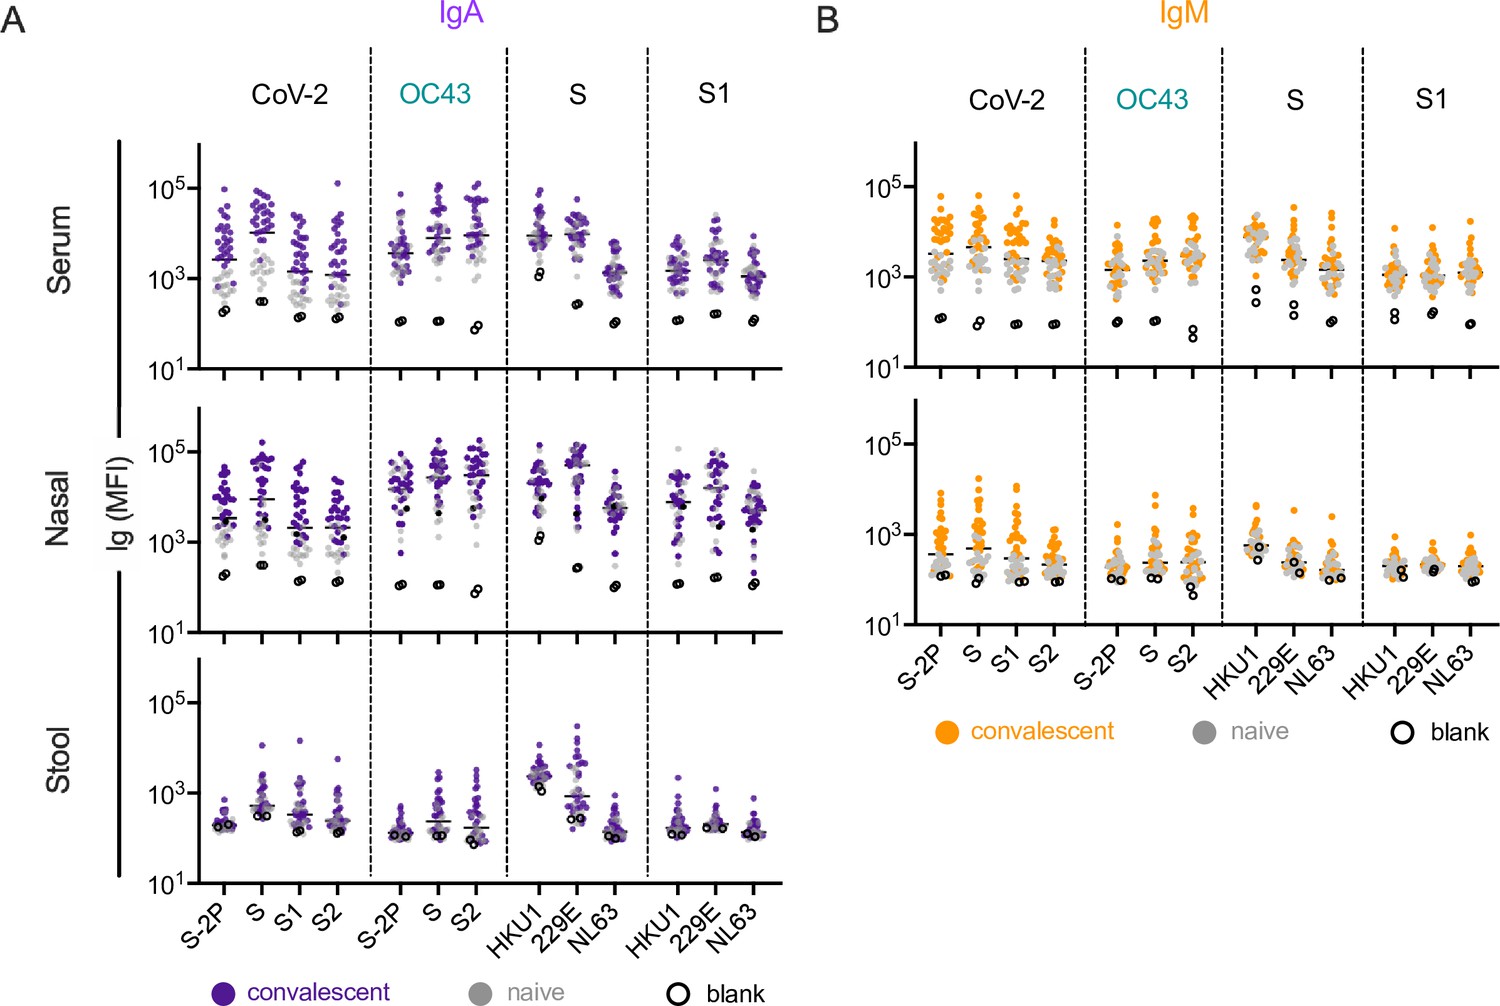
IgA and IgM responses in the Dartmouth-Hitchcock Medical Center (DHMC) cohort.
(A, B) IgA (A) and IgM (B) responses in serum (top), nasal wash (middle), and stool (bottom) across antigens from CoV-2, OC43, and other endemic CoV S, and S1 proteins. Samples from naïve subjects are indicated in gray, SARS-CoV-2 convalescents at 1 month post infection in color, and buffer blanks in hollow circles.
Figure 2—figure supplement 2
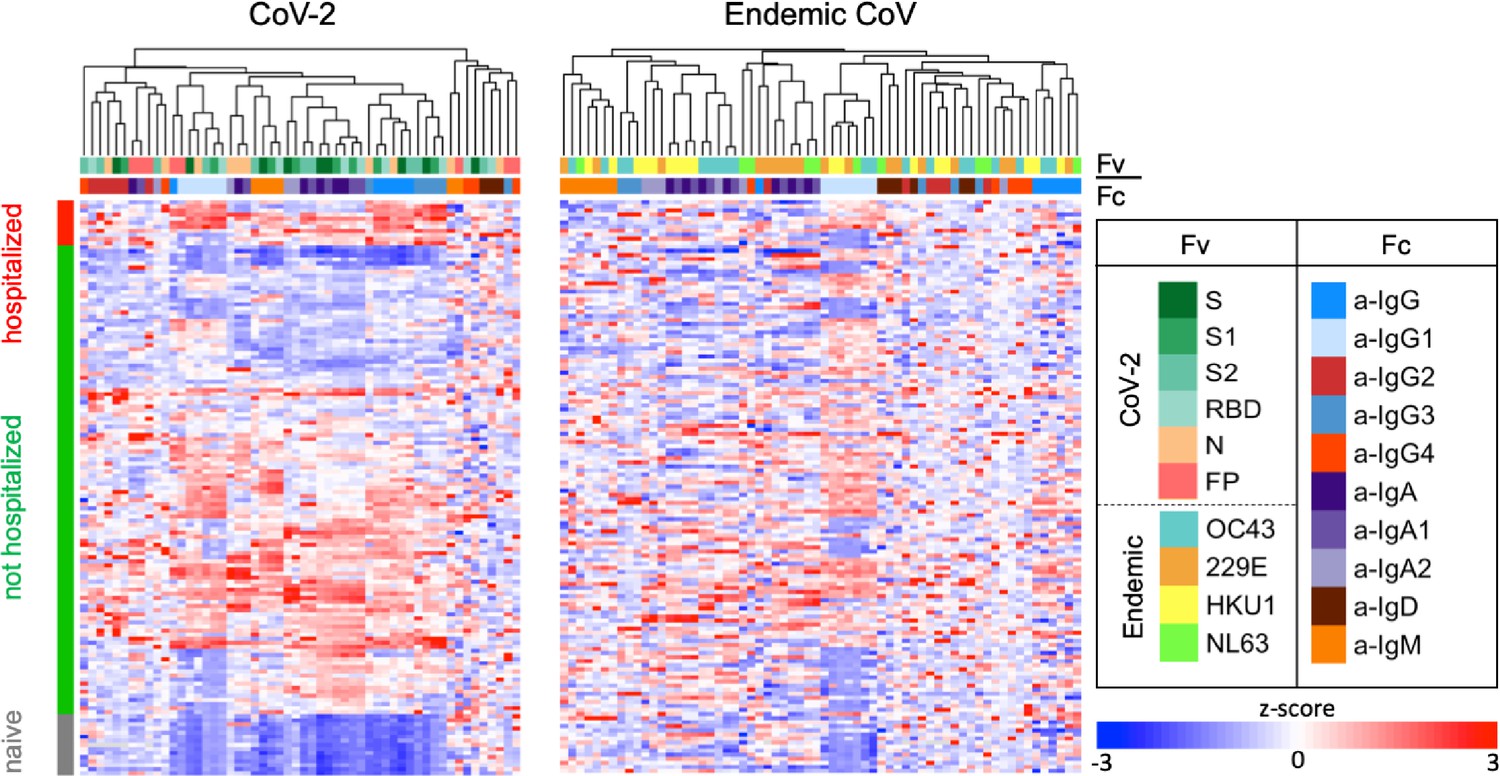
Antibody responses in the Johns Hopkins Medical Institutions (JHMI) cohort.
Heatmap of filtered and hierarchically clustered features and within-subject groups according to infection and hospitalization status. Ab responses to SARS CoV-2 features are shown on the left and those specific to endemic CoV on the right. Responses were scaled and centered within features, and the scale was truncated at ±3 SD. Antigen specificity (Fv) and Fc characteristics (Fc) are indicated in the color bars.
Figure 2—figure supplement 3
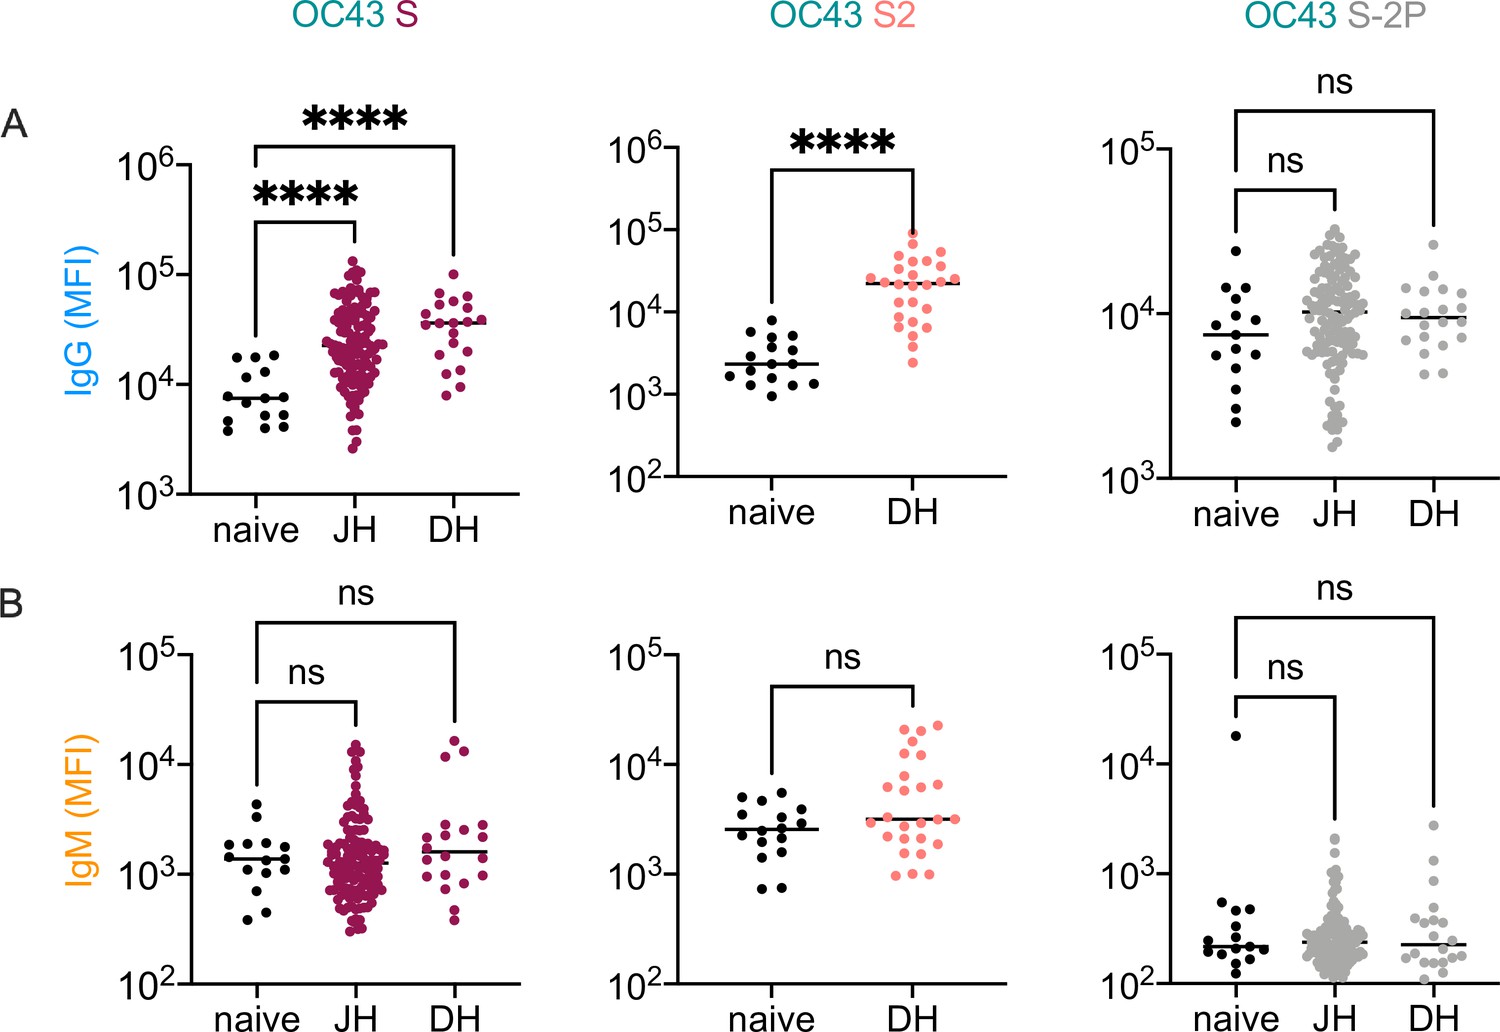
Elevated IgG but not IgM responses to endemic CoV in convalescent cohorts.
(A, B) Comparison between IgG (A) and IgM (B) levels in naïve, Dartmouth-Hitchcock Medical Center (DH), and Johns Hopkins Medical Institutions (JH) cohort samples to OC43 S, OC43 S2, and OC43 S-2P. Significant differences were defined by ANOVA with Dunnett’s correction (****p<0.0001).
Figure 3 with 1 supplement
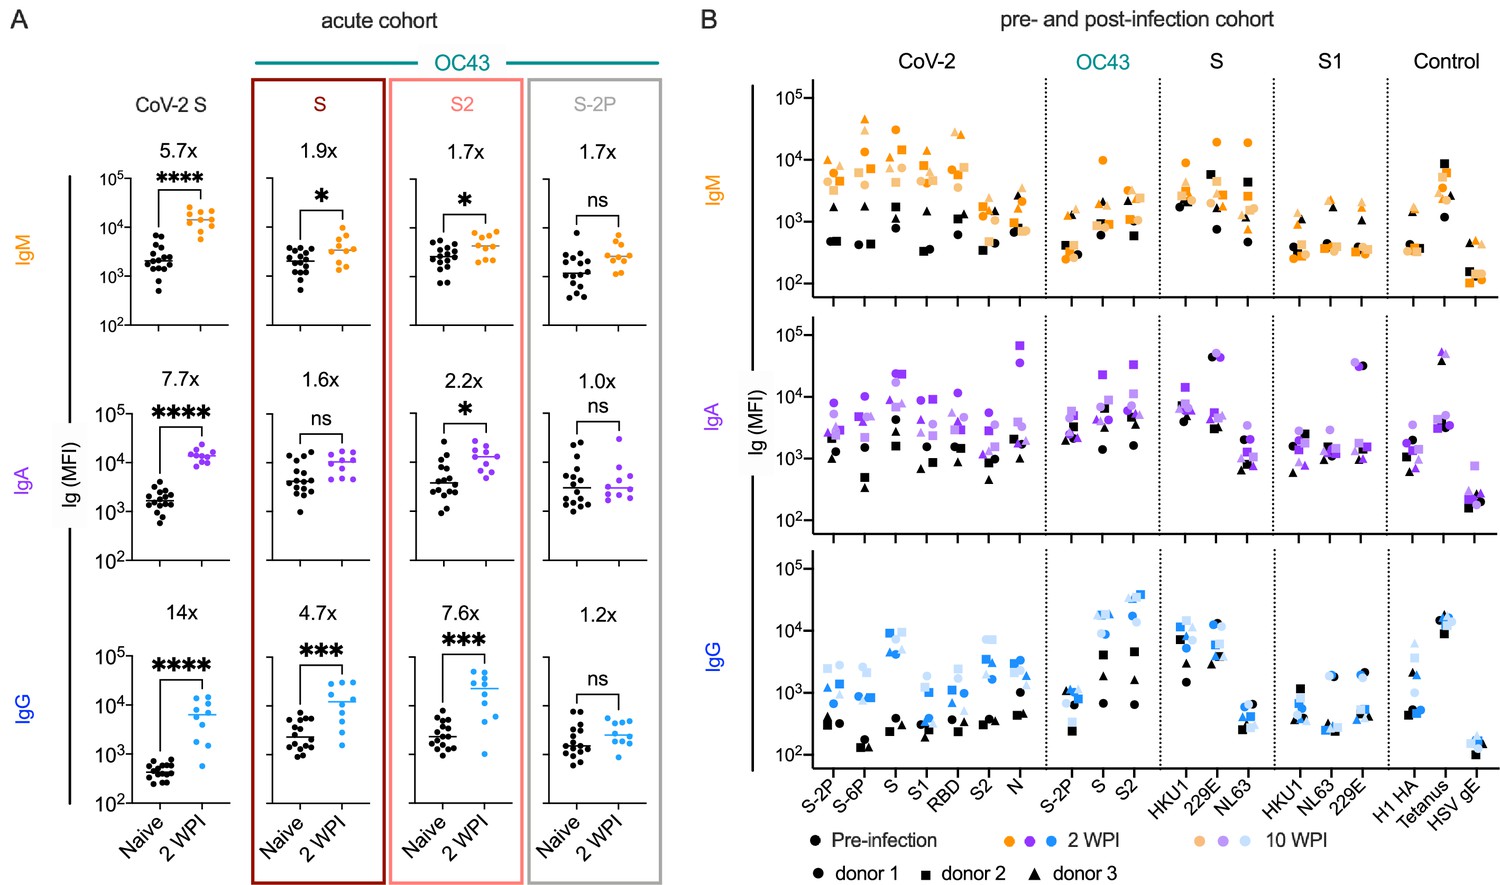
Response kinetics and isotype profiles in acute and pre- and post-infection samples suggest recall of preexisting, cross-reactive antibodies.
(A) OC43 and CoV-2-specific IgM (orange), IgA (purple), and IgG (blue) responses in 10 acutely infected subjects (color) 2 weeks post infection (WPI) as compared to naïve subjects (black). Statistical significance was assessed by unpaired t-test (*p<0.05, ***p<0.0005, ****p<0.00005). Fold change in means between groups is presented in inset. (B) IgM (orange), IgA (purple), and IgG (blue) responses across CoV-2, other CoV, and control antigens in three subjects (indicated by shape) pre- (black) and post- (color) SARS-CoV-2 infection. Serum samples were taken 2 and 10 WPI.
Figure 3—figure supplement 1
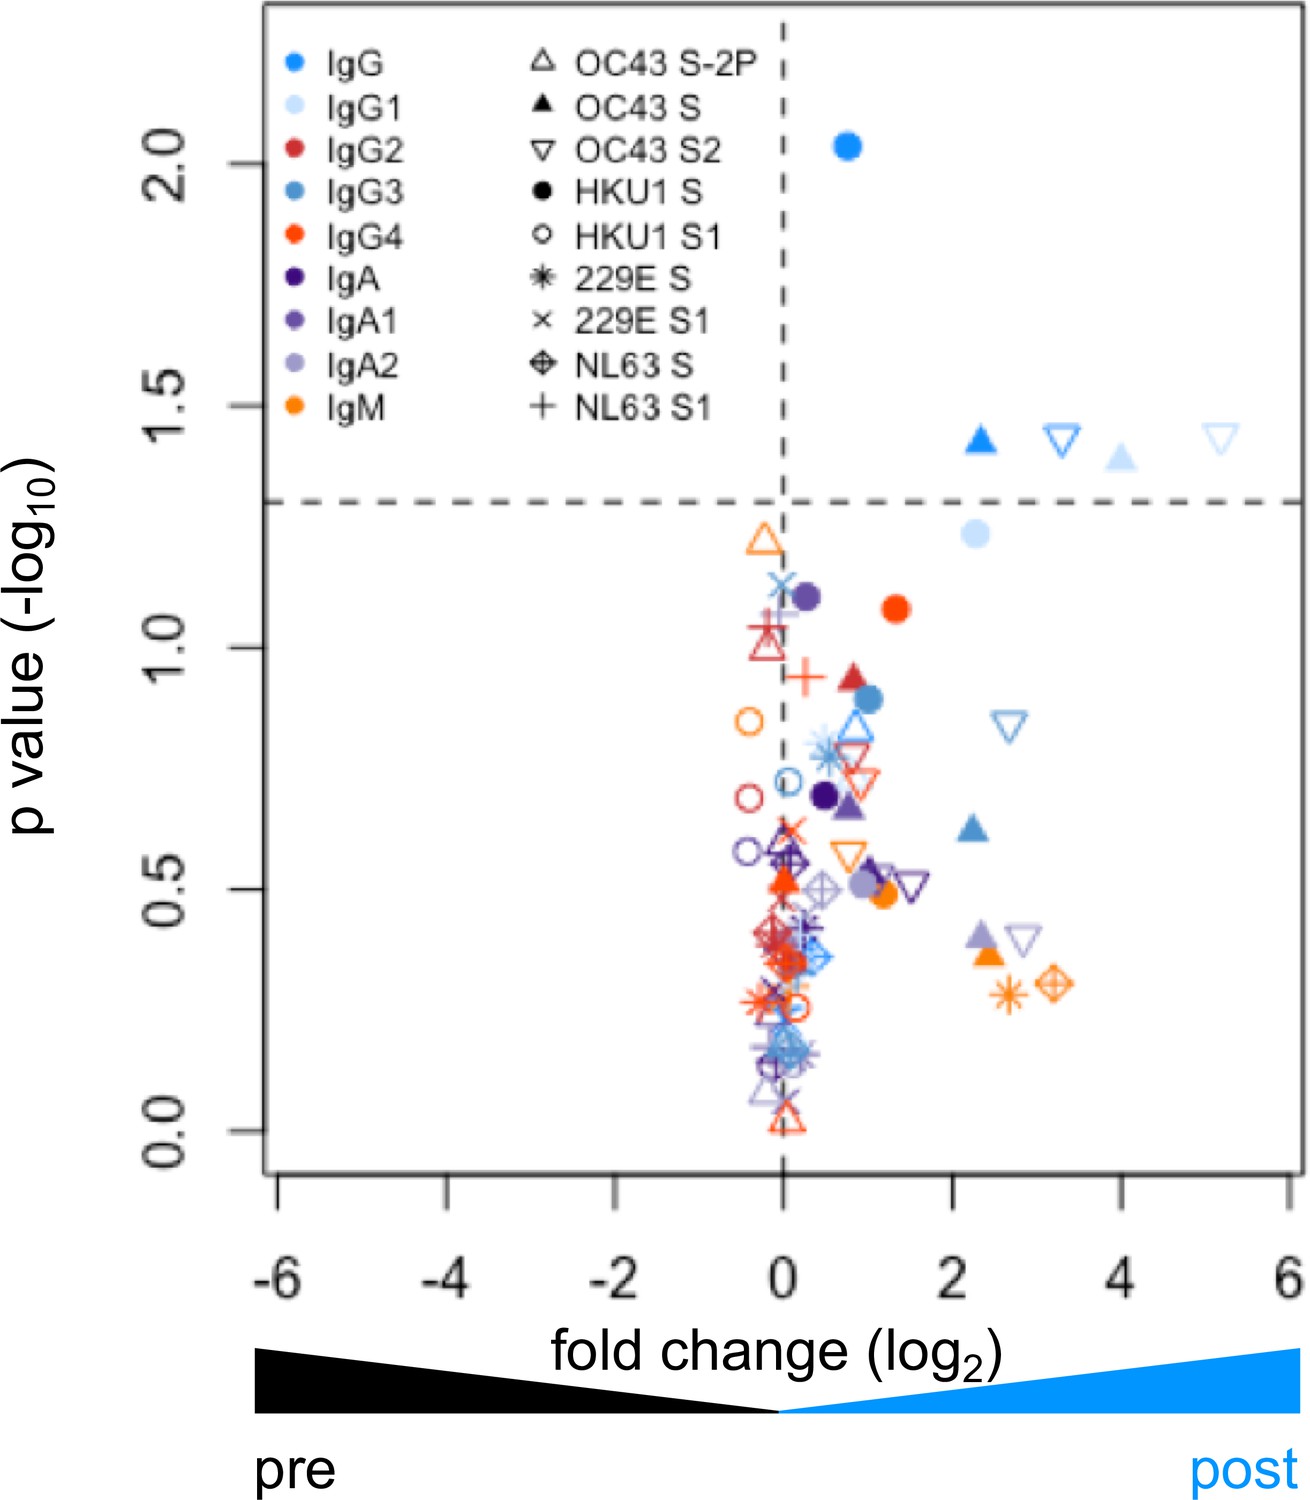
Elevated responses to endemic CoV in the pre- and post-infection cohort.
Volcano plot of fold change and significance (paired t-test) of differences between antibody responses observed in convalescent subjects in the pre- and post-infection cohort. Dotted horizontal line indicates unadjusted p=0.05. Each symbol represents an antibody response feature, with Fc domain characteristics represented by color and Fv antigen specificity indicated by shape.
Figure 4 with 1 supplement
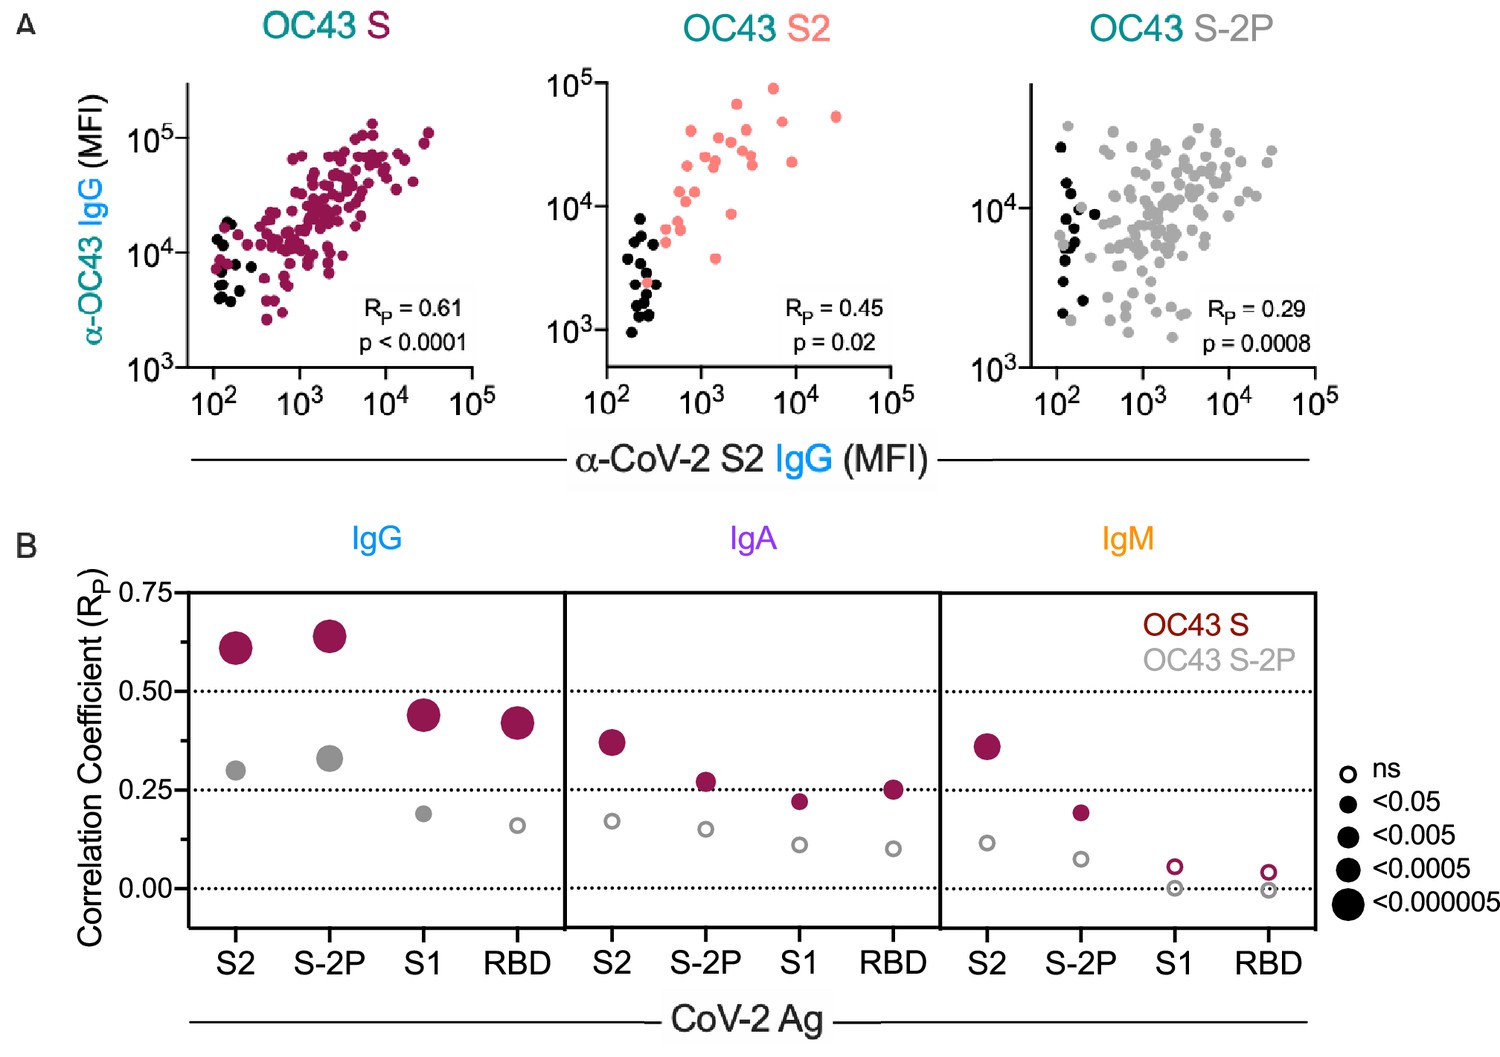
Correlative relationships between CoV-2 and OC43-specific antibody features.
(A) Scatterplots of IgG responses specific to OC43 S, OC43 S2, and OC43 S-2P versus CoV-2 S2. Naïve subjects were excluded from calculations of correlative relationships. (B) Correlations (RP) between IgG, IgA, and IgM specific to different stabilized SARS-CoV-2 spike and its subdomains with responses to OC43 S (maroon) and OC43 S-2P. Size and fill of symbols indicate statistical significance. Responses and relationships for naïve subjects are shown in black and convalescent donors shown in maroon (OC43 S), salmon (OC43 S2), and gray (OC43 S-2P).
Figure 4—figure supplement 1
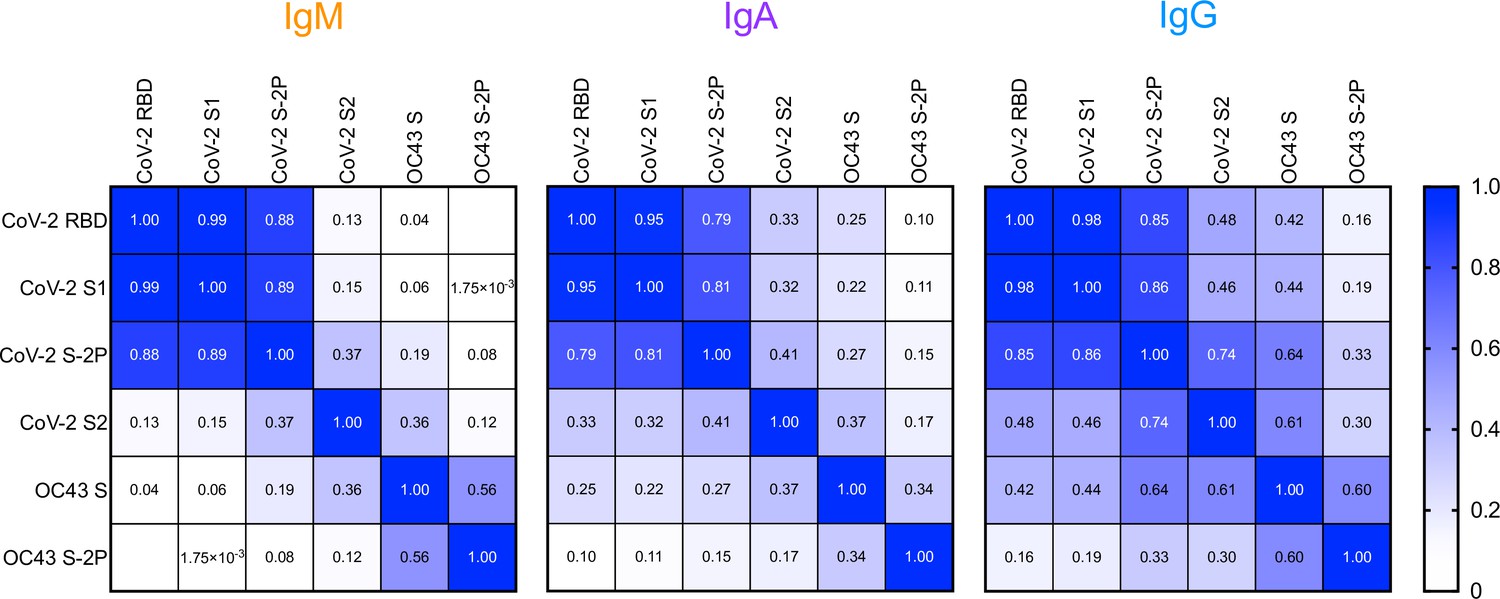
Correlative relationships between SARS-CoV-2- and OC43-specific antibody responses in the Johns Hopkins Medical Institutions (JHMI) cohort by isotype.
Heatmap of Pearson correlation coefficients observed among SARS-CoV-2- and OC43-specific IgM (left), IgA (center), and IgG (right) isotypes.
Figure 5 with 12 supplements
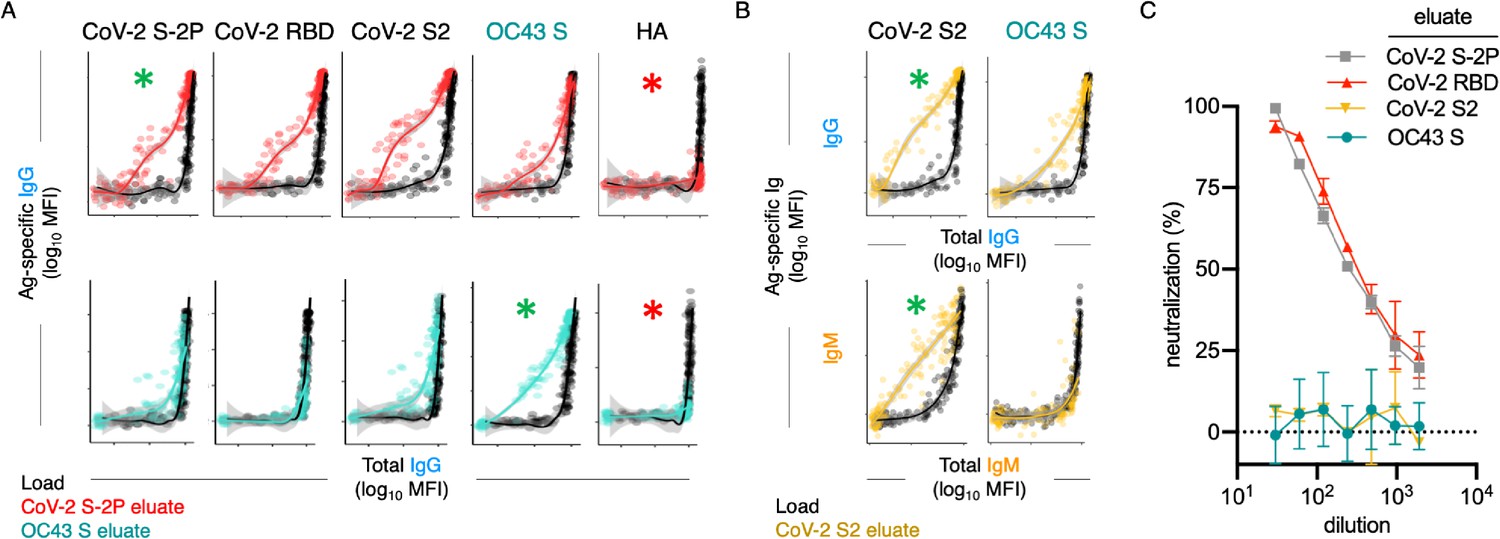
Poor neutralization activity of cross-reactive and S2-specific antibodies established by affinity purification.
(A) Antigen-binding profiles of IgG in unfractionated serum (load, black) and affinity-purified CoV-2 S-2P- (red, top) and OC43 S- (teal, bottom) fractions (eluate) from 30 SARS-CoV-2 convalescent subjects. Reactivity to CoV-2 S-2P, CoV-2 RBD, CoV-2 S2, OC43 S, and a control antigen (influenza hemagglutinin [HA]) are reported. (B) Antigen-binding profiles of IgG (top) and IgM (bottom) in unfractionated serum (load, black) and affinity-purified CoV-2 S2-specific (yellow) eluate. Reactivity to CoV-2 S2 (left) and OC43 S (right) is shown. For (A, B), responses to the matched antigen (positive control) used in purification are indicated by green asterisks and to HA (negative control) antigen with red asterisks. Smoothed curves and 95% confidence intervals are shown for both eluate and load fractions. (C) Neutralization activity of pooled elution fractions of antibodies affinity-purified against CoV-2 S-2P (gray square), CoV-2 RBD (red triangle), CoV-2 S2 (yellow triangle), and OC43 S (teal circle). Error bars depict standard error of the mean across assay duplicates.
Figure 5—figure supplement 1
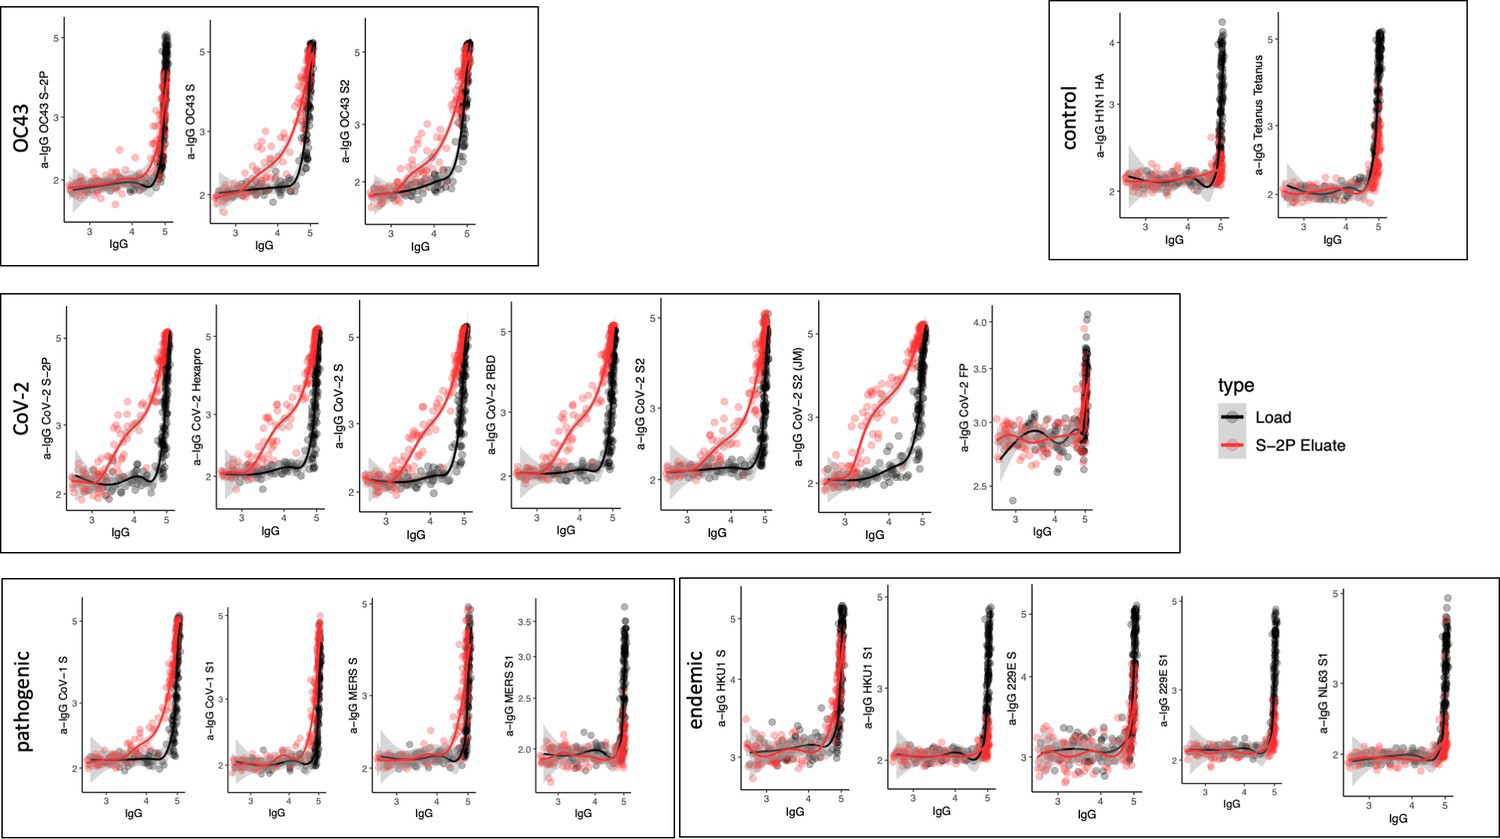
Cross-reactivity of SARS-CoV-2 S-2P-specific IgG.
Antigen-binding profiles of IgG in unfractionated serum (load, black) and affinity-purified CoV-2 S-2P- (eluate, red) fractions from 30 SARS-CoV-2 convalescent subjects across OC43, control, CoV-2, pathogenic CoV, and other endemic CoV. y-axis depicts binding signal for indicated antigen specificity, x-axis depicts signal from total IgG quantitation.
Figure 5—figure supplement 2
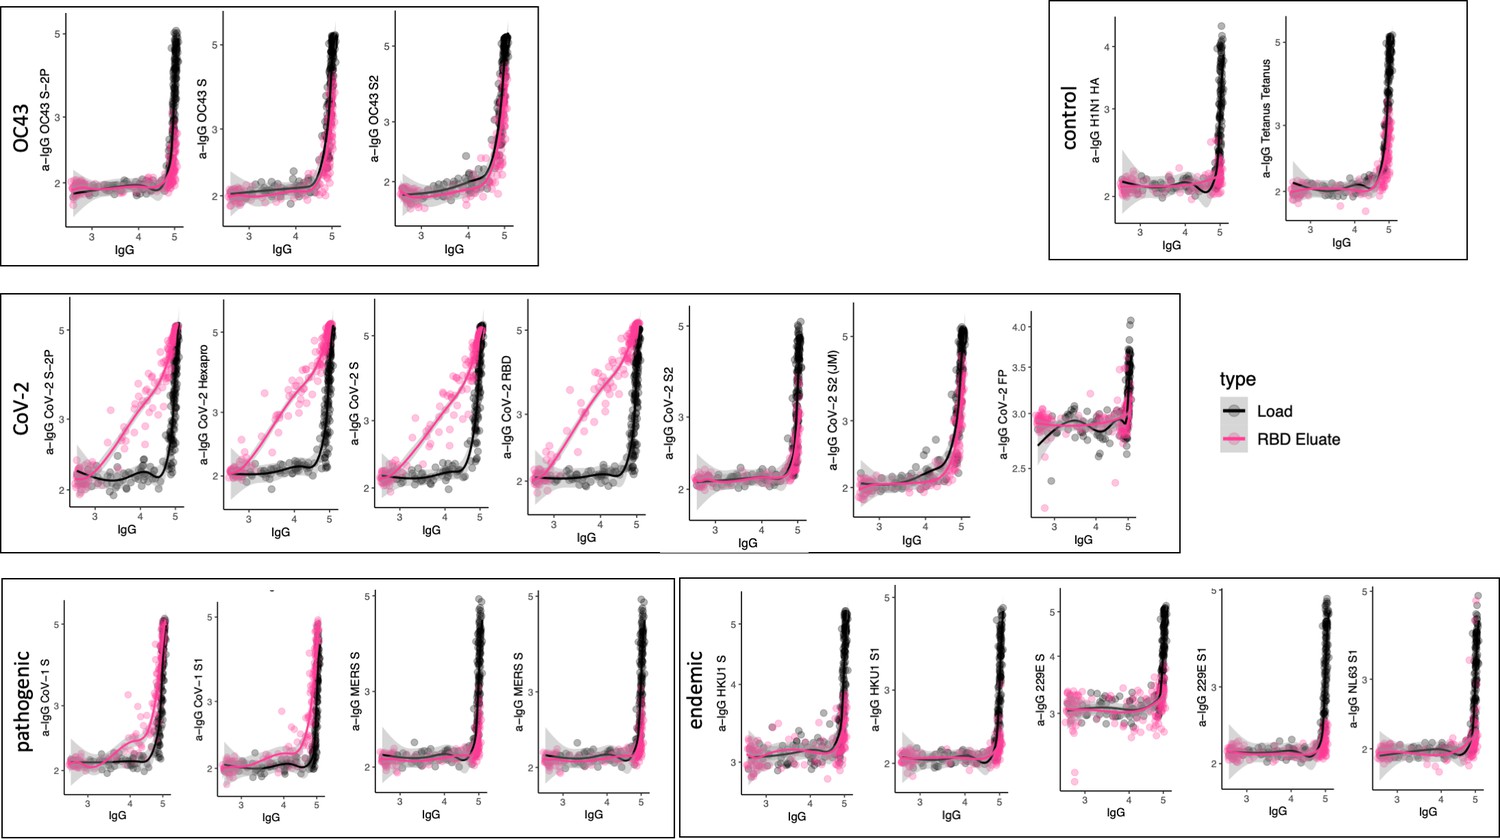
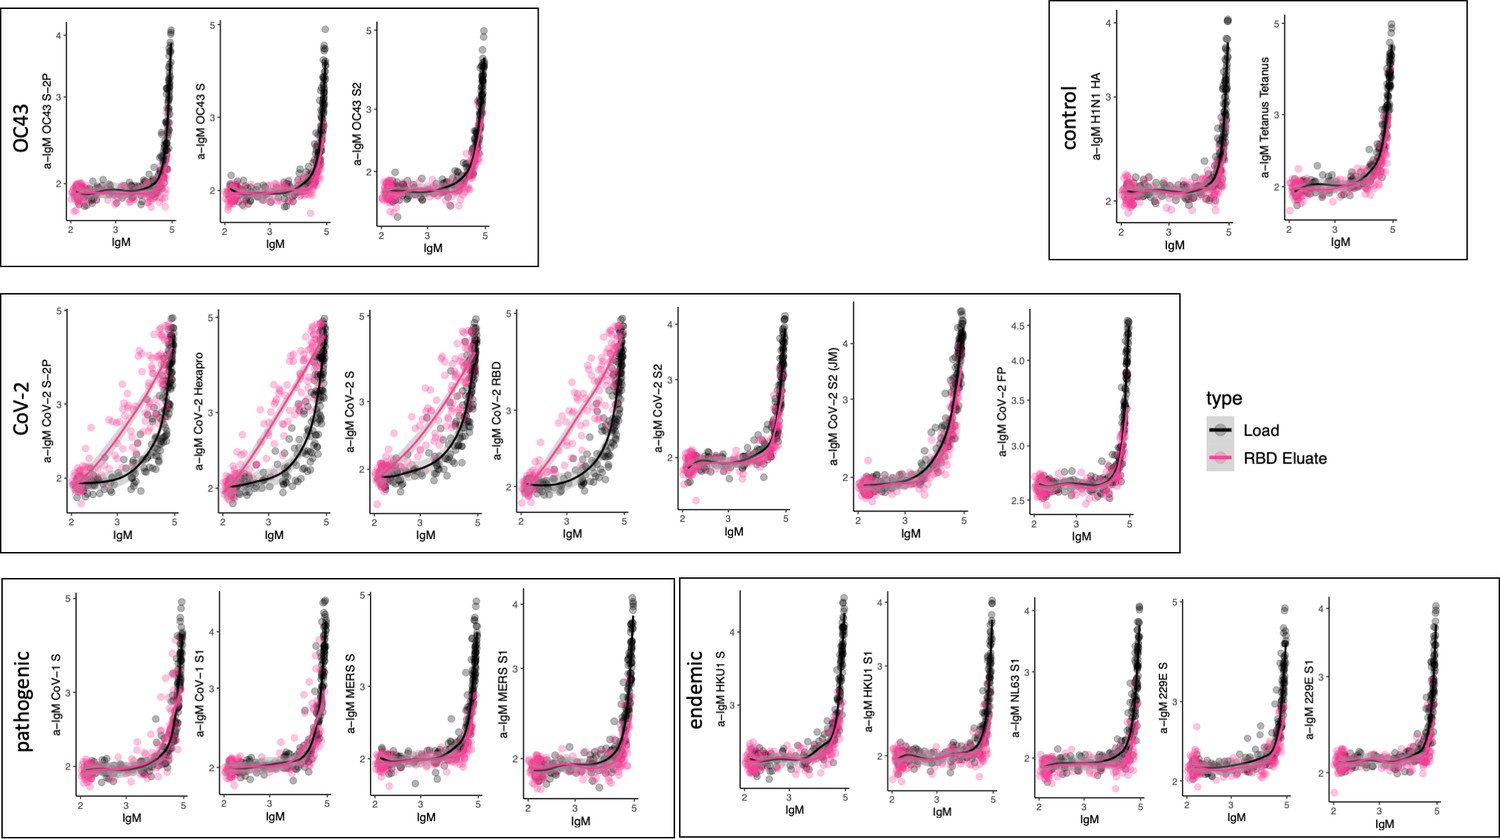
Cross-reactivity of SARS-CoV-2 receptor-binding domain (RBD)-specific IgG.
Antigen-binding profiles of IgG in unfractionated serum (load, black) and affinity-purified CoV-2 RBD- (eluate, pink) fractions from 30 SARS-CoV-2 convalescent subjects across OC43, control, CoV-2, pathogenic CoV, and other endemic CoV. y-axis depicts binding signal for indicated antigen specificity, x-axis depicts signal from total IgG quantitation.
Figure 5—figure supplement 3
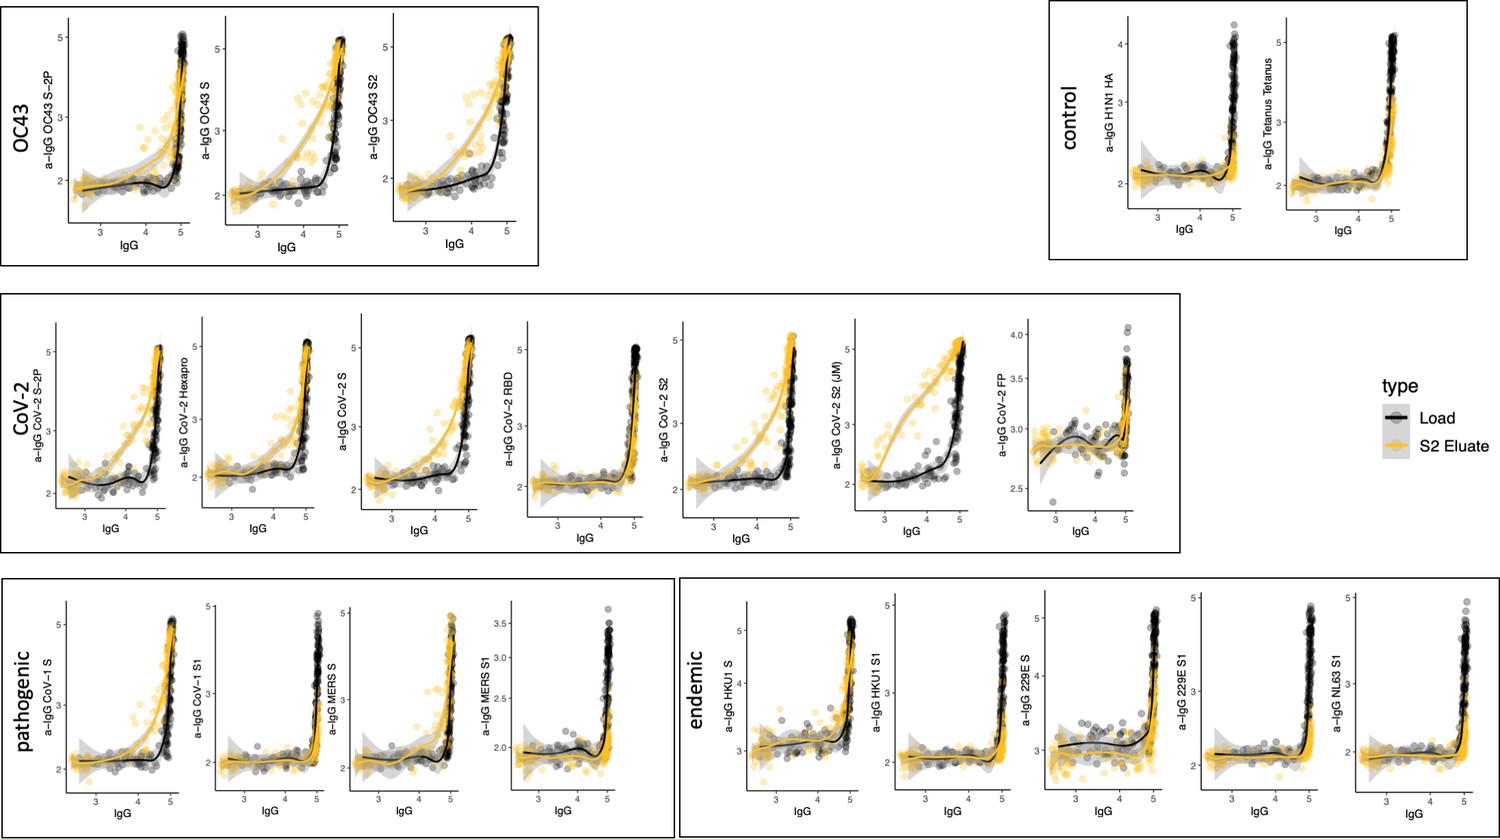
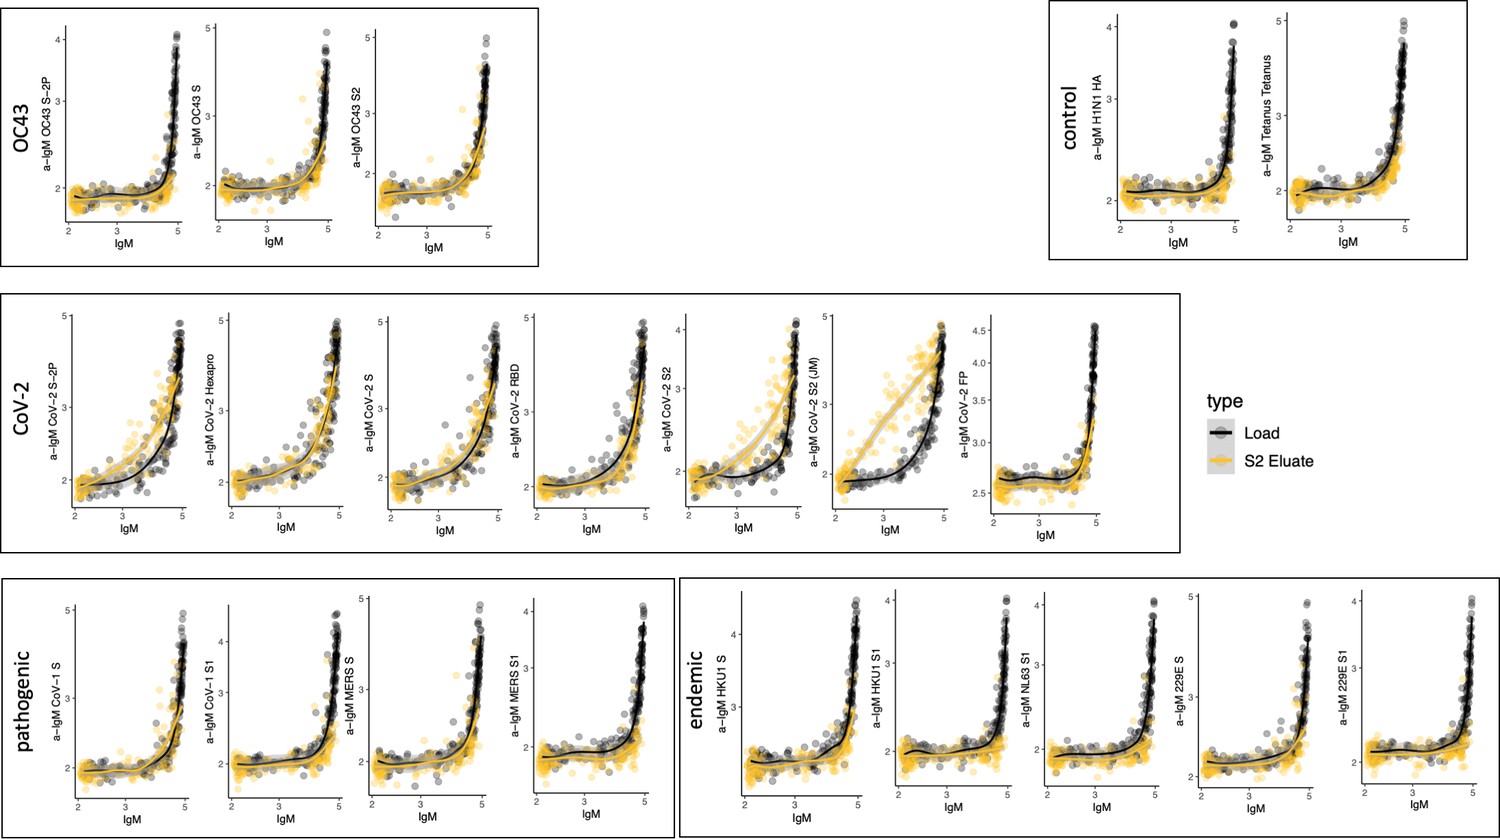
Cross-reactivity of SARS-CoV-2 S2-specific IgG.
Antigen-binding profiles of IgG in unfractionated serum (load, black) and affinity-purified CoV-2 S2- (eluate, yellow) fractions from 30 SARS-CoV-2 convalescent subjects across OC43, control, CoV-2, pathogenic CoV, and other endemic CoV. y-axis depicts binding signal for indicated antigen specificity, x-axis depicts signal from total IgG quantitation.
Figure 5—figure supplement 4
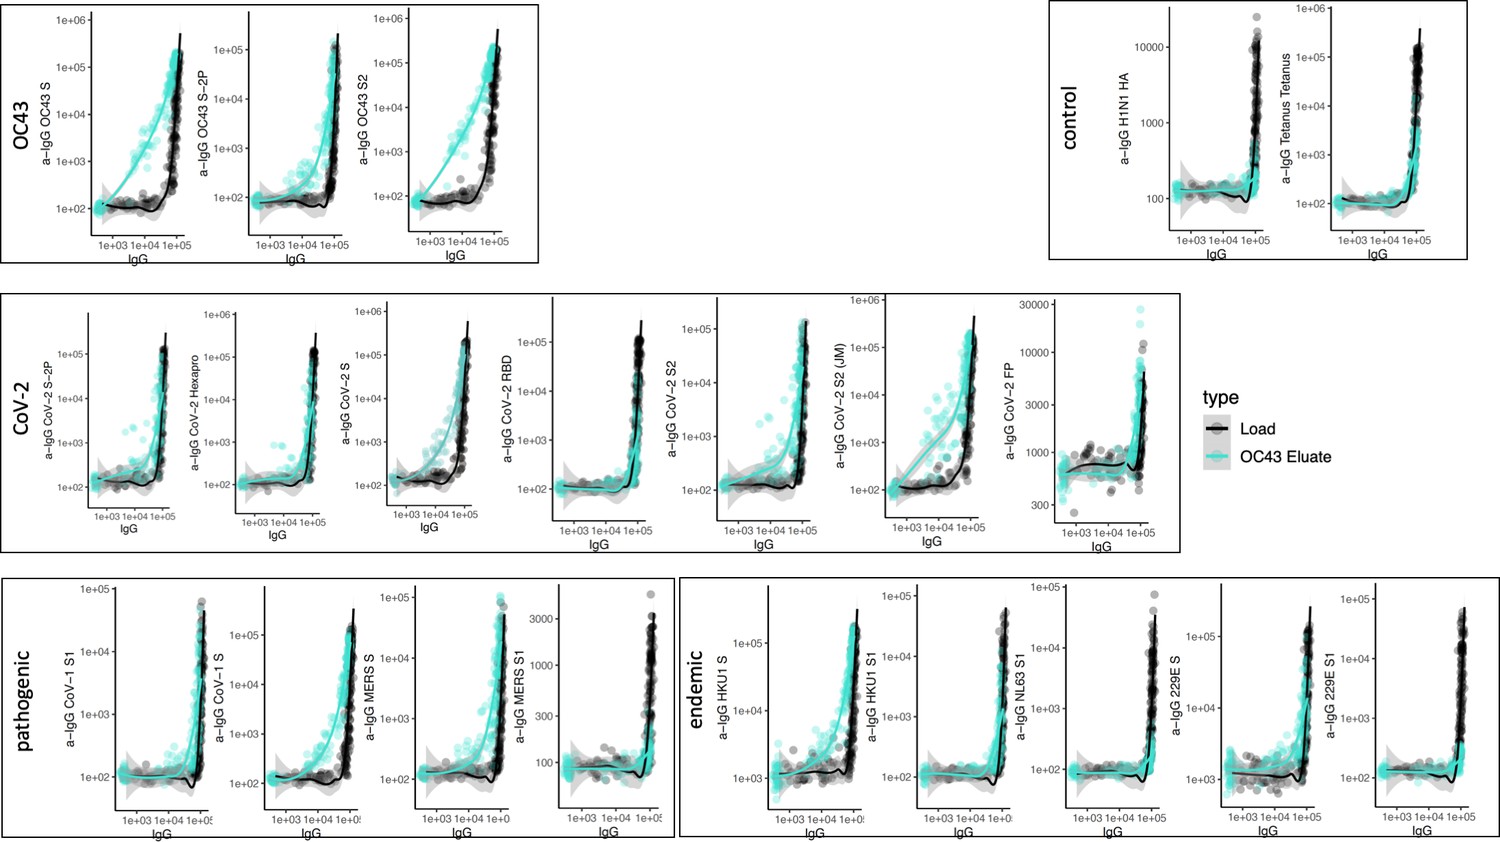
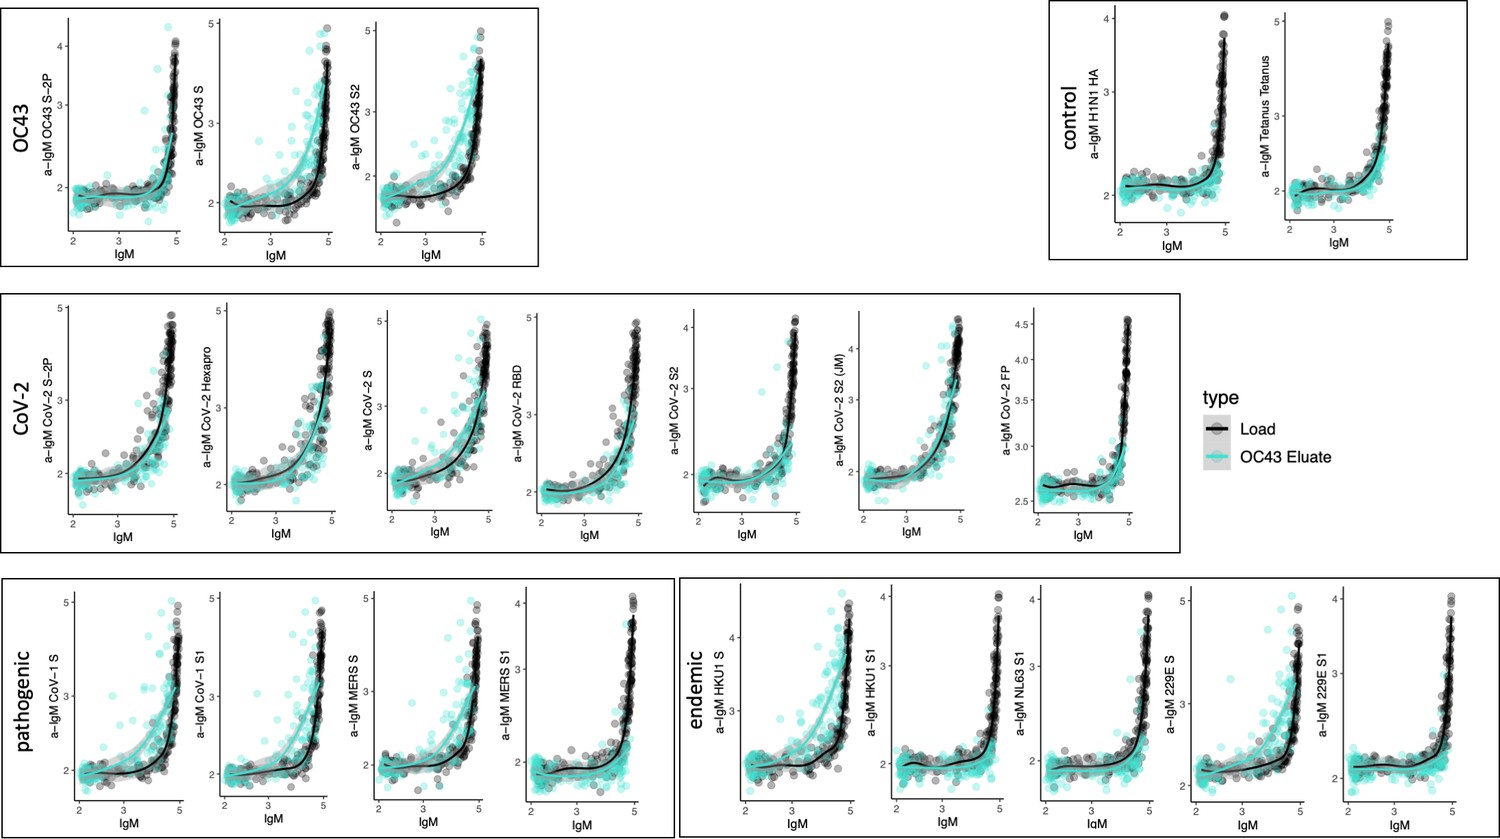
Cross-reactivity of OC43 S-specific IgG.
Antigen-binding profiles of IgG in unfractionated serum (load, black) and affinity-purified OC43 S- (eluate teal) fractions from 30 SARS-CoV-2 convalescent subjects across OC43, control, CoV-2, pathogenic CoV, and other endemic CoV. y-axis depicts binding signal for indicated antigen specificity, x-axis depicts signal from total IgG quantitation.
Figure 5—figure supplement 5
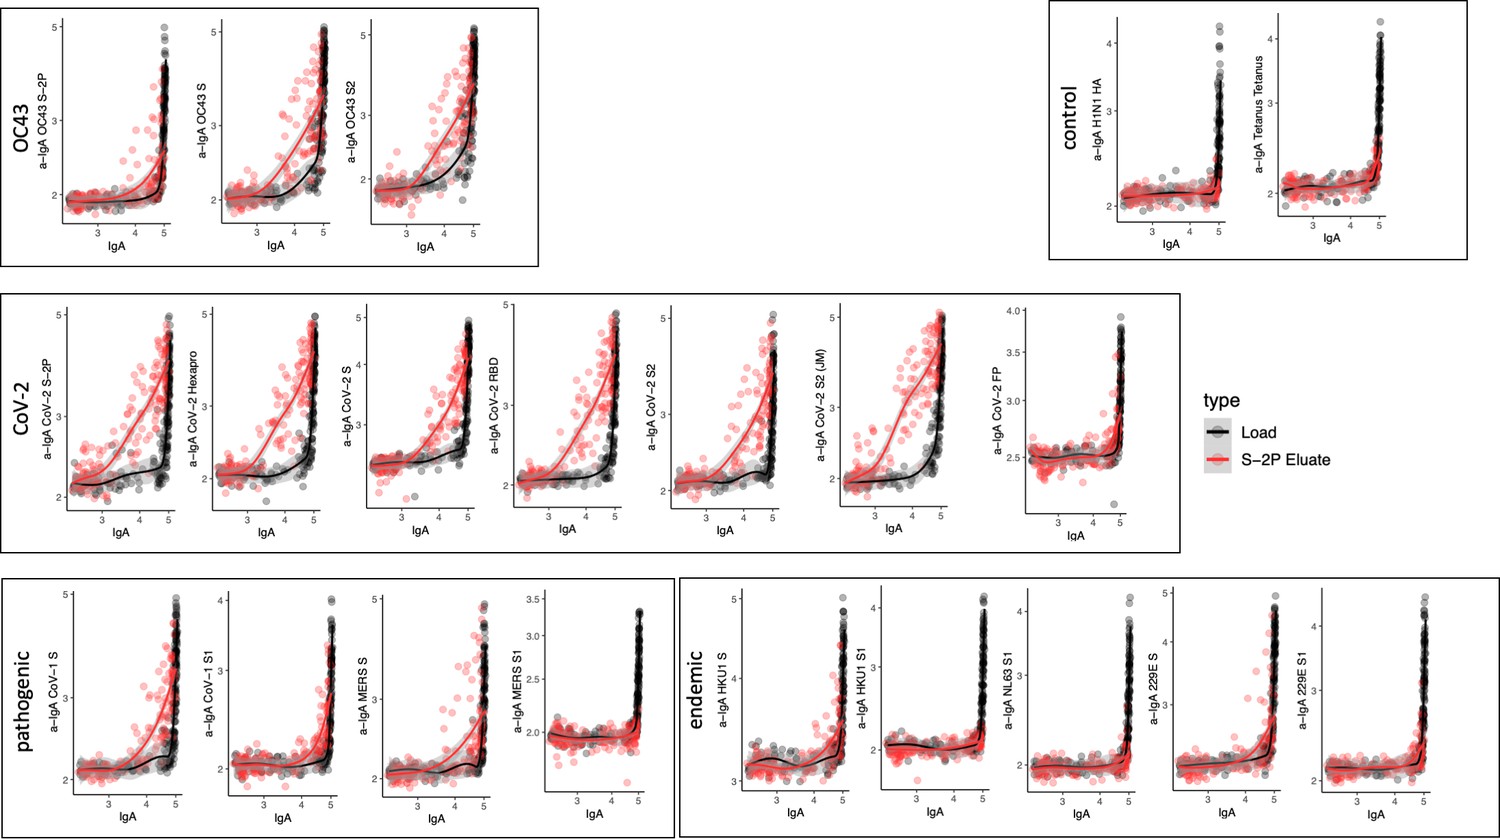
Cross-reactivity of SARS-CoV-2 S-2P-specific IgA.
Antigen-binding profiles of IgA in unfractionated serum (load, black) and affinity-purified CoV-2 S-2P- (eluate, red) fractions from 30 SARS-CoV-2 convalescent subjects across OC43, control, CoV-2, pathogenic CoV, and other endemic CoV. y-axis depicts binding signal for indicated antigen specificity, x-axis depicts signal from total IgA quantitation.
Figure 5—figure supplement 6
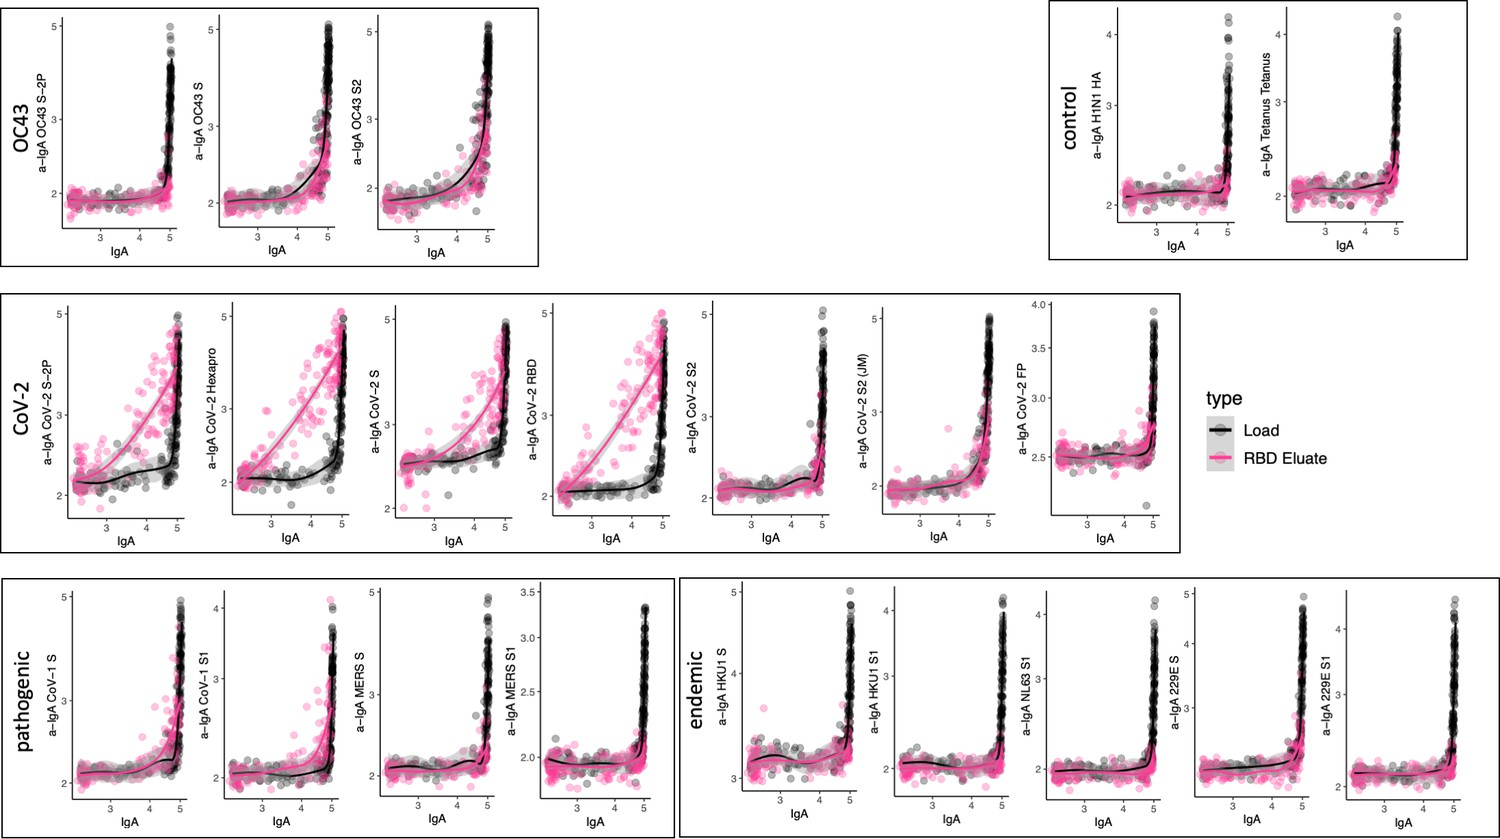
Cross-reactivity of SARS-CoV-2 receptor-binding domain (RBD)-specific IgA.
Antigen-binding profiles of IgA in unfractionated serum (load, black) and affinity-purified CoV-2 RBD- (eluate, pink) fractions from 30 SARS-CoV-2 convalescent subjects across OC43, control, CoV-2, pathogenic CoV, and other endemic CoV. y-axis depicts binding signal for indicated antigen specificity, x-axis depicts signal from total IgA quantitation.
Figure 5—figure supplement 7
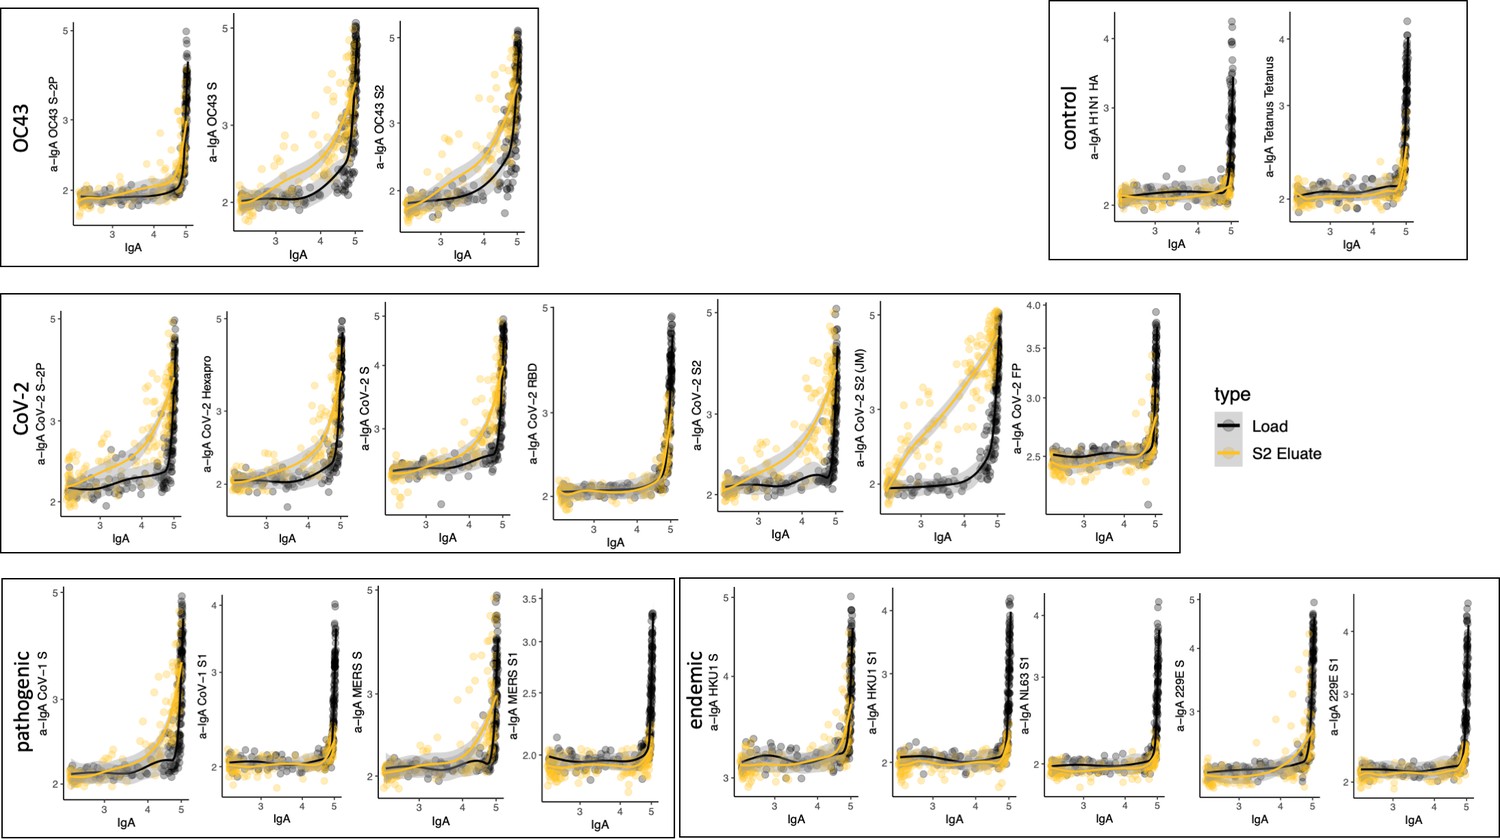
Cross-reactivity of SARS-CoV-2 S2-specific IgA.
Antigen-binding profiles of IgA in unfractionated serum (load, black) and affinity-purified CoV-2 S2- (eluate, yellow) fractions from 30 SARS-CoV-2 convalescent subjects across OC43, control, CoV-2, pathogenic CoV, and other endemic CoV. y-axis depicts binding signal for indicated antigen specificity, x-axis depicts signal from total IgA quantitation.
Figure 5—figure supplement 8
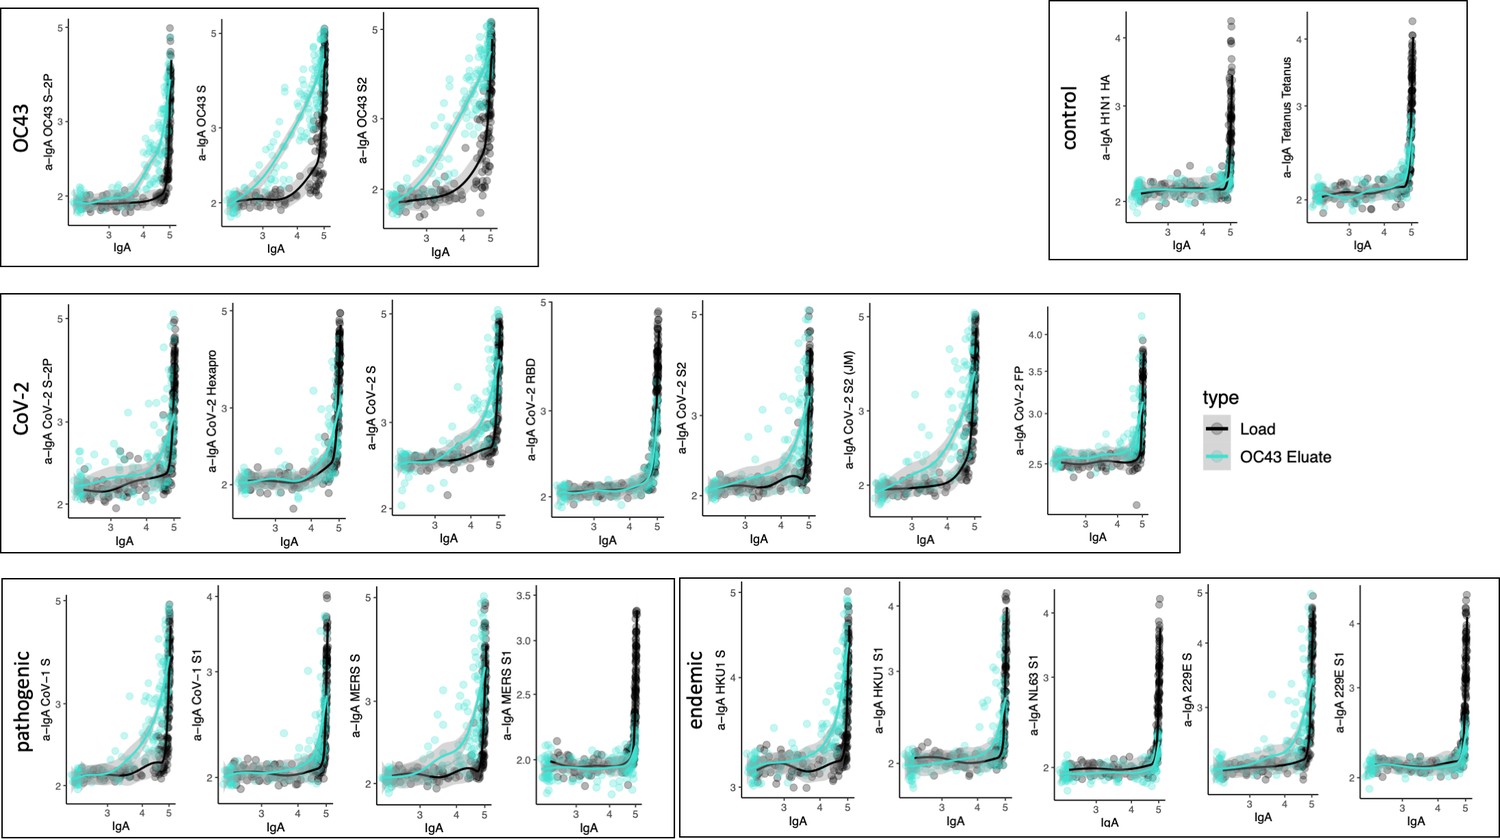
Cross-reactivity of OC43 S-specific IgA.
Antigen-binding profiles of IgA in unfractionated serum (load, black) and affinity-purified OC43 S- (eluate teal) fractions from 30 SARS-CoV-2 convalescent subjects across OC43, control, CoV-2, pathogenic CoV, and other endemic CoV. y-axis depicts binding signal for indicated antigen specificity, x-axis depicts signal from total IgA quantitation.
Figure 5—figure supplement 9
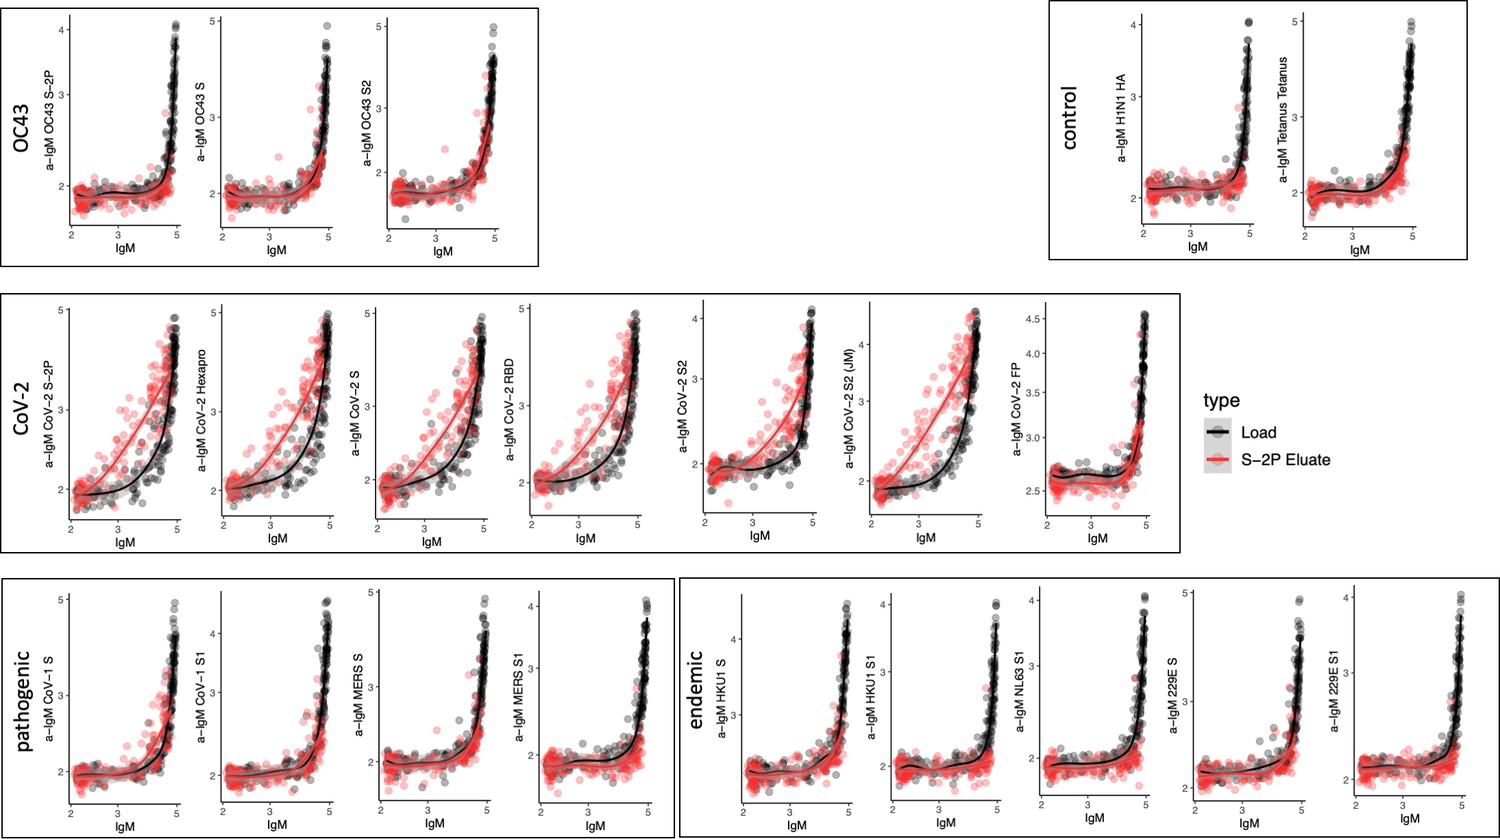
Cross-reactivity of SARS-CoV-2 S-2P-specific IgM.
Antigen-binding profiles of IgM in unfractionated serum (load, black) and affinity-purified CoV-2 S-2P- (eluate, red) fractions from 30 SARS-CoV-2 convalescent subjects across OC43, control, CoV-2, pathogenic CoV, and other endemic CoV. y-axis depicts binding signal for indicated antigen specificity, x-axis depicts signal from total IgM quantitation.
Figure 5—figure supplement 10
Cross-reactivity of SARS-CoV-2 receptor-binding domain (RBD)-specific IgM.
Antigen-binding profiles of IgM in unfractionated serum (load, black) and affinity-purified CoV-2 RBD- (eluate, pink) fractions from 30 SARS-CoV-2 convalescent subjects across OC43, control, CoV-2, pathogenic CoV, and other endemic CoV. y-axis depicts binding signal for indicated antigen specificity, x-axis depicts signal from total IgM quantitation.
Figure 5—figure supplement 11
Cross-reactivity of SARS-CoV-2 S2-specific IgM.
Antigen-binding profiles of IgM in unfractionated serum (load, black) and affinity-purified CoV-2 S2- (eluate, yellow) fractions from 30 SARS-CoV-2 convalescent subjects across OC43, control, CoV-2, pathogenic CoV, and other endemic CoV. y-axis depicts binding signal for indicated antigen specificity, x-axis depicts signal from total IgM quantitation.
Figure 5—figure supplement 12
Cross-reactivity of OC43 S-specific IgM.
Antigen-binding profiles of IgM in unfractionated serum (load, black) and affinity-purified OC43 S- (eluate teal) fractions from 30 SARS-CoV-2 convalescent subjects across OC43, control, CoV-2, pathogenic CoV, and other endemic CoV. y-axis depicts binding signal for indicated antigen specificity, x-axis depicts signal from total IgM quantitation.
Figure 6
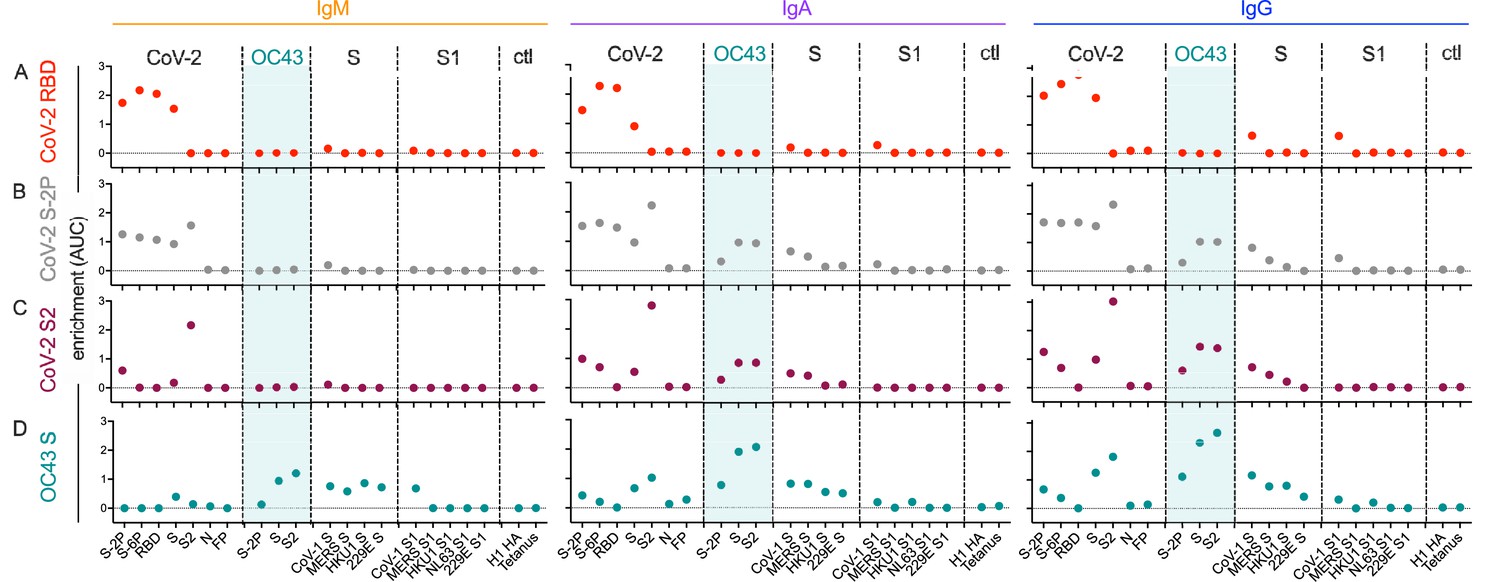
Molecular cross-reactivity profiles of OC43 and SARS-CoV-specific antibody fractions across antigen specificities and Ig isotypes.
The degree of enrichment (area under the curve, AUC) of affinity-purified SARS-CoV-2 receptor-binding domain (RBD-) (A), S-2P- (B), S2 domain- (C), or OC43 S- (D) specific antibodies of IgM (left), IgA (center), and IgG (right) isotypes across diverse CoV and control (ctl) proteins. Dotted line indicates no enrichment.
Figure 7 with 2 supplements
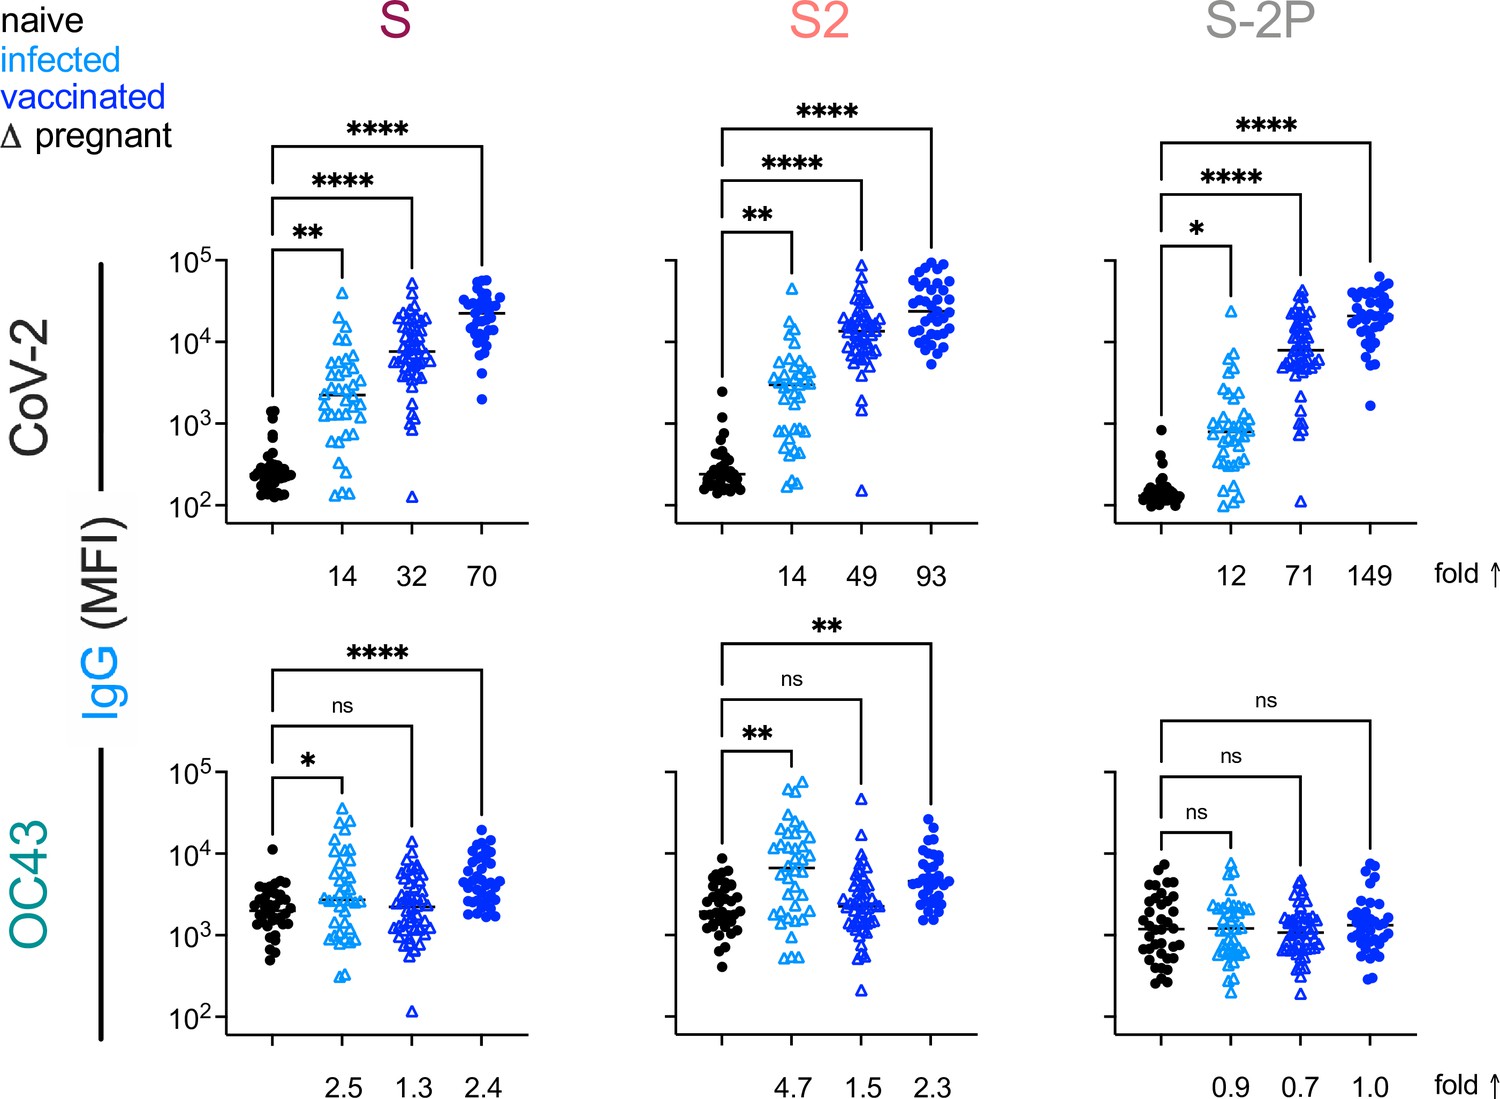
This Vaccination with stabilized spike does not result in robust boosting of endemic CoV responses.
IgG responses to SARS-CoV-2 (top) and OC43 (bottom) spike proteins. For each CoV strain, responses to S (left), the S2 domain (center), and stabilized S (S-2P, right) are shown. Responses in SARS-CoV-2-naïve subjects are indicated in black, SARS-CoV-2-infected subjects in light blue, and SARS-CoV-2-vaccinated (mRNA) subjects in dark blue. Pregnant subjects are indicated with triangles. Statistical significance by ANOVA with Dunnett’s correction (*p<0.05, **p<0.005, ****p<0.0001). Fold changes between mean response levels in seropositive and naïve cohorts are shown below each graph.
Figure 7—figure supplement 1
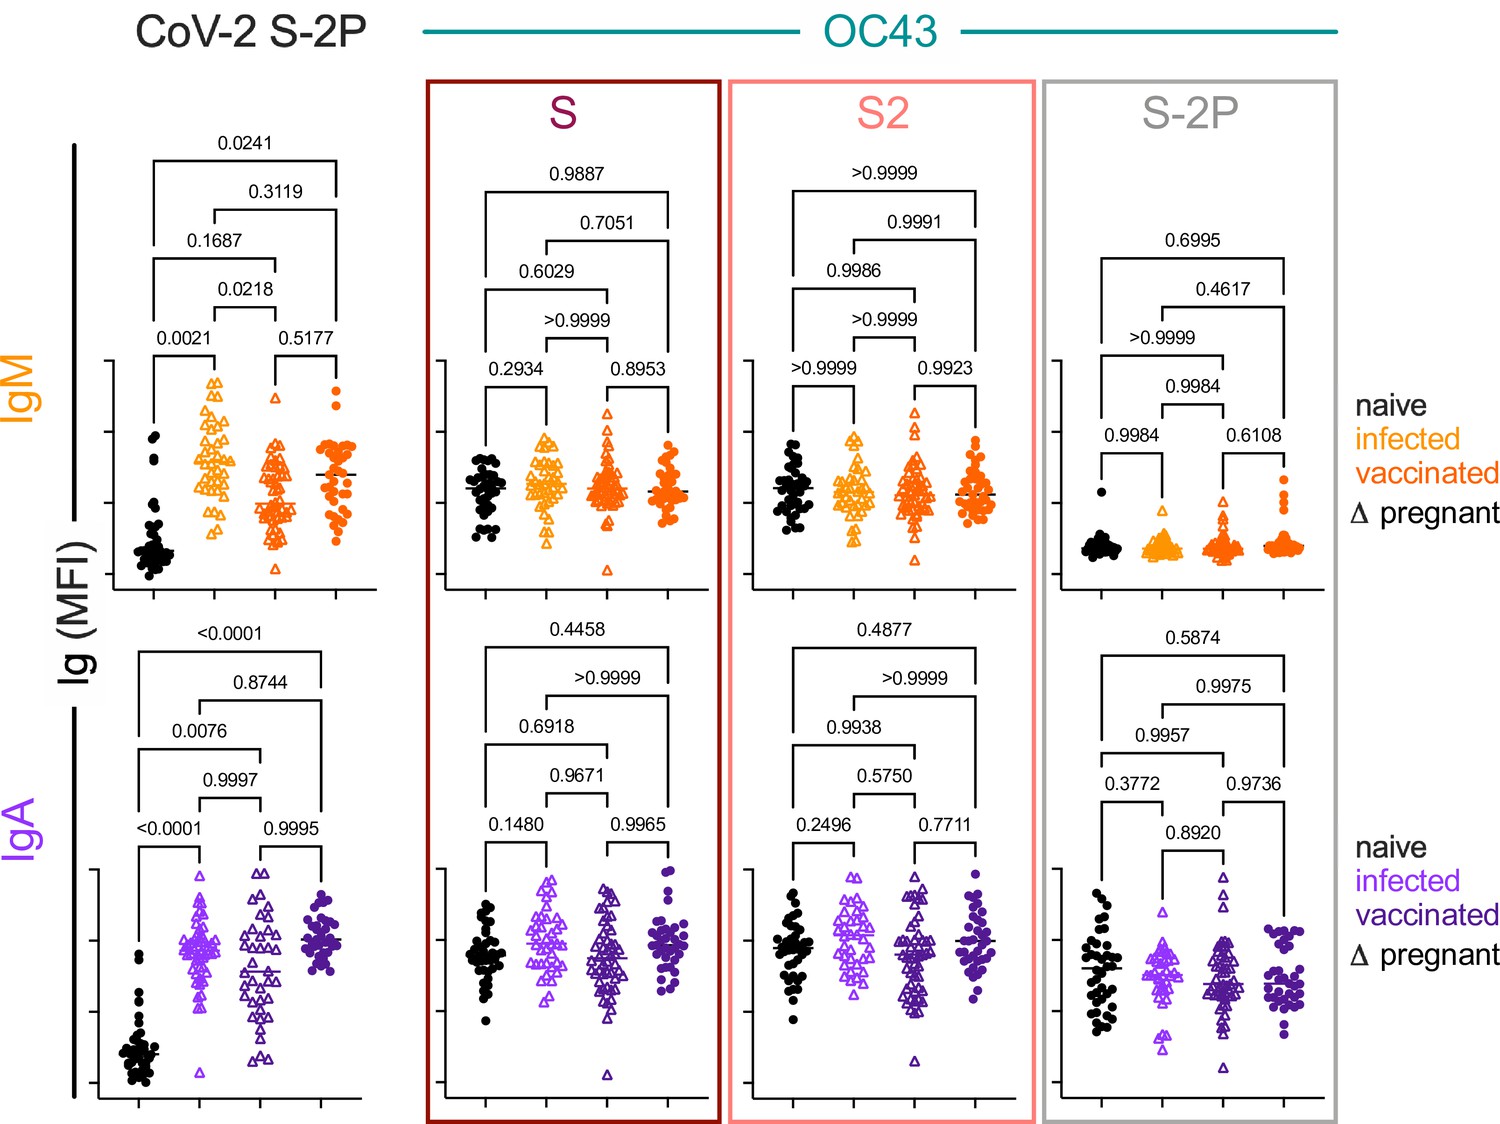
IgA and IgM responses among naïve subjects, infected pregnant women, vaccinated adults, and vaccinated pregnant women.
Box plots of IgM (top) and IgA (bottom) responses to SARS CoV-2 S-2P (left) and OC43 (right) S, S2, and S-2P. Statistical significance by ANOVA with Dunnett’s correction.
Figure 7—figure supplement 2
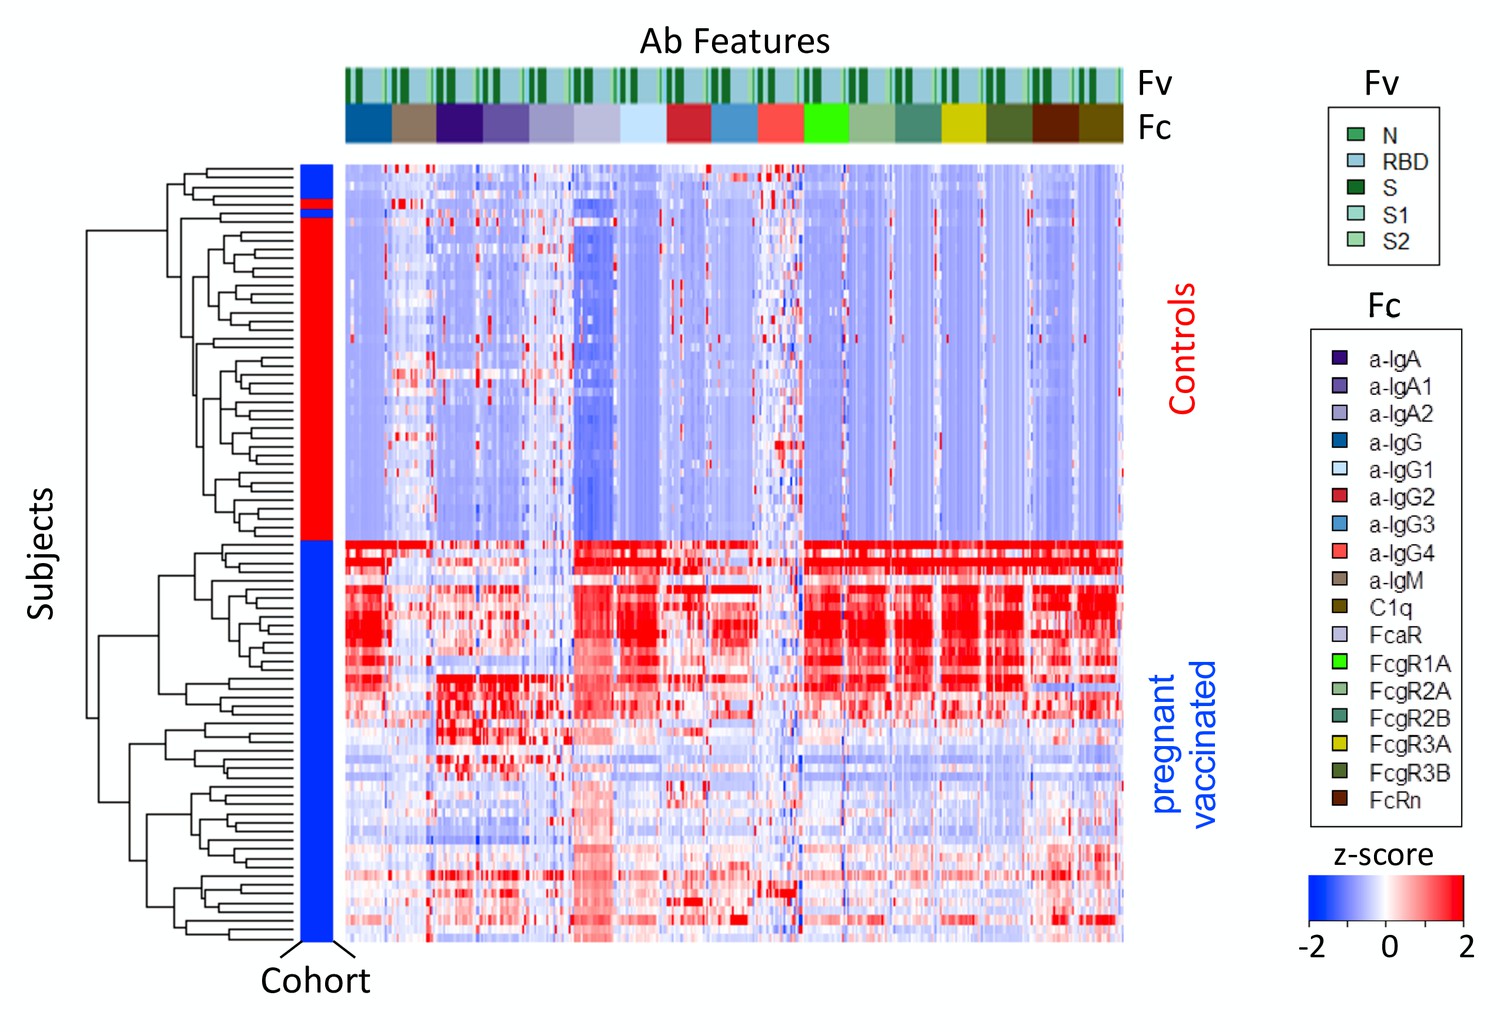
Serology profile of contemporaneous commercial control subjects.
Heatmap of filtered and hierarchically clustered SARS CoV-2-specific Ab features defined by multiplex assay among contemporaneous commercial naïve control subjects and vaccinated pregnant subject cohorts. Responses were scaled and centered by feature, and the scale was truncated at ±2 SD. Antigen specificity (Fv) and Fc characteristics (Fc) are indicated in the color bars. Cohort group is shown in the cohort color bar, with control subjects illustrated in red and vaccinated subjects in blue.
Figure 8
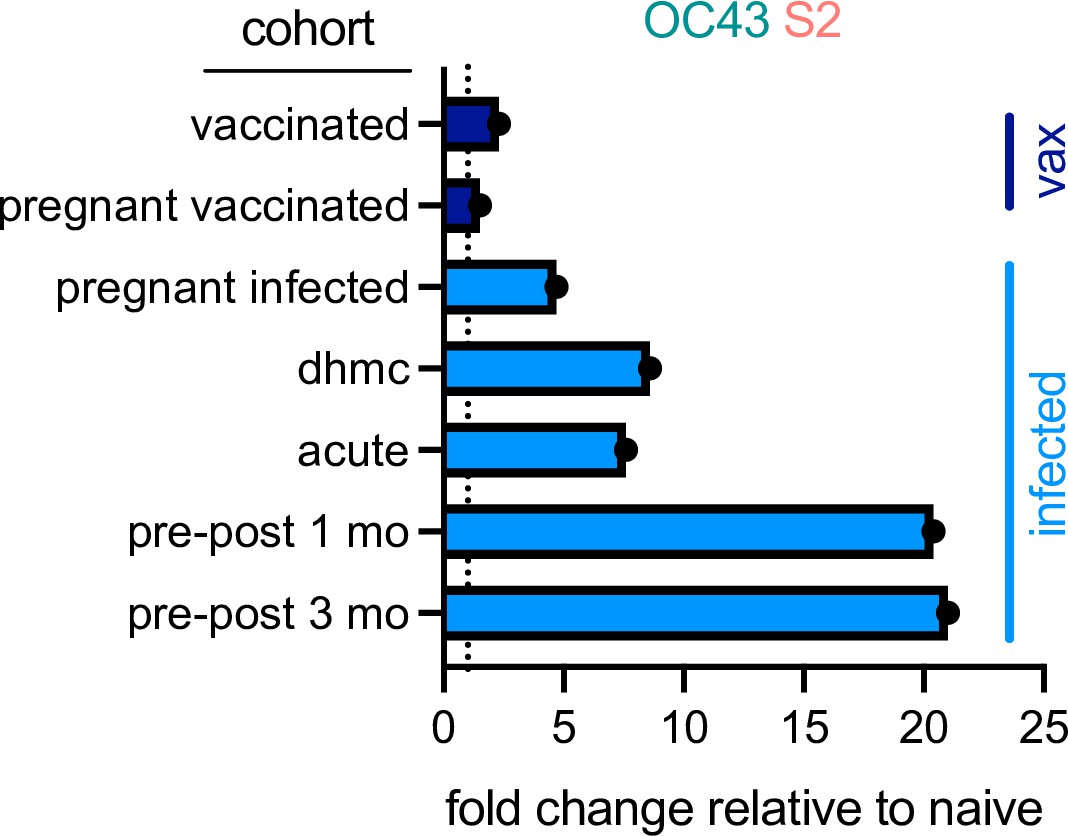
Differential boosting of responses to OC43 S2 by vaccination and natural infection.
Mean fold changes in the magnitude of the IgG response to OC43 S2 between the indicated cohort and naïve control subjects, or median fold change between pre- (naïve) and post-infection timepoints (pre-post cohort at 1 and 3 months) for the longitudinal cohort. Dotted line indicates no change. Vaccinated (vax) and infected cohorts are indicated in dark and light blue, respectively.
Figure 9
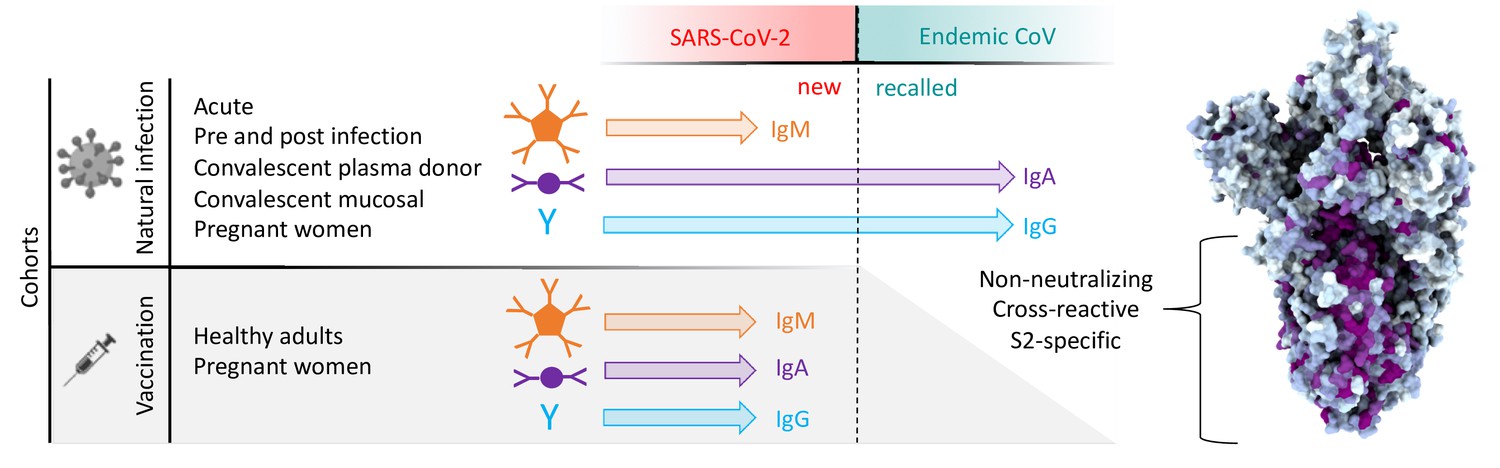
Graphical study summary.
Antibody responses to SARS-CoV-2 and endemic CoV spike proteins were measured in diverse cohorts. While antibodies to SARS-CoV-2 were induced across all isotypes, only IgA and IgG responses to endemic CoV were robustly boosted, and only among naturally infected but not vaccinated individuals. These recalled, cross-reactive responses to endemic CoV primarily recognized the better-conserved S2 domain and were non-neutralizing. While other antiviral activities of broadly cross-reactive S2-specifc antibodies are not known, the differing antigenicity of natural infection and vaccination with stabilized prefusion spike has potential implications for the breadth and level of protection afforded by each.
Author response image 1
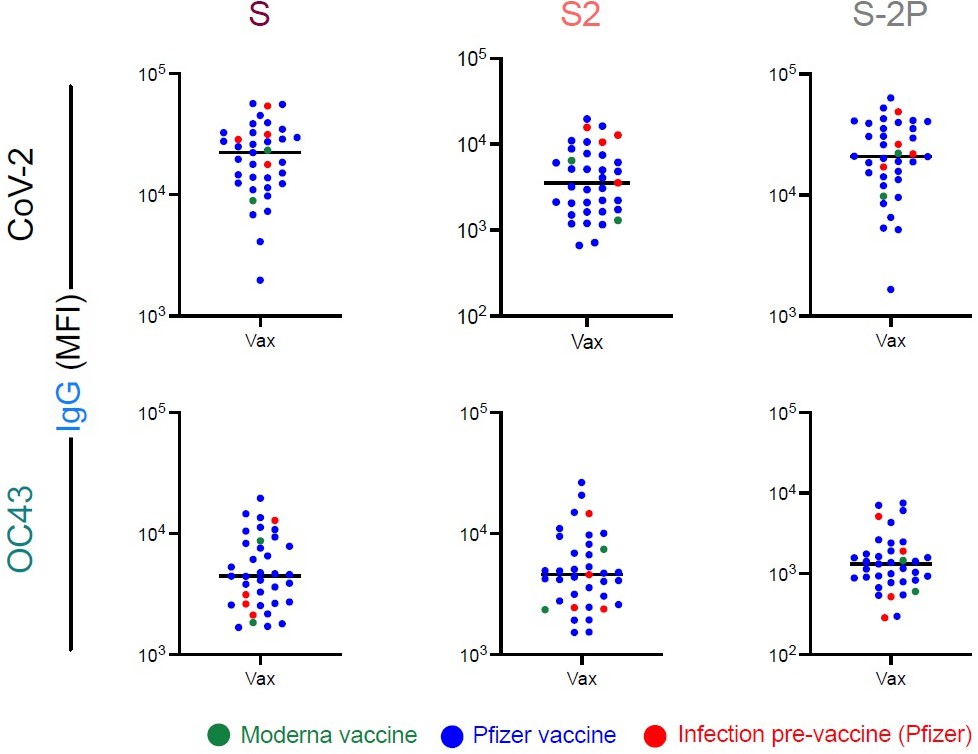
Comparison of IgG responses to CoV-2 and OC43 spike in vaccinated subjected.
IgG responses to SARS CoV-2 (top) and OC43 (bottom) S (left), S2 (center), and S-2P (right), among pregnant (P) and non-pregnant (NP) vaccinated subjects (Vax). Statistical significance defined by two-sided Mann Whitney test with unadjusted p values reported in inset.
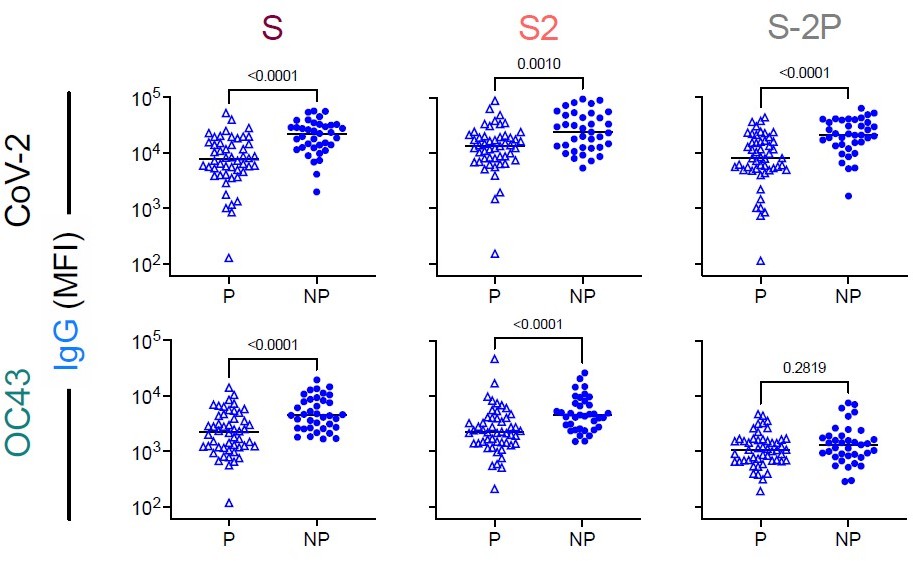
Author response image 2
CoV-2 and OC43-specific IgG responses among vaccinated subjects with and without prior infection.
IgG responses to OC43 S (left), S2 (center), and S-2P (right), among naïve subjects and non-pregnant vaccinated subjects (Vax). Vaccinated subjects are colored by vaccine (green – Moderna; blue – Pfizer) or history of prior infection (red, N = 4, Pfizer).
Tables
Table 1
Cohort characteristics.
NA: not applicable or available; IQR: interquartile range; DHMC: Dartmouth-Hitchcock Medical Center; JHMI: Johns Hopkins Medical Institutions. Partially reproduced from Natarajan et al., 2021.
| Characteristic | DHMC naive | DHMC convalescent | JHMI convalescent | Acute | Pre- and post-infection | Pregnant infected | Pregnant vaccinated | Vaccinated | Commercial controls | |||||||||
|---|---|---|---|---|---|---|---|---|---|---|---|---|---|---|---|---|---|---|
| n = 15 | n = 26 | n = 126 | n = 10 | n = 3 | n = 38 | n = 50 | n = 37 | n = 38 | ||||||||||
| Median age (IQR), years | 34(28–52) | 58(18–77) | 42(29–53) | 27(20–30) | 62(61–64) | 31(27–35) | 32(29–35) | NA | 39(28–50) | |||||||||
| Sex (n, %) | ||||||||||||||||||
| Female | 8 (53%) | 13 (50%) | 58 (46%) | 3 (30%) | 2 (67%) | 38 (100%) | 50 (100%) | 17 (46%) | 22 (58%) | |||||||||
| Male | 7 (47%) | 13 (50%) | 68 (54%) | 7 (70%) | 1 (33%) | 0 (0%) | 0 (0%) | 20 (54%) | 16 (42%) | |||||||||
| Hospitalized (severity) | ||||||||||||||||||
| No | NA | 20 (77%) | 114 (90.5%) | 10 (100%) | 3 (100%) | NA | NA | NA | NA | |||||||||
| Yes | 6 (23%) | 12 (9.5%) | 0 (0%) | 0 (0%) | ||||||||||||||
| Median days since PCR+ or symptom onset (IQR) | NA | 42.5 (19–154) | 43 (38–48) | 11 (9–14) | 12 (11–14) | 49 (22–78) | NA | NA | NA | |||||||||
| Median days since second vaccine dose (IQR) | NA | NA | NA | NA | NA | NA | 20 (12–29) | 8 (7–11) | NA | |||||||||
| Location | US | US | US | US | US | Belgium | Israel | US | US | |||||||||
| IRB | DHMC | DHMC | JHMI | DHMC | DHMC | CHU St. Pierre | Hadassah Medical Center | JHMI | BioIVT clinical sites | |||||||||
Key resources table
| Reagent type (species) or resource | Designation | Source or reference | Identifiers | Additional information |
|---|---|---|---|---|
| Peptide, recombinant protein | H1N1 HA1 | Immune Technology | IT-003-00110p | |
| Peptide, recombinant protein | HSV gE | Immune Technology | IT-005-005p | |
| Peptide, recombinant protein | Tetanus toxoid | Sigma | 676570-37-9 | |
| Peptide, recombinant protein | SARS-CoV-2 N | Immune Technology | IT-002-033Ep | |
| Peptide, recombinant protein | SARS-CoV-2 fusion peptide | New England Peptide | LCBiot-SKPSKRSFIEDLLFNKVTLADAGFIKQYGD | |
| Peptide, recombinant protein | SARS-CoV-2 S1 | ACROBiosystems | S1N-C52H3-100ug | |
| Peptide, recombinant protein | SARS-CoV-2 RBD | BEI Resources | NR-52366 | |
| Peptide, recombinant protein | SARS-CoV-2 S2 | Immune Technology | IT-002-034p | |
| Peptide, recombinant protein | SARS-CoV-2 S-2P | Wrapp et al., 2020 | Produced in Expi 293 | |
| Peptide, recombinant protein | SARS-CoV-2 S-6P | Hsieh et al., 2020 | Produced in Expi 293 | |
| Peptide, recombinant protein | WIV1 S-2P | Plasmid provided by Jason McLellan | Produced in Expi 293 | |
| Peptide, recombinant protein | SARS-CoV-1 S | Sino Biological | 40634-V08B | |
| Peptide, recombinant protein | SARS-CoV-1 S1 | Sino Biological | 40150-V08B1 | |
| Peptide, recombinant protein | MERS S | Sino Biological | 40069-V08B | |
| Peptide, recombinant protein | MERS S1 | Sino Biological | 40069-V08B1 | |
| Peptide, recombinant protein | OC43 S | Sino Biological | 40607-V08B | |
| Peptide, recombinant protein | OC43 S-2P | Plasmid provided by Jason McLellan | Produced in HEK 293F | |
| Peptide, recombinant protein | OC43 S2 | Sino Biological | 40069-V08B | |
| Peptide, recombinant protein | 229E S | Sino Biological | 40601-V08H | |
| Peptide, recombinant protein | 229E S1 | Sino Biological | 40605-V08H | |
| Peptide, recombinant protein | HKU1 S | Sino Biological | 40606-V08H | |
| Peptide, recombinant protein | HKU1 S1 | Sino Biological | 40606-V08H | |
| Peptide, recombinant protein | NL63 S | Sino Biological | 40606-V08B | |
| Peptide, recombinant protein | NL63 S1 | Sino Biological | 40604-V08H | |
| Antibody | Anti-human IgG Fc-PE (goat polyclonal) | SouthernBiotech | 1030-09 | Used at 0.65 µg/mL. 40 µL used per well in 384-well plates |
| Antibody | Anti-human IgG1 Fc-PE (mouse monoclonal) | SouthernBiotech | 9054-09 | Used at 0.65 µg/mL. 40 µL used per well in 384-well plates |
| Antibody | Anti-human IgG2 Fc-PE (mouse monoclonal) | SouthernBiotech | 9070-09 | Used at 0.65 µg/mL. 40 µL used per well in 384-well plates |
| Antibody | Anti-human IgG3 Fc-PE (mouse monoclonal) | SouthernBiotech | 9210-09 | Used at 0.65 µg/mL. 40 µL used per well in 384-well plates |
| Antibody | Anti-human IgG4 Fc-PE (mouse monoclonal) | SouthernBiotech | 9200-09 | Used at 0.65 µg/mL. 40 µL used per well in 384-well plates |
| Antibody | Anti-human IgA Fc-PE (goat polyclonal) | SouthernBiotech | 2050-09 | Used at 0.65 µg/mL. 40 µL used per well in 384-well plates |
| Antibody | Anti-human IgA1 Fc-PE (mouse monoclonal) | SouthernBiotech | 9130-09 | Used at 0.65 µg/mL. 40 µL used per well in 384-well plates |
| Antibody | Anti-human IgA2 Fc-PE (mouse monoclonal) | SouthernBiotech | 9140-09 | Used at 0.65 µg/mL. 40 µL used per well in 384-well plates |
| Antibody | Anti-human IgM Fc-PE (mouse monoclonal) | SouthernBiotech | 9020-09 | Used at 0.65 µg/mL. 40 µL used per well in 384-well plates |
| Antibody | Anti-human IgM mouse/bovine/horse SP ads-UNLB (goat polyclonal) | SouthernBiotech | 2023-01 | |
| Antibody | Fab2 anti-human Fab2 (min × abs) (goat polyclonal) | Jackson Laboratories | 109-006-097 | |
| Antibody | Anti-human IgA (goat polyclonal) | SouthernBiotech | 2053-01 | |
| Cell line (Homo sapiens) | HEK Freestyle 293F | Thermo Fisher | R79007 | |
| Cell line (H. sapiens) | Expi293F | Thermo Fisher | A14527 | |
| Cell line (H. sapiens) | 293T-ACE2 | Takara | 631289 | |
| Recombinant DNA reagent | VSV-SARS-CoV-2 | Letko et al., 2020 | ||
| Commercial assay or kit | Dynabeads | Thermo Fisher | 65011 | |
| Chemical compound, drug | EDC | Thermo Fisher | 22980 | |
| Chemical compound, drug | Sulfo-NHS | Thermo Fisher | 24510 | |
| Software, algorithm | GraphPad Prism version 9 | GraphPad Prism version 9 | ||
| Software, algorithm | ChimeraX | ChimeraX | ||
| Software, algorithm | R version 3.6.1 | R | Packages: pracma, ggplot2, pheatmap |
Additional files
Download links
A two-part list of links to download the article, or parts of the article, in various formats.
Downloads (link to download the article as PDF)
Open citations (links to open the citations from this article in various online reference manager services)
Cite this article (links to download the citations from this article in formats compatible with various reference manager tools)
Boosting of cross-reactive antibodies to endemic coronaviruses by SARS-CoV-2 infection but not vaccination with stabilized spike
eLife 11:e75228.
https://doi.org/10.7554/eLife.75228


