METTL3 promotes homologous recombination repair and modulates chemotherapeutic response in breast cancer by regulating the EGF/RAD51 axis
- Jiangsu Key Laboratory for Molecular and Medical Biotechnology, College of Life Sciences, Nanjing Normal University, China
Figures
Figure 1 with 1 supplement
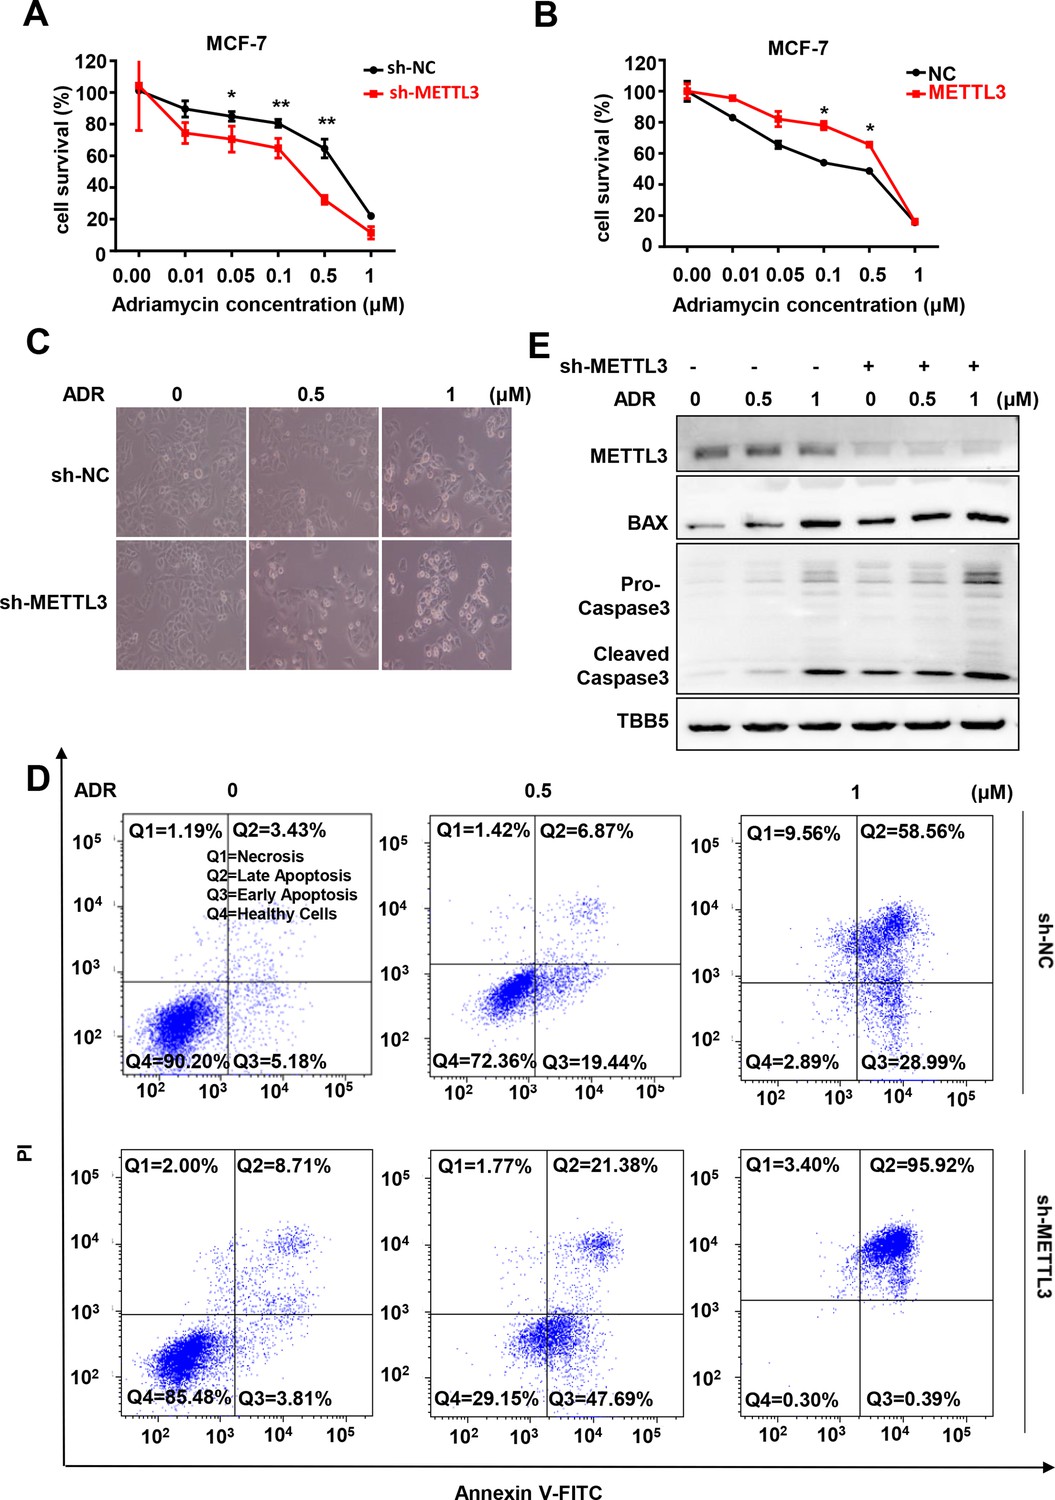
Knockdown of Methyltransferase-like 3 (METTL3) sensitizes both MCF-7 and MB-231 cells to Adriamycin (ADR).
(A, B) MTT assays were performed to determine the effect of METTL3 on ADR cytotoxicity in MCF-7 or MDA-MB231 cells. Data are expressed as the mean ± standard deviation (SD), n=3 per group. (C) Morphological analysis of MCF-7 with different drug treatments. (D) Annexin V/PI staining and flow cytometry assay of control or METTL3-KD MCF-7 cells with different drug treatments. (E) Western blot (WB) analysis of METTL3, BAX, and Caspase 3 in control or METTL3-KD MCF-7 cells treated with various concentrations of ADR. All statistical data are presented as the mean ± SD. * p<0.05; ** p<0.01; *** p<0.001 (Student’s t-test).
-
Figure 1—source data 1
Source data for Figure 1E.
- https://cdn.elifesciences.org/articles/75231/elife-75231-fig1-data1-v2.zip
Figure 1—figure supplement 1

Knockdown of Methyltransferase-like 3 (METTL3) sensitizes MCF-7 and MB231 cells to Adriamycin (ADR).
(A) Protein levels of METTL3 in breast cancer (BC) cells and normal breast cell (MCF-10A). (B) m6A modification in BC cells and normal breast cell. (C, D) Western blotting (WB) assay of METTL3 in the METTL3-OV stable cell lines (C) or METTL3-KD stable cell lines (D) in MCF-7 and MB231. (E) MTT assays using METTL3-KD and METTL3-OV MB-231 stable cell lines treated with ADR. Data are expressed as the mean ± standard deviation (SD), n=3 per group. (F–I) MTT assays using METTL3-KD and METTL3-OV MCF-7 stable cell lines treated with other four first-line chemotherapeutic drugs for BC treatment, including 5-FU (F), cisplatin (DDP) (G), paclitaxel (H), and carboplatin (I). Data are expressed as the mean ± standard deviation (SD), n=3 per group. (J) Morphological analysis of different treated MCF-7. (K) Flow cytometry analysis showed METTL3 deficiency increases ADR-induced cell apoptosis in MB231. (L) WB to detected METTL3 in METTL3-OV MCF-10A cells. (M) MTT assays in wildtype and METTL3-OV MCF-10A cells treated with ADR. Data are expressed as the mean ± standard deviation (SD), n=3 per group. (N) Morphological analysis of control and METTL3-OV MCF-10A cells treated with different dose of ADR. (O, P) Dot blot to detected the m6A level of poly(A)+ RNAs isolated from total RNA of METTL3-KD or METTL3-OV MCF-7, and MDA-MB231 cells with or without ADR treatment and recovery (0.5 μM ADR treatment for 1 hr and recovery for different time). Methylene blue staining served as a loading control. * p<0.05, ** p<0.01, *** p<0.001.
-
Figure 1—figure supplement 1—source data 1
Source data for Figure 1—figure supplement 1A.
- https://cdn.elifesciences.org/articles/75231/elife-75231-fig1-figsupp1-data1-v2.zip
-
Figure 1—figure supplement 1—source data 2
Source data for Figure 1—figure supplement 1B.
- https://cdn.elifesciences.org/articles/75231/elife-75231-fig1-figsupp1-data2-v2.zip
-
Figure 1—figure supplement 1—source data 3
Source data for Figure 1—figure supplement 1C.
- https://cdn.elifesciences.org/articles/75231/elife-75231-fig1-figsupp1-data3-v2.zip
-
Figure 1—figure supplement 1—source data 4
Source data for Figure 1—figure supplement 1D.
- https://cdn.elifesciences.org/articles/75231/elife-75231-fig1-figsupp1-data4-v2.zip
-
Figure 1—figure supplement 1—source data 5
Source data for Figure 1—figure supplement 1L.
- https://cdn.elifesciences.org/articles/75231/elife-75231-fig1-figsupp1-data5-v2.zip
-
Figure 1—figure supplement 1—source data 6
Source data for Figure 1—figure supplement 1O.
- https://cdn.elifesciences.org/articles/75231/elife-75231-fig1-figsupp1-data6-v2.zip
-
Figure 1—figure supplement 1—source data 7
Source data for Figure 1—figure supplement 1P.
- https://cdn.elifesciences.org/articles/75231/elife-75231-fig1-figsupp1-data7-v2.zip
Figure 2 with 1 supplement
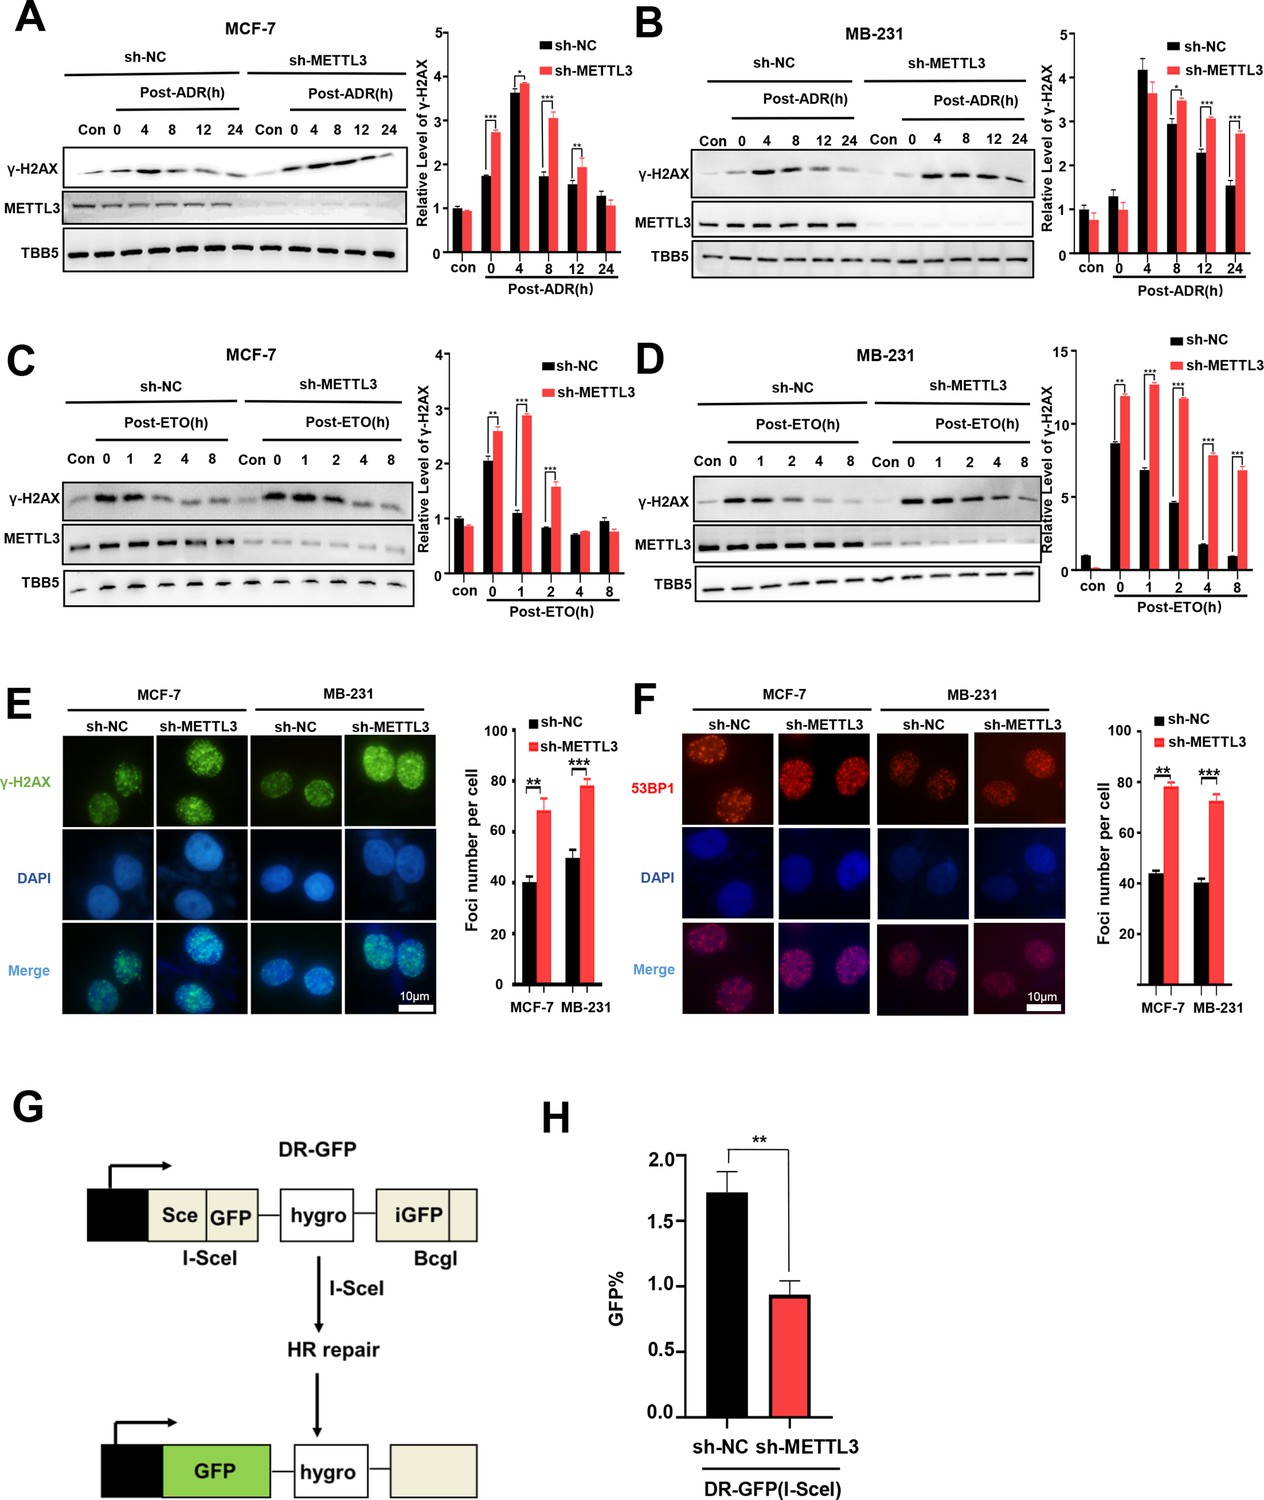
Knockdown of Methyltransferase-like 3 (METTL3) impairs homologous recombination repair (HR) efficacy.
(A, B) Western blot (WB) assay to determine γ-H2AX levels in control and METTL3-KD MCF-7 cells (A) or MB-231 cells (B) with ADR (0.5 μM) treatment for 1 hr following different recovery times. (C, D) WB to determine γ-H2AX levels in control and METTL3-KD MCF-7 cells (C) or MB-231 cells (D) with ETO (10 μM) treatment for 1 hr following different recovery times. The Quantification of relative WB band are represented as the mean ± SD of three biological repeats. n=3 per group. (E) Immunofluorescence staining of γ-H2AX foci in different labeled cells with ADR treatment for 1 hr following 8 hr of recovery. (F) Immunofluorescence staining of 53BP1 foci in different cells treated same in (E). The quantification of average foci numbers per cells were showed in right panel, 50 cells were calculated in each group. (G) Schematic of GFP-based HR reporter system. (H) The GFP+ frequency of HR-mediated DSB repair in control and METTL3-KD U2OS cells (n=3 per group). ** p<0.01; *** p<0.001 (Student’s t-test).
-
Figure 2—source data 1
Source data for Figure 2A.
- https://cdn.elifesciences.org/articles/75231/elife-75231-fig2-data1-v2.zip
-
Figure 2—source data 2
Source data for Figure 2B.
- https://cdn.elifesciences.org/articles/75231/elife-75231-fig2-data2-v2.zip
-
Figure 2—source data 3
Source data for Figure 2C.
- https://cdn.elifesciences.org/articles/75231/elife-75231-fig2-data3-v2.zip
-
Figure 2—source data 4
Source data for Figure 2D.
- https://cdn.elifesciences.org/articles/75231/elife-75231-fig2-data4-v2.zip
Figure 2—figure supplement 1
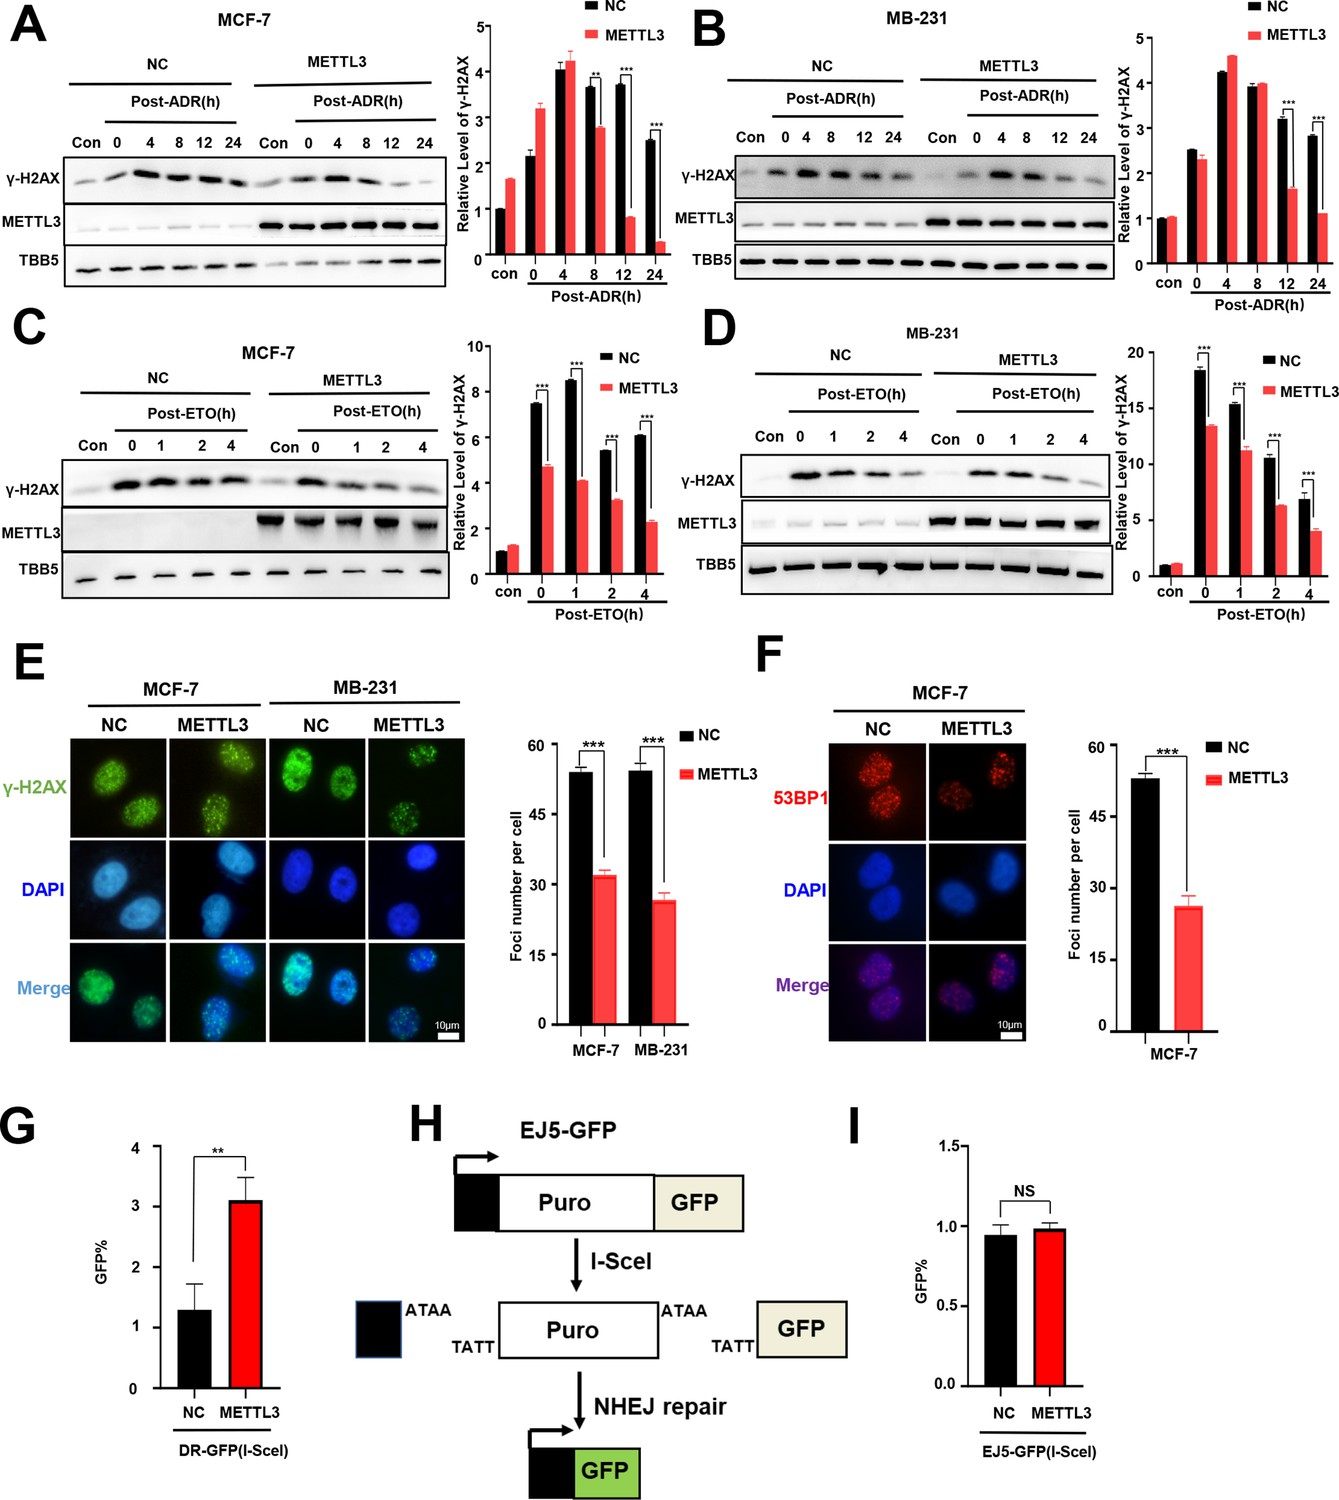
Methyltransferase-like 3 (METTL3) enhances homologous recombination repair (HR) activity.
(A and B) Western blotting (WB) assay to determine γ-H2AX levels in control and METTL3-OV MCF-7 cells (A) or MB-231 cells (B) with ADR (0.5 μM) treatment for 1 hr following different time of recovery. (C and D) WB assay to determine γ-H2AX levels in control and METTL3-OV MCF-7 cells (C) or MB-231 cells (D) with ETO (10 μM) treatment for 1 hr following different time of recovery. The Quantification of relative WB band are represented as the mean ± SD of three biological repeats. (E) Immunofluorescence staining of γ-H2AX foci in METTL3-OV MCF-7 and MB-231 cells with ADR treatment for 1 hr following 4 hr recovery. (F) 53BP1 foci in METTL3-OV MCF-7 cells. The quantification of average foci numbers per cells were showed in right panel, 50 cells were calculated in each group. (G) The GFP+ frequency of HR-mediated DSB repair in control and METTL3-OV U2OS cells (n=3 per group). (H) Schematic of GFP-based NHEJ reporter system. (I) Relative quantification of the frequency of NHEJ-mediated DSBR in METTL3-ovexpressing U2OS cells. n=3 per group. ** p<0.01; *** p<0.001 (Student’s t-test).
-
Figure 2—figure supplement 1—source data 1
Source data for Figure 1—figure supplement 1A.
- https://cdn.elifesciences.org/articles/75231/elife-75231-fig2-figsupp1-data1-v2.zip
-
Figure 2—figure supplement 1—source data 2
Source data for Figure 2—figure supplement 1B.
- https://cdn.elifesciences.org/articles/75231/elife-75231-fig2-figsupp1-data2-v2.zip
-
Figure 2—figure supplement 1—source data 3
Source data for Figure 2—figure supplement 1C.
- https://cdn.elifesciences.org/articles/75231/elife-75231-fig2-figsupp1-data3-v2.zip
-
Figure 2—figure supplement 1—source data 4
Source data for Figure 2—figure supplement 1D.
- https://cdn.elifesciences.org/articles/75231/elife-75231-fig2-figsupp1-data4-v2.zip
Figure 3 with 1 supplement
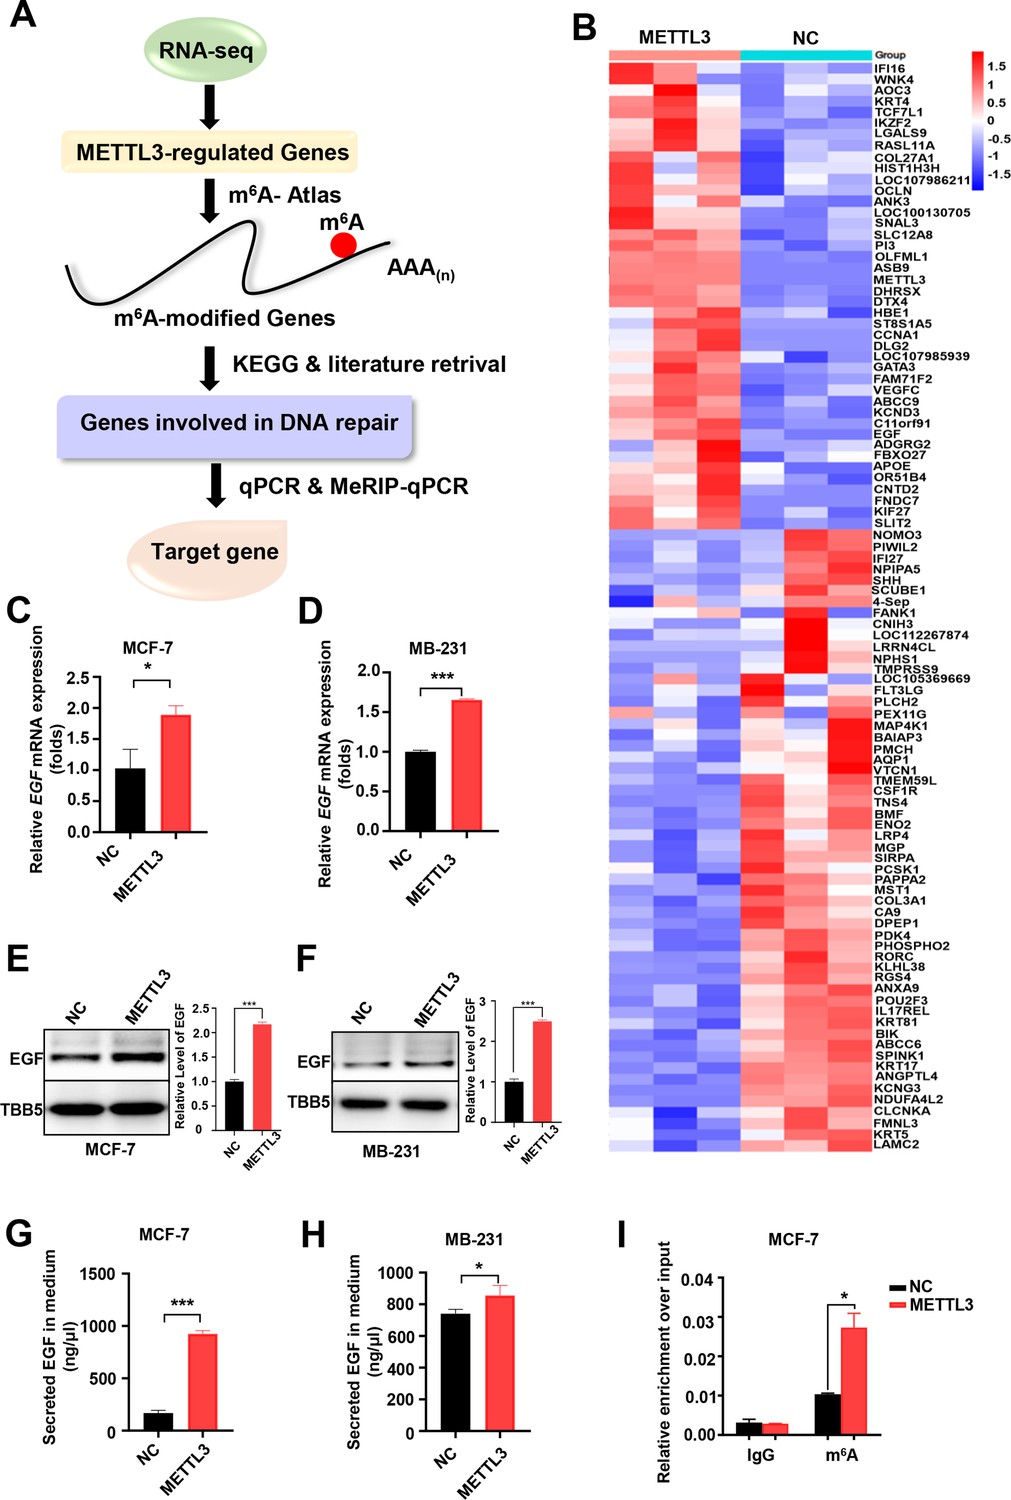
Screening and Identification of EGF as the targets of Methyltransferase-like 3 (METTL3) in breast cancer (BC).
(A) Schematic of the screening progress of METTL3 targets in BC. (B) Heat map of RNA-seq to identify the genes regulated by METTL3 overexpression. The value presented Log2 (fold change). (C, D) qRT-PCR was performed in METTL3-overexpressing MCF-7 (C) and MB-231 cells (D) to detect EGF expression. Data are expressed as the mean ± standard deviation (SD), n=3 per group. (E, F) Western blot (WB) analysis of EGF expression in METTL3-overexpressing MCF-7 (E) and MB-231 cells (F). (G, H) ELISA assay measuring secreted EGF in the medium of METTL3-overexpressing MCF-7 (G) and MB-231 cells. (H) Data are expressed as the mean ± standard deviation (SD), n=3 per group. (I) MeRIP-qPCR analysis was used to assess the m6A levels of EGF mRNA in METTL3-overexpressing MCF-7 cells. The enrichment of m6A in each group was calculated by m6A-IP/input and IgG-IP/input. Data are expressed as the mean ± standard deviation (SD), n=3 per group. * p<0.05; *** p<0.001 (Student’s t-test).
-
Figure 3—source data 1
Source data for Figure 3E.
- https://cdn.elifesciences.org/articles/75231/elife-75231-fig3-data1-v2.zip
-
Figure 3—source data 2
Source data for Figure 3F.
- https://cdn.elifesciences.org/articles/75231/elife-75231-fig3-data2-v2.zip
Figure 3—figure supplement 1
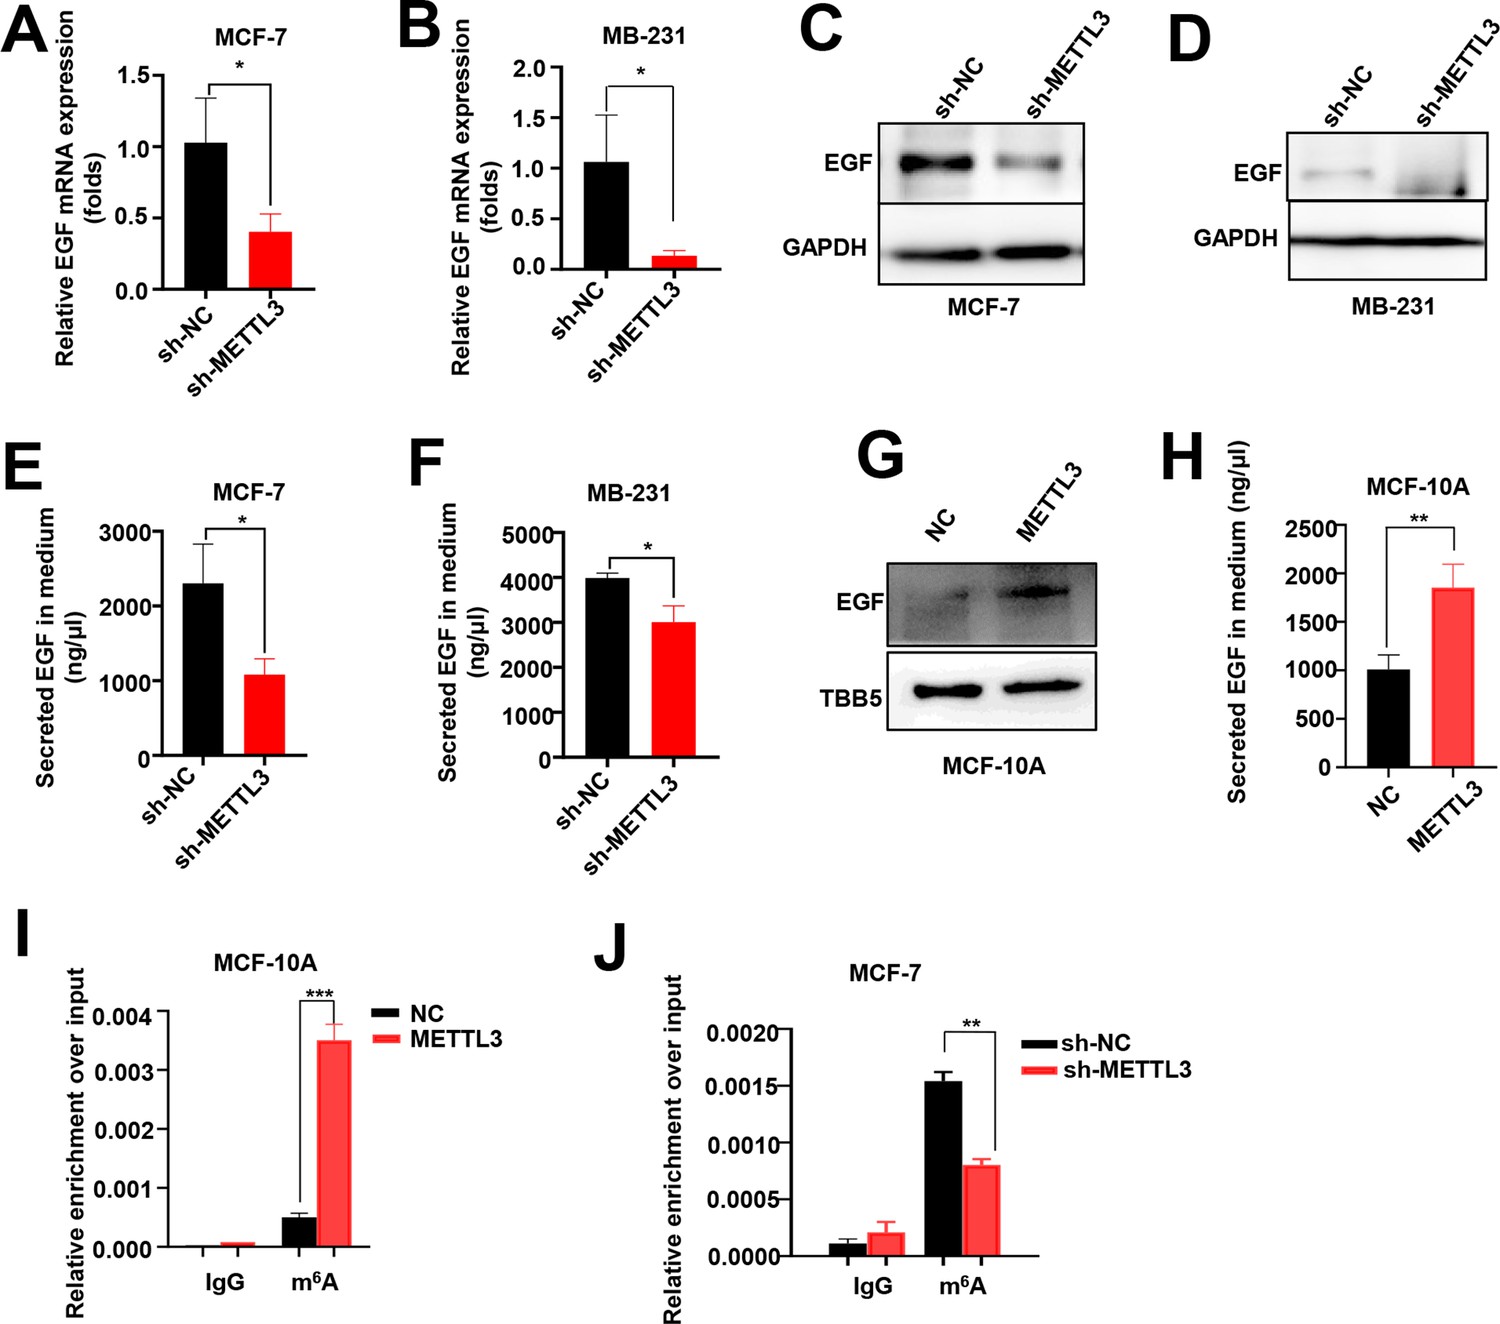
EGF is the targets of Methyltransferase-like 3 (METTL3) in MCF-7, MB-231, and MCF-10A cells.
(A, B) RT-qPCR was performed in METTL3-KD MCF-7 (A) and MB-231 cells (B) to detect the EGF mRNA expression. Data are expressed as the mean ± standard deviation (SD), n=3 per group. (C, D) Western blotting (WB) analysis of the EGF expression in METTL3-KD MCF-7 (C) and MB-231 cells (D). (E, F) ELISA assay to test the secreted EGF in the medium of METTL3-KD MCF-7 (E) and MB-231 cells (F). Data are expressed as the mean ± standard deviation (SD), n=3 per group. (G) WB showed that EGF was upregulated in METTL3-OV MCF-10A cells. (H) Secreted EGF increased in METTL3-OV MCF-10A cells. Data are expressed as the mean ± SD, n=3 per group. (I) MeRIP-qPCR analysis showed the upregulation of m6A levels of EGF mRNA in METTL3-OV MCF-10A cells. (J) Decreased m6A levels of EGF mRNA in METTL3-KD MCF-7 cells. Data are expressed as the mean ± standard deviation (SD), n=3 per group. * p<0.05; ** p<0.01; *** p<0.001 (Student’s t-test).
-
Figure 3—figure supplement 1—source data 1
Source data for Figure 3—figure supplement 1C.
- https://cdn.elifesciences.org/articles/75231/elife-75231-fig3-figsupp1-data1-v2.zip
-
Figure 3—figure supplement 1—source data 2
Source data for Figure 3—figure supplement 1D.
- https://cdn.elifesciences.org/articles/75231/elife-75231-fig3-figsupp1-data2-v2.zip
-
Figure 3—figure supplement 1—source data 3
Source data for Figure 3—figure supplement 1G.
- https://cdn.elifesciences.org/articles/75231/elife-75231-fig3-figsupp1-data3-v2.zip
Figure 4 with 1 supplement
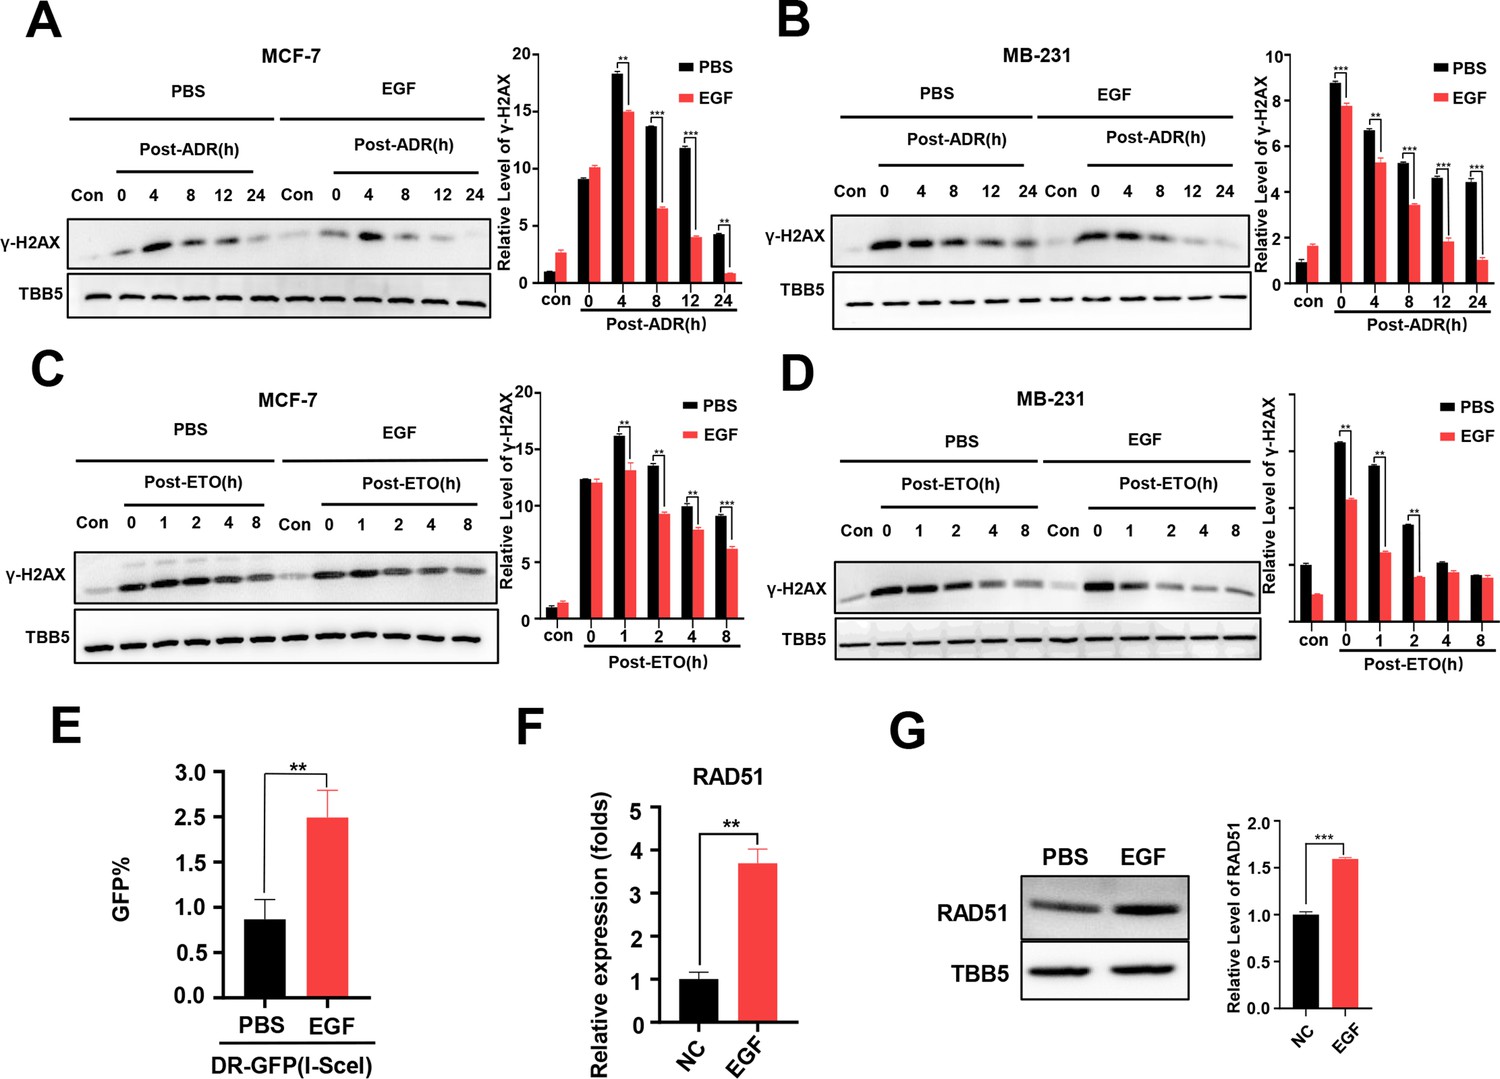
Additional EGF promotes RAD51 expression and enhances homologous recombination repair (HR) activity.
(A, B) Western blot (WB) assay identified that EGF (10 ng/ml) enhanced DNA repair in MCF-7 (A) and MB-231 cells (B) treated with ADR (0.5 μM) (shown by lower γ-H2AX in EGF treated samples compare to PBS treated samples). (C, D) EGF (10 ng/ml) enhanced DNA repair in MCF-7 (C) and MB-231 cells (D) treated with ETO (10 μM). The Quantification of relative WB band are represented as the mean ± SD of three biological repeats. (E) The GFP+ frequency of HR reporter assay in the treatment with EGF (10 ng/ml for 4 hr) or vehicle. Data are expressed as the mean ± standard deviation (SD), n=3 per group. (F, G) EGF augmented RAD51 mRNA (F) and protein (G) expression in MCF-7 cells. Data are expressed as the mean ± standard deviation (SD), n=2 per group. ** p<0.01 (Student’s t-test).
-
Figure 4—source data 1
Source data for Figure 4A.
- https://cdn.elifesciences.org/articles/75231/elife-75231-fig4-data1-v2.zip
-
Figure 4—source data 2
Source data for Figure 4B.
- https://cdn.elifesciences.org/articles/75231/elife-75231-fig4-data2-v2.zip
-
Figure 4—source data 3
Source data for Figure 4C.
- https://cdn.elifesciences.org/articles/75231/elife-75231-fig4-data3-v2.zip
-
Figure 4—source data 4
Source data for Figure 4D.
- https://cdn.elifesciences.org/articles/75231/elife-75231-fig4-data4-v2.zip
-
Figure 4—source data 5
Source data for Figure 4G.
- https://cdn.elifesciences.org/articles/75231/elife-75231-fig4-data5-v2.zip
Figure 4—figure supplement 1
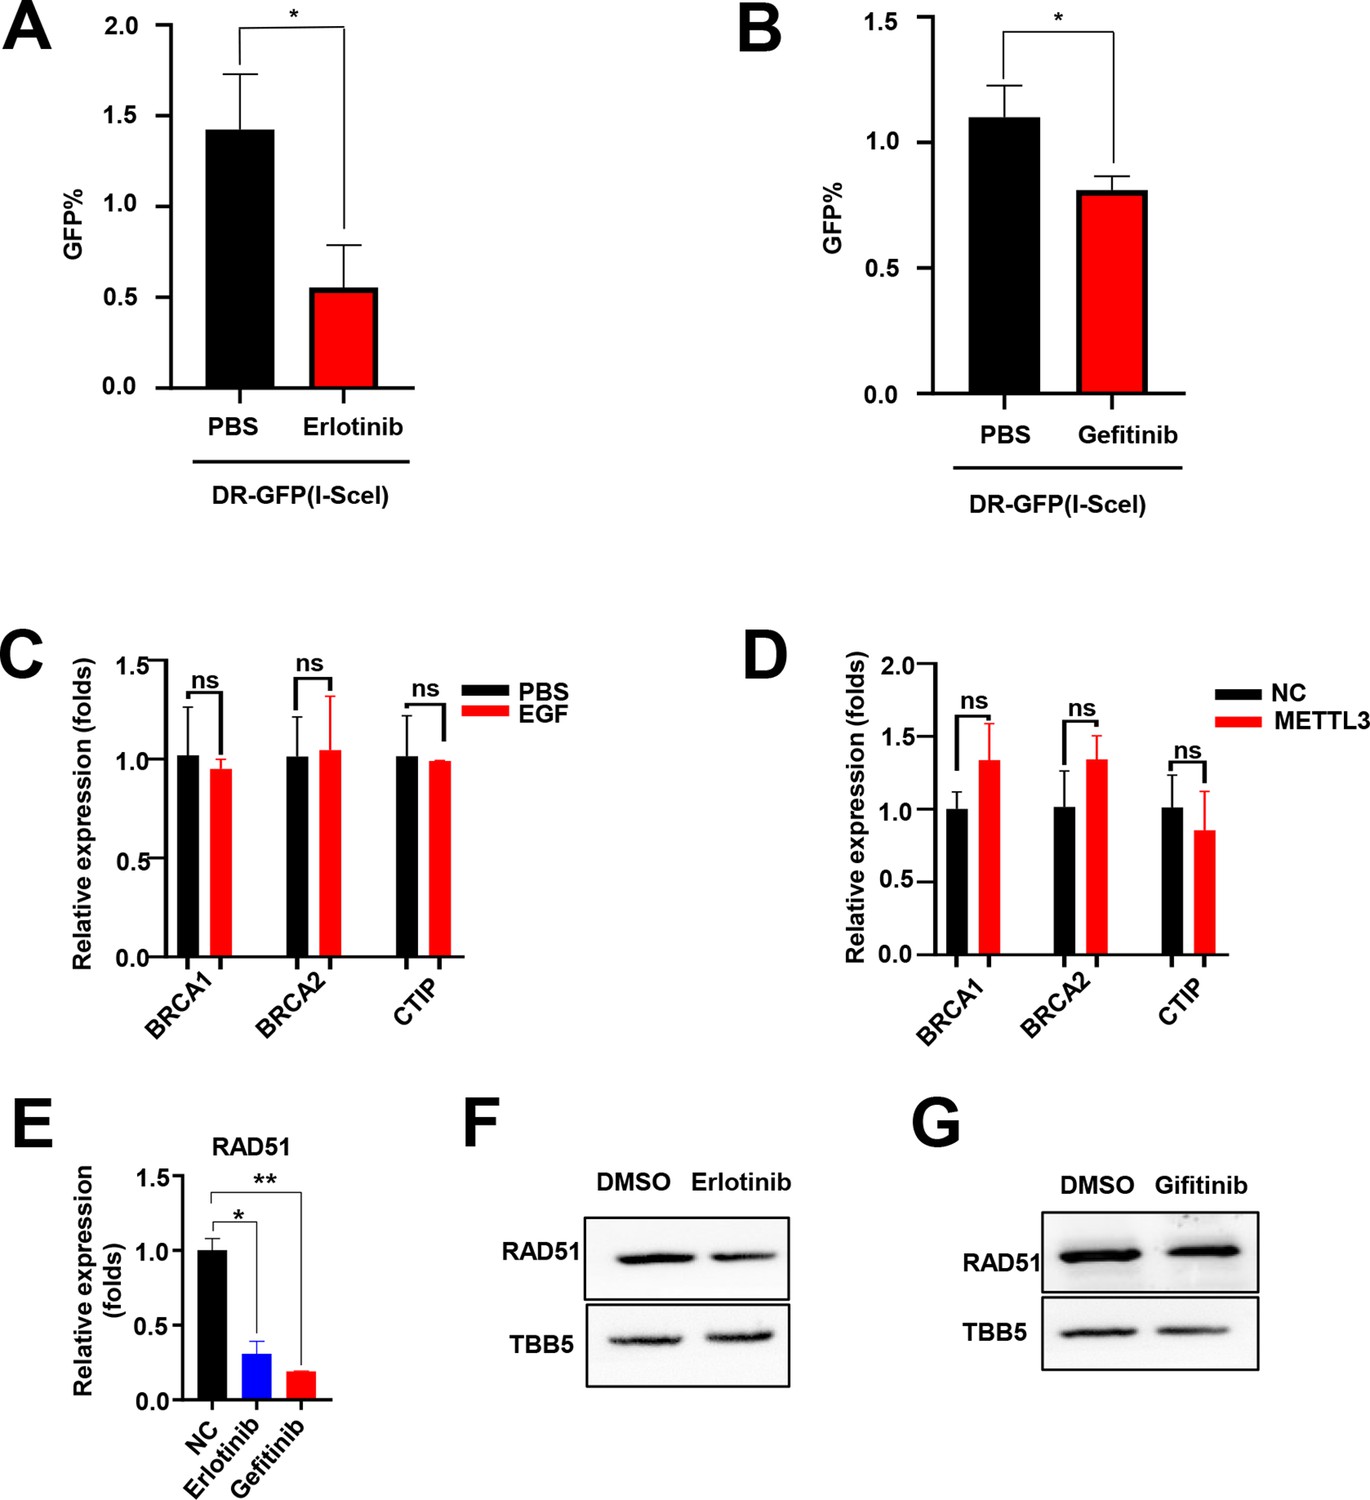
EGF promotes RAD51 expression and enhances homologous recombination repair (HR) efficiency.
(A and B) EGFR inhibitor (Erlotinib and Gefitinib) reduced HR efficacy in GFP-based HR reporter system. n=3 per group. EGF (C) or METTL3 (D) regulated the mRNA levels of BRCA1, BRCA2, and CtIP. Data are expressed as the mean ± standard deviation (SD), n=3 per group. (E) Erlotinib and Gefitinib reduced the mRNA levels of RAD51. Data are expressed as the mean ± SD, n=3 per group. (F–G) Erlotinib (F) and Gefitinib (G) reduced the protein levels of RAD51 in MCF-7 cells. * p<0.05 (Student’s t-test).
-
Figure 4—figure supplement 1—source data 1
Source data for Figure 4—figure supplement 1F.
- https://cdn.elifesciences.org/articles/75231/elife-75231-fig4-figsupp1-data1-v2.zip
-
Figure 4—figure supplement 1—source data 2
Source data for Figure 4—figure supplement 1G.
- https://cdn.elifesciences.org/articles/75231/elife-75231-fig4-figsupp1-data2-v2.zip
Figure 5 with 1 supplement
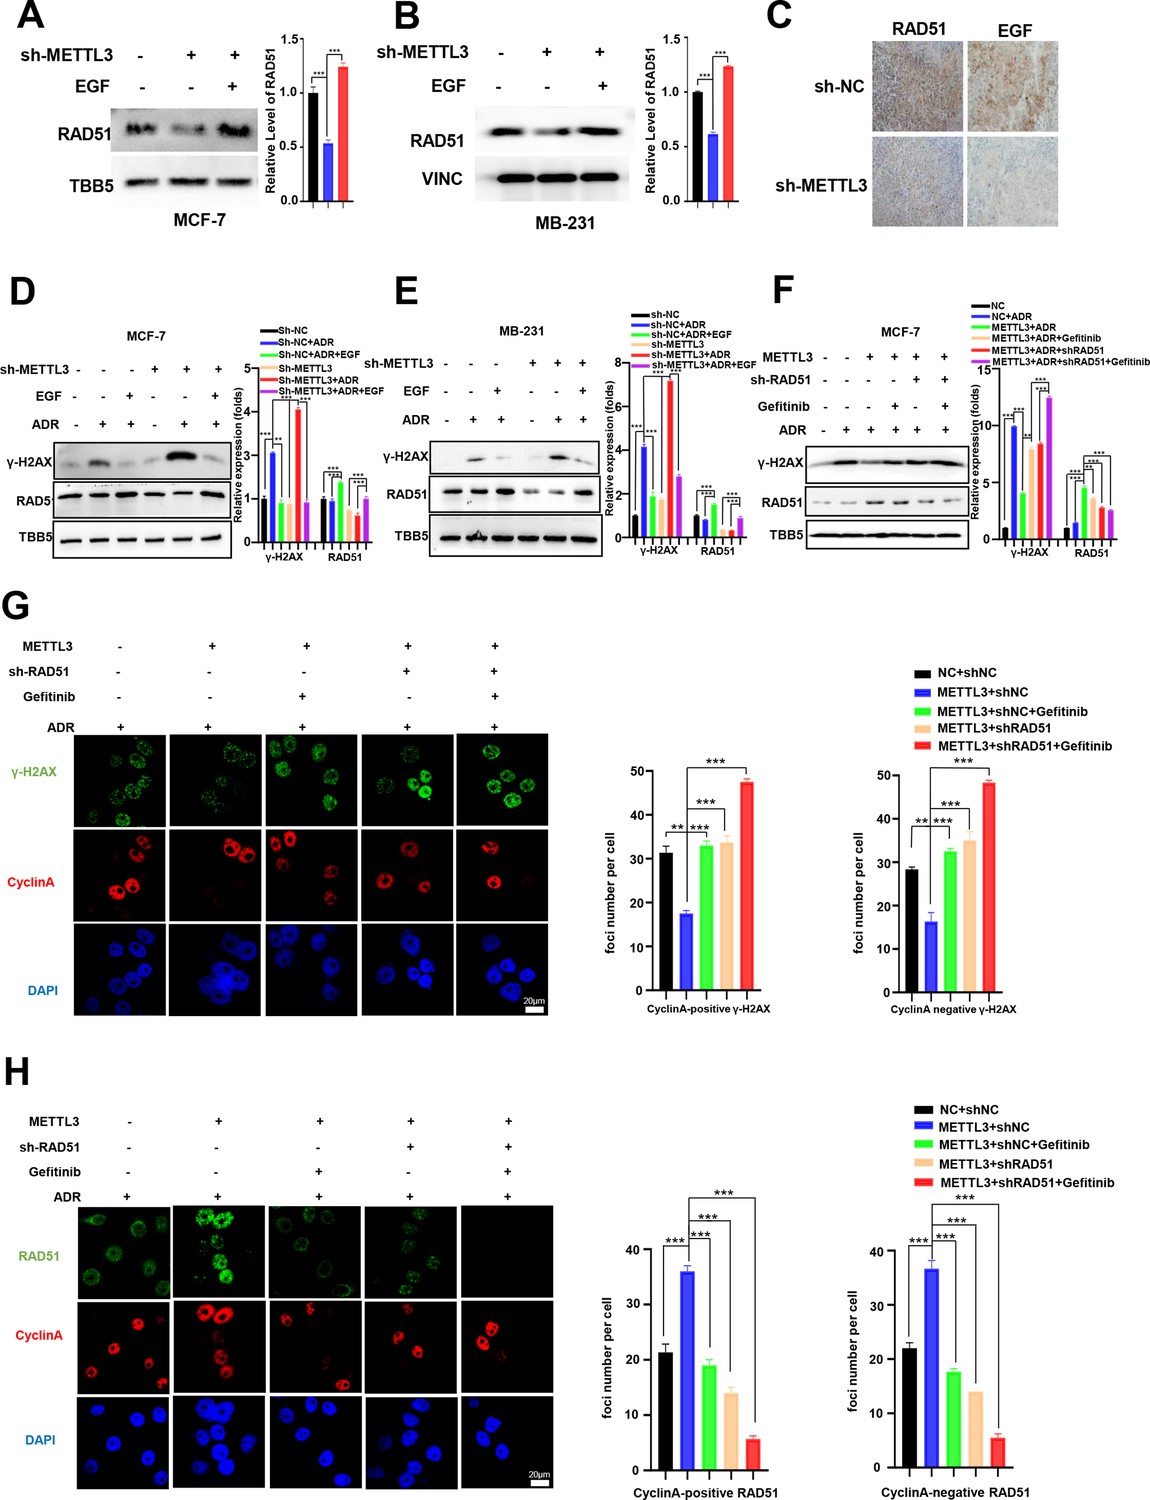
Methyltransferase-like 3 (METTL3) promotes DNA repair via EGF/Rad51 axis.
(A, B) RAD51 protein levels in METTL3-KD MCF-7 (A) and MB-231 (B) cells treated with or without EGF. (C) Immunohistochemistry analysis of the expression of EGF and RAD51 in control and METTL3-KD tumor tissues. (D, E) WB analysis showing that treatment with 10 ng/ml EGF for 8 hr restores DNA repair activity in METTL3-KD MCF-7 (D) and MB-231 (E) cells. (F) WB analysis showing that knocking down RAD51 or EGFR inhibitor Gefitinib (10 nM for 8 hr) treatment in METTL3-OV cells decreases METTL3-enhanced DNA repair activity. The Quantification of relative WB band are represented as the mean ± SD of three biological repeats. (G) Immunofluorescence analysis of co-staining of γ-H2AX and cyclin A in METTL3-OV cells ±RAD51 shRNA or gefitinib (10 nM) during ADR treatment (0.5 μM for 1 hr and recovery for 8 hr without ADR). The quantitative assay is on the right. n=3 per group. (H) Immunofluorescence analysis of cyclin A and RAD51 foci in cells treated the same as in (G). The quantification of average foci numbers per cells were showed in right panel, 50 cells were calculated in each group. ** p<0.01; *** p<0.001 (Student’s t-test).
-
Figure 5—source data 1
Source data for Figure 5A.
- https://cdn.elifesciences.org/articles/75231/elife-75231-fig5-data1-v2.zip
-
Figure 5—source data 2
Source data for Figure 5B.
- https://cdn.elifesciences.org/articles/75231/elife-75231-fig5-data2-v2.zip
-
Figure 5—source data 3
Source data for Figure 5D.
- https://cdn.elifesciences.org/articles/75231/elife-75231-fig5-data3-v2.zip
-
Figure 5—source data 4
Source data for Figure 5E.
- https://cdn.elifesciences.org/articles/75231/elife-75231-fig5-data4-v2.zip
-
Figure 5—source data 5
Source data for Figure 5F.
- https://cdn.elifesciences.org/articles/75231/elife-75231-fig5-data5-v2.zip
Figure 5—figure supplement 1
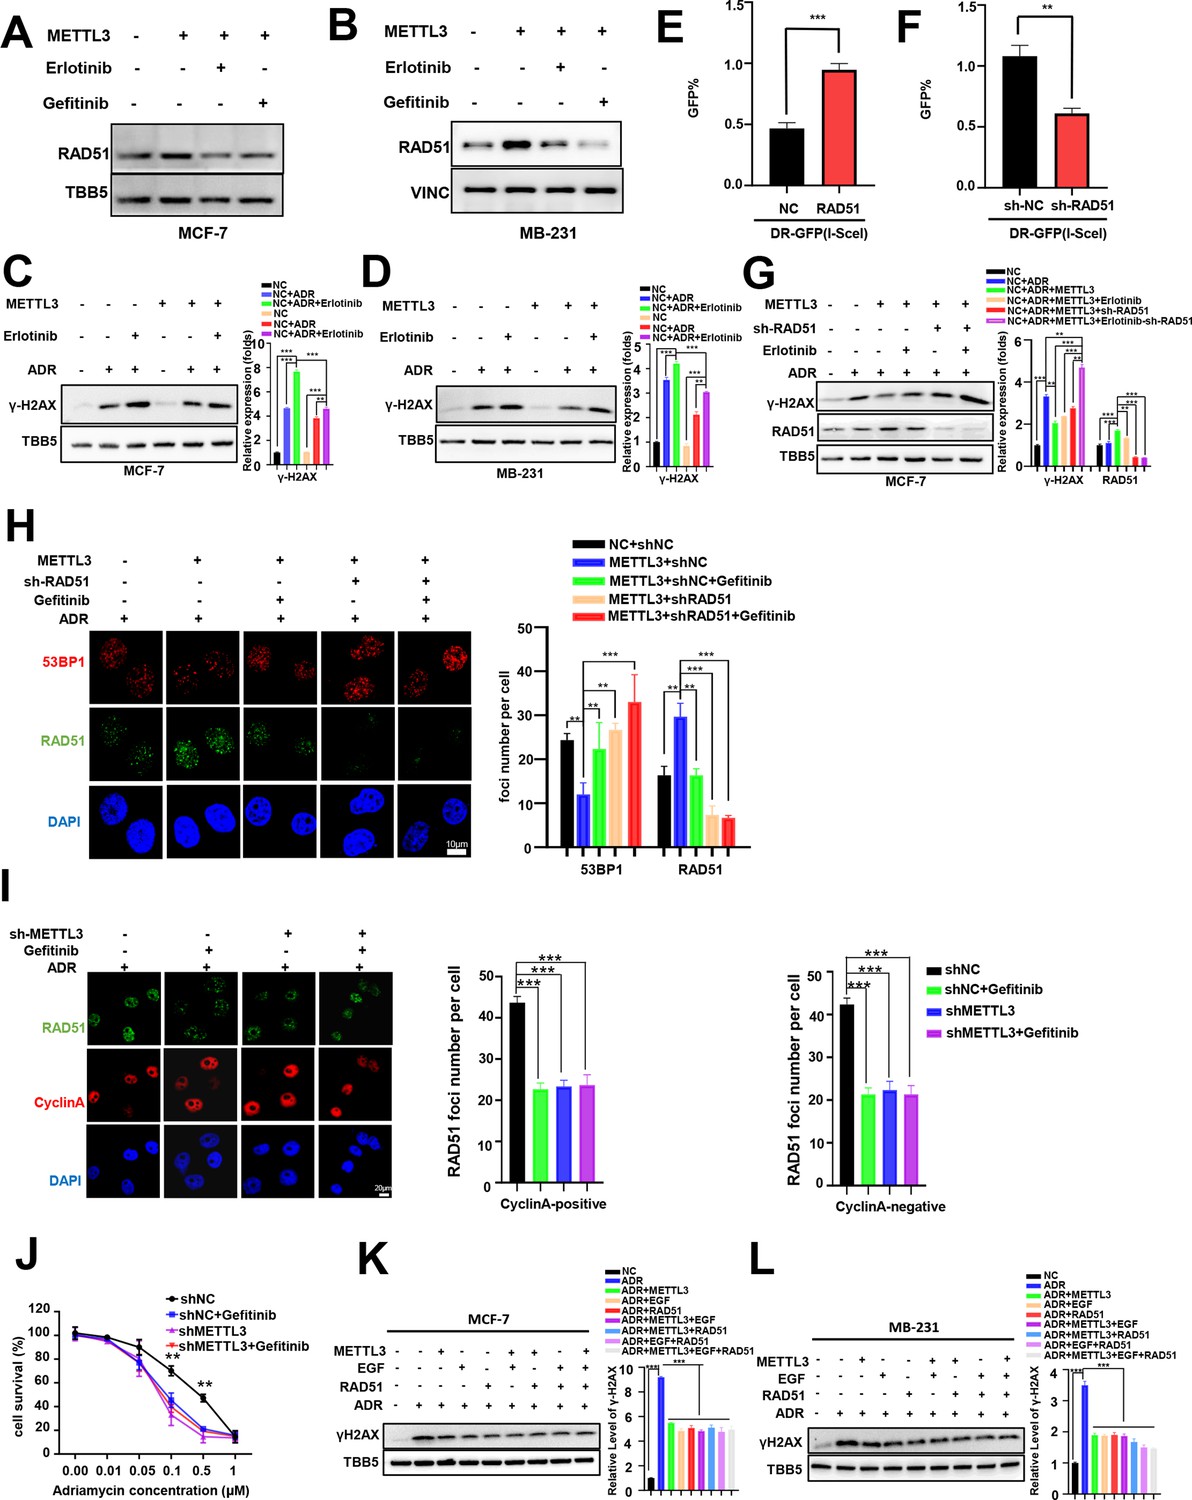
METTL3-mediated DNA repair is EGF/ Rad51 dependent.
(A, B) Western blotting (WB) showed that overexpression of METTL3 upregulated RAD51 expression, which were abolished by EGFR inhibitors erlotinib (A) and gefitinib (B). (C–D) Erlotinib repressed DNA repair activities that were upregulated by overexpression of METTL3 in MCF-7 (C) and MB231 (D) cells. (E, F) Overexpression of RAD51 (E) or knockdown of RAD51 (F) enhanced or impaired GFP+ frequencies in GFP-base HR reporter system, respectively. (G) Overexpression of METTL3 promoted DNA repair efficacy (shown by γ-H2AX down-regulation) that were reversed by treatment with shRAD51 or Erlotinib. (H) Immunofluorescence analysis of 53BP1 foci was performed in detecting MCF-7 cells, which were treated as showed in the figures. Cells were stained with an anti-RAD51 and anti-53BP1 antibody, and nucleus was stained using DAPI and then visualized by a fluorescence microscope. (I) Immunofluorescence analysis showed that RAD51 foci decreased to similar levels in cells with single inhibition of METTL3 by shRNA or single inhibition of EGF/EGFR by gefitinib or double treatments with shMETTL3 and gefitinib. The quantification of average foci numbers per cells were showed in right panel, 50 cells were calculated in each group. (J) Cells survival assay in the condition as same as in (I). (K, L) WB showed that overexpression of METTL3/EGF/RAD51 all could alleviate DNA damage (shown by decreased γ-H2AX) in both MCF-7 (K) and MB-231 cells (L) with similar manner. The Quantification of relative WB band are represented as the mean ± SD of three biological repeats. p<0.01; *** p<0.001 (Student’s t-test).
-
Figure 5—figure supplement 1—source data 1
Source data for Figure 5—figure supplement 1A.
- https://cdn.elifesciences.org/articles/75231/elife-75231-fig5-figsupp1-data1-v2.zip
-
Figure 5—figure supplement 1—source data 2
Source data for Figure 5—figure supplement 1B.
- https://cdn.elifesciences.org/articles/75231/elife-75231-fig5-figsupp1-data2-v2.zip
-
Figure 5—figure supplement 1—source data 3
Source data for Figure 5—figure supplement 1C.
- https://cdn.elifesciences.org/articles/75231/elife-75231-fig5-figsupp1-data3-v2.zip
-
Figure 5—figure supplement 1—source data 4
Source data for Figure 2—figure supplement 1D.
- https://cdn.elifesciences.org/articles/75231/elife-75231-fig5-figsupp1-data4-v2.zip
-
Figure 5—figure supplement 1—source data 5
Source data for Figure 5—figure supplement 1G.
- https://cdn.elifesciences.org/articles/75231/elife-75231-fig5-figsupp1-data5-v2.zip
-
Figure 5—figure supplement 1—source data 6
Source data for Figure 5—figure supplement 1K.
- https://cdn.elifesciences.org/articles/75231/elife-75231-fig5-figsupp1-data6-v2.zip
-
Figure 5—figure supplement 1—source data 7
Source data for Figure 2—figure supplement 1L.
- https://cdn.elifesciences.org/articles/75231/elife-75231-fig5-figsupp1-data7-v2.zip
Figure 6 with 1 supplement
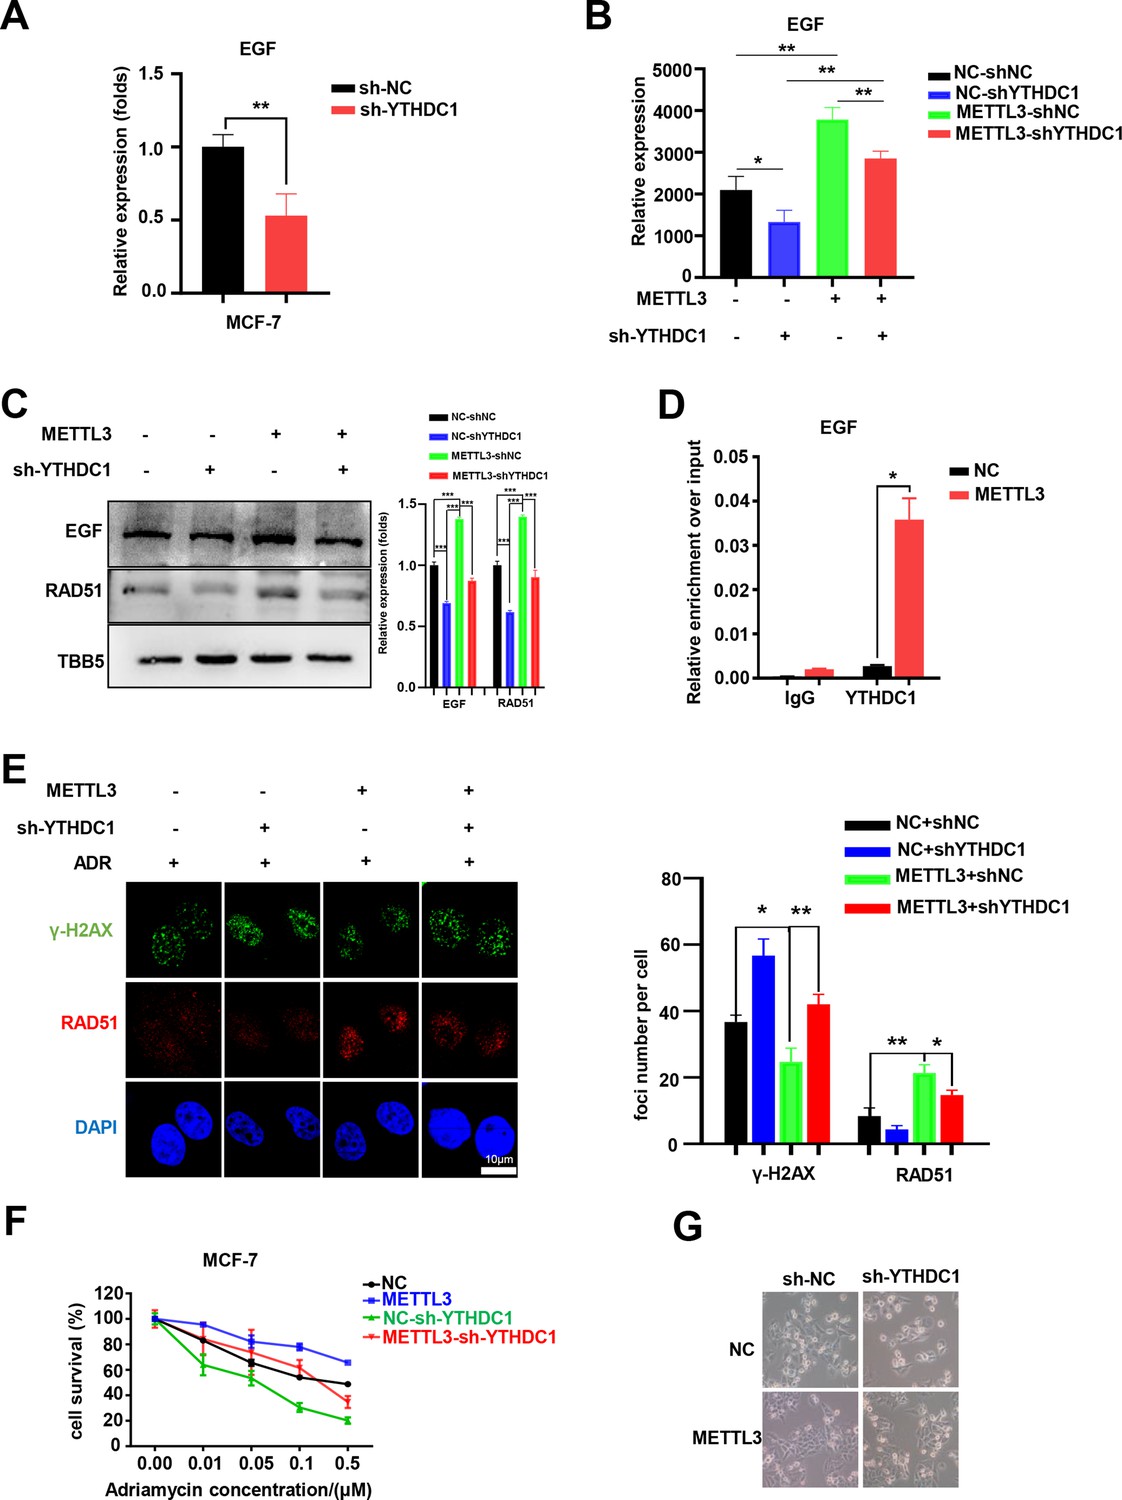
YTHDC1 is the ‘reader’ of the METTL3/m6A-regulated EGF/RAD51 axis.
(A) The expression of EGF in YTHDC1-silenced MCF-7 cells was detected by qRT-PCR. Data are expressed as the mean ± standard deviation (SD), n=3 per group. (B) The mRNA levels of EGF in control or METTL3-OV cells with or without knocking down YTHDC1. Data are expressed as the mean ± standard deviation (SD), n=3 per group. (C) WB assay determining the effect of YTHDC1 knockdown on EGF and RAD51 expression in control and METTL3-OV MCF-7 cells. The Quantification of relative WB band are represented as the mean ± SD of three biological repeats. (D) RIP-qPCR assay showing the enrichment of the EGF transcript in METTL3-OV cells. Data are expressed as the mean ± SD, n=3 per group. (E) Immunofluorescence analysis of γ-H2AX and RAD51 foci in METTL3-OV cells with knocked-down YTHDC1. The quantification of average foci numbers per cell are shown in the right panel, 50 cells were calculated in each group. (F) MTT assays were performed to detect the effect of YTHDC1 knockdown on ADR sensitivity in control and METTL3-OV MCF-7 cells. Data are expressed as the mean ± standard deviation (SD), n=3 per group. (G) Morphological analysis of control or METTL3-OV MCF-7 cells with or without YTHDC1 knockdown. Cells were treated with 0.5 μM ADR for 24 hr. * p<0.05; ** p<0.01; *** p<0.001 (Student’s t-test).
-
Figure 6—source data 1
Source data for Figure 6C.
- https://cdn.elifesciences.org/articles/75231/elife-75231-fig6-data1-v2.zip
Figure 6—figure supplement 1
YTHDC1 was the reader of METTL3/m6A-regulated EGF.
(A) mRNA levels of different readers in m6A readers -silencing MCF-7 cells was detected using RT-qPCR. (B, C) EGF and RAD51 mRNA levels in m6A readers -silencing MCF-7 cells using RT-qPCR. Data are expressed as the mean ± standard deviation (SD), n=3 per group. (D) RIP-qPCR assay showing the enrichment of the EGF transcript in METTL3-OV cells. Data are expressed as the mean ± standard deviation (SD), n=3 per group. (E) Cell survival assay in the cells in the condition of shMETTL3, shYTHDC1 or double KD of METTL3, and YTHDC1. (F–H) WB analysis showed that overexpression of METTL3 promoted EGFR expression in MCF-10A, MCF-7, and MB-231 cells. * p<0.05; ** p<0.01; *** p<0.001 (Student’s t-test).
-
Figure 6—figure supplement 1—source data 1
Source data for Figure 6—figure supplement 1F.
- https://cdn.elifesciences.org/articles/75231/elife-75231-fig6-figsupp1-data1-v2.zip
-
Figure 6—figure supplement 1—source data 2
Source data for Figure 6—figure supplement 1G.
- https://cdn.elifesciences.org/articles/75231/elife-75231-fig6-figsupp1-data2-v2.zip
-
Figure 6—figure supplement 1—source data 3
Source data for Figure 6—figure supplement 1H.
- https://cdn.elifesciences.org/articles/75231/elife-75231-fig6-figsupp1-data3-v2.zip
Figure 7
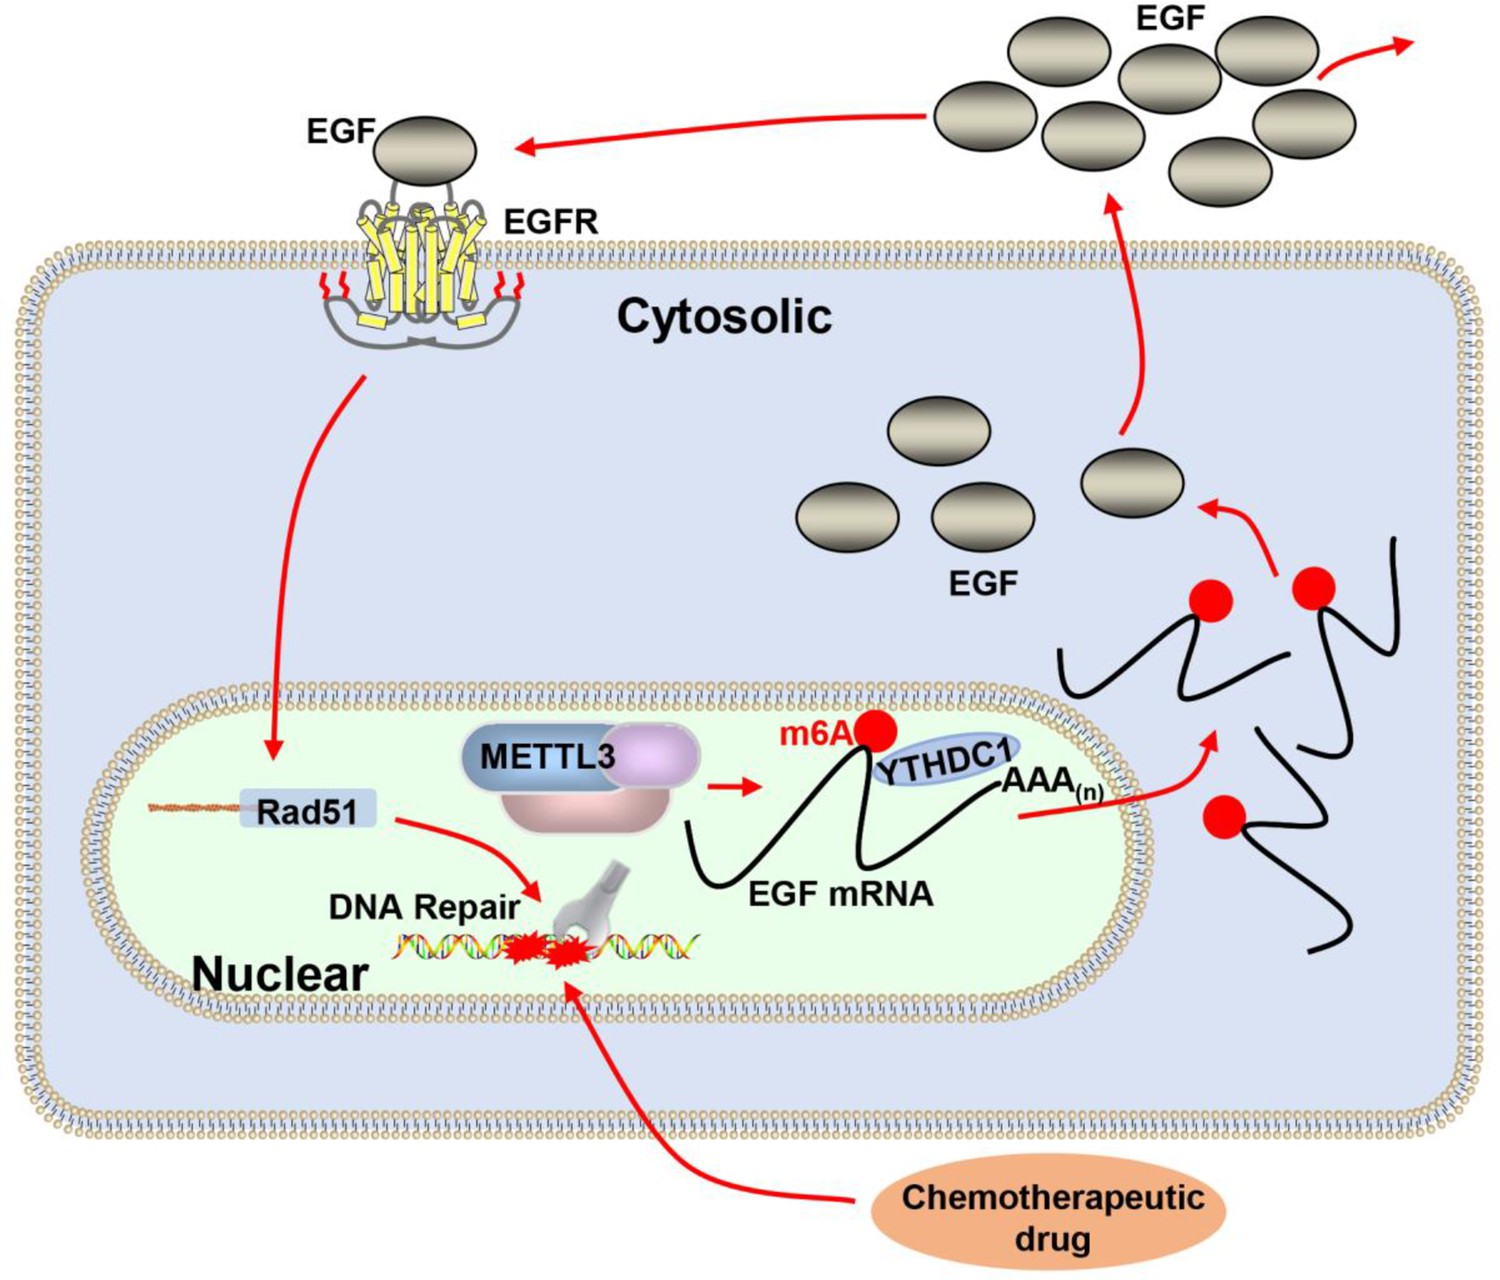
Proposed schematic diagram of the proposed mechanism elucidated in this study.
Methyltransferase-like 3 (METTL3) augments EGF transcript m6A modification, which was recognized by the reader YTHDC1, resulting increase of EGF expression. Elevated EGF promoted RAD51 expression, enhanced homologous recombination repair (HR) efficacy, and modified chemotherapeutic response of cancer cells.
Tables
Table 1
52 genes were showed to be modified by m6A in the exonic in this study.
| KCNG3 | DLG2 | SLC12A8 | PHOSPHO2 | AQP1 | ABCC6 |
|---|---|---|---|---|---|
| RGS4 | C11orf91 | GATA3 | RORC | SIRPA | COL3A1 |
| ASB9 | HIST1H3H | IFI16 | KRT17 | BMF | |
| ST8SIA5 | FBXO27 | RASL11A | LAMC2 | BIK | |
| METTL3 | SLIT2 | DTX4 | TMPRSS9 | SHH | |
| ABCC9 | AOC3 | ANK3 | PLCH2 | NOMO3 | |
| APOE | COL27A1 | KIF27 | BAIAP3 | NPIPA5 | |
| EGF | OCLN | ENO2 | FMNL3 | MST1 | |
| IKZF2 | PI3 | PCSK1 | LRP4 | PMCH | |
| DHRSX | VEGFC | TNS4 | PDK4 | CSF1R |
Table 2
Eight genes were showed to be modified by m6A and be involved in DNA repair in this study.
| EGF | METTL3 | DLG2 | VEGFC |
|---|---|---|---|
| GATA3 | KRT17 | IFI16 | MST1 |
Key resources table
| Reagent type (species) or resource | Designation | Source or reference | Identifiers | Additional information |
|---|---|---|---|---|
| Genetic reagent (Mus. musculus) | BALB/c-Nude (BALB/cNj-Foxn1nu/Gpt) | GemPharmatech Co., Ltd., Nanjing, China | Strain NO.D000521 | |
| Cell line (Homo sapiens) | MCF-7 | National Collection of Authenticated Cell Cultures, Chinese Academy of Science | CSTR:19375.09. 3101HUMSCSP531 | |
| Cell line (Homo sapiens) | MDA-MB-231 | National Collection of Authenticated Cell Cultures, Chinese Academy of Science | CSTR:19375.09. 3101HUMSCSP5043 | |
| Antibody | anti-METTL3 (Mouse monoclonal) | ABclonal | Cat# A19079 RRID: Addgene_101892 | WB (1:1000) |
| Antibody | anti-γ-H2AX (Mouse monoclonal) | Cell Signaling Technology | Cat# 80,312 S | WB (1:1000) IF(1:300) |
| Antibody | anti-BAX (Rabbit polyclonal) | ABclonal | Cat# A11550 RRID: AB_516294 | WB (1:1000) |
| Antibody | anti-caspase3 (Rabbit polyclonal) | Proteintech | Cat# 19677-I-AP RRID: AB_590739 | WB (1:1000) |
| Antibody | anti-EGF (Rabbit polyclonal) | Proteintech | Cat# 27141–1-AP RRID: AB_1066833 | WB (1:1000) |
| Antibody | anti-RAD51 (Rabbit polyclonal) | Proteintech | Cat# 14961–1-AP RRID: AB_10706869 | WB (1:1000) IF (1:300) |
| Antibody | anti-FLAG (Mouse monoclonal) | bioworld | Cat# AP0007MH RRID:AB_1537400 | WB (1:1000) |
| Antibody | anti-EGFR (Rabbit polyclonal) | ABclonal | Cat# A11577 RRID: AB_442085 | WB (1:1000) |
| Antibody | anti-TBB5 (Mouse monoclonal) | Abgent | Cat# AM1031A RRID: AB_1554765 | WB (1:1000) |
| Antibody | anti-Cyclin A (Mouse monoclonal) | proteintech | Cat# 66391–1-Ig | IF(1:300) |
| Sequence-based reagent | METTL3_F | This paper | qPCR primers | AAGCTGCACTTCAGACGAAT |
| Sequence-based reagent | METTL3_R | This paper | qPCR primers | GGAATCACCTCCGACACTC |
| Sequence-based reagent | EGF_F | This paper | qPCR primers | TGGATGTGCTTGATAAGCGG |
| Sequence-based reagent | EGF_R | This paper | qPCR primers | ACCATGTCCTTTCCAGTGTGT |
| Sequence-based reagent | RAD51_F | This paper | qPCR primers | CAACCCATTTCACGGTTAGAGC |
| Sequence-based reagent | RAD51_R | This paper | qPCR primers | TTCTTTGGCGCATAGGCAACA |
| Commercial assay or kit | Human EGF ELISA Kit | SenBeiJia Biological Technology Co. | Cat# SBJ-H0212 | |
| Chemical compound, drug | Doxorubicin (Adriamycin) HCl | Selleck | Cat# S1208 CAS No. 25316-40-9 | |
| Chemical compound, drug | Paclitaxel | Selleck | Cat# S1150 CAS No. 33069-62-4 | |
| Chemical compound, drug | Cisplatin | Selleck | Cat# S1166 CAS No. 15663-27-1 | |
| Chemical compound, drug | 5-Fluorouracil, 5-FU | Selleck | Cat# S1209 CAS No. 51-21-8 | |
| Chemical compound, drug | Recombinant Human EGF | Beyotime | Cat# P5552 | |
| Chemical compound, drug | Erlotinib | Beyotime | Cat# SC0168 | |
| Chemical compound, drug | Gefitinib | Beyotime | Cat# SC0186 | |
| Software, algorithm | GraphPad Prism software | GraphPad Prism (https://graphpad.com) | RRID: SCR_015807 | Version 8.0.0 |
Table 3
Sequences of the shRNA used in this study.
| Gene name | shRNA sequences |
|---|---|
| sh-METTL3 | 5’-CAGGAGATCCTAGAGCTATTA-3’ |
| sh-RAD51 | 5’-GACTGCCAGGATAAAGCTT-3’ |
| sh-YTHDC1 | 5’-CCAGAGAGTGAACAAGATAAA-3’ |
| sh-YTHDF1 | 5’-GGGGGTTGAGTGTTGCATCTT-3’ |
| sh-YTHDF2 | 5’-AAGGCTAAGCAGGTGTTGAAA-3’ |
| sh-YTHDF3 | 5’-TAAGTCAAAGAAGACGTATTACTC-3’ |
| sh-YTHDC2 | 5’-GCCCACAGATTGGCTTATTTA-3’ |
| sh-IGF2BP1 | 5’-TGCTATTCTTCCTAATCTATATC-3’ |
| sh-IGF2BP2 | 5’-GTGAAGCTGGAAGCGCATATCTC-3’ |
| sh-IGF2BP3 | 5’-CGGTGAATGAACTTCAGAATTCTC-3’ |
Additional files
Download links
A two-part list of links to download the article, or parts of the article, in various formats.
Downloads (link to download the article as PDF)
Open citations (links to open the citations from this article in various online reference manager services)
Cite this article (links to download the citations from this article in formats compatible with various reference manager tools)
METTL3 promotes homologous recombination repair and modulates chemotherapeutic response in breast cancer by regulating the EGF/RAD51 axis
eLife 11:e75231.
https://doi.org/10.7554/eLife.75231


