MDGAs are fast-diffusing molecules that delay excitatory synapse development by altering neuroligin behavior
- University of Bordeaux, CNRS UMR 5297, Interdisciplinary Institute for Neuroscience, France
- VIB Center for Brain & Disease Research and KU Leuven, Department of Neurosciences, Leuven Brain Institute, Belgium
- University of Bordeaux, CNRS UAR 3420, INSERM, Bordeaux Imaging Center, France
Figures
Figure 1 with 3 supplements
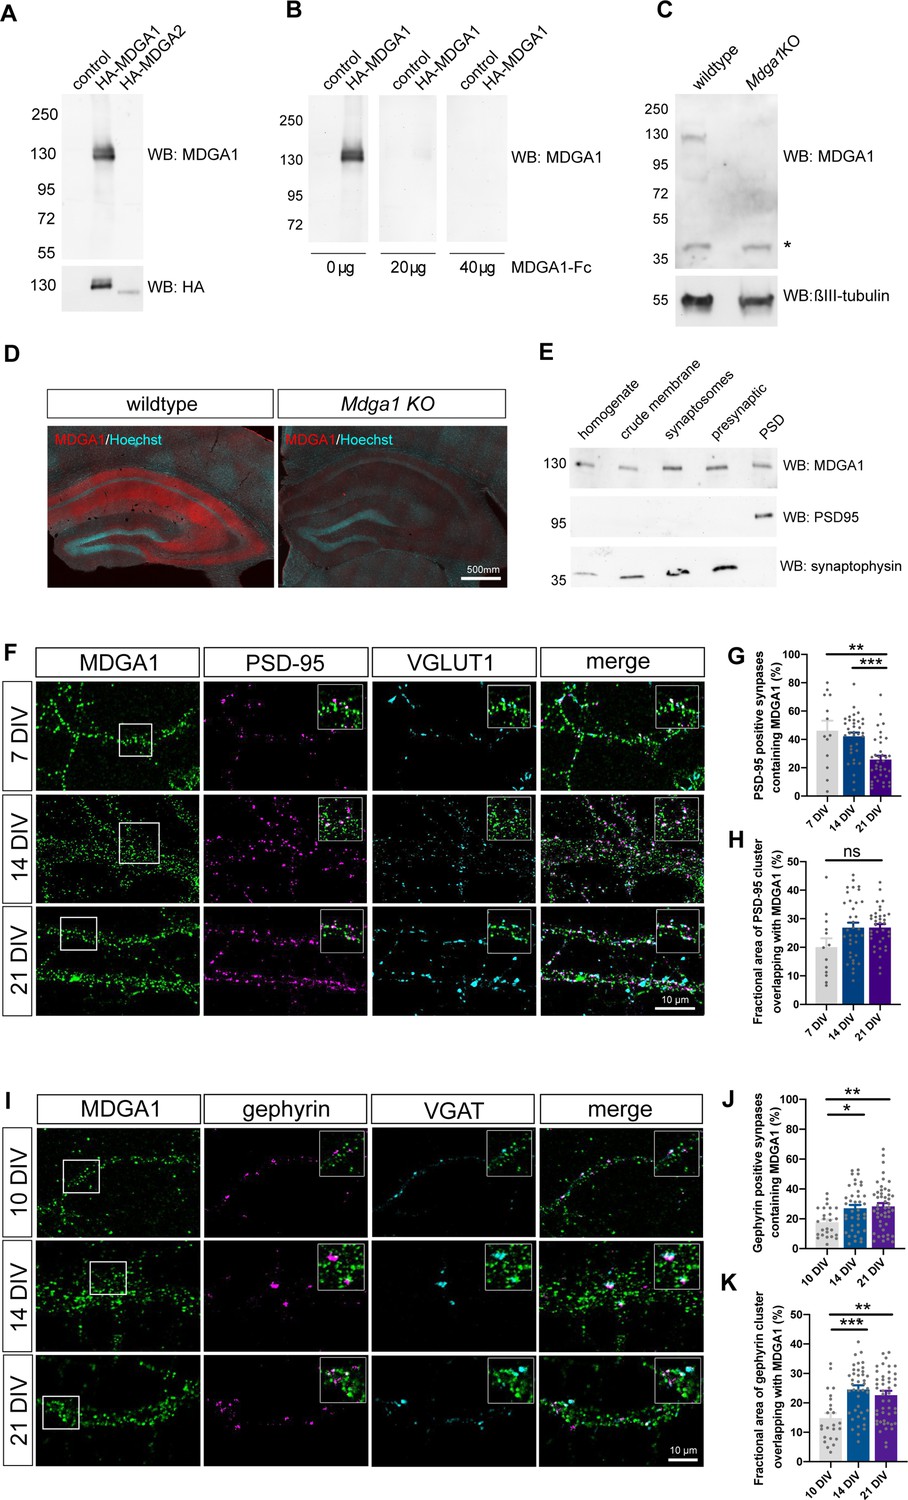
Validation of MDGA1 antibody and distribution of endogenous MDGA1 in brain slices and dissociated hippocampal cultures.
(A) MDGA1 antiserum recognizes recombinant HA-MDGA1, but not HA-MDGA2, transiently expressed in HEK-293T cells (top membrane). Mock-transfected HEK-293T cells were used as controls. Anti-HA antibody labels both HA-MDGA1 and HA-MDGA2 (bottom membrane). Molecular weight markers in kDa indicated on the left. (B) Competition with different amounts (0, 20, and 40 µg) of excess recombinant MDGA1-Fc blocks detection of HA-MDGA1 by MDGA1 antiserum. (C) MDGA1 antiserum detects a single 130 kDa band in brain homogenate from wild-type mice, which was absent in brain homogenate from Mdga1 KO mice (top membrane). Asterisk indicates non-specific band. ßIII-tubulin was used as loading control (bottom membrane). (D) Immunohistochemistry with MDGA1 antiserum (red) reveals strong immunoreactivity in CA3 and CA1 regions of the hippocampus in wild-type adult mice, which was absent in Mdga1 KO mice. Nuclear marker Hoechst (cyan) was used to visualize tissue architecture. (E) Rat brain subcellular fractionation probed for MDGA1, postsynaptic excitatory marker PSD-95, and presynaptic marker synaptophysin. PSD: postsynaptic density. For original immunoblot images presented in panels (A,B,C,E), refer to Figure 1—source data 1–7. (F, I) Representative confocal images of dendritic segments from dissociated hippocampal neurons at different times in culture (7, 14, and 21 DIV) that were immunolabeled with MDGA1 antibody, and counterstained for either PSD-95 and VGLUT1 (F), or gephyrin and VGAT (I). (G,H,J,K) Quantification of the co-localization level and area overlap between endogenous MDGA1 and the excitatory post-synaptic marker PSD-95 (G, H), or the inhibitory post-synaptic marker gephyrin (J, K) as a function of time in culture. Data represent mean ± SEM of n > 13 neurons for all conditions and from three independent experiments, and were compared by a Kruskal–Wallis test followed by Dunn’s multiple comparison test (*p < 0.05; **p < 0.01; ***p < 0.001). For the statistics of the data presented in panels (G,H,J,K), see Supplementary file 1 and Figure 1—source data 8.
-
Figure 1—source data 1
Source image of anti-MDGA1 and anti-HA immunoblots related to Figure 1A.
- https://cdn.elifesciences.org/articles/75233/elife-75233-fig1-data1-v1.zip
-
Figure 1—source data 2
Source image of anti-MDGA1 immunoblot related to Figure 1B.
- https://cdn.elifesciences.org/articles/75233/elife-75233-fig1-data2-v1.zip
-
Figure 1—source data 3
Source image of anti-MDGA1 immunoblot related to Figure 1C.
- https://cdn.elifesciences.org/articles/75233/elife-75233-fig1-data3-v1.zip
-
Figure 1—source data 4
Source image of anti-βIII tubulin immunoblot related to Figure 1C.
- https://cdn.elifesciences.org/articles/75233/elife-75233-fig1-data4-v1.zip
-
Figure 1—source data 5
Source image of anti-MDGA1 immunoblot related to Figure 1E.
- https://cdn.elifesciences.org/articles/75233/elife-75233-fig1-data5-v1.zip
-
Figure 1—source data 6
Source image of anti-synaptophysin immunoblot related to Figure 1E.
- https://cdn.elifesciences.org/articles/75233/elife-75233-fig1-data6-v1.zip
-
Figure 1—source data 7
PDF file showing all the immunoblots in Figure 1 where the relevant bands chosen for illustration are highlighted by red rectangles.
- https://cdn.elifesciences.org/articles/75233/elife-75233-fig1-data7-v1.pdf
-
Figure 1—source data 8
Excel file containing all raw data and statistical tests used in Figure 1.
Each graph (G,H,J,K) is shown in a separate sheet within the file.
- https://cdn.elifesciences.org/articles/75233/elife-75233-fig1-data8-v1.xlsx
Figure 1—figure supplement 1
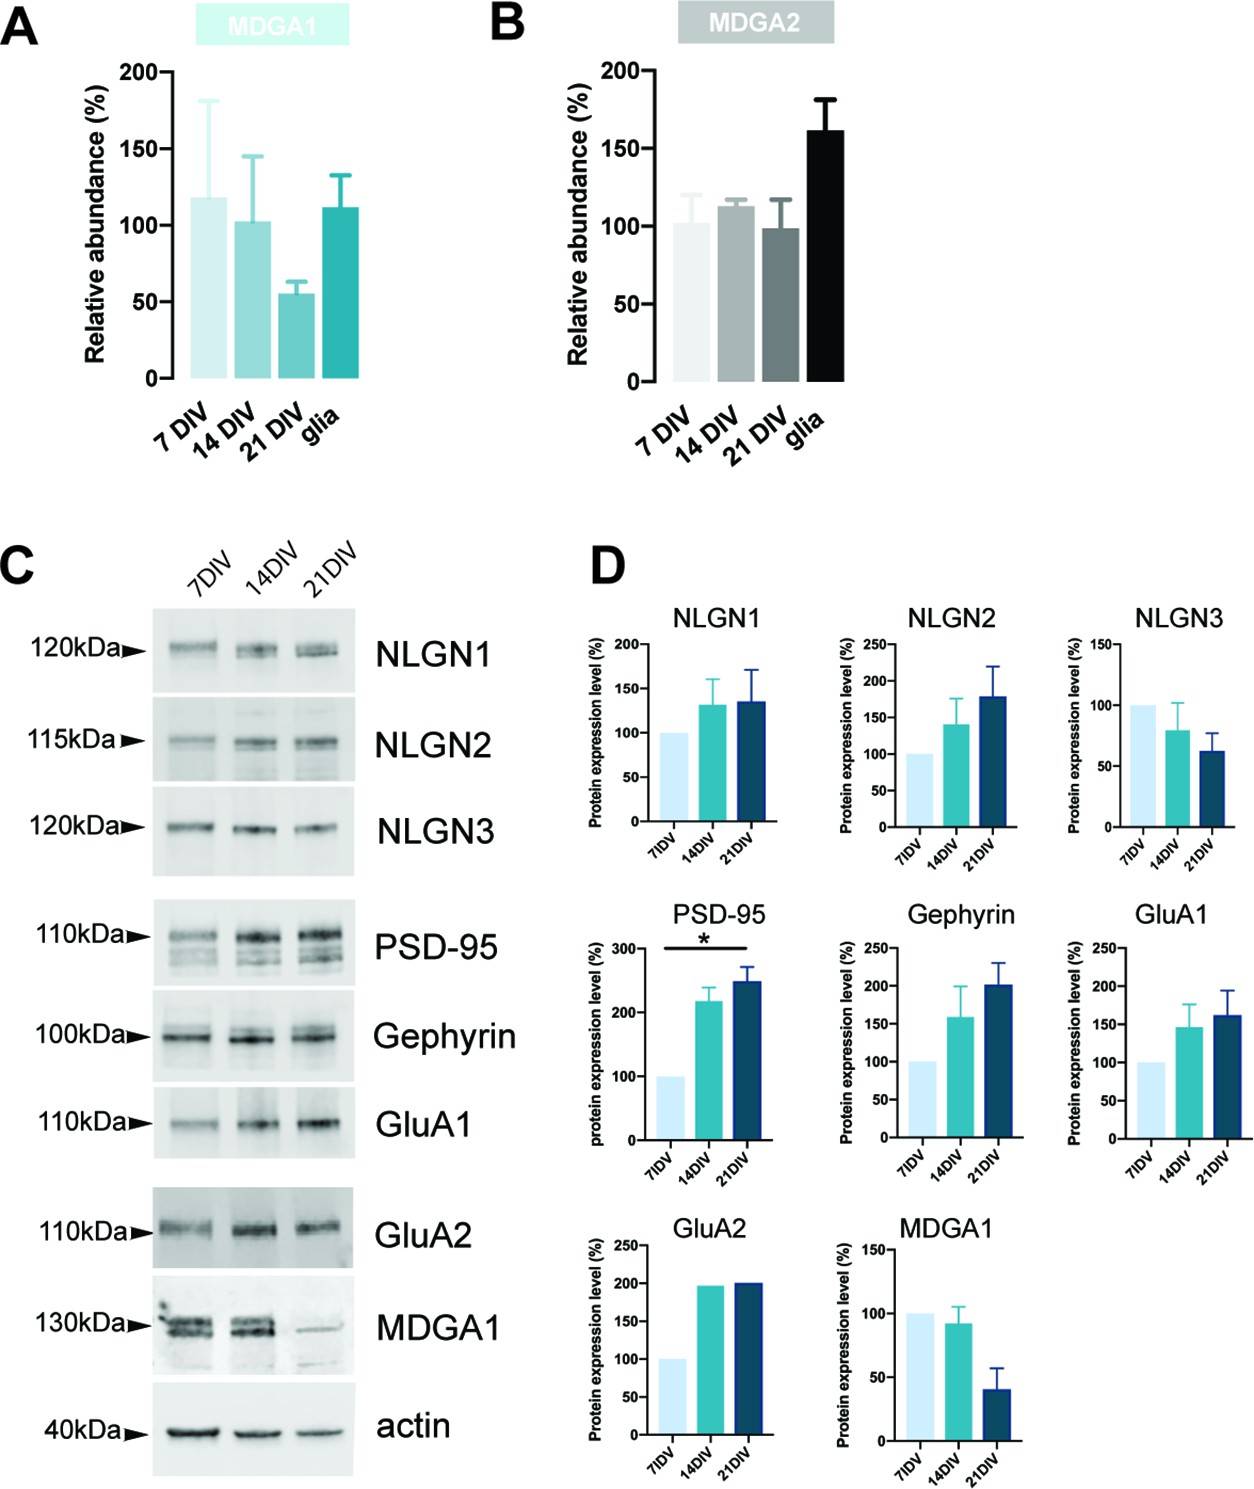
RT-qPCR evaluation of MDGA1 and MDGA2 mRNA expression levels and western blot evaluation of protein expression during in vitro differentiation of hippocampal neurons and astrocytes.
Dissociated hippocampal neurons were cultured for 7, 14, and 21 DIV and astrocytes were cultured for 28 DIV. (A, B) Normalized mRNA levels of MDGA1 and MDGA2, respectively, at different developmental stages in neurons and astrocytes, as determined by RT-qPCR. The Ct value for each gene was normalized against that of SDHA and U6 housekeeping genes, and expressed relatively to the value of neurons at 7 DIV. (C) Western-blots performed on protein extracts from hippocampal cultures at different developmental stages, for various synaptic proteins. For original immunoblot images presented in panel (C), refer to Figure 1—figure supplement 1—source data 1–10. (D) Quantitation of expression levels for the proteins detected in (C). For each protein, values are expressed in reference to the amount of protein detected at 7 DIV. All protein contents were normalized to actin. Data represent mean ± SEM from three independent experiments, and were compared by a Kruskal-Wallis test followed by Dunn´s multiple comparison test (*p < 0.05). For the statistics of the data presented in panels (A,B,D), see Supplementary file 1 and Figure 1—figure supplement 1—source data 11.
-
Figure 1—figure supplement 1—source data 1
Source image of anti-NLGN1 immunoblot related to Figure 1—figure supplement 1C.
- https://cdn.elifesciences.org/articles/75233/elife-75233-fig1-figsupp1-data1-v1.zip
-
Figure 1—figure supplement 1—source data 2
Source image of anti-NLGN2 immunoblot related to Figure 1—figure supplement 1C.
- https://cdn.elifesciences.org/articles/75233/elife-75233-fig1-figsupp1-data2-v1.zip
-
Figure 1—figure supplement 1—source data 3
Source image of anti-NLGN3 immunoblot related to Figure 1—figure supplement 1C.
- https://cdn.elifesciences.org/articles/75233/elife-75233-fig1-figsupp1-data3-v1.zip
-
Figure 1—figure supplement 1—source data 4
Source image of anti-PSD-95 immunoblot related to Figure 1—figure supplement 1C.
- https://cdn.elifesciences.org/articles/75233/elife-75233-fig1-figsupp1-data4-v1.zip
-
Figure 1—figure supplement 1—source data 5
Source image of anti-gephyrin immunoblot related to Figure 1—figure supplement 1C.
- https://cdn.elifesciences.org/articles/75233/elife-75233-fig1-figsupp1-data5-v1.zip
-
Figure 1—figure supplement 1—source data 6
Source image of anti-GluA1 immunoblot related to Figure 1—figure supplement 1C.
- https://cdn.elifesciences.org/articles/75233/elife-75233-fig1-figsupp1-data6-v1.zip
-
Figure 1—figure supplement 1—source data 7
Source image of anti-GluA2 immunoblot related to Figure 1—figure supplement 1C.
- https://cdn.elifesciences.org/articles/75233/elife-75233-fig1-figsupp1-data7-v1.zip
-
Figure 1—figure supplement 1—source data 8
Source image of anti-MDGA1 immunoblot related to Figure 1—figure supplement 1C.
- https://cdn.elifesciences.org/articles/75233/elife-75233-fig1-figsupp1-data8-v1.zip
-
Figure 1—figure supplement 1—source data 9
Source image of anti-actin immunoblot related to Figure 1—figure supplement 1C.
- https://cdn.elifesciences.org/articles/75233/elife-75233-fig1-figsupp1-data9-v1.zip
-
Figure 1—figure supplement 1—source data 10
PDF file showing all the immunoblots in Figure 1—figure supplement 1C where the relevant bands chosen for illustration are highlighted by red rectangles.
- https://cdn.elifesciences.org/articles/75233/elife-75233-fig1-figsupp1-data10-v1.pdf
-
Figure 1—figure supplement 1—source data 11
Excel file containing all raw data and statistical tests used in Figure 1—figure supplement 1.
Each graph (A,B,D) is shown in a separate sheet within the file.
- https://cdn.elifesciences.org/articles/75233/elife-75233-fig1-figsupp1-data11-v1.xlsx
Figure 1—figure supplement 2
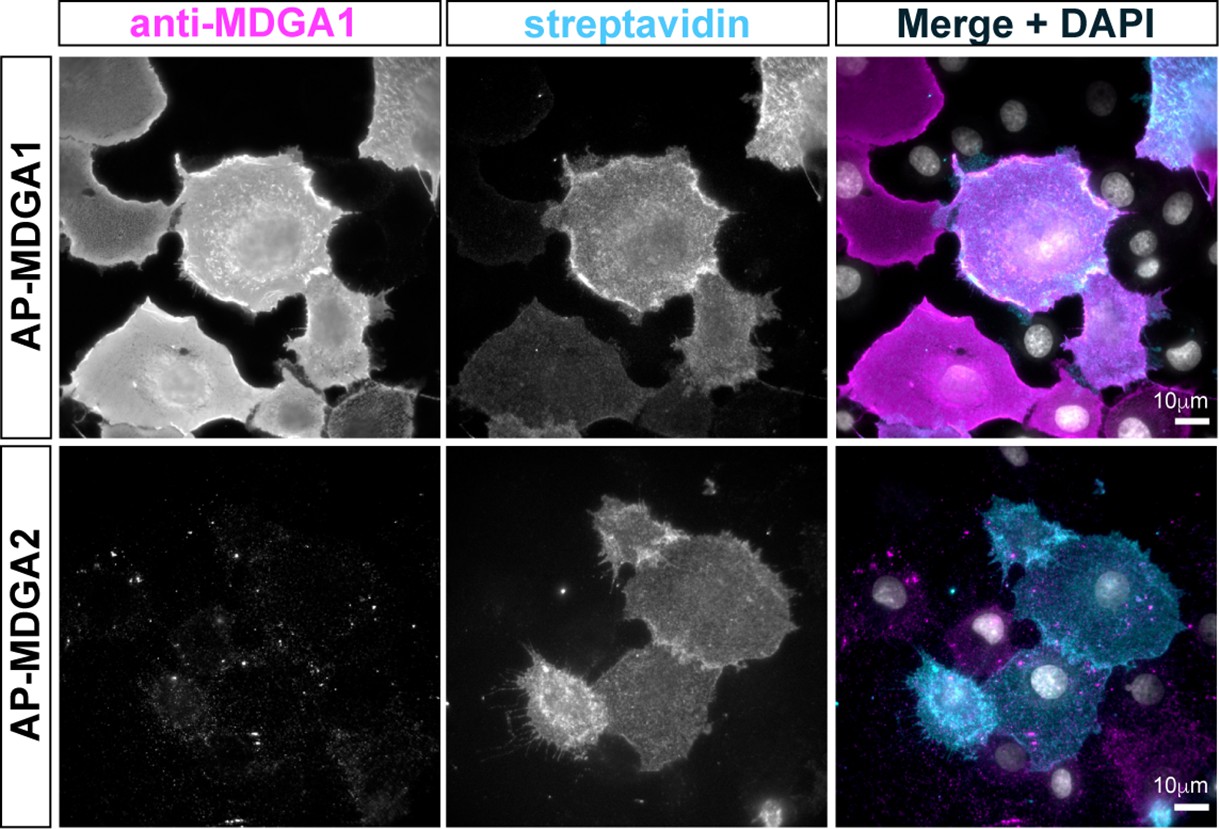
Surface labeling of COS-7 cells expressing recombinant MDGA1 or MDGA2 with the MDGA1 antiserum.
COS-7 cells were co-electroporated with AP-MDGA1 or AP-MDGA2 and BirAER. Cells were live labeled with anti-MDGA1 antibody and Alexa 647-conjugated streptavidin. Following fixation, secondary anti-rabbit antibodies conjugated to Alexa546 were applied and images were acquired in the Alexa546 and Alexa 647 channels. Merge images show anti-MDGA1 labeling in magenta, streptavidin in cyan, and DAPI staining in white. Note that the MDGA1 antibody recognizes only AP-MDGA1, and not AP-MDGA2.
Figure 1—figure supplement 3
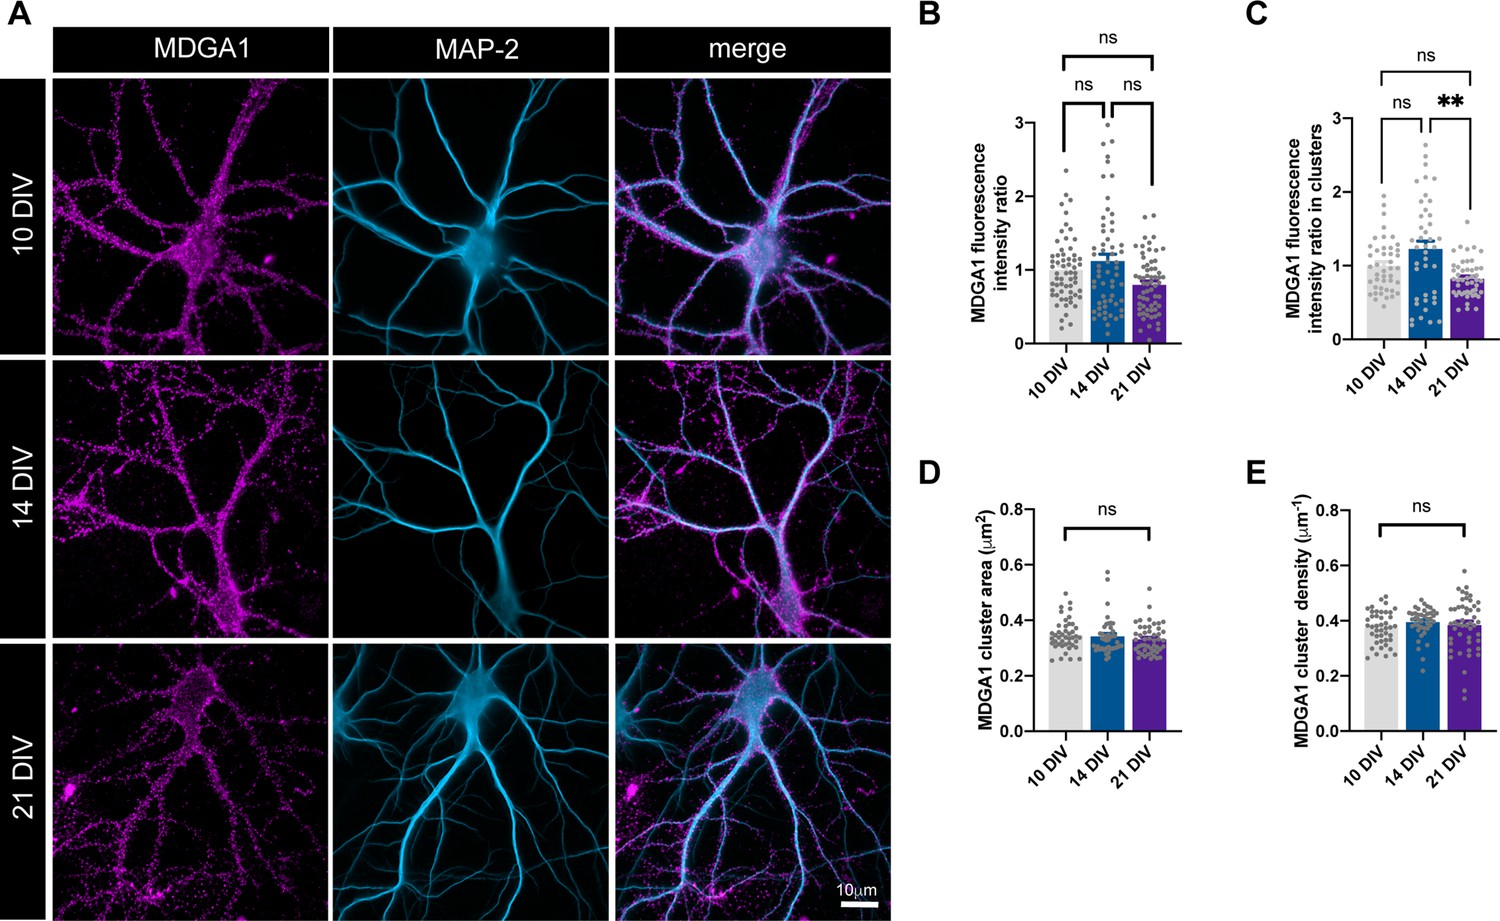
Surface expression of endogenous MDGA1.
(A) Epifluorescence images of representative hippocampal neurons cultured for 10, 14, and 21 DIV, immunolabeled with MDGA1 antibody (magenta), and counterstained with MAP-2 (blue). (B, C) Bar plots showing the total MDGA1 fluorescence intensity, or the fluorescence intensity at the clusters, both parameters being expressed in relation to the respective fluorescence signal at DIV 10. (D, E) MDGA1 cluster area and density, respectively, at different time points in culture. Data represent mean ± SEM of n > 58 neurons for each condition and from two independent experiments. Values were compared by a Kruskal-Wallis test followed by Dunn’s multiple comparison test (ns: not significant; **p < 0.01). For the statistics of the data presented in panels (B,C,D,E), see Supplementary file 1 and Figure 1—figure supplement 3—source data 1.
-
Figure 1—figure supplement 3—source data 1
Excel file containing all raw data and statistical tests used in Figure 1—figure supplement 3.
Each graph (B,C,D,E) is shown in a separate sheet within the file.
- https://cdn.elifesciences.org/articles/75233/elife-75233-fig1-figsupp3-data1-v1.xlsx
Figure 2 with 3 supplements
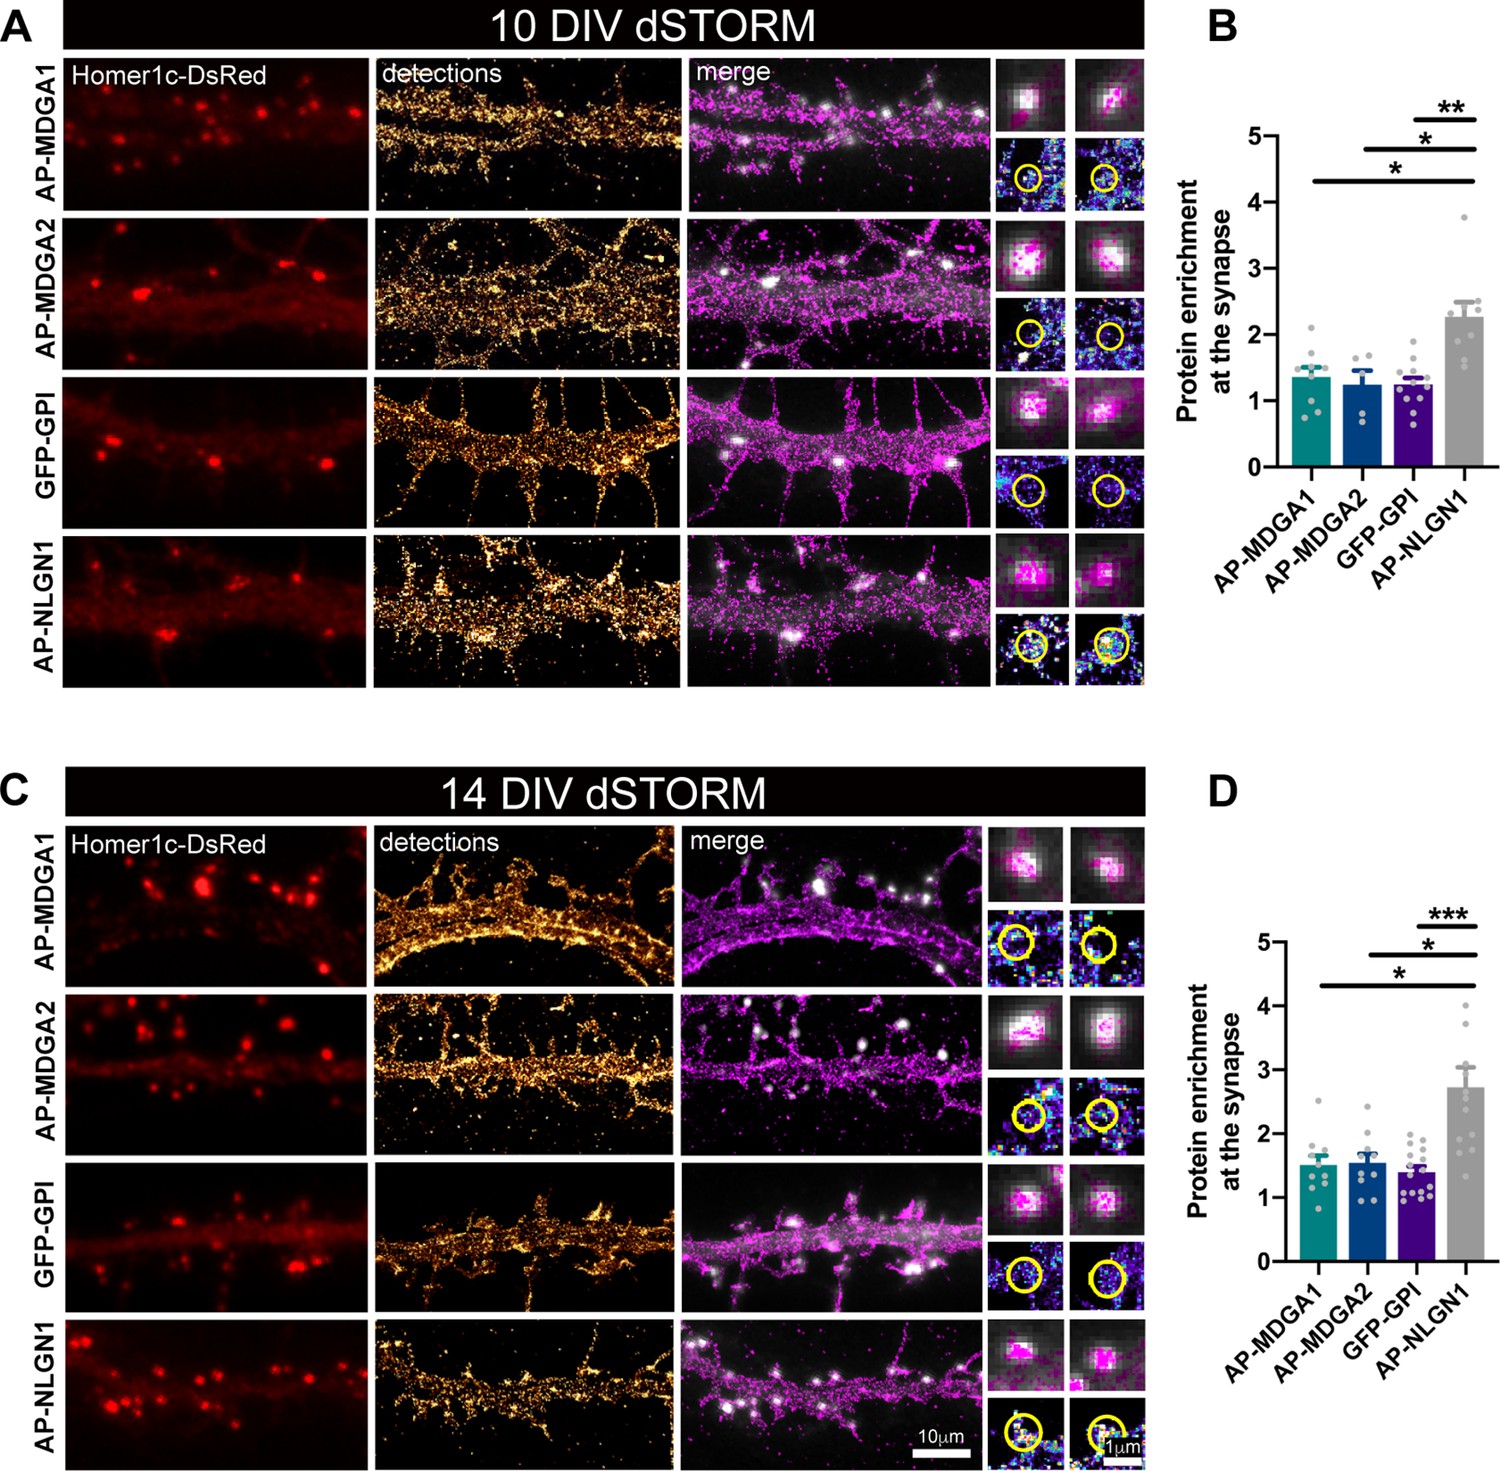
Nanoscale distribution of MDGA1 and MDGA2 in the neuronal membrane.
Hippocampal neurons were electroporated at DIV 0 with a combination of shRNAs to MDGA1 or MDGA2, rescue AP-MDGA1 or AP-MDGA2 (respectively), biotin ligase BirAER, and Homer1c-DsRed. Alternatively, neurons were electroporated with shRNA to NLGN1, rescue AP-NLGN1, biotin ligase (BirAER), and Homer1c-DsRed, or with GFP-GPI and Homer1c-DsRed. dSTORM experiments were performed at DIV 10 or 14, after labelling neurons with Alexa 647-conjugated mSA (for AP-tagged MDGAs and NLGN1) or Alexa 647-conjugated GFP nanobody (for GFP-GPI). (A, C) Representative images of dendritic segments showing Homer1c-DsRed positive synapses (in red), the super-resolved localization map of all AP-MDGA1, AP-MDGA2, GFP-GPI, or AP-NLGN1 single molecule detections (gold), and merged images (Homer1c-DsRed in white and detections in magenta). Insets on the right show zoomed images of different examples of Homer1c-DsRed-positive puncta overlapped with localizations (magenta) or pseudo-coloured localizations in a synaptic area marked by a yellow circle. (B, D) Bar plots representing the enrichment of AP-MDGA1, AP-MDGA2, GFP-GPI, and AP-NLGN1 localizations at synapses. Values were obtained from n > 5 neurons for each experimental condition and from at least three independent experiments. Data were compared by a Kruskal–Wallis test followed by Dunn’s multiple comparison test (*p < 0.05; **p < 0.01; ***p < 0.001). For the statistics of the data presented in panels (B,D), see Supplementary file 1 and Figure 2—source data 1.
-
Figure 2—source data 1
Excel file containing all raw data and statistical tests used in Figure 2.
Each graph (B,D) is shown in a separate sheet within the file.
- https://cdn.elifesciences.org/articles/75233/elife-75233-fig2-data1-v1.xlsx
Figure 2—figure supplement 1
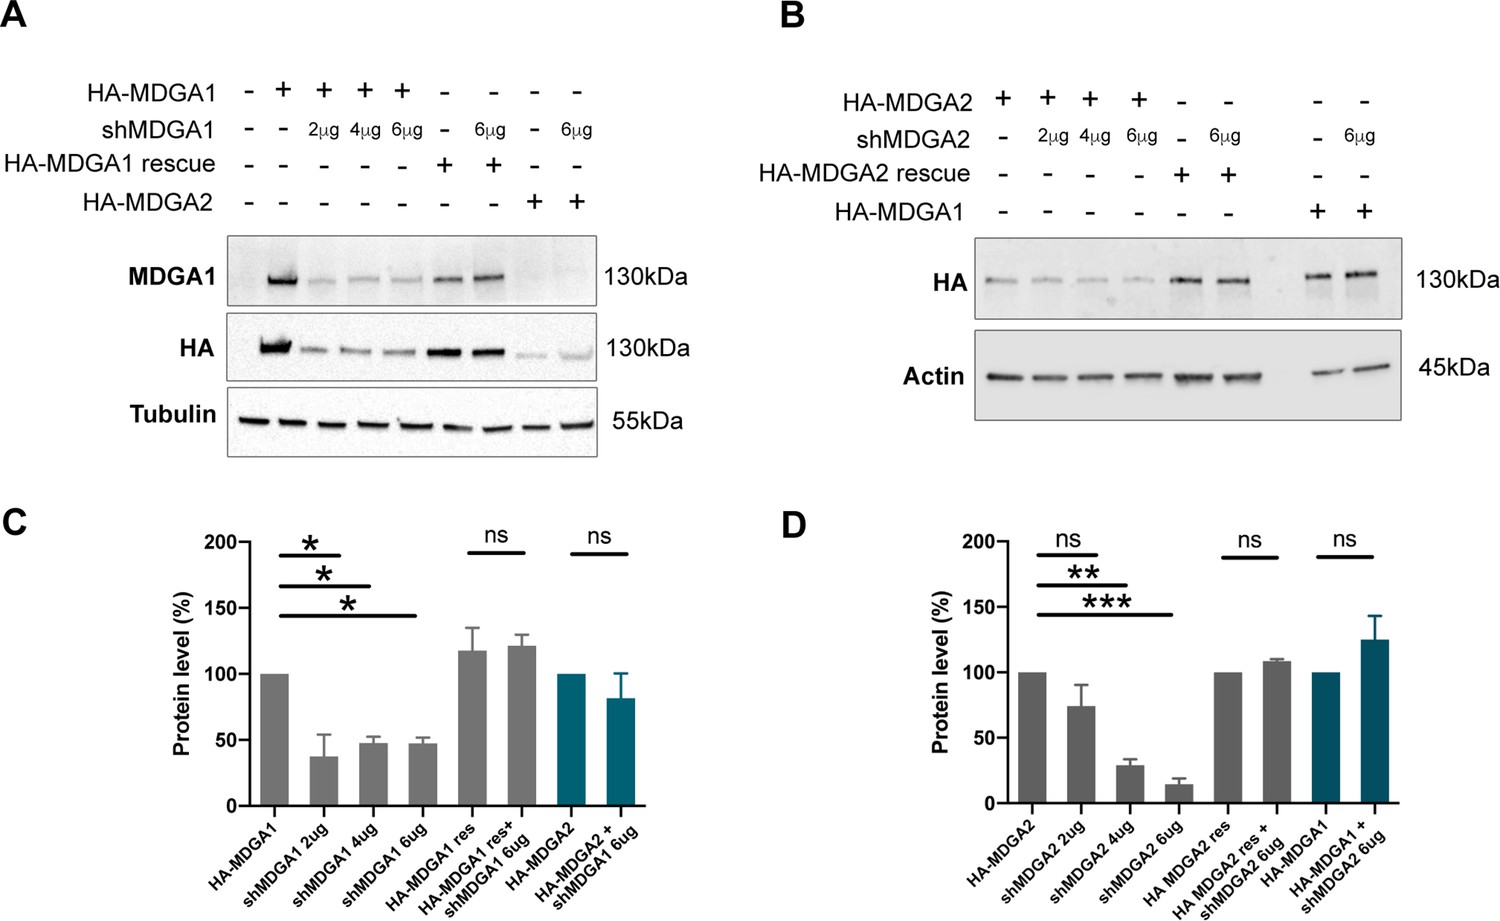
Validation of shRNA and rescue MDGA constructs in COS-7 cells.
(A) Western-blots performed on protein extracts from COS-7 cells expressing HA-MDGA1, HA-MDGA1 rescue, or HA-MDGA2 with various doses of shMDGA1 (2, 4, and 6 µg). Blots were probed using antibodies to MDGA1, HA, and tubulin as a loading control. (B) Western-blots performed on protein extracts from COS-7 cells expressing HA-MDGA2, HA-MDGA2 rescue, or HA-MDGA1 with various doses of shMDGA2. Blots were probed using antibodies to HA or actin as a loading control. For original immunoblot images presented in panels (A,B), refer to Figure 2—figure supplement 1—source data 1–6. (C, D) Plots showing the quantitation of MDGA1 or MDGA2 levels normalized by tubulin or actin, and expressed in reference to the HA-MDGA1 control with no shMDGA1, or to HA-MDGA2 with no shMDGA2, respectively. Data represent mean ± SEM from two independent experiments, and were compared by a Kruskal-Wallis test followed by Dunn´s multiple comparison test (*p < 0.05; **p < 0.01; ***p < 0.001). For the statistics of the data presented in panels (C,D), see Supplementary file 1 and Figure 2—figure supplement 1—source data 7.
-
Figure 2—figure supplement 1—source data 1
Source image of anti-MDGA1 immunoblot related to Figure 2—figure supplement 1A.
- https://cdn.elifesciences.org/articles/75233/elife-75233-fig2-figsupp1-data1-v1.zip
-
Figure 2—figure supplement 1—source data 2
Source image of anti-HA immunoblot related to Figure 2—figure supplement 1A.
- https://cdn.elifesciences.org/articles/75233/elife-75233-fig2-figsupp1-data2-v1.zip
-
Figure 2—figure supplement 1—source data 3
Source image of anti-Tubulin immunoblot related to Figure 2—figure supplement 1A.
- https://cdn.elifesciences.org/articles/75233/elife-75233-fig2-figsupp1-data3-v1.zip
-
Figure 2—figure supplement 1—source data 4
Source image of anti-HA immunoblot related to Figure 2—figure supplement 1B.
- https://cdn.elifesciences.org/articles/75233/elife-75233-fig2-figsupp1-data4-v1.zip
-
Figure 2—figure supplement 1—source data 5
Source image of anti-actin immunoblot related to Figure 2—figure supplement 1B.
- https://cdn.elifesciences.org/articles/75233/elife-75233-fig2-figsupp1-data5-v1.zip
-
Figure 2—figure supplement 1—source data 6
PDF file showing all the immunoblots in Figure 2—figure supplement 1 where the relevant bands chosen for illustration are highlighted by red rectangles.
- https://cdn.elifesciences.org/articles/75233/elife-75233-fig2-figsupp1-data6-v1.pdf
-
Figure 2—figure supplement 1—source data 7
Excel file containing all raw data and statistical tests used in Figure 2—figure supplement 1.
Each graph (C,D) is shown in a separate sheet within the file.
- https://cdn.elifesciences.org/articles/75233/elife-75233-fig2-figsupp1-data7-v1.xlsx
Figure 2—figure supplement 2
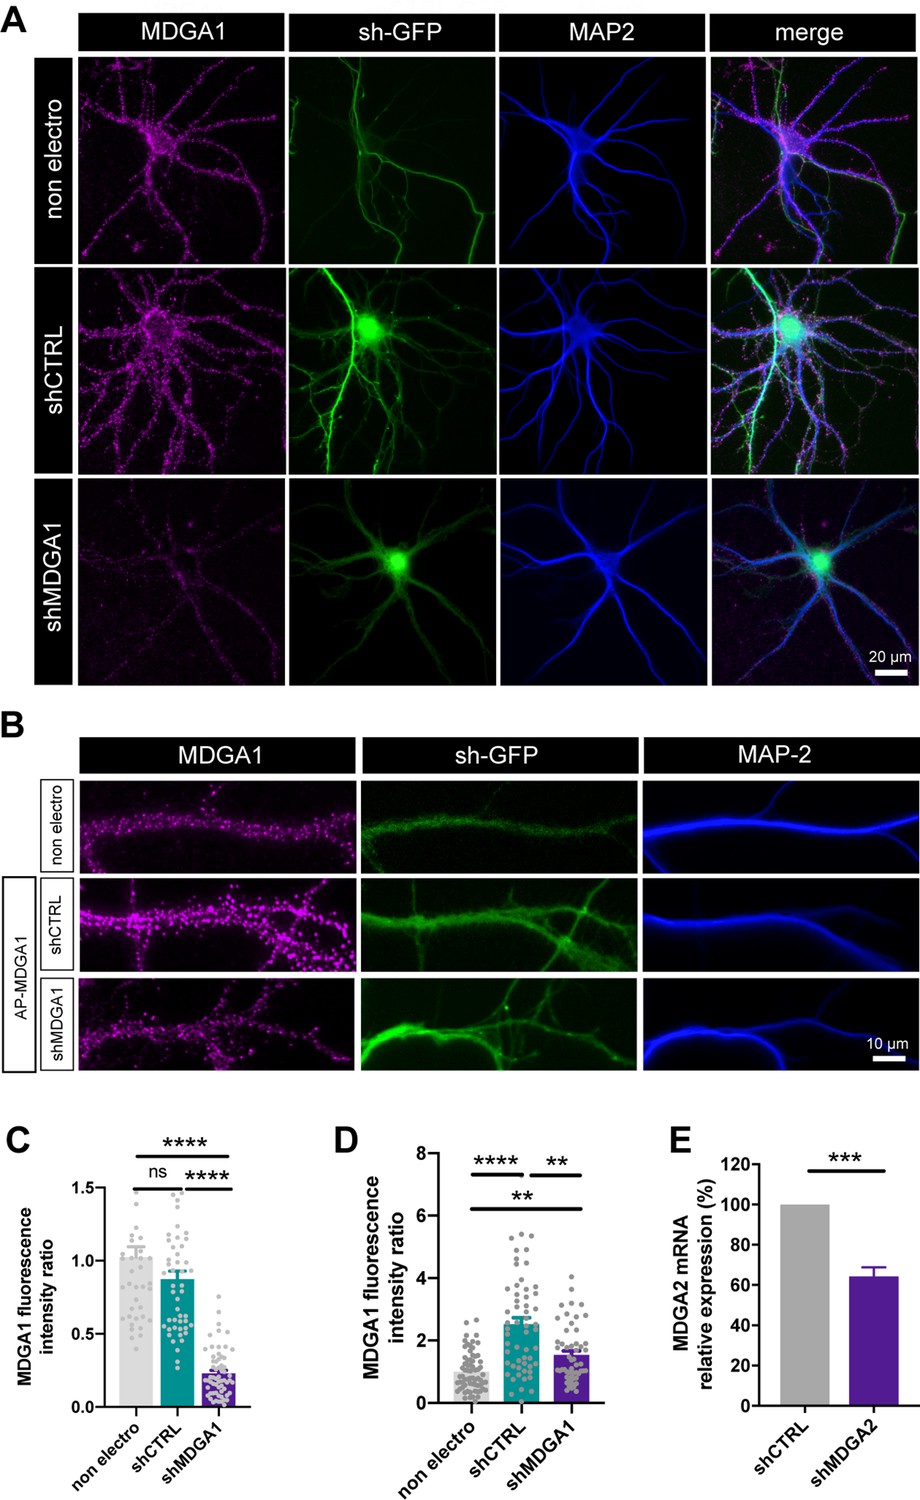
Validation of shRNA and rescue MDGA constructs in neuronal cultures.
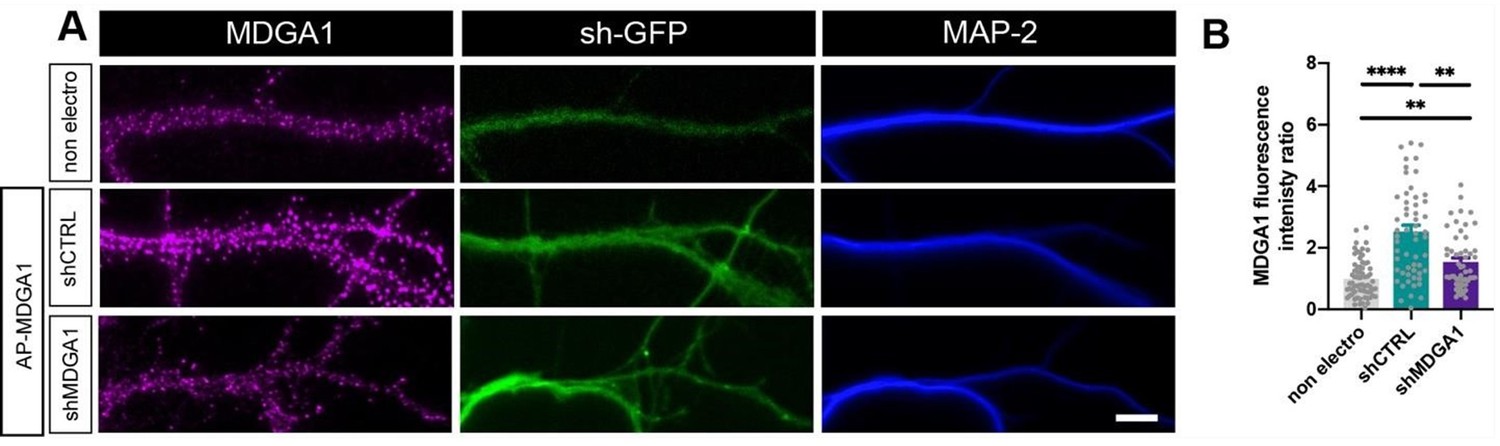
(A, B) Representative surface immunofluorescence staining of endogenous MDGA1 in DIV 10 neurons that were electroporated at DIV 0 with shCTRL or shMDGA1 (A), or with rescue AP-MDGA1 plus shCTRL or shMDGA1 (B), in relation to non-electroporated neighbors (non electro). Representative images show native MDGA1 in magenta, the GFP reporter of the shRNAs in green and MAP-2 in blue. (C, D) Corresponding bar graphs showing the MDGA1 fluorescence intensity on electroporated neurons in the different conditions, normalized by the corresponding intensity on non-electroporated neurons. Data represent the mean ± SEM of n > 40 neurons for each experimental condition obtained from three independent experiments, and were compared by a Mann-Whitney test (**p < 0.01; ****p < 0.0001). (E) RT-qPCR of MDGA2 mRNAs measured from hippocampal neuronal cultures that were electroporated at DIV 0 with shCTRL or shMDGA2. PCR values were first normalized against U6 and SDHA housekeeping genes, and MDGA2 expression levels were then expressed as a function of shCTRL (taken as 100%). Data represent the mean ± SEM from four independent experiments, and were compared by an unpaired t-test (***p < 0.001). For the statistics of the data presented in panels (C,D,E), see Supplementary file 1 and Figure 2—figure supplement 2—source data 1.
-
Figure 2—figure supplement 2—source data 1
Excel file containing all raw data and statistical tests used in Figure 2—figure supplement 2.
Each graph (C,D,E) is shown in a separate sheet within the file.
- https://cdn.elifesciences.org/articles/75233/elife-75233-fig2-figsupp2-data1-v1.xlsx
Figure 2—figure supplement 3
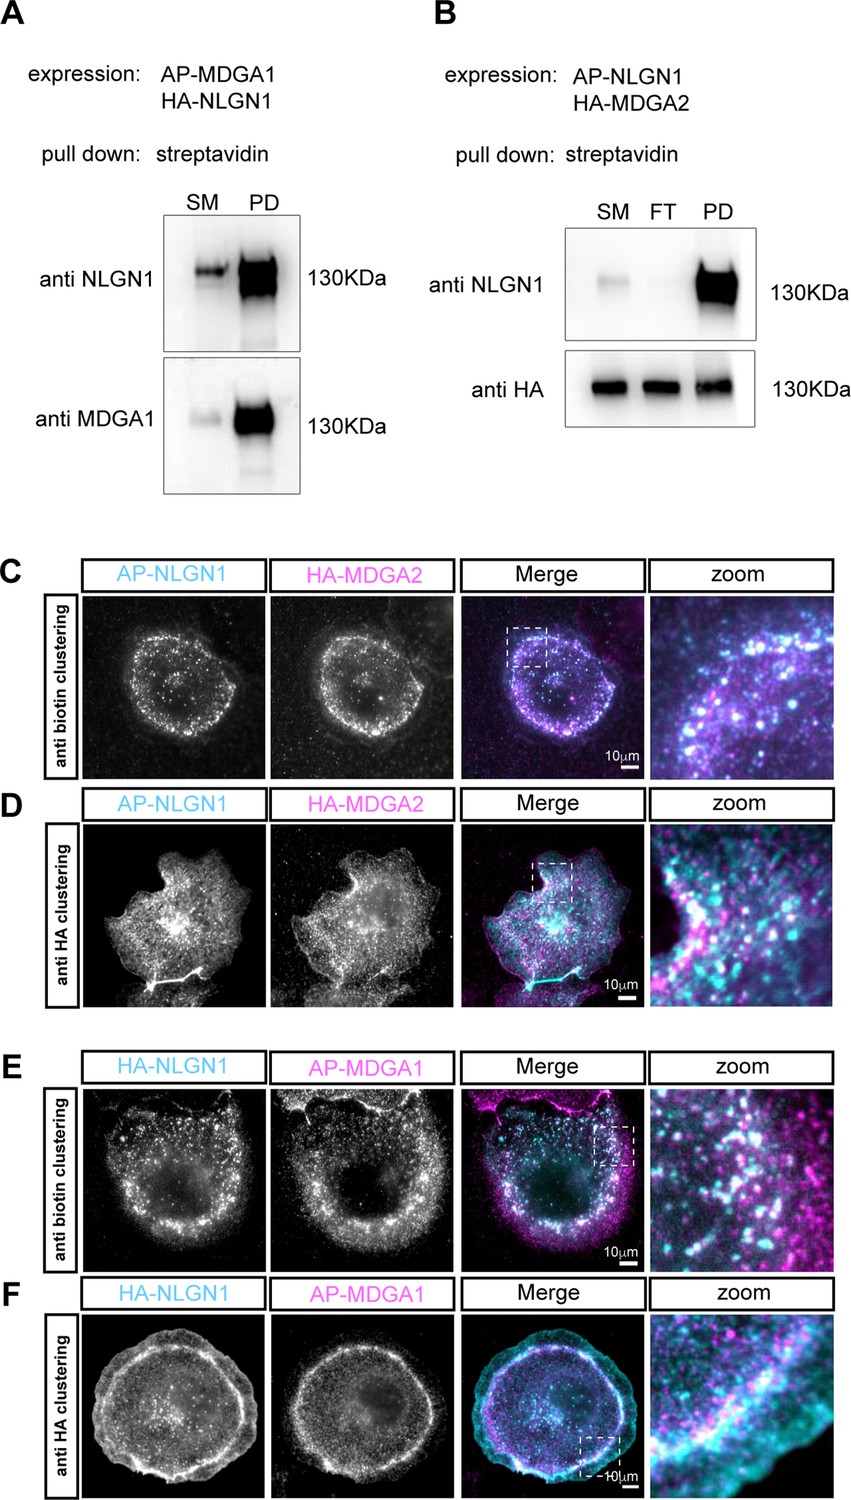
The labeling strategy does not impair the NLGN1-MDGA interaction.
(A) COS-7 cells were co-transfected with AP-MDGA1, HA-NLGN1, and BirAER, and biotinylated AP-MDGA1 was precipitated with streptavidin beads. Separated proteins were immunoblotted with anti-NLGN1 and -MDGA1 antibodies. SM: starting material; PD: pull-down. (B) COS-7 cells were co-transfected with AP-NLGN1, HA-MDGA2, and BirAER, and biotinylated AP-NLGN1 was precipitated with streptavidin beads. Separated proteins were immunoblotted with anti-NLGN1 and anti-HA antibodies. FT: flow through. For original immunoblot images presented in panels (A,B), refer to Figure 2—figure supplement 3—source data 1–5. (C, D) Fluorescence microscopy observation of COS-7 cells expressing AP-NLGN1, BirAER, and HA-MDGA2. (C) AP-NLGN1 was live clustered by incubating cells with a mix of primary anti-biotin antibody and anti-mouse secondary antibody (cyan), and associated HA-MDGA2 was detected by rat anti-HA antibody followed by anti-rat antibody (magenta). Colocalization of NLGN1 and MDGA2 clusters indicates that accessibility of the AP tag is not impaired by the formation of NLGN1-MDGA2 complexes. (D) HA-MDGA2 was live clustered by cell incubation with a mix of rat anti-HA and secondary anti-rat antibody (magenta), then biotinylated AP-NLGN1 was detected with fluorescent streptavidin (cyan). Co-localization of NLGN1 and MDGA2 clusters was also observed. (E, F) COS-7 cells expressing AP-MDGA1, BirAER, and HA-NLGN1. (E) AP-MDGA1 live clustered by incubating cells with a mix of primary anti-biotin antibody and anti-mouse secondary antibody (magenta), then HA-NLGN1 was detected by rat anti-HA antibodies followed by anti-rat antibody (cyan) (F) HA-NLGN1 was live clustered by incubating cells with a mix of anti-HA antibody and secondary antibody (cyan), then biotinylated AP-MDGA1 was detected with streptavidin (magenta). Co-localization of clusters was also observed.
-
Figure 2—figure supplement 3—source data 1
Source image of anti-NLGN1 immunoblot related to Figure 2—figure supplement 3A.
- https://cdn.elifesciences.org/articles/75233/elife-75233-fig2-figsupp3-data1-v1.zip
-
Figure 2—figure supplement 3—source data 2
Source image of anti-MDGA1 immunoblot related to Figure 2—figure supplement 3A.
- https://cdn.elifesciences.org/articles/75233/elife-75233-fig2-figsupp3-data2-v1.zip
-
Figure 2—figure supplement 3—source data 3
Source image of anti-NLGN1 immunoblot related to Figure 2—figure supplement 3B.
- https://cdn.elifesciences.org/articles/75233/elife-75233-fig2-figsupp3-data3-v1.zip
-
Figure 2—figure supplement 3—source data 4
Source image of anti-HA immunoblot related to Figure 2—figure supplement 3B.
- https://cdn.elifesciences.org/articles/75233/elife-75233-fig2-figsupp3-data4-v1.zip
-
Figure 2—figure supplement 3—source data 5
PDF file showing all the immunoblots in Figure 2—figure supplement 3 where the relevant bands chosen for illustration are highlighted by red rectangles.
- https://cdn.elifesciences.org/articles/75233/elife-75233-fig2-figsupp3-data5-v1.pdf
Figure 3

Lateral mobility of recombinant MDGAs across neuronal development.
Dissociated rat hippocampal neurons were electroporated at DIV 0 with a combination of shRNAs to MDGA1 or MDGA2 (both carrying a GFP reporter), rescue AP-tagged MDGA1 or MDGA2 (respectively), and BirAER. Control neurons were electroporated with GFP-GPI. uPAINT experiments were performed at DIV 8, 10, or 14, after labelling neurons expressing AP-MDGA1 or AP-MDGA2 with 1 nM STAR 635P-conjugated mSA, and labelling neurons expressing GFP-GPI with 1 nM Atto 647N-conjugated anti-GFP nanobody. (A, C, E) Representative images of dendritic segments showing the GFP signal (green) and the corresponding single molecule trajectories (random colors) acquired during an 80 s stream, for the indicated time in culture. (B, D, F) Corresponding semi-log plots of the distributions of diffusion coefficients for AP-MDGA1, AP-MDGA2, and GFP-GPI, at the three different developmental times. (G) Graph of the mobile and immobile fractions of MDGA1, MDGA2, and GFP-GPI, as a function of time in culture. The threshold between mobile and immobile molecules was set at D = 0.01 µm²/s. (H) Graph of the median diffusion coefficient, averaged per cell, in the different conditions. Data represent mean ± SEM of n > 10 neurons for each experimental condition from at least three independent experiments, and were compared by a Kruskal–Wallis test followed by Dunn’s multiple comparison test (**** p < 0.0001). For the statistics of the data presented in panels (B,D,F,G,H), see Supplementary file 1 and Figure 3—source data 1.
-
Figure 3—source data 1
Excel file containing all raw data and statistical tests used in Figure 3.
Each graph (B,D,F,G,H) is shown in a separate sheet within the file.
- https://cdn.elifesciences.org/articles/75233/elife-75233-fig3-data1-v1.xlsx
Figure 4 with 1 supplement
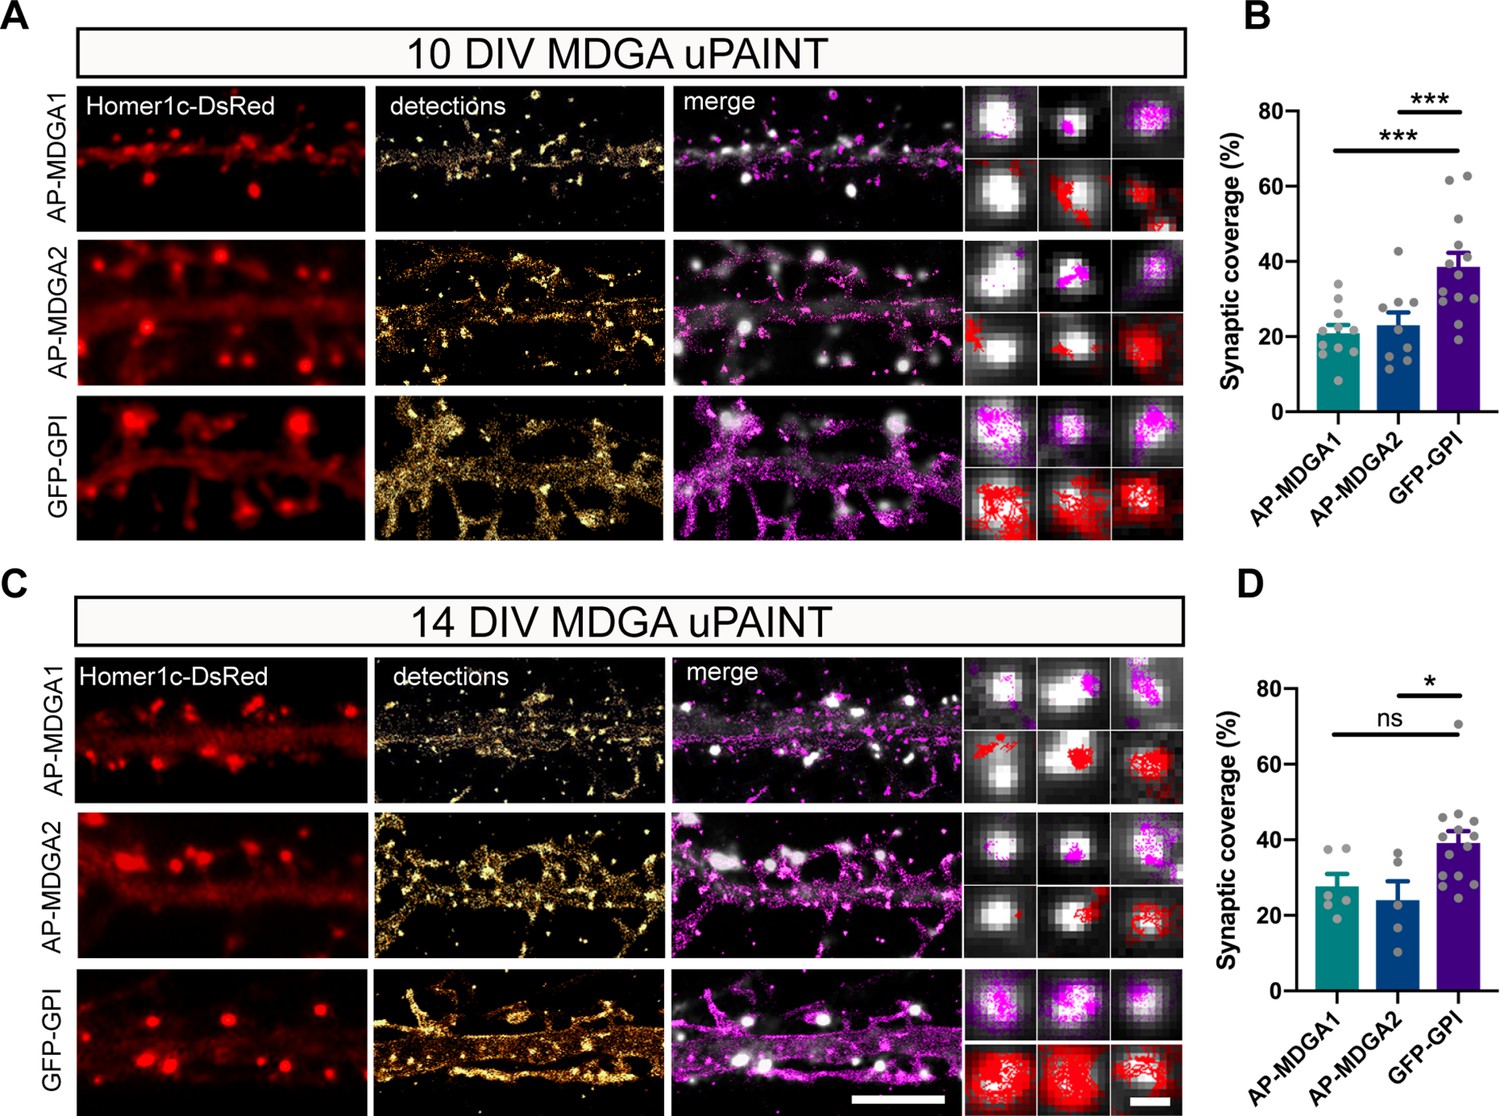
Single molecule localization of recombinant MDGAs with respect to post-synaptic densities.
Hippocampal neurons were electroporated at DIV 0 with a combination of shRNAs to MDGA1 or MDGA2, rescue AP-MDGA1 or AP-MDGA2 (respectively), biotin ligase (BirAER), and Homer1c-DsRed. Control neurons were electroporated with GFP-GPI and Homer1c-DsRed. uPAINT experiments were performed at DIV 10 or 14, after labelling neurons with 1 nM STAR 635P-conjugated mSA or Atto 647N-conjugated anti-GFP nanobody, respectively. (A, C) Representative images of dendritic segments showing the Homer1c-DsRed signal (red), the super-resolved localization map of all AP-MDGA1, AP-MDGA2, or GFP-GPI single molecule detections (gold), and the corresponding trajectories (magenta) super-imposed to Homer1c-DsRed (white). Insets represent zooms on individual post-synapses in the different conditions (Homer1c-DsRed in white, detections in magenta and trajectories in red). (B, D) Bar plots representing synaptic coverage of AP-MDGA1, AP-MDGA2, or GFP-GPI at synapses, based on single molecule detections, for the two developmental stages (DIV 10 and 14), respectively. Data represent the mean ± SEM of 5–13 neurons for each experimental condition from at least three independent experiments, and were compared by a Kruskal–Wallis test followed by Dunn’s multiple comparison test (*p < 0.05; ***p < 0.001). For the statistics of the data presented in panels (B,D), see Supplementary file 1 and Figure 4—source data 1.
-
Figure 4—source data 1
Excel file containing all raw data and statistical tests used in Figure 2.
Each graph (B,D) is shown in a separate sheet within the file.
- https://cdn.elifesciences.org/articles/75233/elife-75233-fig4-data1-v1.xlsx
Figure 4—figure supplement 1
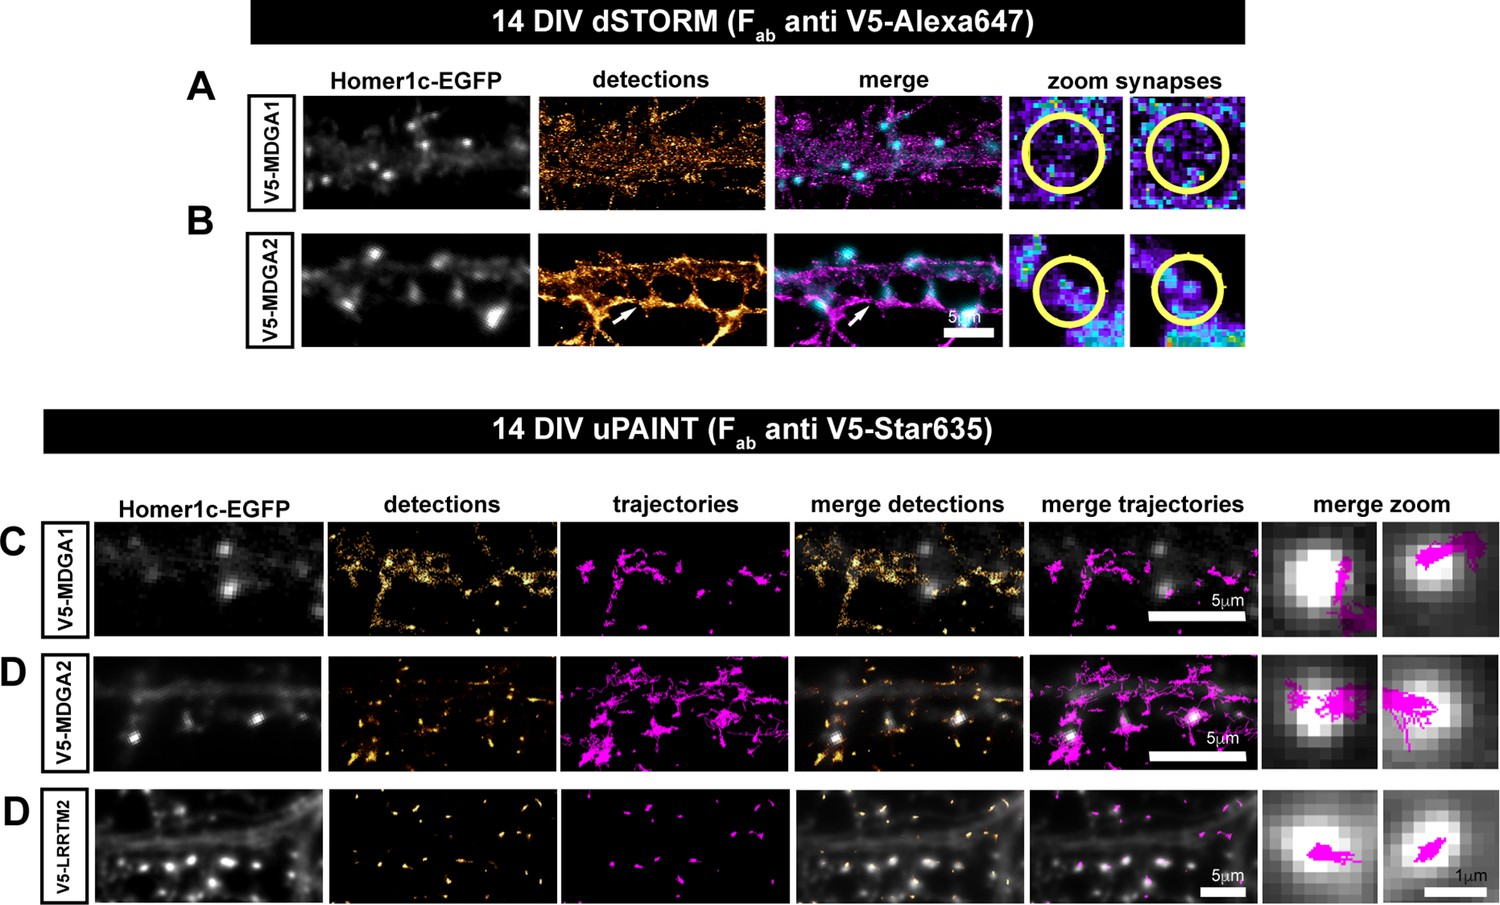
Lateral mobility and nanoscale localization of recombinant V5-MDGAs in hippocampal neurons.
Dissociated rat hippocampal neurons were electroporated at DIV 0 with V5-MDGA1, V5-MDGA2, or V5-LRRTM2 as a positive control, together with the post-synaptic marker Homer1c-EGFP. (A, B) dSTORM images of MDGA1 and MDGA2 at the cell membrane, in DIV 14 neurons labeled with 100 nM Alexa 647-conjugated anti-V5 Fab fragment. Representative images of dendritic segments showing Homer1c-EGFP-positive synapses (gray), the super-resolved localization map of all V5-MDGA1 or V5-MDGA2 single molecule detections (gold), and merged images (Homer1c-EGFP in cyan and detections in magenta). Insets on the right show zoomed images of pseudo-colored localizations of V5-MDGAs in a synaptic area marked by a yellow circle. Arrows in B show an axon expressing V5-MDGA2 contacting spines in a dendrite also expressing V5-MDGA2. (C, D, E) uPAINT experiments were performed at DIV 14, after labelling neurons with STAR 635P-conjugated anti-V5 Fab fragment. Representative images of dendritic segments showing Homer1c-EGFP as synaptic marker (white), the corresponding single molecule detections (gold) and trajectories (magenta). Superimposed images of synaptic markers and detections or trajectories are shown on the right of each panel with the same color code.
Figure 5 with 1 supplement

Effect of MDGA2 knock-down on NLGN1 membrane mobility.
Neurons were electroporated at DIV 0 with AP-NLGN1, BirAER and Homer1c-DsRed, plus shCTRL, shMDGA2, or shMDGA2 + rescue HA-MDGA2, and imaged at DIV 10 or 14 using uPAINT. (A, D) AP-NLGN1 was sparsely labelled using 1 nM STAR 635P-conjugated mSA for single molecule tracking in DIV 10 and 14 neurons, respectively. The GFP reporter of the different shRNAs appears in green, and the Homer1c-DsRed signal in white. On the right of each panel, merged images of Homer1c-DsRed (cyan) and AP-NLGN1 trajectories (magenta) acquired during an 80 s stream are shown. Insets represent zooms on individual post-synapses in the different conditions. (B, E) Semi-log plots of the distribution of AP-NLGN1 diffusion coefficients in DIV 10 and 14 neurons, respectively. (C, F) Median diffusion coefficient of AP-NLGN1. Data represent the mean ± SEM obtained from n = 21/26/16 neurons at DIV 10, and n = 35/15/8 neurons at DIV 14 out of three independent experiments, and were compared by a Kruskal–Wallis test followed by Dunn’s multiple comparison test (*p < 0.05). For the statistics of the data presented in panels (B,C,E,F), see Supplementary file 1 and Figure 5—source data 1.
-
Figure 5—source data 1
Excel file containing all raw data and statistical tests used in Figure 5.
Each graph (B,C,E,F) is shown in a separate sheet within the file.
- https://cdn.elifesciences.org/articles/75233/elife-75233-fig5-data1-v1.xlsx
Figure 5—figure supplement 1
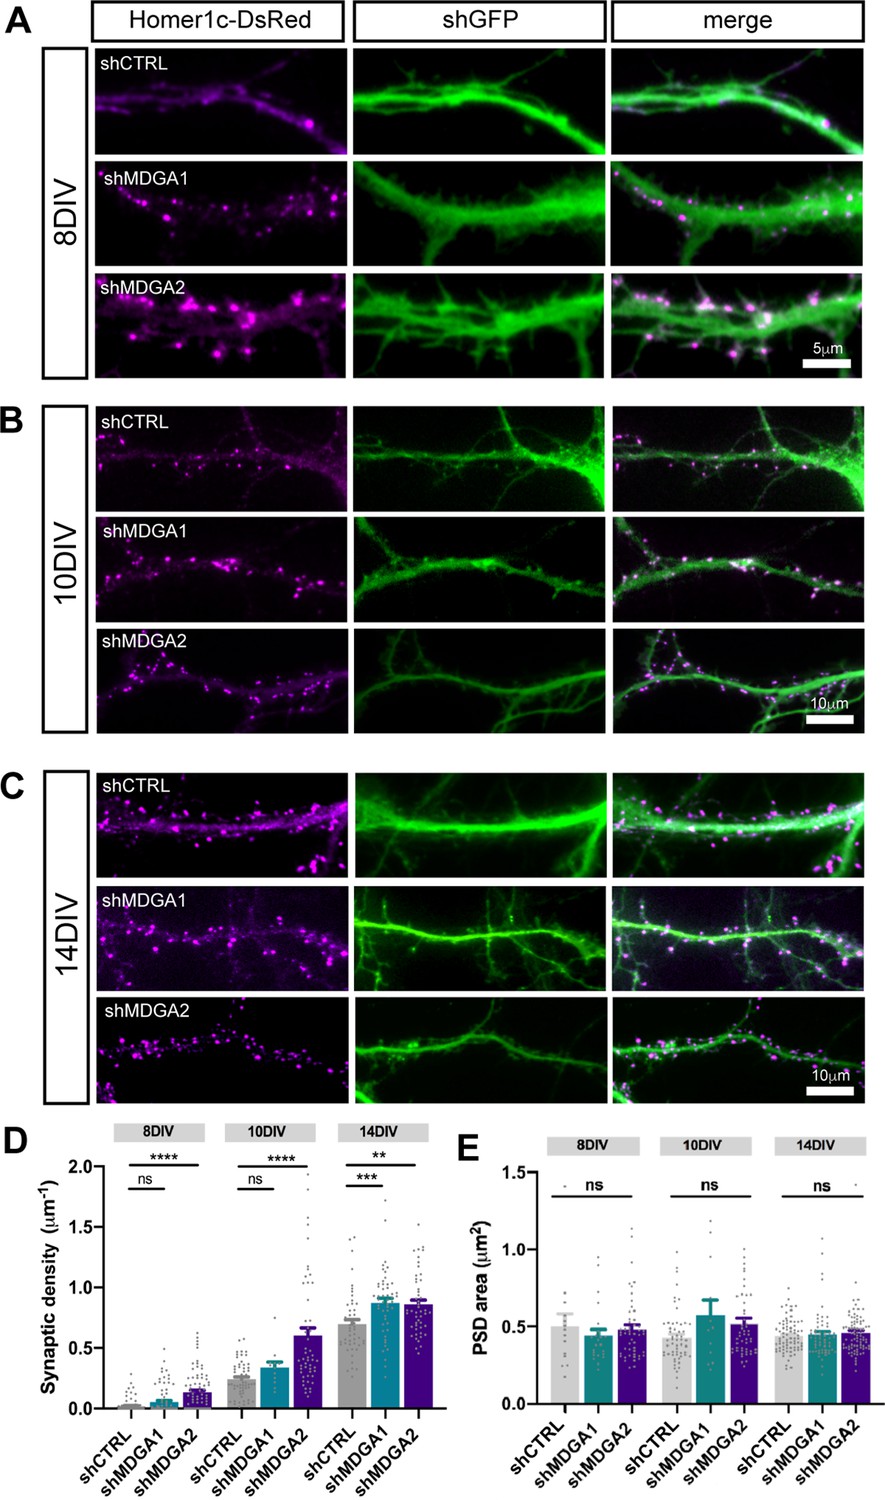
MDGAs knock-down increases excitatory synaptic density.
Dissociated neurons were electroporated at DIV 0 with either shCTRL, shMDGA1, or shMDGA2. 8, 10, or 14 DIV after plating, epifluorescence images were acquired. (A, B, C) Representative images of dendritic segments at DIV 8, 10, and 14, respectively, showing Homer1c-DsRed (magenta), the GFP shRNA reporter (green), and merged images, at the different developmental stages. (D, E) Bar plots showing the density and area of individual Homer1c-DsRed puncta in the different developmental stages. Data represent the mean ± SEM of n > 12 neurons from at least three independent experiments, and were compared by a Kruskal–Wallis test followed by Dunn’s multiple comparison test (**p < 0.05; ***p < 0.001; ****p < 0.0001). For the statistics of the data presented in panels (D,E), see Supplementary file 1 and Figure 5—figure supplement 1—source data 1.
-
Figure 5—figure supplement 1—source data 1
Excel file containing all raw data and statistical tests used in Figure 5—figure supplement 1.
Each graph (D,E) is shown in a separate sheet within the file.
- https://cdn.elifesciences.org/articles/75233/elife-75233-fig5-figsupp1-data1-v1.xlsx
Figure 6 with 1 supplement
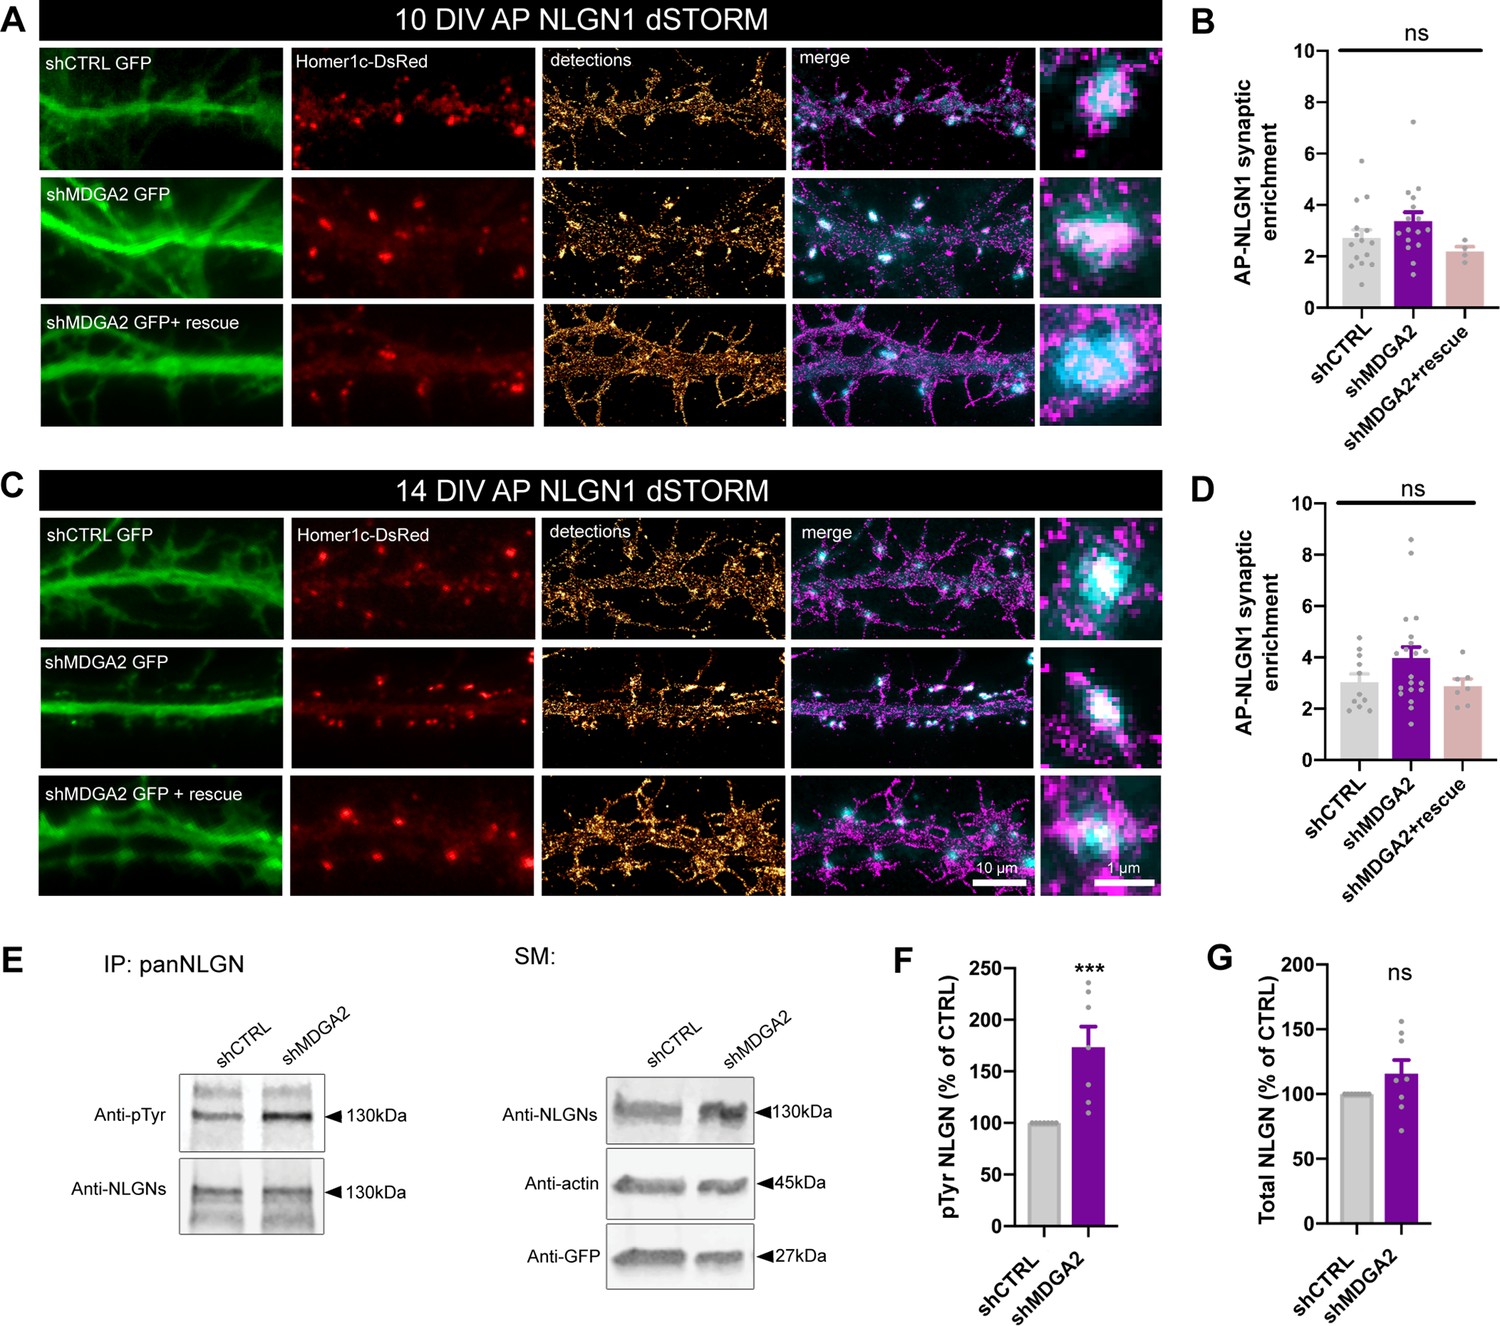
Effect of MDGA2 knock-down on NLGN1 nanoscale membrane localization and phosphorylation.
(A, C) Neurons were electroporated at DIV 0 with AP-NLGN1, BirAER, and Homer1c-DsRed, plus shCTRL, shMDGA2, or shMDGA2 + rescue HA-MDGA2, and imaged at DIV 10 or 14 using dSTORM after high density labelling with Alexa 647-conjugated mSA. Representative images of dendritic segments show the GFP reporter of shRNAs (green), Homer1c-DsRed (red), and the integration of all AP-NLGN1 single molecule localizations (gold). Merged images show Homer1c-DsRed (cyan) and AP-NLGN1 localizations (magenta). Insets on the right show zoomed examples of Homer1c-DsRed positive puncta overlapped with AP-NLGN1 localizations. (B, D) Bar plots representing the enrichment of AP-NLGN1 at Homer1c-DsRed puncta. Data represent mean ± SEM from three independent experiments and were compared by a Kruskal–Wallis test followed by Dunn’s multiple comparison test (n > 4 neurons at DIV 10 and n > 7 neurons at DIV 14 for each construct). (E) Hippocampal neurons were electroporated at DIV 0 with shCTRL or shMDGA2 and cultured for 10 days. Protein extracts were immunoprecipitated with a pan NLGN antibody. Phosphotyrosine (pTyr) and total NLGN levels were detected by Western blot in the immunoprecipitation (IP) samples, and pan NLGN, actin, and GFP were revealed in the starting material (SM). For original immunoblot images presented in panel (E), refer to Figure 1—source data 1–5. (F, G) Bar plots showing the average pTyr signal from the pan NLGN immunoprecipitate normalized to the total amount of immunoprecipitated NLGN, and the total amount of starting NLGN material in shCTRL and shMDGA2 electroporated cells, respectively. Data expressed as percentage of the shCTRL condition, represent the mean ± SEM from seven independent experiments and were compared by a Mann-Whitney test (***p < 0.001). For the statistics of the data presented in panels (B,D,F,G), see Supplementary file 1 and Figure 6—source data 6.
-
Figure 6—source data 1
Source image of anti-pTyr immunoblot on NLGN pull-down related to Figure 6E.
- https://cdn.elifesciences.org/articles/75233/elife-75233-fig6-data1-v1.zip
-
Figure 6—source data 2
Source image of anti-NLGN immunoblot on NLGN pull-down related to Figure 6E.
- https://cdn.elifesciences.org/articles/75233/elife-75233-fig6-data2-v1.zip
-
Figure 6—source data 3
Source image of anti-NLGN immunoblot on starting material, related to Figure 6E.
- https://cdn.elifesciences.org/articles/75233/elife-75233-fig6-data3-v1.zip
-
Figure 6—source data 4
Source image of anti-actin and anti-GFP immunoblots on starting material, related to Figure 6E.
- https://cdn.elifesciences.org/articles/75233/elife-75233-fig6-data4-v1.zip
-
Figure 6—source data 5
PDF file showing all the immunoblots in Figure 6 where the relevant bands chosen for illustration are highlighted by red rectangles.
- https://cdn.elifesciences.org/articles/75233/elife-75233-fig6-data5-v1.pdf
-
Figure 6—source data 6
Excel file containing all raw data and statistical tests used in Figure 6.
Each graph (B,D,F,G) is shown in a separate sheet within the file.
- https://cdn.elifesciences.org/articles/75233/elife-75233-fig6-data6-v1.xlsx
Figure 6—figure supplement 1
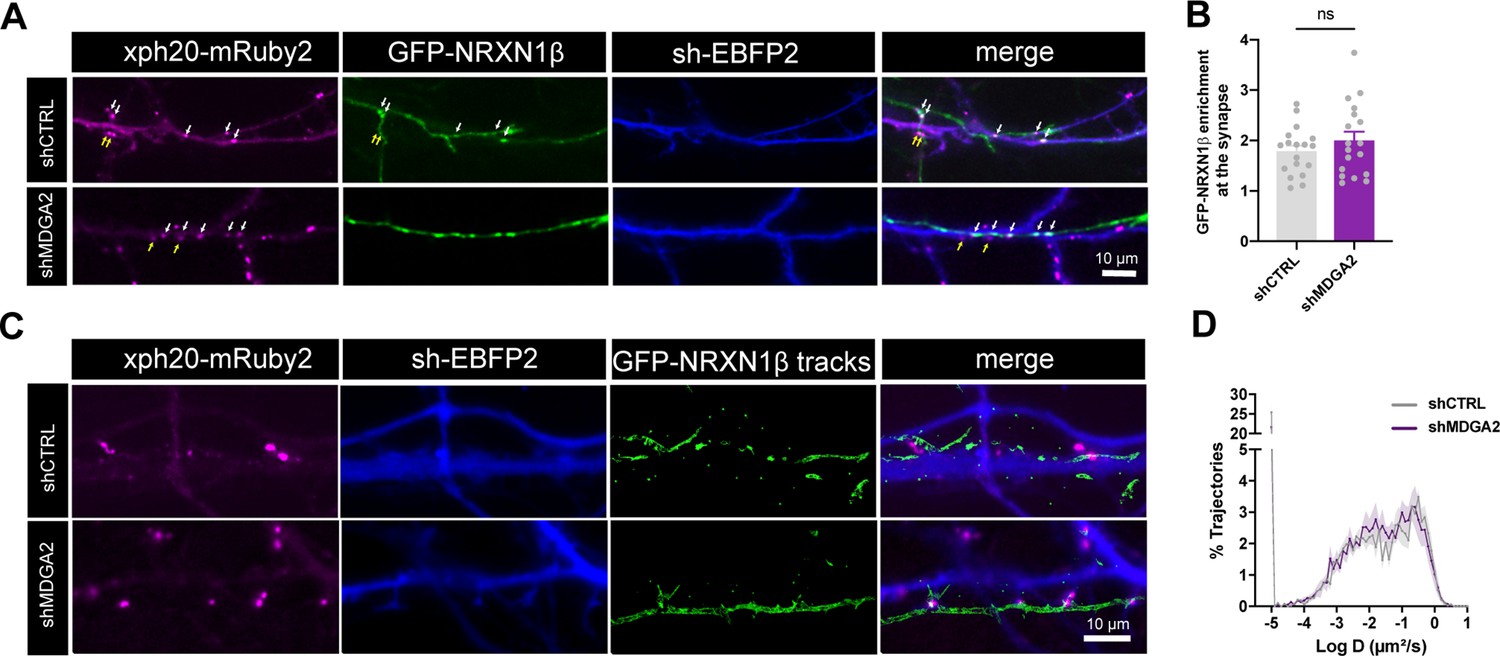
Effect of MDGA knock down on NRXN1β localization and mobility.
Dissociated neurons were electroporated at DIV 0 with Xph20-mRuby2 and shCTRL-EBFP2 or shMDGA2-EBFP2 constructs and co-plated with neurons electroporated with GFP-NRXN1β. (A) Representative images of DIV 10 neurons expressing shCTRL or shMDGA2, respectively, contacting GFP-NRXN1β positive axons. White arrows indicate overlapping pre- and post-synapses and yellow arrows indicate post-synapses without GFP-NRXN1β contacting terminals. The fluorescence intensity of GFP-NRXN1β at overlapping terminals was analyzed and normalized to shaft values. (B) Bar plot showing GFP-NRXN1β enrichment at axon-dendrite contact sites. Data represent mean ± SEM of n ≥ 18 cells for each experimental condition from at least three independent experiments, and were compared by a Mann-Whitney test (ns: not significant). (C) Representative images of Xph20-mRuby2 (magenta), sh-EBFP2 (blue) and single GFP-NRXN1β molecule trajectories, obtained upon sparse labelling with an anti-GFP nanobody conjugated to Atto 647 N. (D) Semi-log plots of the distribution of GFP-NRXN1β diffusion coefficients in axons making contacts with dendrites from neurons expressing shCTRL or shMDGA2. Curves represent the mean diffusion of 6 neurons per condition from two independent experiments. For the statistics of the data presented in panels (B,D), see Supplementary file 1 and Figure 6—figure supplement 1—source data 1.
-
Figure 6—figure supplement 1—source data 1
Excel file containing all raw data and statistical tests used in Figure 6—figure supplement 1.
Each graph (B,D) is shown in a separate sheet within the file.
- https://cdn.elifesciences.org/articles/75233/elife-75233-fig6-figsupp1-data1-v1.xlsx
Figure 7
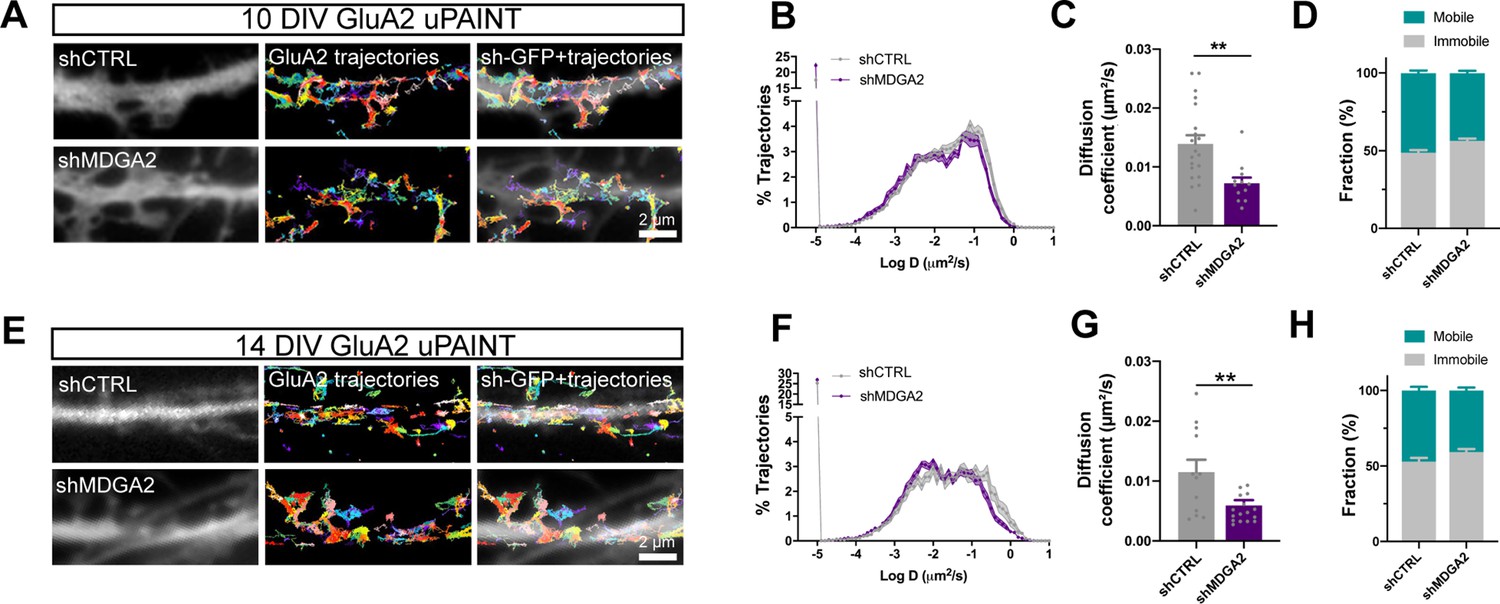
Effect of MDGA2 knock-down on AMPAR membrane mobility.
Neurons were electroporated at DIV 0 with shCTRL-GFP or shMDGA2-GFP, and imaged at DIV 10 or DIV 14 with uPAINT. (A, E) Native AMPARs were sparsely labelled using an anti-GluA2 antibody conjugated to Atto 647 N. Representative trajectories of single GluA2-containing AMPARs are shown in multicolor, super-imposed to the distribution of the GFP reporter (white). (B, F) Semi-log plot of the distribution of GluA2 diffusion coefficients at DIV 10 and 14, respectively. The curves represent the averages of at least 12 neurons per condition from three independent experiments. (C, G) Median diffusion coefficient of GluA2-containing AMPARs at DIV 10 and 14, respectively. Data represent mean ± SEM of n > 12 neurons per condition from three independent experiments, and were compared by an unpaired t-test (**p < 0.01). (D, H) Bar plots of the immobile fraction of GluA2-containing AMPARs in the three conditions, defined as the proportion of single molecules with diffusion coefficient D < 0.01 µm²/s. For the statistics of the data presented in panels (B,C,D,F,G,H), see Supplementary file 1 and Figure 7—source data 1.
-
Figure 7—source data 1
Excel file containing all raw data and statistical tests used in Figure 7.
Each graph (B,C,D,F,G,H) is shown in a separate sheet within the file.
- https://cdn.elifesciences.org/articles/75233/elife-75233-fig7-data1-v1.xlsx
Figure 8 with 5 supplements
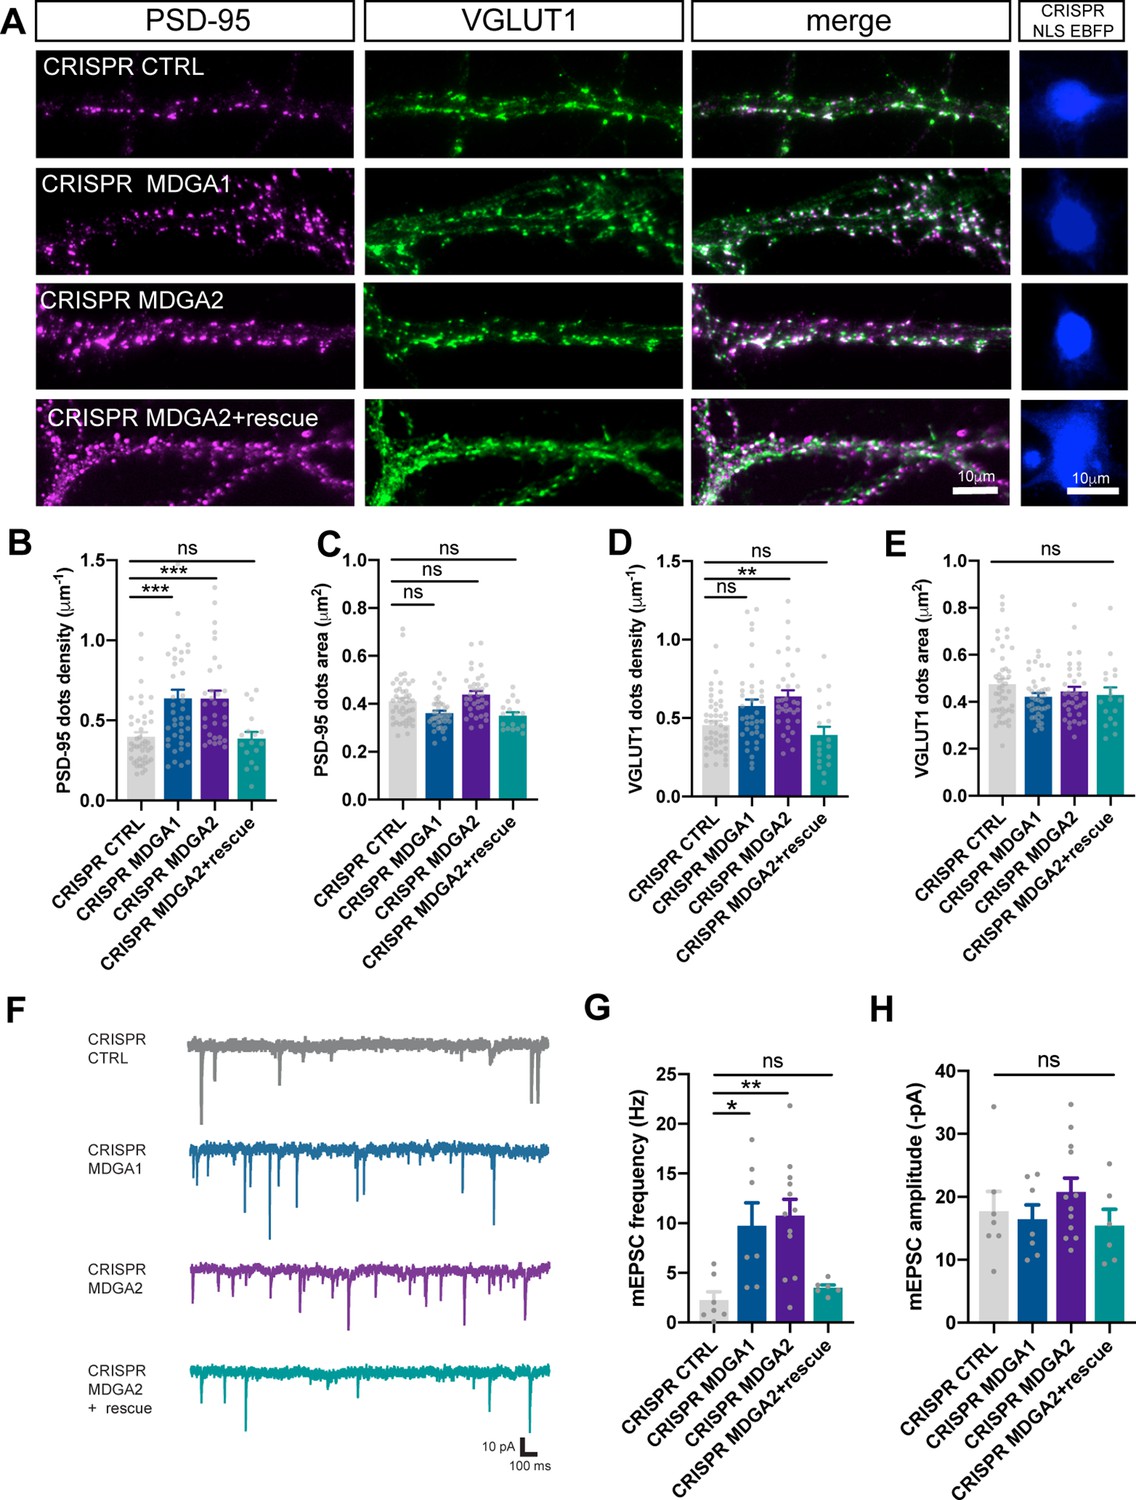
Effect of MDGA knock-out on synaptic density and transmission in dissociated neurons.
Dissociated neurons were electroporated at DIV 0 with CRISPR/Cas9 CTRL, CRISPR/Cas9 MDGA1, CRISPR/Cas9 MDGA2, or CRISPR/Cas9 MDGA2 plus HA-MDGA2 rescue. Ten days after plating, cultures were fixed, permeabilized, and endogenous PSD-95 and VGLUT1 were immunostained. (A) Representative images of dendritic segments showing PSD-95 staining (magenta), VGLUT1 staining (green), the merged images, and the nuclear EBFP control of CRISPR/Cas9 construct expression (blue), in the different conditions. (B–E) Bar plots showing the density per unit dendrite length and surface area of individual PSD-95 and VGLUT1 puncta, respectively, in the various conditions. Data represent mean ± SEM of n > 17 cells for each experimental condition and from at least three independent experiments, and were compared by a Kruskal–Wallis test followed by Dunn’s multiple comparison test (**p < 0.01; ***p < 0.001). (F) Representative traces of AMPAR-mediated mEPSC recordings from DIV 10 neurons expressing CRISPR/Cas9 CTRL, CRISPR/Cas9 MDGA1, CRISPR/Cas9 MDGA2, or CRISPR/Cas9 MDGA2 plus HA-MDGA2 rescue, clamped at –70 mV in the presence of tetrodotoxin and bicuculline. (G, H) Bar graphs of mEPSC frequency and amplitude respectively, for each condition. Plots represent mean ± SEM of n > 7 cells for each experimental condition from 5 independent experiments, and were compared by a Kruskal–Wallis test followed by Dunn’s multiple comparison test (*p < 0.05; **p < 0.01). For the statistics of the data presented in panels (B,C,D,E,G,H), see Supplementary file 1 and Figure 8—source data 1.
-
Figure 8—source data 1
Excel file containing all raw data and statistical tests used in Figure 8.
Each graph (B,C,D,E,G,H) is shown in a separate sheet within the file.
- https://cdn.elifesciences.org/articles/75233/elife-75233-fig8-data1-v1.xlsx
Figure 8—figure supplement 1
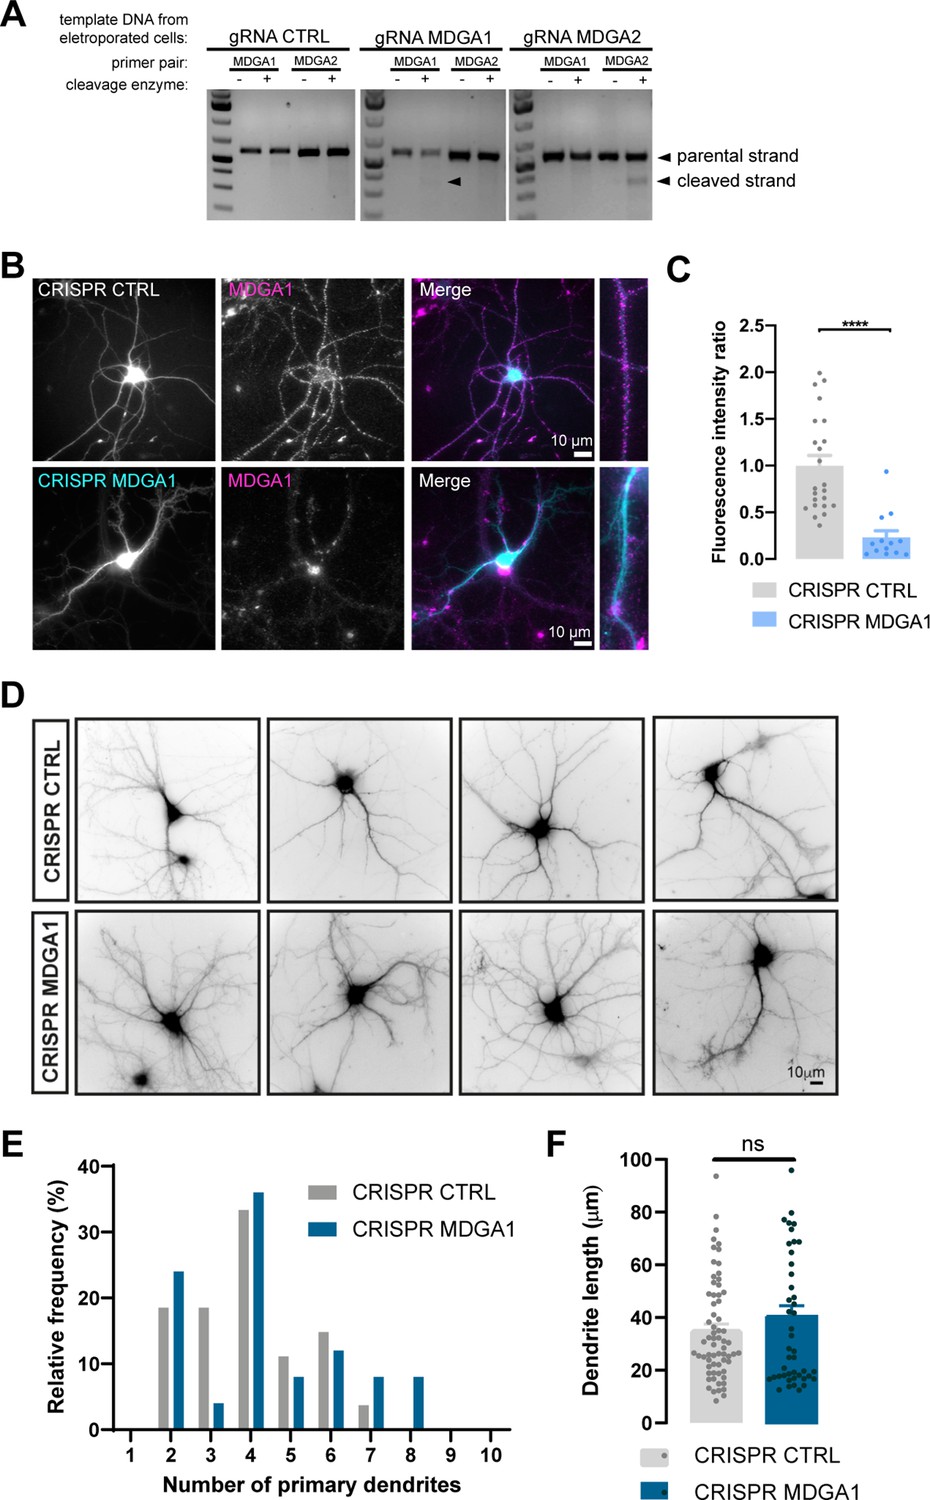
Validation of CRISPR/Cas9 knock-out of MDGA1/2.
Hippocampal neurons were electroporated at DIV 0 with CRISPR/Cas9 CTRL, CRISPR/Cas9 MDGA1, or CRISPR/Cas9 MDGA2. (A) At DIV 10, genomic DNA was extracted and a T7 endonuclease based method was used to detect genomic cleavage in the CRISPR/Cas9 system. Cleavage bands were observed only for gRNA MDGA1 and gRNA MDGA2 when primers to amplify the target sequence were used and in the presence of T7 endonuclease. (B) Neurons were live immunolabelled with anti-MDGA1 antibody at DIV 10. (C) Bar graph of fluorescence intensity ratio of MDGA1. Fluorescent signals are expressed relative to CRISPR CONTROL values. Data represent mean ± SEM of n > 10 neurons for each experimental condition and from two independent experiments. Values were compared by a Mann-Whitney test (****p < 0.0001). (D) Representative images of DIV 10 neurons electroporated with CRISPR CTRL or CRISPR MDGA1 and imaged for the GFP reporter. Scale bar, 10 μm. (E) Histogram showing the frequency distribution of primary dendrite number per cell in both conditions. (F) Bar plots showing the average primary dendrite length. Data represent mean ± SEM from n > 25 neurons out of two independent experiments, and were compared by a Mann-Whitney test (ns: not significant). For the statistics of the data presented in panels (C,E,F), see Supplementary file 1 and Figure 8—figure supplement 1—source data 1.
-
Figure 8—figure supplement 1—source data 1
Excel file containing all raw data and statistical tests used in Figure 8—figure supplement 1.
Each graph (C,E,F) is shown in a separate sheet within the file.
- https://cdn.elifesciences.org/articles/75233/elife-75233-fig8-figsupp1-data1-v1.xlsx
Figure 8—figure supplement 2
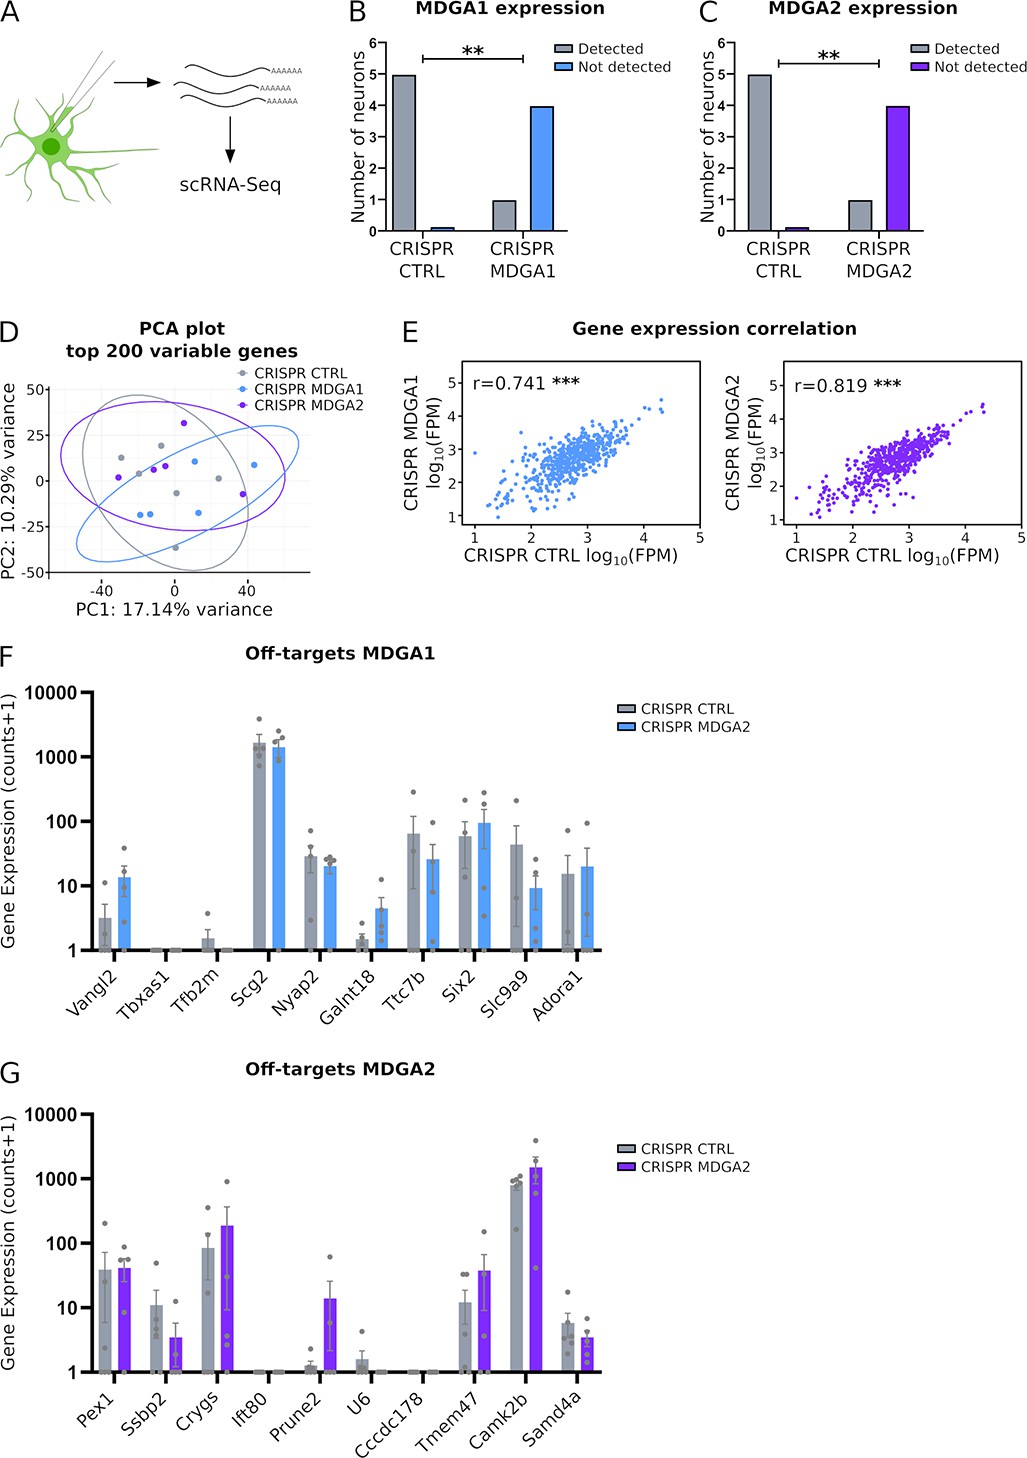
Patch-seq analysis of MDGA1, MDGA2, and off-target genes in CRISPR/Cas9 expressing neurons.
Hippocampal neurons were electroporated at DIV 0 with CRISPR CTRL, CRISPR MDGA1, or CRISPR MDGA2 plasmids, all containing a GFP reporter. (A) At DIV 10, individual GFP-positive neurons were patch-clamped and their cytosol and nucleus was extracted with a micropipet, before being processed for single-cell (sc) RNA-sequencing (n = 5 neurons analyzed in each condition). (B) Graph showing the number of neurons in which MDGA1 mRNAs were significantly detected, for neurons electroporated with either CRISPR CTRL or CRISPR MDGA1. (C) Graph showing the number of neurons in which MDGA2 mRNAs were significantly detected, for neurons electroporated with either CRISPR CTRL or CRISPR MDGA2. (D) Principal component analysis (PCA) of the top 200 variable genes expressed in all neurons, for the three conditions (CRISPR CTRL = grey, CRISPR MDGA1 = blue, and CRISPR MDGA2 = purple). Ellipses delineate the 95% confidence boundaries. The facts that PC1 and PC2 variances are low (below 20%) and that the three confidence ellipses are overlapping demonstrate that the three conditions are not statistically different. (E) Graphs showing the mRNA levels expressed as fragments per million (FPM) of the genes detected in neurons electroporated with CRISPR MDGA1 or CRISPR MDGA2, with respect to neurons electroporated with CRISPR CTRL (only genes detected in all neurons were plotted). Significant correlations were observed for both conditions, indicating that global gene expression is not affected by either CRISPR MDGA1 or CRISPR MDGA2. (F, G) Plots showing the mRNA levels of 10 off-target genes with the highest prediction score in neurons expressing CRISPR MDGA1 or CRISPR MDGA2, respectively, side by side with the corresponding levels in neurons expressing CRISPR CTRL. No significant difference between conditions was observed for any of those genes (Mann-Whitney test, ns: not significant). For the statistics of the data presented in panels (B,C,E,F,G), see Supplementary file 1 and Figure 8—figure supplement 2—source data 1.
-
Figure 8—figure supplement 2—source data 1
Excel file containing all raw data and statistical tests used in Figure 8—figure supplement 2.
Each graph (B,C,E,F,G) is shown in a separate sheet within the file.
- https://cdn.elifesciences.org/articles/75233/elife-75233-fig8-figsupp2-data1-v1.xlsx
Figure 8—figure supplement 3

MDGAs knock-out has no effect on synaptic density in DIV 14 neurons.
Dissociated neurons were electroporated at DIV 0 with either CRISPR/Cas9 control, CRISPR/Cas9 for MDGA1, or CRISPR/Cas9 for MDGA2. 14 DIV after plating, cultures were fixed, permeabilized, and endogenous PSD-95 and VGLUT1 were immunostained. (A) Representative images of dendritic segments showing PSD-95 staining (magenta), VGLUT1 staining (green), the merged images, and the nuclear EBFP control of CRISPR/cas9 construct expression. (B–E) Bar plots showing the density and area of individual PSD-95 (B, C) and VGLUT1 (D, E) puncta in the different conditions. Data represent mean ± SEM from at least three independent experiments, and were compared by a Kruskal–Wallis test followed by Dunn’s multiple comparison test (**p < 0.01; ****p < 0.0001). For the statistics of the data presented in panels (B,C,D,E), see Supplementary file 1 and Figure 8—figure supplement 3—source data 1.
-
Figure 8—figure supplement 3—source data 1
Excel file containing all raw data and statistical tests used in Figure 8—figure supplement 3.
Each graph (B,C,D,E) is shown in a separate sheet within the file.
- https://cdn.elifesciences.org/articles/75233/elife-75233-fig8-figsupp3-data1-v1.xlsx
Figure 8—figure supplement 4

MDGAs knock-out has no effect on inhibitory synapses in DIV 10 neurons.
Dissociated neurons were electroporated at DIV 0 with either CRISPR/Cas9 CTRL, CRISPR/Cas9 for MDGA1, or CRISPR/cas9 for MDGA2. 10 DIV after plating, cultures were fixed, permeabilized, and endogenous gephyrin was immunostained. (A) Representative images of dendritic segments showing gephyrin staining (magenta) and CRISPR/Cas9 (green). (B–C) Bar plots showing the density and area of individual gephyrin clusters. Data represent mean ± SEM from at least three independent experiments, and were compared by a Kruskal–Wallis test followed by Dunn’s multiple comparison test (ns: not significant). (D) Representative traces of mIPSC recordings from DIV 10 neurons expressing CRISPR/Cas9 CTRL, MDGA1, or MDGA2, clamped at + 10 mV. (E, F) Mean mIPSC frequency and amplitude, respectively, for each condition. Data represent mean ± SEM of at least 6 neurons from 3 independent experiments, and were compared by a Kruskal-Wallis test (ns: Not significant). For the statistics of the data presented in panels (B,C,E,F), see Supplementary file 1 and Figure 8—figure supplement 4—source data 1.
-
Figure 8—figure supplement 4—source data 1
Excel file containing all raw data and statistical tests used in Figure 8—figure supplement 4.
Each graph (B,C,E,F) is shown in a separate sheet within the file.
- https://cdn.elifesciences.org/articles/75233/elife-75233-fig8-figsupp4-data1-v1.xlsx
Figure 8—figure supplement 5
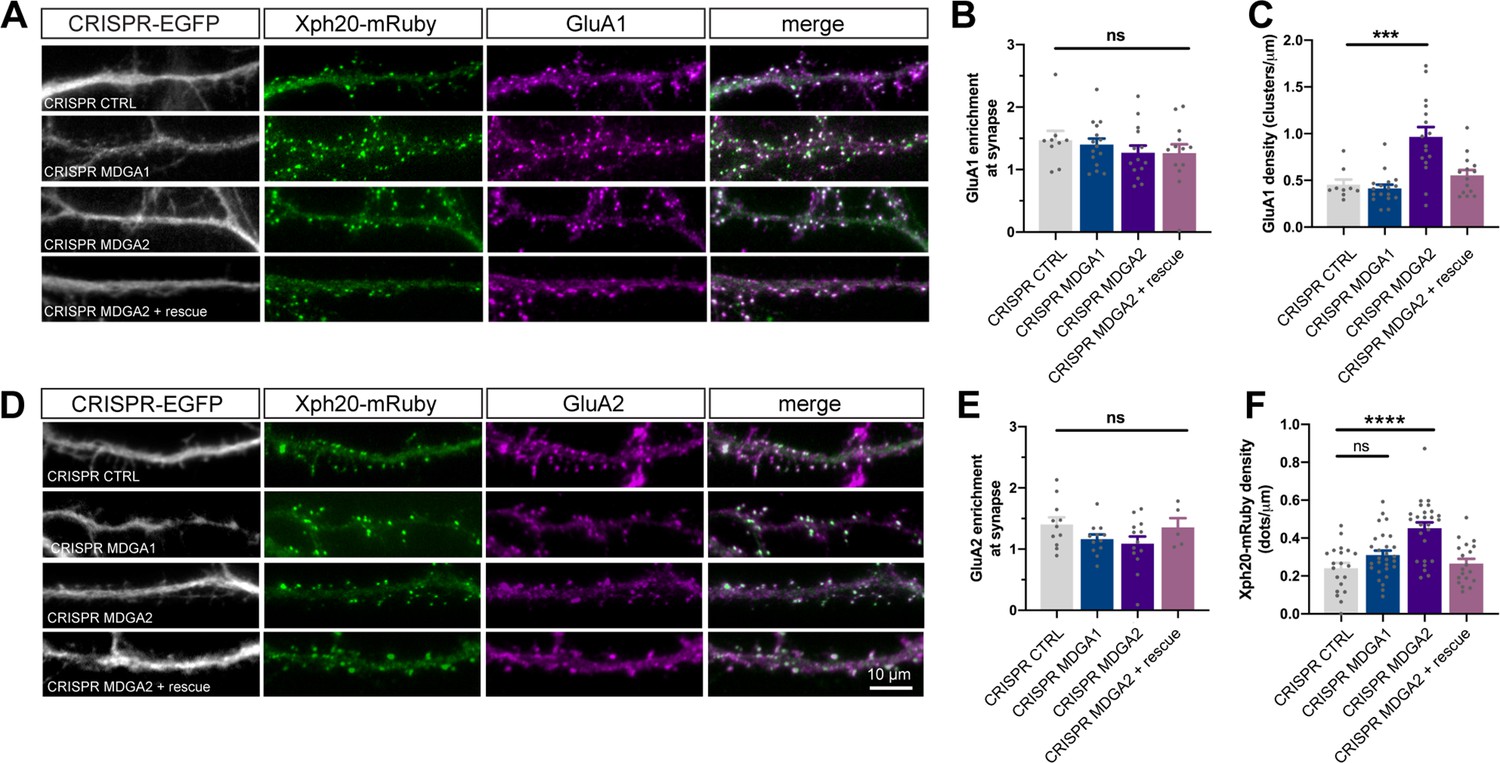
AMPAR membrane localization upon MDGA1/2 knockout.
(A, D) Live labelling of GluA1 and GluA2 with specific antibodies (magenta) in CRISPR/Cas9 (white) and Xph20-mRuby2 (green) expressing cells. (B, E) Bar graphs representing the enrichment of GluA1 or GluA2 at the synapse, respectively, evaluated by measuring the fluorescence intensity of GluA1 or GluA2 at Xph20-positive sites and normalized by the fluorescence intensity of AMPARs in the dendritic shaft. (C) GluA1 cluster density in the dendrite was evaluated by thresholding the GluA1 signal and counting the segmented dots per unit length. The same thresholding parameters were applied to all experimental conditions. (F) Xph20-mRuby2 puncta density per unit dendrite length. Results represent mean ± SEM of at least 10 neurons per condition from two independent experiments, and were compared by a Kruskal-Wallis test, followed by Dunn’s multiple comparison test (***p < 0.001; ****p < 0.0001). For the statistics of the data presented in panels (B,C,E,F), see Supplementary file 1 and Figure 8—figure supplement 5—source data 1.
-
Figure 8—figure supplement 5—source data 1
Excel file containing all raw data and statistical tests used in Figure 8—figure supplement 5.
Each graph (B,C,E,F) is shown in a separate sheet within the file.
- https://cdn.elifesciences.org/articles/75233/elife-75233-fig8-figsupp5-data1-v1.xlsx
Figure 9 with 1 supplement
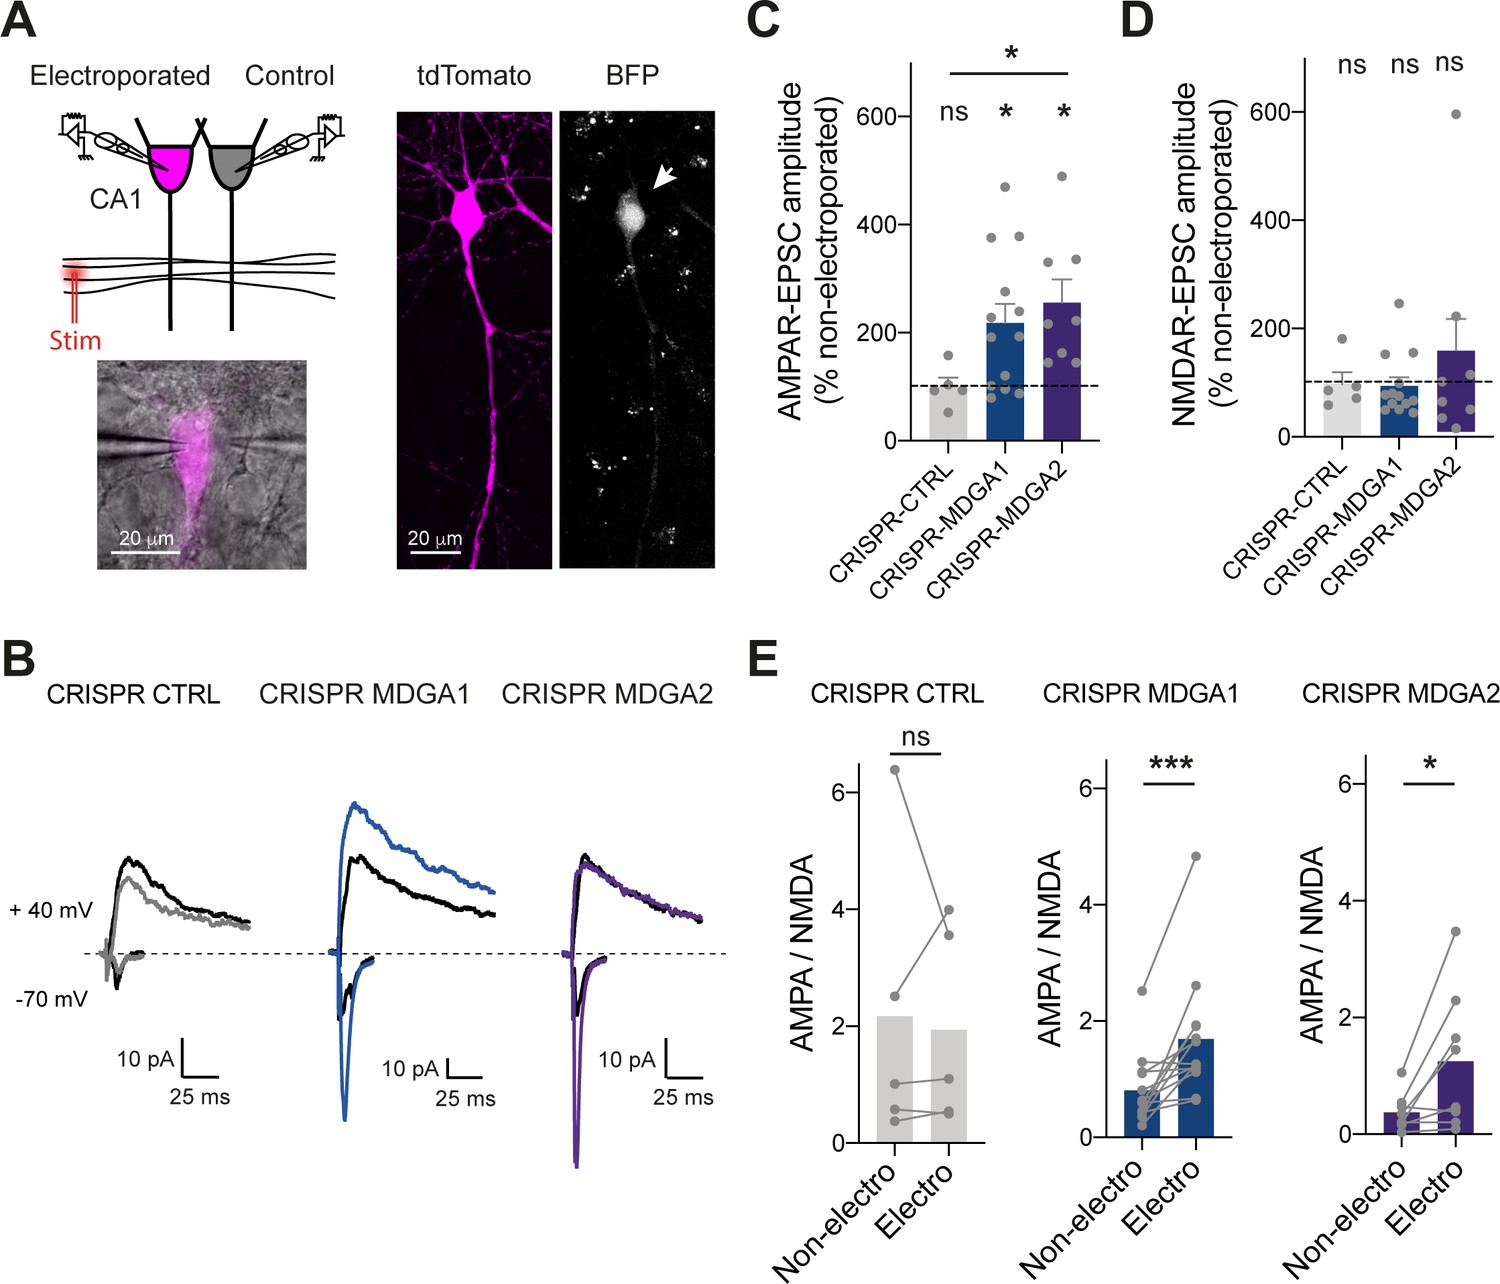
Effect of MDGA knock-out on AMPAR- and NMDAR-dependent synaptic transmission in CA1 neurons.
CA1 neurons in rat organotypic hippocampal slices were single-cell electroporated at DIV 2 with CRISPR/Cas9 CTRL, CRISPR/Cas9 MDGA1, or CRISPR/Cas9 MDGA2, plus the tdTomato volume marker. One week later, electroporated neurons and non-electroporated control neighbors were processed for dual patch-clamp recordings upon stimulation of Schaffer’s collaterals. (A) Dual whole-cell recording configuration with corresponding image from an experiment (left) and confocal images showing tdTomato (magenta) and BFP signals in an electroporated neuron (right). (B) Representative traces of evoked AMPAR- and NMDAR-mediated EPSCs recorded at –70 mV and + 40 mV, respectively. Color sample traces correspond to electroporated neurons in the three conditions, and black traces correspond to control, non-electroporated neurons. (C, D) Average AMPAR- and NMDAR-mediated EPSC amplitudes, respectively, normalized to the control condition (the dashed line indicates 100%). Data were compared to the control condition by the Wilcoxon matched-pairs signed rank test, and between themselves using one-way ANOVA followed by Tukey’s multiple comparison (*p < 0.05; ns: not significant). (E) Average ratio between paired AMPAR- and NMDAR-mediated EPSCs in the three conditions. Data were compared using the Wilcoxon matched-pairs signed rank test (***p < 0.001; *p < 0.05; ns: not significant). For the statistics of the data presented in panels (C,D,E), see Supplementary file 1 and Figure 9—source data 1.
-
Figure 9—source data 1
Excel file containing all raw data and statistical tests used in Figure 9.
Each graph (C,D,E) is shown in a separate sheet within the file.
- https://cdn.elifesciences.org/articles/75233/elife-75233-fig9-data1-v1.xlsx
Figure 9—figure supplement 1
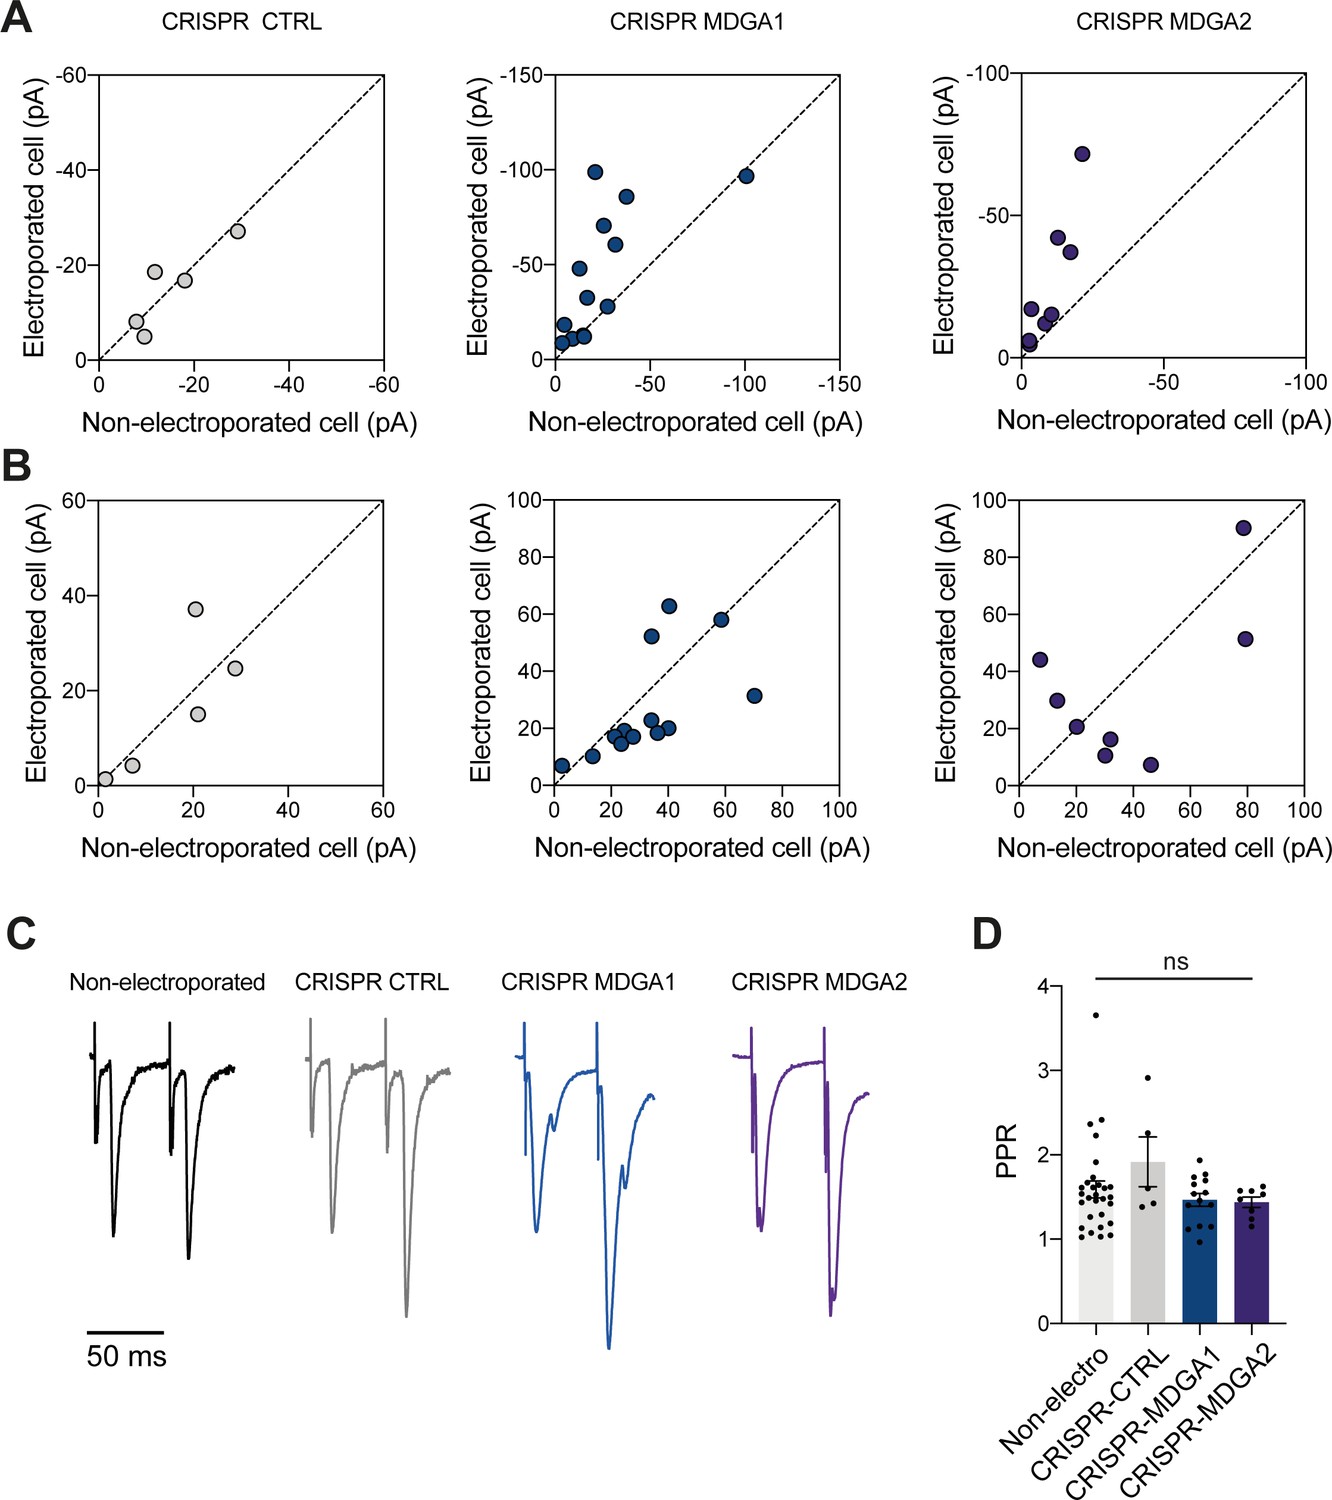
Scatter plots of AMPAR- and NMDAR-dependent EPSCs and paired pulse ratio (PPR) recorded in CA1 neurons expressing CRISPR/Cas9 to MDGA1/2.
(A, B) Scatter plots of AMPAR- and NMDAR-mediated EPSC amplitudes, respectively. CA1 neurons expressing CRISPR/Cas9 CTRL, MDGA1, or MDGA2 (y-axis) are compared to paired non-electroporated neurons (x-axis). (C) Average AMPAR-mediated EPSC traces in response to paired stimuli (50ms interstimulus interval) recorded from a non-electroporated CA1 neuron, or a neuron expressing either CRISPR/Cas9 CTRL, MDGA1, or MDGA2. (D) Average PPR measured in the four conditions (Kruskall-Wallis test, ns: not significant). For the statistics of the data presented in panels (A,B,D), see Supplementary file 1 and Figure 9—figure supplement 1—source data 1.
-
Figure 9—figure supplement 1—source data 1
Excel file containing all raw data and statistical tests used in Figure 9—figure supplement 1.
Each graph (A,B,D) is shown in a separate sheet within the file.
- https://cdn.elifesciences.org/articles/75233/elife-75233-fig9-figsupp1-data1-v1.xlsx
Figure 10
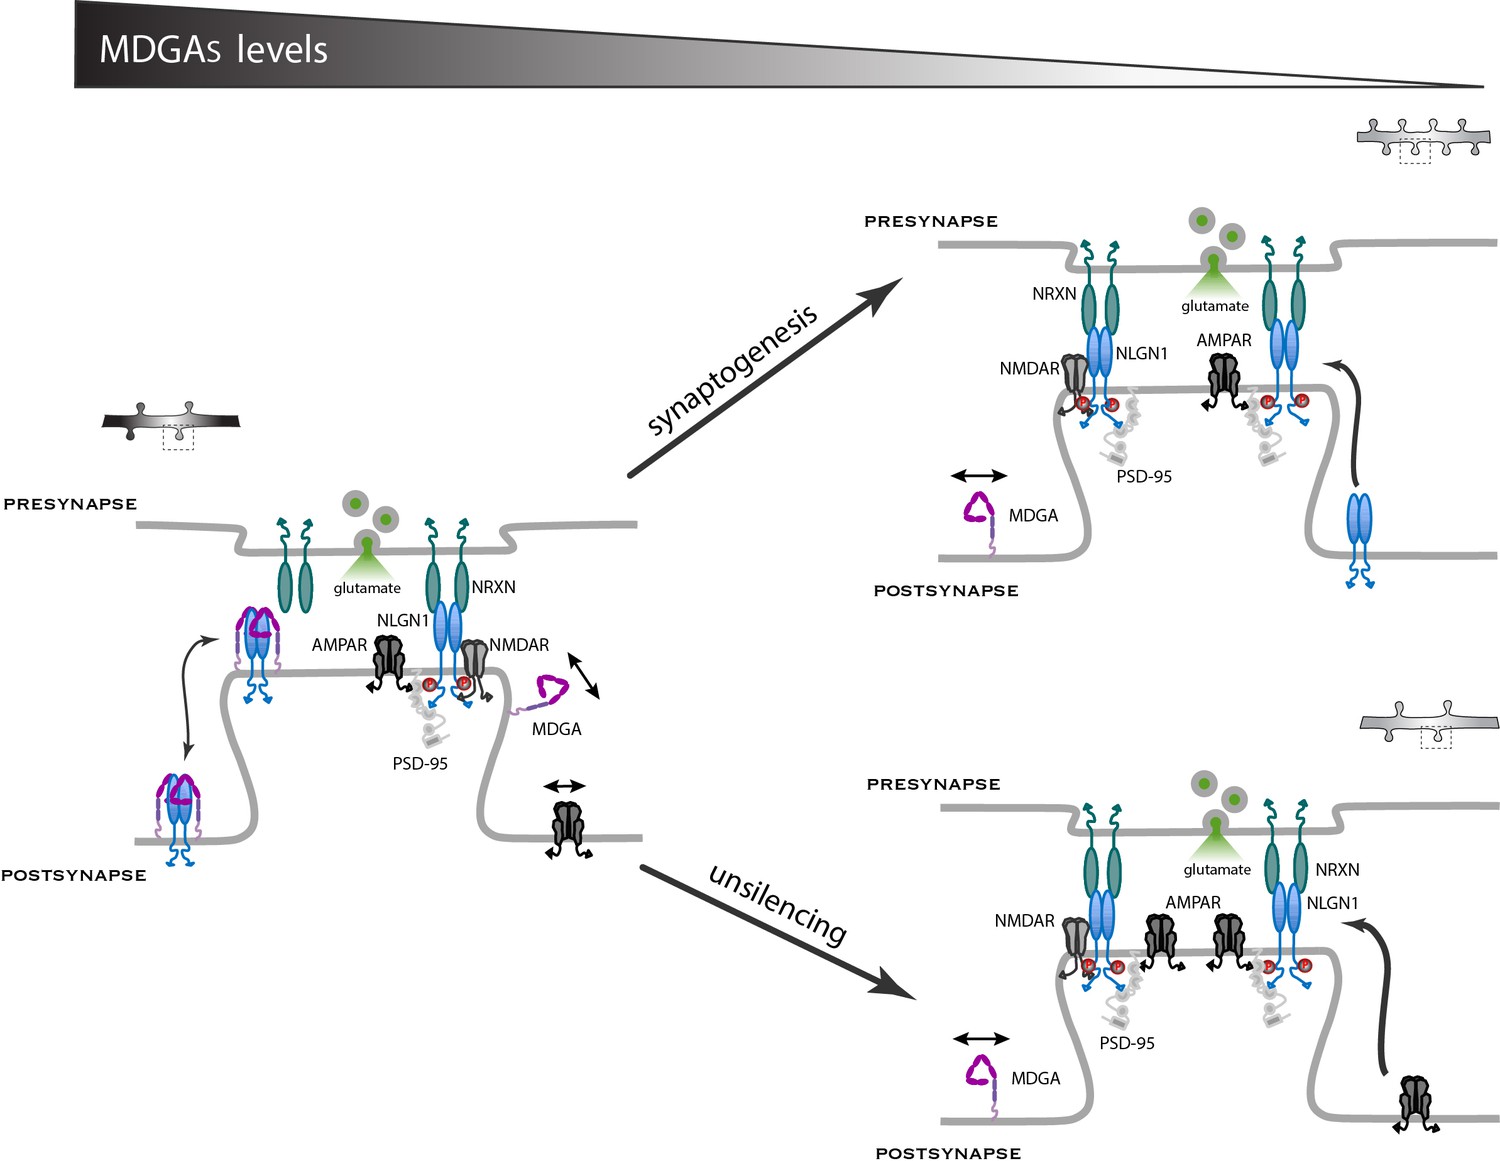
Working model for the role of MDGAs in excitatory synapse differentiation.
Since NRXNs and MDGAs compete for the binding to NLGN1, the MDGA concentration acts as a key regulator of the signaling events downstream of the NRXN-NLGN1 interaction. When the MDGA level is low in response to KD or KO (right panels), the preferential interaction of NLGN1 with NRXN favors NLGN1 tyrosine phosphorylation and the associated development of excitatory synapses containing AMPARs. When the MDGA level is high (left panel), the NRXN-NLGN1 interaction is weakened and the formation of excitatory synapses is delayed. In dissociated neurons, MDGAs primarily regulate the overall density of NLGN1 and AMPAR modules, but not the actual amount of these molecules at individual synapses (arrow ‘synaptogenesis’). In organotypic slices, MDGAs tend to keep synapses in a silent state with low amounts of AMPARs, and single-cell KO of either MDGA1 or MDGA2 in CA1 neurons promotes the selective recruitment of AMPARs (arrow ‘unsilencing’).
Author response image 1
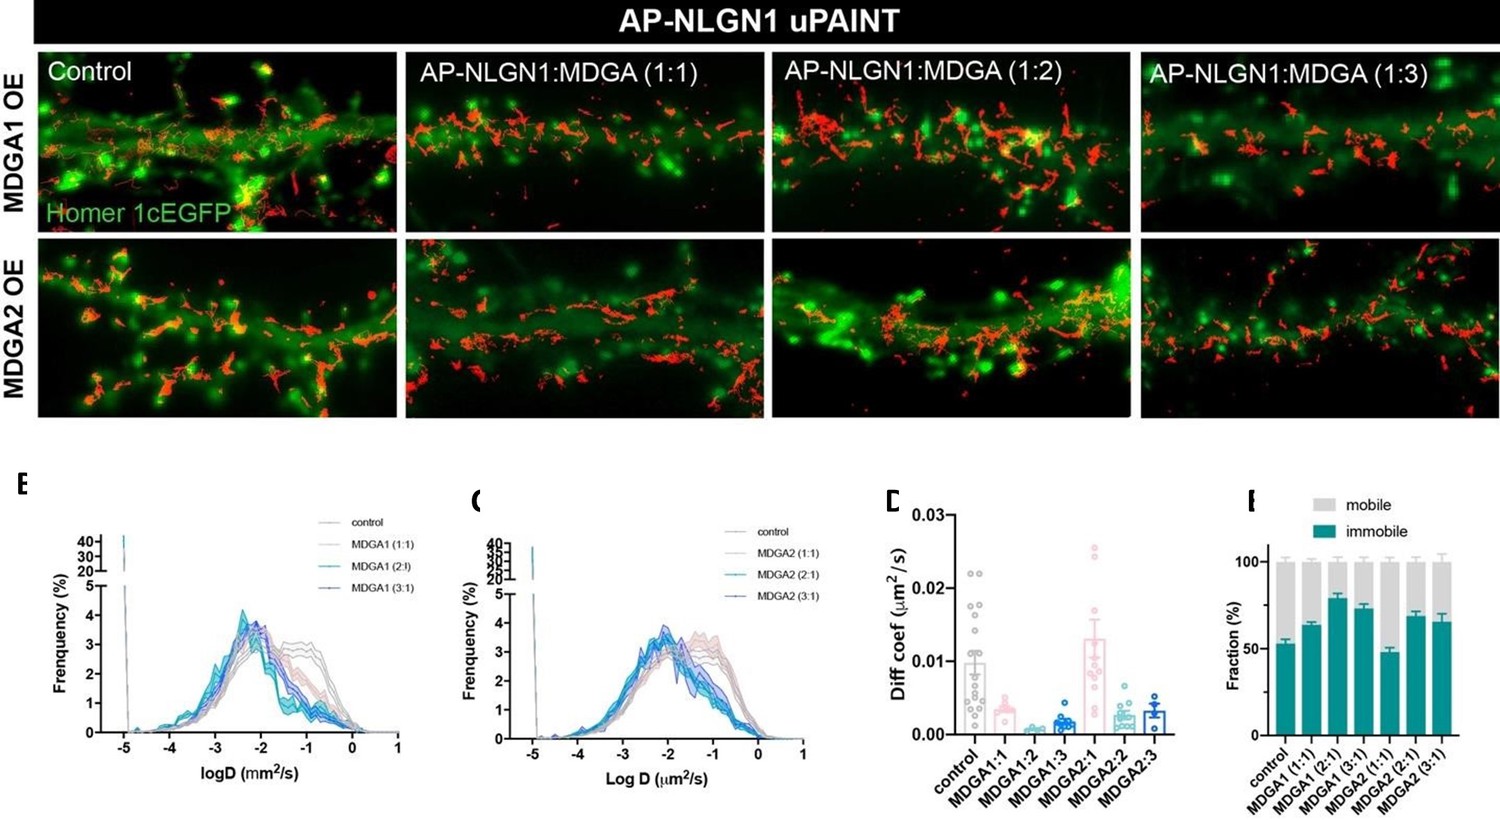
AP-NLGN1 mobility upon MDGA1 and MDGA2 overexpression.
Neurons were transfected using calcium phosphate with AP-NLGN1, Homer1c-GFP, BirAER, and V5-MDGA1 or V5-MDGA2 at DIV 7 and imaged at DIV 14. Different DNA ratios of AP-NLGN1 to MDGA were used (1:1; 1:2; 1:3). (A) APNLGN1 sparsely labelled with mSA conjugated to STAR 635P for single molecule tracking. (B,C) Semi-log plots of the distribution of AP-NLGN1 diffusion coefficients. DNA ratios are indicated in the inset of each plot. Curves represent the mean ± SEM of at least 4 neurons per condition from two independent experiments. (D) Bar plot of median diffusion coefficients averaged per cell in the different conditions. (E) Plot of the mobile and immobile fractions of AP-NLGN1 as a function of MDGA overexpression. The threshold between mobile and immobile molecules was set at D = 0.01 µm²/s.
Author response image 2
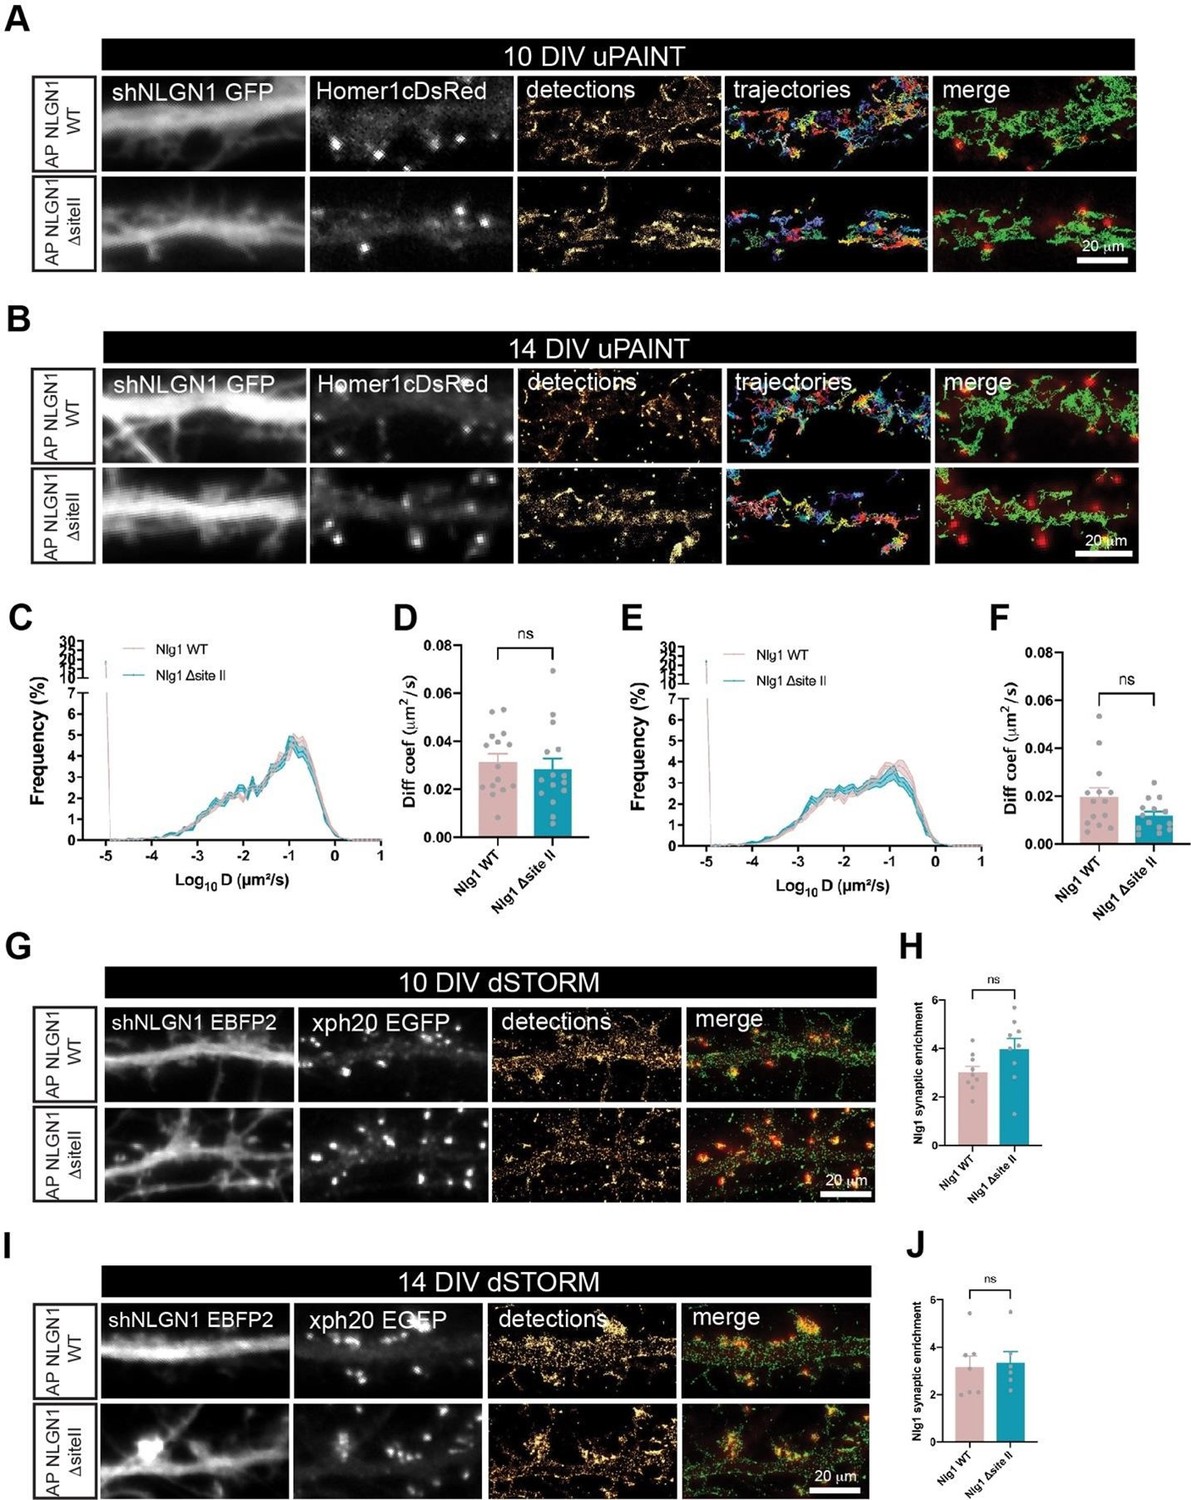
AP-NLGN1 ΔsiteII mobility and localization.
Hippocampal neurons were electroporated at DIV 0 with a combination of shRNA to NLGN1 (GFP or EBFP2 reporter), rescue AP-NLGN1 WT or rescue AP-NLGN1 ΔsiteII, biotin ligase BirAER, and Homer1c-DsRed or Xph20-EGFP as post-synaptic merkers. (A-F) uPAINT experiments were performed at DIV 10 and 14, after labelling neurons expressing AP-NLGN1 WT or ΔsiteII with 1 nM STAR 635P-conjugated mSA. (A, B) Representative images of dendritic segments showing the shNLGN1 reporter GFP signal, Homer1c-DsRed and the corresponding single molecule detections (magenta) and trajectories (random colors) acquired during an 80 s stream, for the indicated time in culture. (C, E) Corresponding semi-log plots of the distributions of diffusion coefficients for AP-NLGN1 WT or ΔsiteII at DIV 10 and 14 respectively. (D, F) Graph of the median diffusion coefficient, averaged per cell, in the different conditions. Data represent mean ± SEM of n > 14 neurons for each experimental condition from at least three independent experiments, and were compared by a Mann-Whitney test (ns: not significant). (G-J) dSTORM experiments were performed at DIV 10 or 14, after labelling neurons with 100 nM Alexa 647-conjugated mSA. (G, I) Representative images of dendritic segments showing the shNLGN1 reporter EBFP2, Xph20-EGFP positive synapses, the super-resolved localization map of all APNLGN1 (WT or ΔsiteII) single molecule detections (gold), and merged images (Xph20-EGFP in red and detections in green). Scale bars, 20 µm. (H, J) Bar plots representing the enrichment of AP-NLGN1 WT or AP-NLGN1 ΔsiteII localizations at synapses. Values were obtained from at least three independent experiments and n > 6 neurons for each experimental condition. Data were compared by a Mann-Whitney test (ns: not significant).
Author response image 3
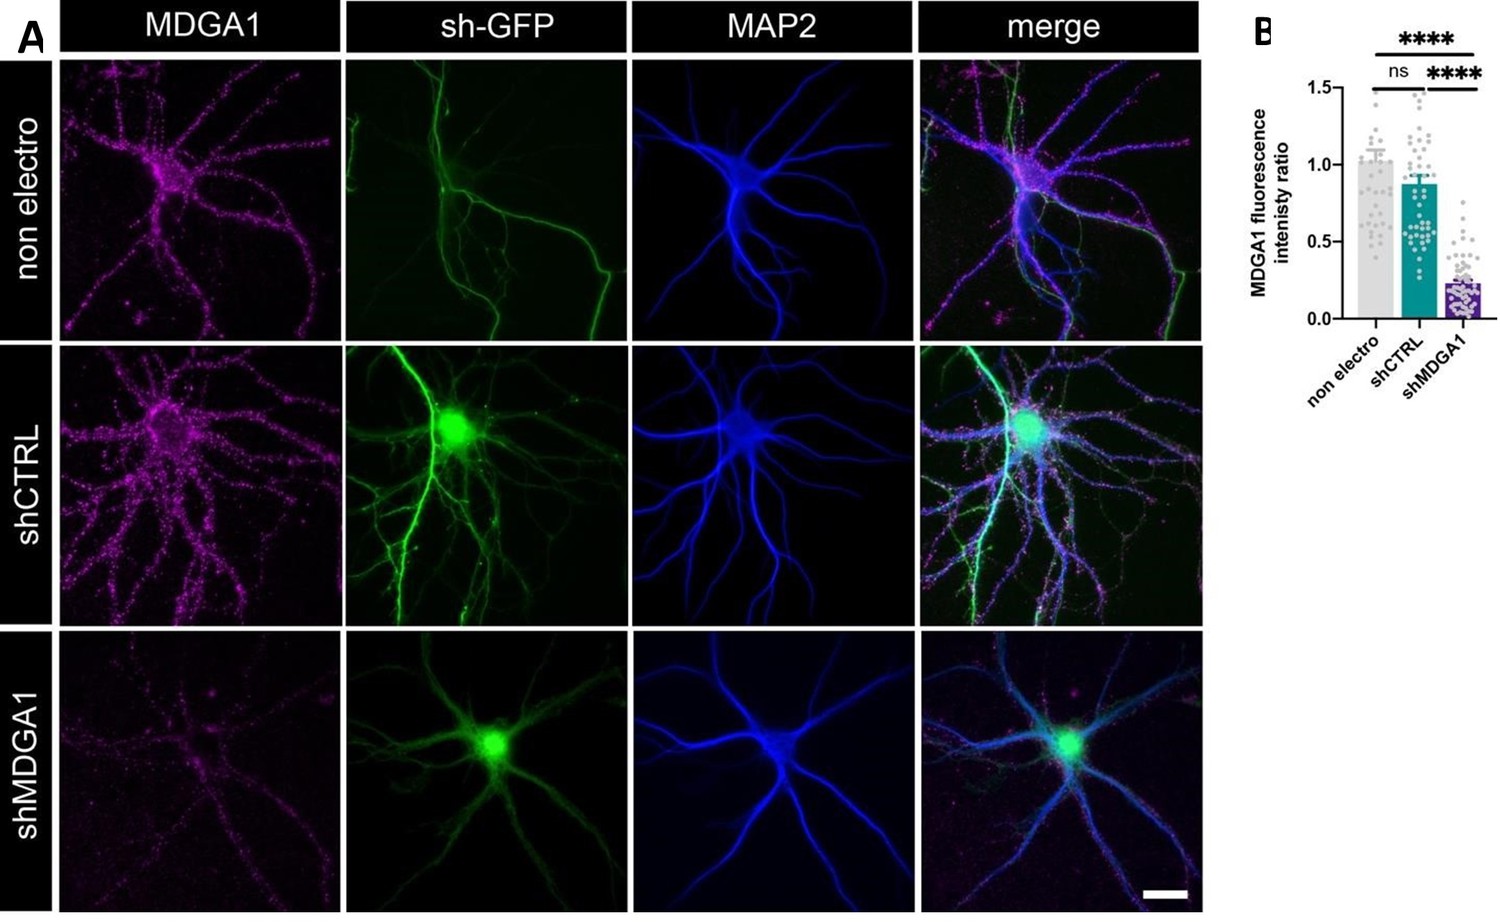
Validation of shRNA MDGA1.
Immunodetection of endogenous MDGA1 in non-electroporated neurons and in neurons electroporated with shCTRL or shMDGA1 at DIV 0. (A) Images show MDGA1 in magenta, the shRNA GFP reporter in green, and MAP-2 in blue. Scale bar: 20 µm. (B) Bar plot showing the anti-MDGA1 fluorescence intensity normalized to the average signal measured on non-electroporated neurons (non electro). Data represent the mean ± SEM of n > 40 cells for each condition from two independent experiments, and were compared by a Kruskall-Wallis test followed by Dunn’s multiple comparison test (ns: not significant; **** p < 0.001).
Author response image 4
Validation of MDGA1 rescue.
Immunodetection of endogenous MDGA1 in non-electroporated neurons and in neurons electroporated at DIV 0 with shCTRL or shMDGA1, plus rescue AP-MDGA1. (A) Images show MDGA1 in magenta, the shRNA GFP reporter in green, and MAP-2 in blue. Scale bar: 10 µm. (B) Bar plot showing the anti-MDGA1 fluorescence intensity normalized to the average signal measured on non-electroporated neurons (non electro). Data represent the mean ± SEM of n > 50 cells for each condition from three independent experiments, and were compared by a Kruskall-Wallis test followed by Dunn’s multiple comparison test (**p < 0.01, ****p < 0.001).
Author response image 5
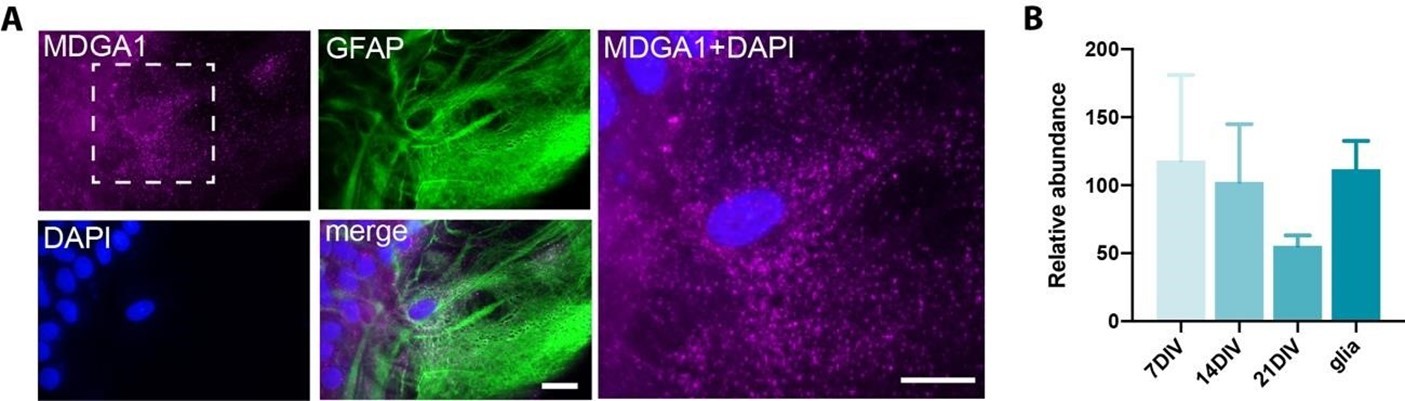
MDGA1 expression in astrocytes.
(A) Live immunolabelling of endogenous MDGA1 (magenta) in astrocytes cultured for 28 DIV. Astrocytes were counterstained with GFAP (green) and DAPI (blue). Scale bars, 15 µm. (B) RT-qPCR data showing the relative expression of MDGA1 mRNA in hippocampal neurons at DIV 7, 14 and 21, and astrocyte cultures at DIV 28.
Tables
Key resources table
| Reagent type (species) or resource | Designation | Source or reference | Identifiers | Additional information |
|---|---|---|---|---|
| Sequence-based reagent | gRNA control | This study | 5’-ATATTTCGGCAGTTGCAGCA-3' | CRISPR/Cas9Construction |
| Sequence-based reagent | gRNA MDGA2 | This study | 5’-ATTTAGTGTACGGTCTCGTG-3’ | CRISPR/Cas9Construction |
| Sequence-based reagent | gRNA MDGA1 | This study | 5’-CTTCAACGTACGAGCCCGGG-3’ | CRISPR/Cas9Construction |
| Sequence-based reagent | AP tag sequence | This study | 5´-GGCCTGAACGAtATCTTCGAGGCCCAG AAGATCGAGTGGCACGAG-3´ | AP tag plasmids |
| Sequence-based reagent | MDGA1 CRISPR validation primers | This study | 5´-GGGAAGAGGTAGAGACCCAAGT-3´5´-CCTCCATCAACACATAACGAAA-3´ | CRISPR/Cas9Validation |
| Sequence-based reagent | MDGA2 CRISPR validation primers | This study | 5´-GCTGATAGGGAAGGACAGACAG-3´5´-TAAATCCAAGACTGCAAGAGCC-3´ | CRISPR/Cas9validation |
| Sequence-based reagent | MDGA1 RTqPCR primers | This study | 5'-GTTCTACTGCTCCCTCAACC-3'5'-CGTTACCTTTATTACCGCTGAG-3' | RTqPCR |
| Sequence-based reagent | MDGA2 RTqPCR primers | This study | 5´-AAGGTGACATCGCCATTGAC-3'5'-CCACGGAATTCTTAGTTGGTAGG-3´ | RTqPCR |
| Sequence-based reagent | U6 RTqPCR primers | This study | 5′-GGAACGATACAGAGAAGATTAGC-3′5′-AAATATGGAACGCTTCACGA-3′ | RTqPCR |
| Sequence-based reagent | SDHA RTqPCR primers | This study | 5′-TGCGGAAGCACGGAAGGAGT-3′5′-CTTCTGCTGGCCCTCGATGG-3′ | RTqPCR |
| Sequence-based reagent | Template switching oligo | This study | 5′-AAGCAGTGGTATCAACGCAGAGTACrGrG + G-3′ | Reverse transcription for RNA-seq |
| Genetic reagent | pCMV6-XL4 | Origene #pCMVXL4 | MDGA1 expression | |
| Recombinant DNA reagent | V5-MDGA1(R.norvegicus) | A.M. Craig (University of British Columbia, Canada) Pettem et al., 2013 | Neuron electroporation | |
| Recombinant DNA reagent | V5-MDGA2(R.norvegicus) | A.M. Craig (University of British Columbia, Canada) | Neuron electroporation | |
| Recombinant DNA reagent | HA-MDGA1(R.norvegicus) | A.M. Craig (University of British Columbia, Canada) Pettem et al., 2013 | Neuron electroporation | |
| Recombinant DNA reagent | HA-MDGA2(R.norvegicus) | A.M. Craig (University of British Columbia, Canada) Pettem et al., 2013 | Neuron electroporation | |
| Recombinant DNA reagent | shMDGA1(R.norvegicus) | A.M. Craig (University of British Columbia, Canada) Pettem et al., 2013 | Neuron electroporation | |
| Recombinant DNA reagent | shMORB(R.norvegicus) | A.M. Craig (University of British Columbia, Canada) Pettem et al., 2013 | Neuron electroporation | |
| Recombinant DNA reagent | HA-MDGA1 rescue(R.norvegicus) | A.M. Craig (University of British Columbia, Canada) Pettem et al., 2013 | Neuron electroporation | |
| Recombinant DNA reagent | AP-NLGN1(M. musculus) | A.Ting (Stanford University, USA) | Neuron electroporation | |
| Recombinant DNA reagent | BirAER(M. musculus) | A.Ting (Stanford University, USA) | Neuron electroporation | |
| Recombinant DNA reagent | mApple.V5-MDGA2 rescue(R.norvegicus) | A.Ting (Stanford University, USA) Loh et al., 2016 | Plasmid construction | |
| Recombinant DNA reagent | shMDGA2(R.norvegicus) | A.Ting (Stanford University, USA) Loh et al., 2016 | Neuron electroporation | |
| Recombinant DNA reagent | AP-MDGA1 rescue(R.norvegicus) | This paper | Obtained with HD-In-Fusion kit | |
| Recombinant DNA reagent | AP-MDGA2 rescue(R.norvegicus) | This paper | Obtained with HD-In-Fusion kit | |
| Recombinant DNA reagent | pSpCas9(BB)–2A-GFP (PX458) | Adgene #48,138 | RRID:Adgene_48138 | |
| Recombinant DNA reagent | shNLGN1(M. musculus) | P.Scheiffele (Biozentrum, Basel) | Neuron electroporation | |
| Recombinant DNA reagent | HA-NLGN1(M. musculus) | P.Scheiffele (Biozentrum, Basel) | Obtained with HD-In-Fusion kit | |
| Recombinant DNA reagent | AP-NLGN1 rescue(M. musculus) | Chamma et al., 2016a | Neuron electroporation | |
| Recombinant DNA reagent | Homer1c-DsRed | Mondin et al., 2011 | Neuron electroporation | |
| Recombinant DNA reagent | GFP-NRXN1β | M.Missler (Münster University, Germany) Neupert et al., 2015 | Neuron electroporation | |
| Recombinant DNA reagent | GFP-GPI | Renner et al., 2009 | Neuron electroporation | |
| Recombinant DNA reagent | pCAG_Xph20-eGFP-CCR5TC | RRID:Adgene_135530 | Neuron electroporation | |
| Recombinant DNA reagent | pCAG_Xph20-mRuby2_CCR5TC | RRID:Adgene_135531 | Neuron electroporation | |
| Peptide, recombinant protein | Anti GFP nanobody | Chamma et al., 2016a | GFP labelling uPAINT, dSTORM | |
| Peptide, recombinant protein | mSA | Chamma et al., 2017 | AP-biotin labelling uPAINT, dSTORM | |
| Cell line | COS-7 from ECACC | Sigma-AldrichAcc Nc 87021302Lot 15I032 passage + 4 | RRID:CVCL_0224 | Cell surface cluster assays, protein pull-down |
| Cell line | HEK-293T from ECACC | Sigma-AldrichAcc Nc 12022001Lot 16G020 Passage + 6 | RRID:CVCL_0063 | MDGA1 peptide production |
| Chemical compound, drug | Bicuculine | TOCRIS #0130/50 | RRID:SCR_003689 | Block inhibitory synaptic transmission |
| Chemical compound, drug | Phosphocreatine | Calcbiochem#2380–5 GM | RNA extraction | |
| Chemical compound, drug | Atto 647 N | Atto-Tec | Coupled to anti GluA2 antibody | |
| Chemical compound, drug | STAR 635 P | Abberior | Coupled to mSA | |
| Chemical compound, drug | Alexa Fluor 647 | Thermo Fischer Scientific | Coupled to mSA | |
| Chemical compound, drug | V5 tag Fab fragment | Abnova #RAB00032 | Coupled to flurophores | |
| Chemical compound, drug | QIAzol Lysis Reagent | Qiazol | RTqPCR | |
| Chemical compound, drug | X- tremeGENE | Transfection Reagent, Roche #6366546001 | RRID:SCR_001326 | COS7 cells transfection |
| Chemical compound, drug | Ribolock | Thermo Fisher Scientific #E00381 | RNase inhibitor | |
| Commercial assay, kit | In-Fusion HD Cloning Kit | Takara Bio#639,642 | Plasmid construction | |
| Commercial assay, kit | MycoAlert Mycoplasma Detection Kit | Lonza# LT07-218 | Lot number: 0000312202 | Mycoplasma detection in cell lines |
| Commercial assay, kit | T7 endonuclease based method | GeneArt Genomic detection kit, Thermo Fisher Scientific #A24372 | CRISPR validation | |
| Commercial assay, kit | Direct-Zol RNA microprep | Zymo Research cat#R2062 | RTqPCR | |
| Commercial assay, kit | Maxima First Strand cDNA Synthesis kit | Thermo Fischer Scientific # K1641 | RTqPCR | |
| Commercial assay, kit | Dynabeads Protein G | Thermo Fisher Scientific #11,004D | RRID:SCR_008452 | NLGN pull down |
| Commercial assay, kit | Dynabeads M-280 | Thermo Fisher Scientific #11,205D | NLGN pull down | |
| Commercial assay, kit | ClarityWestern blot ECL | Bio-Rad#170–5061 | ||
| Antibody | Actin (mouse monoclonal) | Sigma-Aldrich#A5316 | RRID:AB_476743 | (1:10,000 WB) |
| Antibody | βIII tubulin (rabbit polyclonal) | Abcam#18,207 | RRID:AB_444319 | (1:25,000 WB) |
| Antibody | GFP (mouse monoclonal) | Sigma-Aldrich#11814460001 | RRID:AB_390913 | (1:1000 WB) |
| Antibody | HA (rat monoclonal) | Roche#11867423001 | RRID:AB_390918 | (1:1000 WB) |
| Antibody | HA (rabbit monoclonal) | Cell Signaling #3,724 | RRID:AB_10693385 | |
| Antibody | MDGA1 (rabbit polyclonal) | Synaptic Systems#421,002 | RRID:AB_2800520 | 1:50 ICC(1:500 WB) |
| Antibody | GluA1 (rabbit polyclonal) | Agrobio (clone G02141) | - | (1:50 ICC) |
| Antibody | GluA2 (mouse monoclonal) | E.Gouaux (OSHU, Vollum Institute, Portland) | - | (1:200 ICC) |
| Antibody | NLGN1/2/3/4 (rabbit polyclonal) | Synaptic Systems#129,213 | RRID:AB_2619812 | NLGN pull down (1:1000 WB) |
| Antibody | PSD-95 (mouse monoclonal) | Thermo Fischer Scientific #MA1-046 | RRID:AB_2092361 | 1:200 ICC(1:2000 WB) |
| Antibody | Gephyrin (mouse monoclonal) | Synaptic Systems#147,111 | RRID:AB_887719 | (1:2000 ICC) |
| Antibody | VGLUT1 (guinea pig polyclonal) | Merck Millipore#AB5905 | RRID:AB_2301751 | (1:2000 ICC) |
| Antibody | VGAT (guinea pig polyclonal) | Synaptic Systems#131,004 | RRID:AB_887873 | (1:1,000 ICC) |
| Antibody | Synaptophysin (mouse monoclonal) | Sigma-Aldrich# S5768 | Clone SVP-38RRID:AB_477523 | (1:2000 WB) |
| Antibody | Tubulin (mouse monoclonal) | Sigma-Aldrich#T4026 | RRID:AB_477577 | (1:5000 WB) |
| Antibody | MAP-2 (mouse monoclonal) | Sigma-Aldrich#M4403 | RRID:AB_477193 | (1:2000 ICC) |
| Antibody | p-tyrosine (mouse monoclonal) | Cell Signaling#9,411 | RRID:AB_331228 | (1:1000 WB) |
| Antibody | Anti-mouse HRP (donkey polyclonal) | Jackson Immunoresearch #715-035-150 | RRID:AB_2340770 | (1:5000 WB) |
| Antibody | Anti-mouse IRDye680LT(goat polyclonal) | LICOR #926–68020 | RRID:AB_10706161 | (1:10,000 WB) |
| Antibody | Anti-mouseIRDye 800LT(goat polyclonal) | LICOR #926–32210 | RRID:AB_26218442 | (1:10,000 WB) |
| Antibody | Anti-rabbit HRP (donkey polyclonal) | Jackson Immunoresearch #711-035-152 | RRID:AB_10015282 | (1:5000 WB) |
| Antibody | Anti-rabbitIRDye 680LT(goat polyclonal) | LICOR #926–68021 | RRID:AB_10706309 | (1:10,000 WB) |
| Antibody | Anti-rabbit IRDye800LT(goat polyclonal) | LICOR #926–32211 | RRID:AB_621843 | (1:10,000 WB) |
| Antibody | Anti-mouse Alexa488 (goat polyclonal) | Thermo Scientific #A11001 | RRID:AB_2534069 | (1:1,000 ICC) |
| Antibody | Anti-mouse Alexa 568 (goat polyclonal) | Thermo Scientific #A11031 | RRID:AB_144696 | (1:1,000 ICC) |
| Antibody | Anti-mouse Alexa 647 (goat polyclonal) | Thermo Scientific #A21235 | RRID:AB_2535804 | (1:1,000 ICC) |
| Antibody | Anti-rabbit Alexa488 (goat polyclonal) | Thermo Scientific #A11008 | RRID:AB_143165 | (1:1,000 ICC) |
| Antibody | Anti-rabbit Alexa 568 (goat polyclonal) | Thermo Scientific #A11011 | RRID:AB_143157 | (1:1,000 ICC) |
| Antibody | Anti-rabbit Alexa 647 (goat polyclonal) | Thermo Scientific #A31576 | RRID:AB_10374303 | (1:1,000 ICC) |
| Antibody | Anti-rabbit Alexa 555 (donkey polyclonal) | Invitrogen#A32794 | RRID:AB_2762834 | (1:1,000 ICC) |
| Antibody | Anti-rat Alexa 488 (goat polyclonal) | Thermo Scientific #A11073 | RRID:AB_2534117 | (1:1,000 ICC) |
| Antibody | Anti-rat Alexa 568 (goat polyclonal) | Thermo Scientific #A11077 | RRID:AB_2534121 | (1:1,000 ICC) |
| Antibody | Anti Rat Alexa 647 (goat polyclonal) | Thermo Scientific #A21247 | RRID:AB_141778 | (1:1,000 ICC) |
| Antibody | Anti guinea pig DyLight 405 (goat polyclonal) | Jackson ImmunoResearch #106475003 | RRID:AB_2337432 | (1:1,000 ICC) |
| Antibody | Anti-guinea pig Alexa488 (goat polyclonal) | Thermo Scientific #A11008 | RRID:AB_143165 | (1:1,000 ICC) |
| Antibody | Anti-guinea pig Alexa 568 (goat polyclonal) | Thermo Scientific #A11075 | RRID:AB_141954 | (1:1,000 ICC) |
| Antibody | Anti guinea pig Alexa 647 (goat polyclonal) | Thermo Scientific #A21450 | RRID:AB_2141882 | (1:1,000 ICC) |
| Software, algorithm | Metamorph | Molecular devices | RRID:SCR_002368 | Image analysis |
| Software, algorithm | Graphpad | PRISM | RRID:SCR_002798 | Statistical analysis |
| Software, algorithm | ChopChop | Labun et al., 2019 | CRISPR/Cas9 design | |
| Software, algorithm | ImageJ | National Center for Microscopy and Imaging Research | RRID:SCR_001935 | Western-blot quantitation |
| Software, algorithm | cutadapt | Martin, 2011 | RNA-seq | |
| Software, algorithm | fastp | Chen et al., 2018 | RNA-seq | |
| Software, algorithm | STAR | Dobin et al., 2013 | RNA-seq | |
| Software, algorithm | DESeq2 | Love et al., 2014 | RNA-seq |
Table 1
CRISPR off-targets of MDGA1 gRNA with 4 mismatches.
| Name off-target sequence for MDGA1 gRNA | CFD score |
|---|---|
| intergenic_Vangl2 | 0.36 |
| intron_Tbxas1 | 0.29 |
| intergenic_SCCPDH|TFB2M | 0.21 |
| intergenic_Scg2|ENSRNOG00000037663 | 0.18 |
| intergenic_ENSRNOG00000037633|Nyap2 | 0.17 |
| intron_Galnt18_1 | 0.16 |
| intergenic_Ttc7b|Rps6ka5 | 0.16 |
| intergenic_Six2|Srbd1 | 0.12 |
| intron_Slc9a9_8 | 0.11 |
| intergenic_Adora1|Myog_13 | 0.1 |
Table 2
CRISPR off-targets of MDGA2 gRNA with 4 mismatches.
| Name off target sequence for MDGA2 gRNA | CFD score |
|---|---|
| exon_Pex1_chr4 | 0.44 |
| intron_Ssbp2_chr2 | 0.25 |
| intergenic_Prune2|LOC102546963_chr1 | 0.2 |
| intergenic_Crygs|AABR07034636.1_chr11 | 0.17 |
| intron_Ift80_chr2 | 0.15 |
| intergenic_LOC685114|Ccdc178_chr18 | 0.15 |
| intergenic_U6|AABR07048636.1_chr5 | 0.14 |
| intron_Tmem47_chrX | 0.13 |
| intron_Camk2b_chr14 | 0.07 |
| intergenic_Samd4a|Gch1_chr15 | 0.07 |
Author response table 1
MDGA1 potential gRNAs [ID Pub Med: 309659; ENSRNOG00000000536].
| Rank | Target sequence | Genomic location | Stra nd | GC cont ent (%) | Self-complementarity | MM0 | MM1 | MM2 | MM3 | Efficie ncy |
|---|---|---|---|---|---|---|---|---|---|---|
| 1 | TGCAGCGTCTCCAACGACGTGGG | chr20:8526603 | - | 60 | 1 | 0 | 0 | 0 | 0 | 70.24 |
| 2 | GAGCTTCAGTGCGAAGTGCGCGG | chr20:8527460 | - | 60 | 1 | 0 | 0 | 0 | 0 | 66.16 |
| 3 | CTTCAACGTACGAGCCCGGGAGG | chr20:8527275 | - | 65 | 0 | 0 | 0 | 0 | 0 | 64.49 |
| 4 | CGTCCGAGGCAACTTCTACCAGG | chr20:8534783 | - | 60 | 1 | 0 | 0 | 0 | 0 | 61.12 |
| 5 | ACACGTTACGCACAGACACCTGG | chr20:8533927 | + | 55 | 0 | 0 | 0 | 0 | 0 | 59.11 |
Author response table 2
MDGA2 potential gRNAs [ID Pub Med: 314180; ENSRNOG00000000618].
| Rank | Target sequence | Genomic location | Stra nd | GC cont ent (%) | Self-complemetarity | MM0 | MM1 | MM2 | MM3 | Efficie ncy |
|---|---|---|---|---|---|---|---|---|---|---|
| 1 | ATTTAGTGTACGGTCTCGTGTGG | chr6:89291822 | - | 45 | 0 | 0 | 0 | 0 | 0 | 67.1 |
| 2 | GTGCACAATCCGAACCGTCGGGG | chr6:88917044 | + | 60 | 0 | 0 | 0 | 0 | 0 | 63.54 |
| 3 | AGTCAGCACACGTATCGGATAGG | chr6:88556575 | + | 50 | 1 | 0 | 0 | 0 | 0 | 62.59 |
| 4 | TGCACAATCCGAACCGTCGGGGG | chr6:88917045 | + | 60 | 1 | 0 | 0 | 0 | 0 | 62.15 |
| 5 | AGGGTCTATACCATCCGGGAAGG | chr6:88916979 | - | 55 | 1 | 0 | 0 | 0 | 0 | 62.06 |
Author response table 3
CRISPOR evaluation of MDGA1 gRNAs.
| gene | targetSeq | MITSpecScore | CFDSpecScore | Off-targetCount | Doench '16-Score | Out-of-Frame-Score | LindelScore |
|---|---|---|---|---|---|---|---|
| MDGA1 | CGCGTGAGCCGCGAAATGAGCGG | 99 | 99 | 4 | 49 | 54 | 83 |
| MDGA1 | AGCCATTATAGCGAGCCGTCTGG | 98 | 98 | 21 | 57 | 55 | 80 |
| MDGA1 | ATGGCTTCAACGTACGAGCCCGG | 98 | 99 | 28 | 53 | 74 | 78 |
| MDGA1 | TGCCAGACGGCTCGCTATAATGG | 97 | 99 | 22 | 32 | 59 | 81 |
| MDGA1 | CTTCAACGTACGAGCCCGGGAGG | 97 | 98 | 17 | 64 | 70 | 78 |
Author response table 4
CRISPOR evaluation of MDGA2 gRNAs.
| Gene | targetSeq | MITSpecScore | CFDSpecScore | Off-targetCount | Doench '16-Score | Out-of-Frame-Score | LindelScore |
|---|---|---|---|---|---|---|---|
| MDGA2 | TGTACGCTCCCCCGACGGTTCGG | 100 | 100 | 4 | 41 | 67 | 77 |
| MDGA2 | TGCACAATCCGAACCGTCGGGGG | 99 | 99 | 10 | 62 | 69 | 84 |
| MDGA2 | GTGCACAATCCGAACCGTCGGGG | 98 | 98 | 14 | 64 | 72 | 73 |
| MDGA2 | GAGTGCACAATCCGAACCGTCGG | 98 | 98 | 18 | 61 | 63 | 79 |
| MDGA2 | AGTGCACAATCCGAACCGTCGGG | 97 | 98 | 21 | 48 | 68 | 79 |
| MDGA2 | ATTTAGTGTACGGTCTCGTGTGG | 96 | 98 | 25 | 67 | 43 | 77 |
Author response table 5
CRISPR OFF TARGET analysis with 4 and 5 mismatch values.
| Target Sequence | Mismatch | Number of Found Targets | |
|---|---|---|---|
| MDGA1 | CTTCAACGTACGAGCCCGGGNGG | 0 | 1 |
| MDGA1 | CTTCAACGTACGAGCCCGGGNGG | 4 | 17 |
| MDGA1 | CTTCAACGTACGAGCCCGGGNGG | 5 | 209 |
| MDGA2 | ATTTAGTGTACGGTCTCGTGNGG | 0 | 1 |
| MDGA2 | ATTTAGTGTACGGTCTCGTGNGG | 4 | 23 |
| MDGA2 | ATTTAGTGTACGGTCTCGTGNGG | 5 | 321 |
Author response table 6
Author response table.
| Name off target sequence for MDGA1 gRNA | CFD Score |
|---|---|
| intergenic_Vangl2 | 0,36 |
| intron_Tbxas1 | 0,29 |
| intergenic_SCCPDH|TFB2M | 0,21 |
| intergenic_Scg2|ENSRNOG00000037663 | 0,18 |
| intergenic_ENSRNOG00000037633|Nyap2 | 0,17 |
| intron_Galnt18_1 | 0,16 |
| intergenic_Ttc7b|Rps6ka5 | 0,16 |
| intergenic_Six2|Srbd1 | 0,12 |
| intron_Slc9a9_8 | 0,11 |
| intergenic_Adora1|Myog_13 | 0,1 |
| intergenic_Clstn2|Nmnat3_8 | 0,09 |
| intergenic_ENSRNOG00000047256|ENSRNOG00000031960 | 0,07 |
| intron_Wasf2_5 | 0,07 |
| intergenic_ENSRNOG00000031681|ENSRNOG00000024649/ENSRNOG00000036386 | 0,06 |
| intergenic_Ffar2|Ffar3 | 0,05 |
| intron_Apbb2 | 0,05 |
| intron_Fshr_6 | 0,02 |
Author response table 7
Author response table.
| Name off target sequence for MDGA2 gRNA | CFD Score |
|---|---|
| exon_Pex1_chr4 | 0,44 |
| intergenic_AABR07041418.1|RGD1563975_chrX | 0,28 |
| intron_Ssbp2_chr2 | 0,25 |
| intergenic_Prune2|LOC102546963_chr1 | 0,2 |
| intergenic_Crygs|AABR07034636.1_chr11 | 0,17 |
| intron_Ift80_chr2 | 0,15 |
| intergenic_LOC685114|Ccdc178_chr18 | 0,15 |
| intergenic_U6|AABR07048636.1_chr5 | 0,14 |
| intron_Tmem47_chrX | 0,13 |
| intergenic_AABR07001025.1|AABR07001035.1_chr1 | 0,1 |
| intergenic_AC241705.1|Gap_chrY_KL568150v1_random | 0,09 |
| intron_Camk2b_chr14 | 0,07 |
| intergenic_Samd4a|Gch1_chr15 | 0,07 |
| intergenic_AABR07028381.1|Klf6_chr17 | 0,06 |
| intron_Map4_chr8 | 0,05 |
| intron_Pik3ca_chr2 | 0,03 |
| intergenic_AC139950.1|U6 | 0,02 |
| intergenic_AC111678.2|AC111678.1_chr18 | 0,02 |
| intergenic_Cxcl13|AABR07014424.1_chr14 | 0,01 |
| intron_Mipep_chr15 | 0 |
| intergenic_AABR07048878.2|AABR07048892.1_chr5 | 0 |
| intron_Tmem97_chr10 | 0 |
| intergenic_SNORD22|AABR07033162.1_chr11 | 0 |
Additional files
-
Supplementary file 1
Statistics table.
The number of experimental replicates ( = number of independent experiments performed), number of biological replicates ( = number of different cells analyzed), result of the normality test, statistical tests used to compare the data, and P-values associated to each test are given for each figure panel.
- https://cdn.elifesciences.org/articles/75233/elife-75233-supp1-v1.docx
-
Supplementary file 2
Cell line authentication.
Labels of the vials of COS-7 and HEK-293T cell lines from ECACC purchased through Sigma-Aldrich in 2015 and 2016, respectively.
- https://cdn.elifesciences.org/articles/75233/elife-75233-supp2-v1.pdf
-
Transparent reporting form
- https://cdn.elifesciences.org/articles/75233/elife-75233-transrepform1-v1.docx
Download links
A two-part list of links to download the article, or parts of the article, in various formats.
Downloads (link to download the article as PDF)
Open citations (links to open the citations from this article in various online reference manager services)
Cite this article (links to download the citations from this article in formats compatible with various reference manager tools)
MDGAs are fast-diffusing molecules that delay excitatory synapse development by altering neuroligin behavior
eLife 11:e75233.
https://doi.org/10.7554/eLife.75233


