Progressive enhancement of kinetic proofreading in T cell antigen discrimination from receptor activation to DAG generation
- Cardiovascular Research Institute and Department of Biochemistry and Biophysics, University of California, San Francisco, United States
Figures
Figure 1
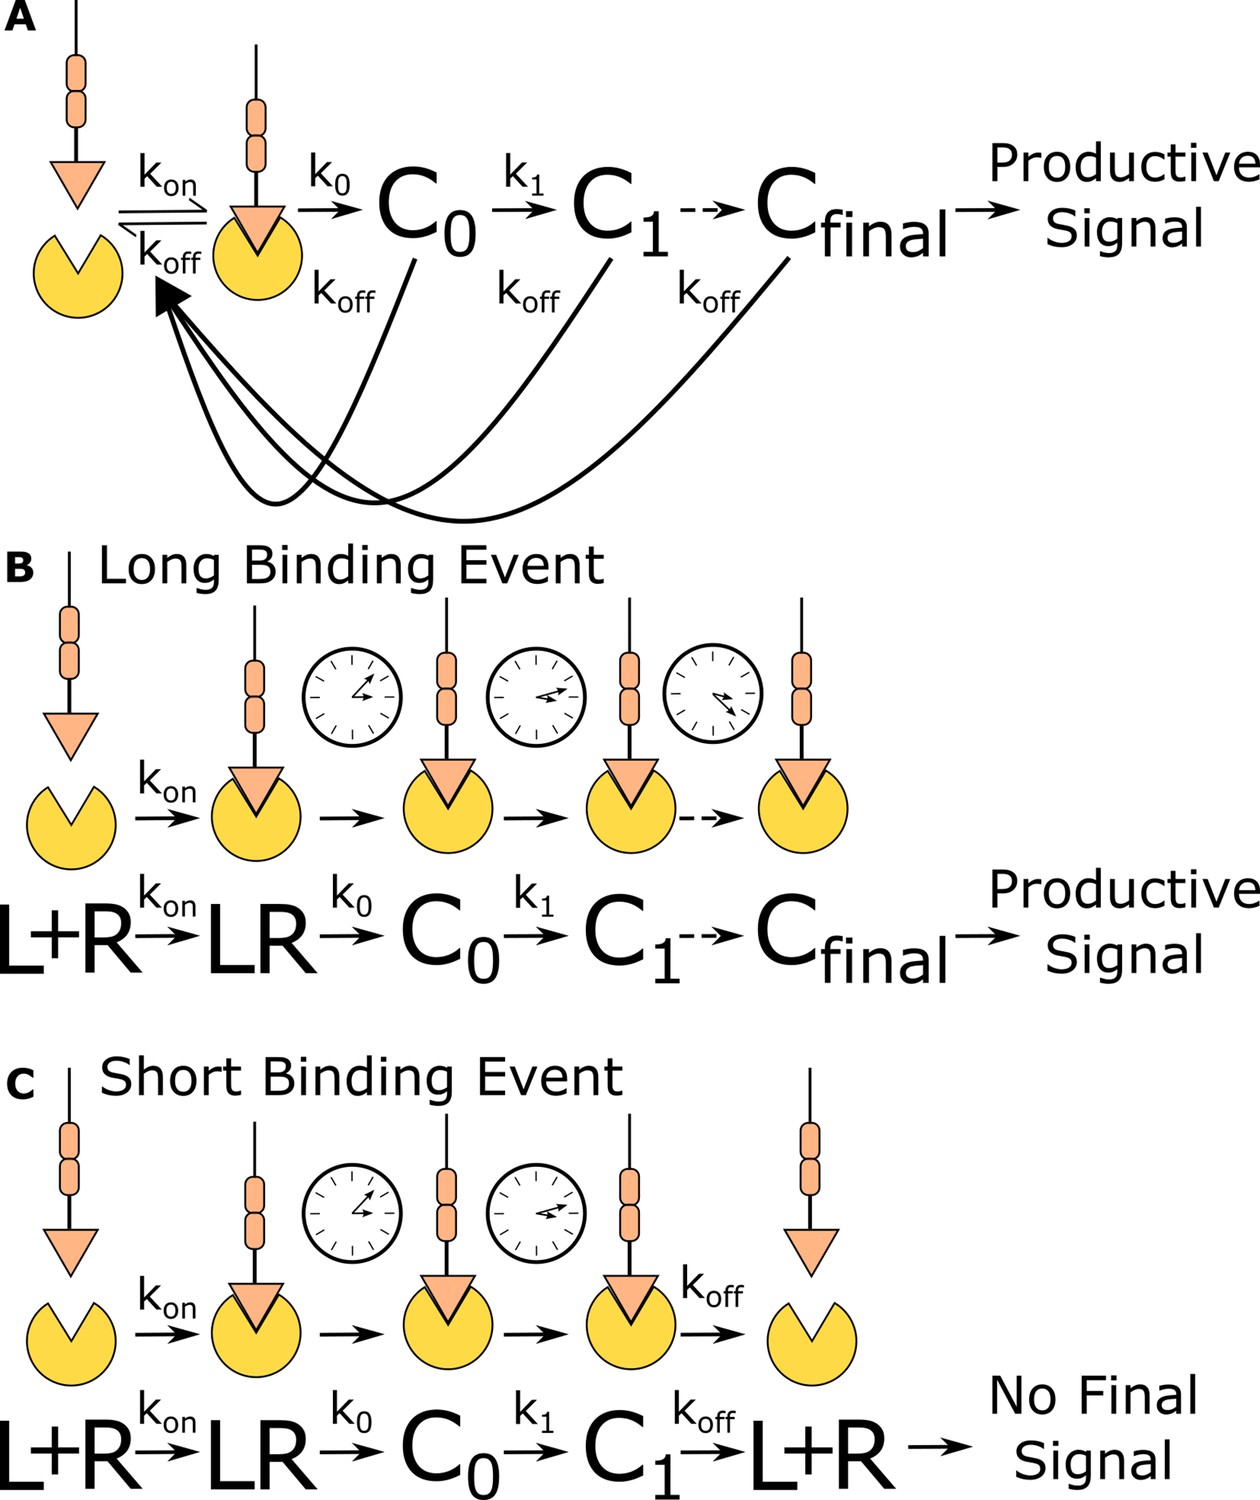
Kinetic proofreading discriminates binding events by half-life.
(A) The kinetic proofreading model consists of a chain of slow sequential events (Ci with rates ki) that begin once the ligand binds the receptor (kon). The chain of events must be completed before a productive signal is communicated to the cell. When the ligand unbinds the receptor (koff), all accumulated signaling intermediate (Ci) reset back to the ground state. Only binding events that persist long enough to form the active terminal signaling complex (Cfinal) result in cell activation. (B) Long-lived binding events remain bound to the receptor for a sufficient duration to complete all kinetic proofreading steps, resulting in a productive signal. (C) Short-lived binding events unbind the receptor before the kinetic proofreading chain is completed and fail to fully stimulate the antigen signaling cascade.
Figure 2
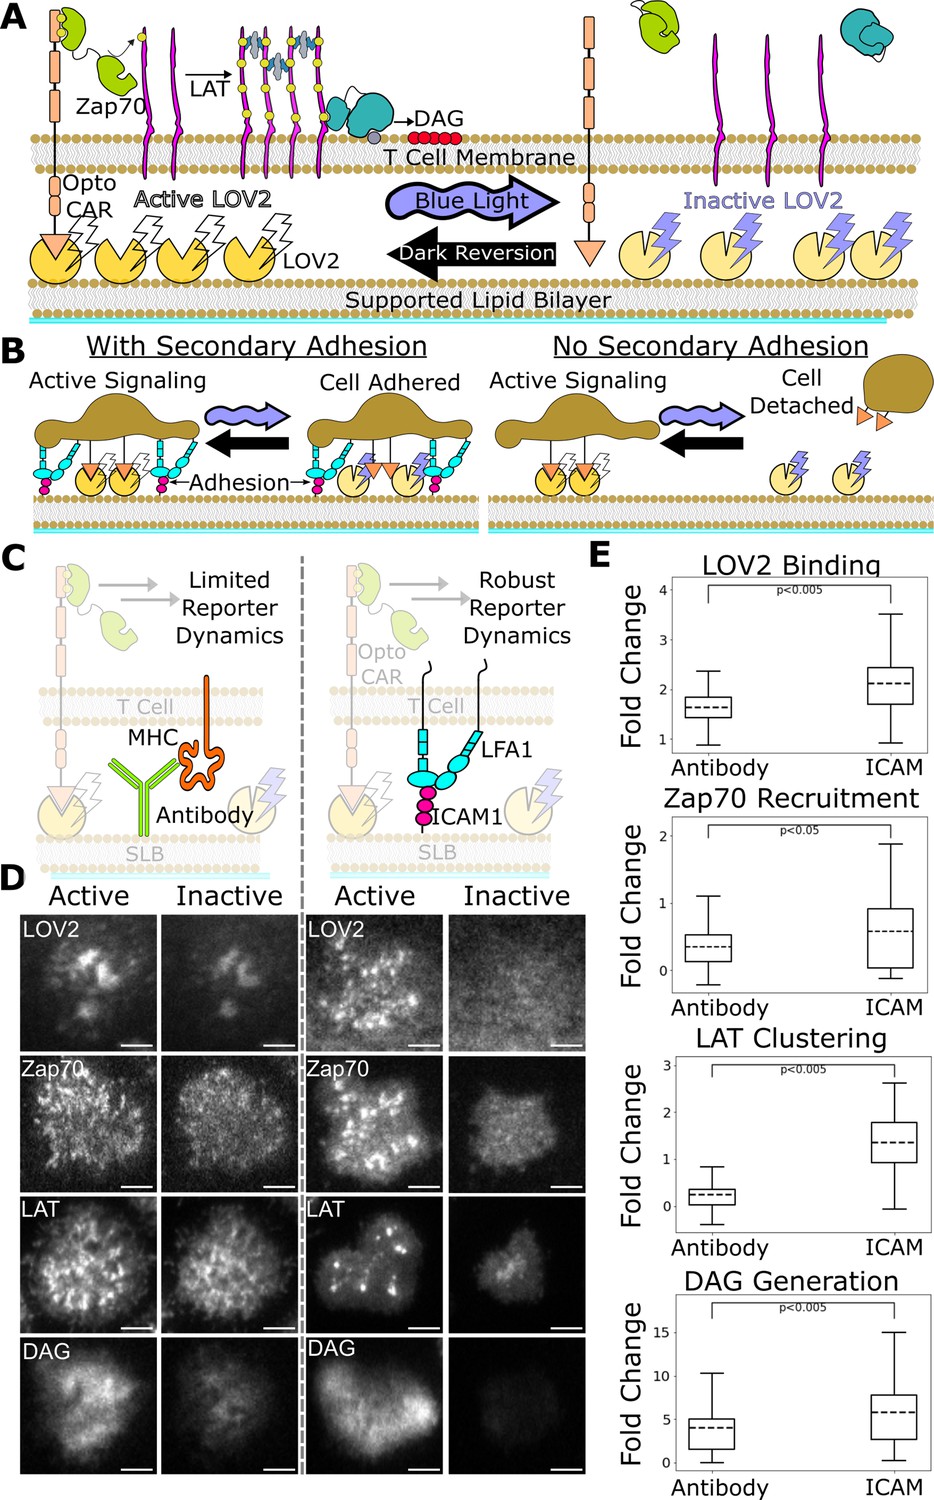
ICAM-1 adhesion improves robustness of proximal signaling live-cell biosensors.
(A) With our optogenetic system, we can control the concentration and lifetime of ligand-receptor interactions with blue light. A supported lipid bilayer (SLB) functionalized with the light-sensitive protein LOV2 creates an artificial antigen-presenting surface. Jurkat cells expressing zdk-CAR bind dark-state LOV2 and activate antigen signaling. Blue light interrupts LOV2-CAR-binding events and terminates signaling. (B) Our assay requires a secondary light-insensitive mode of cell adhesion to maintain segmentable and trackable cell footprints throughout an experiment. Cells adhere to the SLB through LOV2 while actively signaling. However, when signaling is inactivated by blue light, cells detach from the bilayer if no secondary method of constant adhesion exists. (C) In our previous work, we adhered cells to the SLB through biotinylated beta2 microglobulin antibodies against the cells’ MHC class1 (left). This adhesion technique limited the spatiotemporal dynamics of many biosensors, including the recruitment of ZAP70 and the clustering of LAT. We now adhere cells to the bilayer through native LFA-1 to ICAM-1 integrin signaling (right). (D) Representative TIRF images of LOV2 binding, Zap70 recruitment, LAT clustering, and DAG generation during ligand engagement and after 2 min of strong inactivation of the Zdk-CAR under antibody adhesion (left) versus ICAM-1 adhesion (right) (scale bar = 5µm). (E) SLB adhesion through ICAM-1 improved the spatiotemporal dynamics of each biosensor. Boxplot of the maximum fold-change in LOV2 binding, Zap70 recruitment, LAT clustering, and DAG generation between active and inactive Zdk-CAR signaling states under antibody adhesion and ICAM-1 adhesion. Dashed line indicates population mean, each plot represents reporter change of approximately n=120cells, independent t-test p-values shown.
Figure 3 with 1 supplement
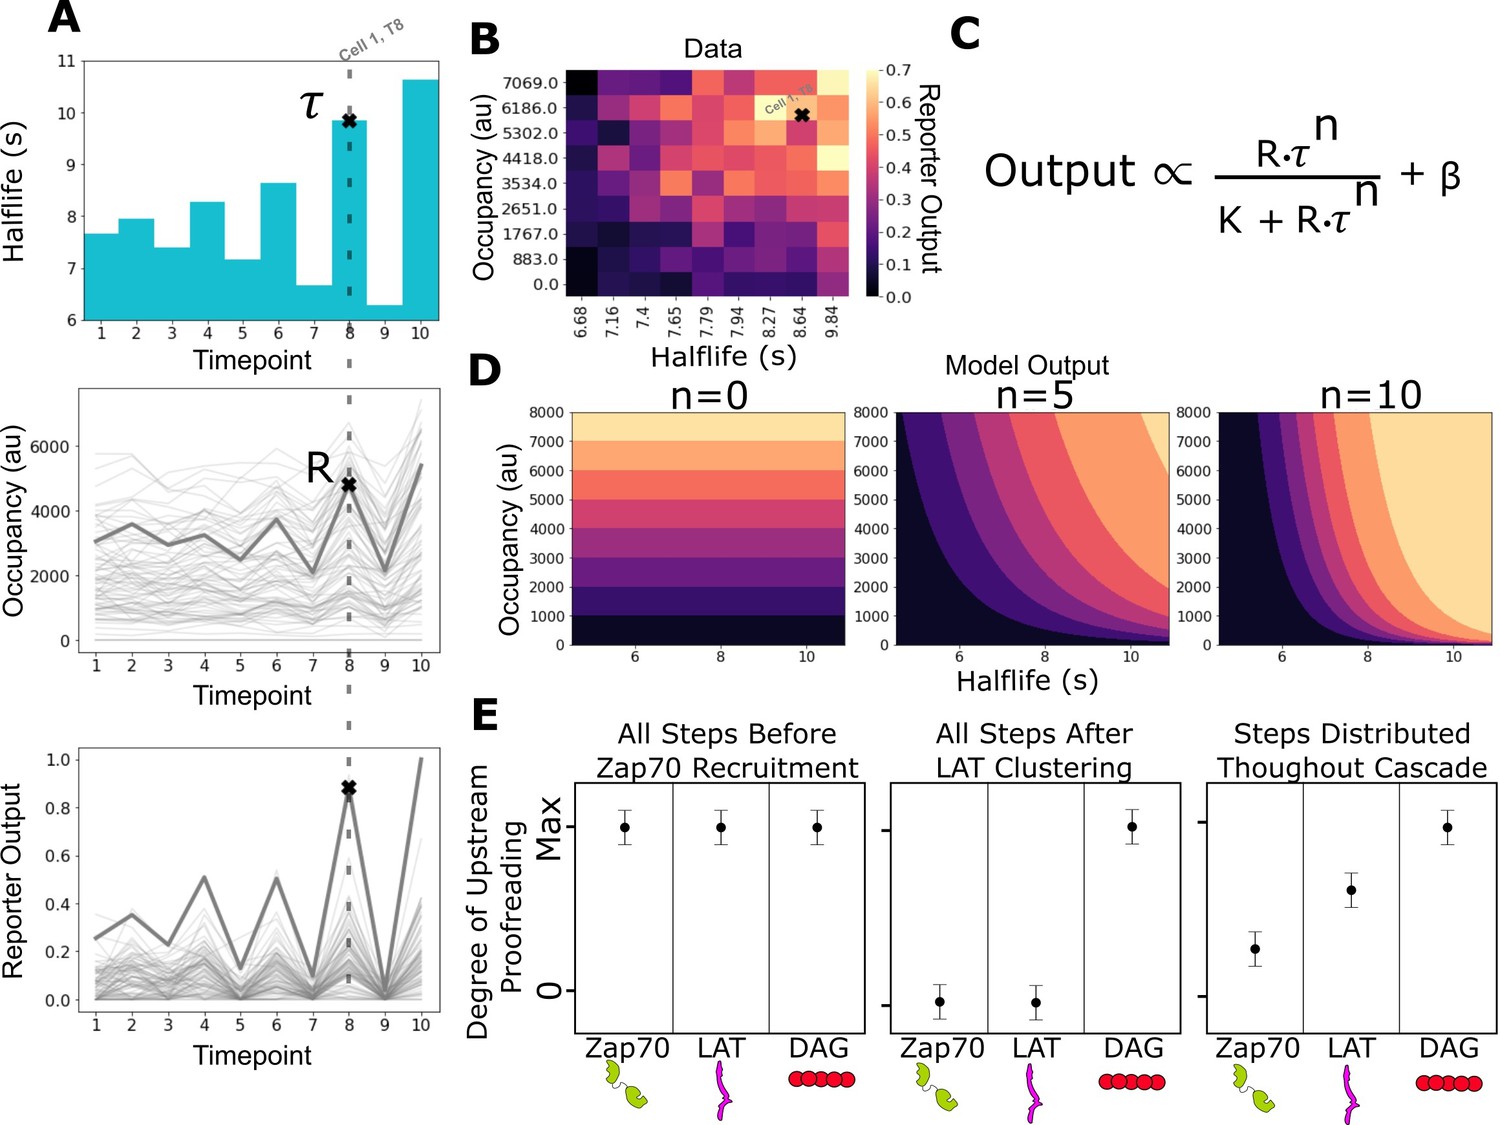
Measurement of receptor occupancy, binding half-life, and signaling output for evaluating proofreading strength.
(A) After adhering the cells to the functionalized supported lipid bilayers (SLBs), we expose them to a series of 3 min blue-light illuminations generating defined average ligand-binding half-lives. At the end of each half-life condition, we measure every cell’s steady-state reporter output and receptor occupancy (example cell highlighted at timepoint 8). Following this protocol, we measure every cell’s reporter output (bottom) as a function of receptor occupancy (middle) and average ligand-binding half-life (top). (B) After normalizing each cell to its average basal reporter activity, the data from multiple time courses with different ligand densities are aggregated, and the reporter output values are normalized to the 90th percentile cell in the dataset. (C) The dataset is then fit to a model of the expected output of a kinetic proofreading signaling system. In the model, the expected signaling output is proportional to the ligand occupancy (R) and ligand-binding half-life (τ) raised to the number of strong proofreading steps (n) upstream of that signaling step. The magnitude of n provides a relative measure of the strength of kinetic proofreading between ligand binding and a given signaling step. K is the amount of upstream signal for half-maximal response, and β is basal signaling in the pathway (D) Expected output of models with zero, five, and ten kinetic proofreading steps. As the value of n increases, the dependence of output on ligand half-life increases, while the dependence on receptor occupancy decreases. A system with no proofreading responds only to receptor occupancy, while a system with a high degree of proofreading (n=10) is insensitive to numerous short binding events while fully responding to very few long binding events. (E) Anticipated results for different scenarios of proofreading step distribution.
Figure 3—figure supplement 1
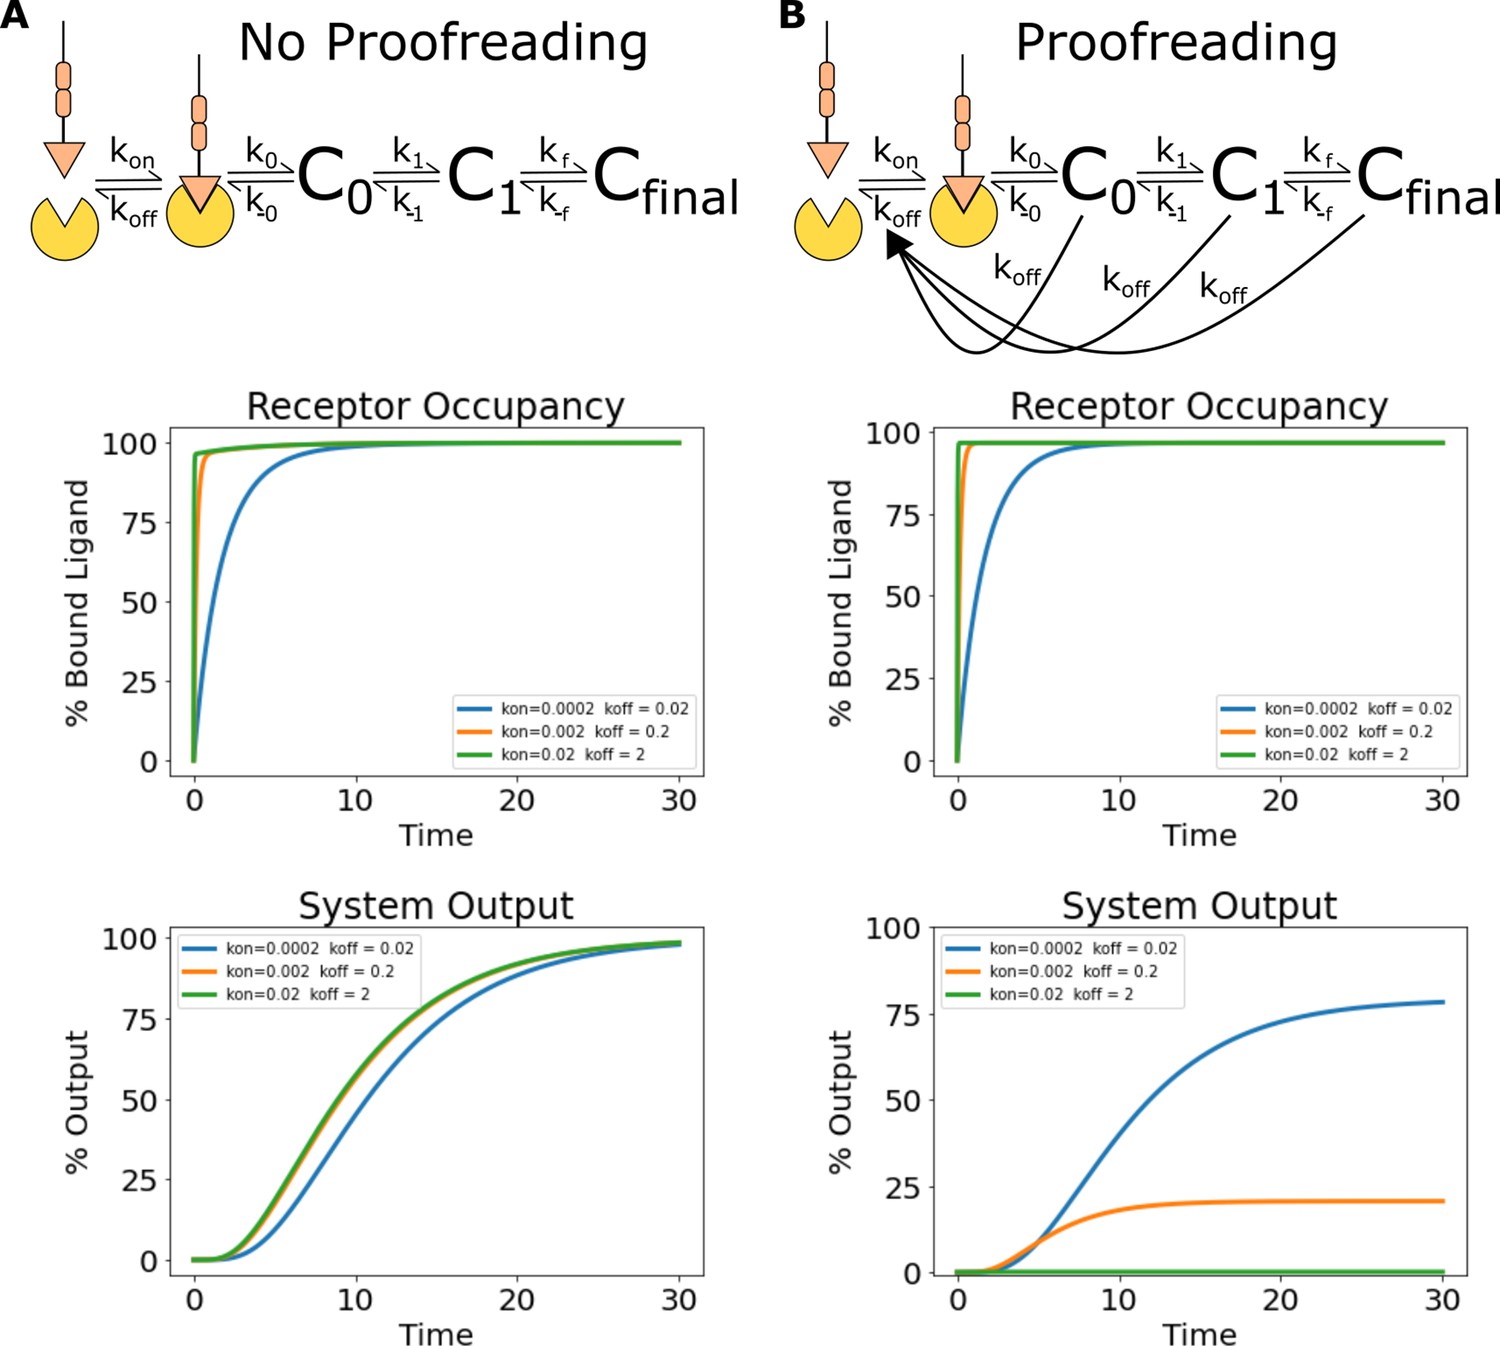
Simulations of ligand discrimination with and without kinetic proofreading reset pathways.
Using the architecture and parameterization of the kinetic proofreading model described in Ganti et al., 2020, we simulated the signaling output of non-proofreading and kinetic proofreading systems to a series of ligands with the same equilibrium constant but different binding half-lives. (A) To create a non-proofreading system, we deleted all reset pathways dependent on ligand unbinding. This left a series of slow reversible reactions (top). While this system binds the ligand series at different rates, the same receptor occupancy is reached for all ligands at steady state (middle). The signaling output of the non-proofreading system also reaches the same steady-state value for all ligands (bottom). (B) The kinetic proofreading system consists of both a series of reversible reactions, and additional reset pathways dependent on ligand unbinding (top). While all ligands achieve the same steady-state receptor occupancy (middle), the steady-state output of the kinetic proofreading system is different for each ligand depending on its binding half-life (bottom).
Figure 4 with 5 supplements
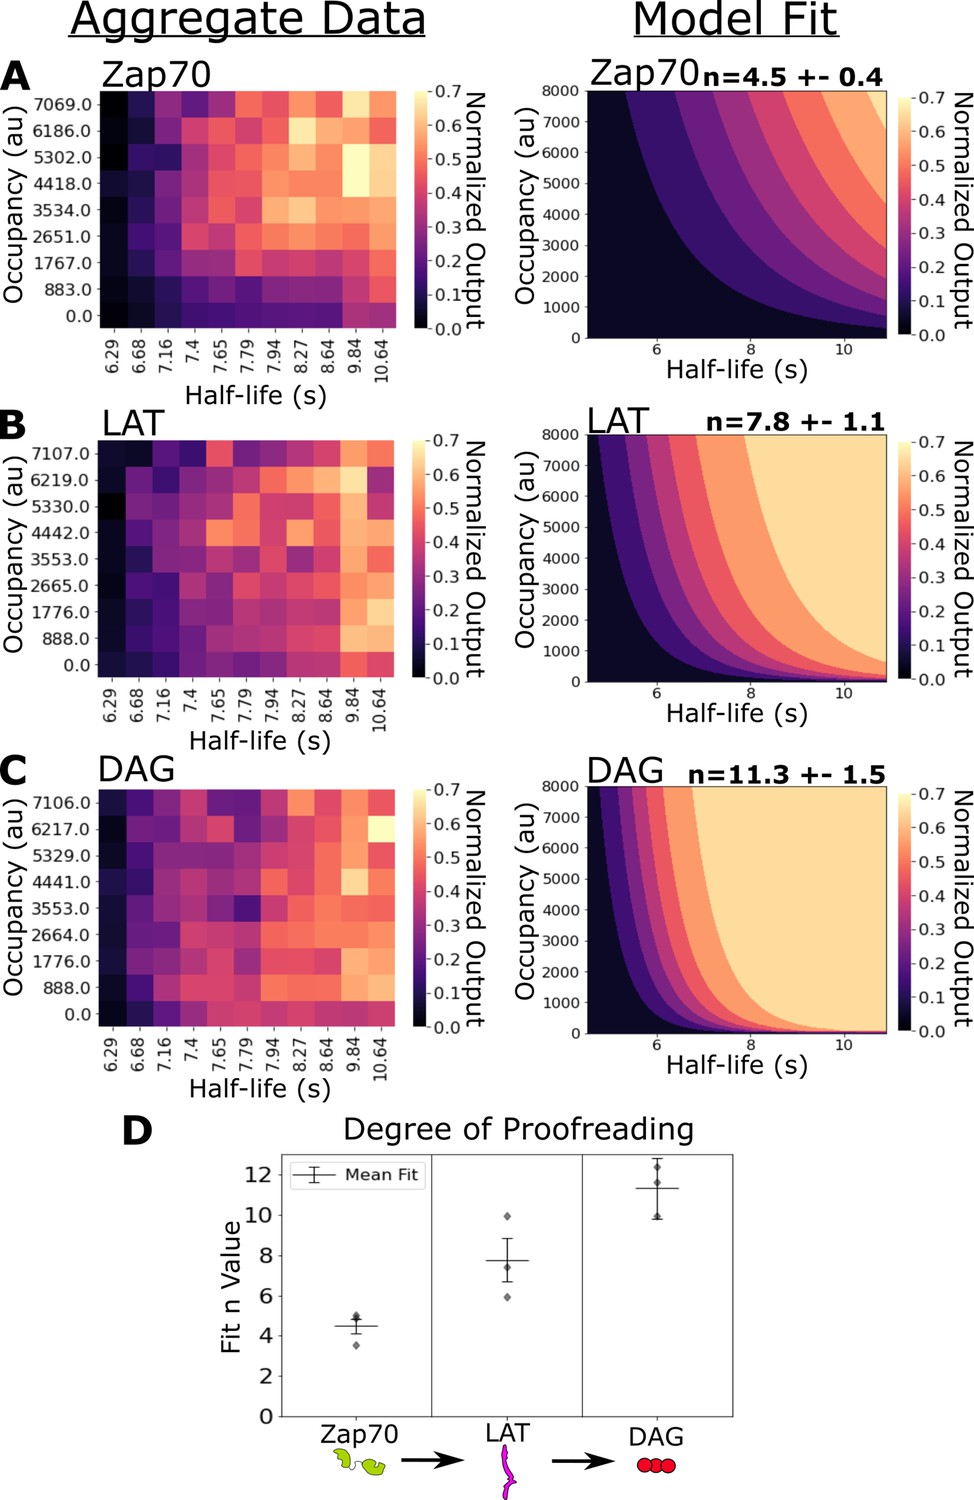
Kinetic proofreading starts upstream of Zap70 recruitment and progressively increases in strength at LAT clustering and diacylglycerol (DAG) generation.
(A) Collected data of Zap70 recruitment as a function of receptor occupancy (y-axis) and ligand half-life (x-axis) (left). Zap70 recruitment best fits a model of kinetic proofreading with a strength of upstream proofreading of n=4.5 ±- 0.4 (right). (B) Collected data of LAT clustering as a function of receptor occupancy (y-axis) and ligand half-life (x-axis) (left). LAT clustering best fits a model of kinetic proofreading with a strength of upstream proofreading of n=7.8 ± 1.1 (right). (C) Collected data of DAG generation as a function of receptor occupancy (y-axis) and ligand half-life (x-axis) (left). DAG generation best fits a model of kinetic proofreading with a strength of upstream proofreading of n=11 ± 1.5 (right). (D) The mean model fit n-values (±1 std) for each biosensor across three biological replicates (gray markers). The fit n-values continue to increase from Zap70 recruitment to LAT cluster to DAG generation. These results suggest the existence of kinetic proofreading steps between ligand-binding and Zap70 recruitment, between the recruitment of Zap70 and the formation of a LAT cluster, and between the initial formation of a LAT cluster and the generation of DAG from that cluster.
-
Figure 4—source data 1
Data tables (.csv) of the biological replicates used to fit the degree of kinetic proofreading (n) for each biosensor.
Each row is one cell in one condition of a time course. Column ‘response_data’ is the reporter output (zap, lat, or dag) labeled in the title of the file. Column ‘resonse_lov’ is the occupancy measurement, and the column ‘half-life’ is the average ligand-binding half-life of the condition. We generated these data tables from raw images and plotted heatmaps using custom Python scripts available at https://github.com/dbritain/KP-paper, Britain, 2022.
- https://cdn.elifesciences.org/articles/75263/elife-75263-fig4-data1-v2.zip
Figure 4—figure supplement 1
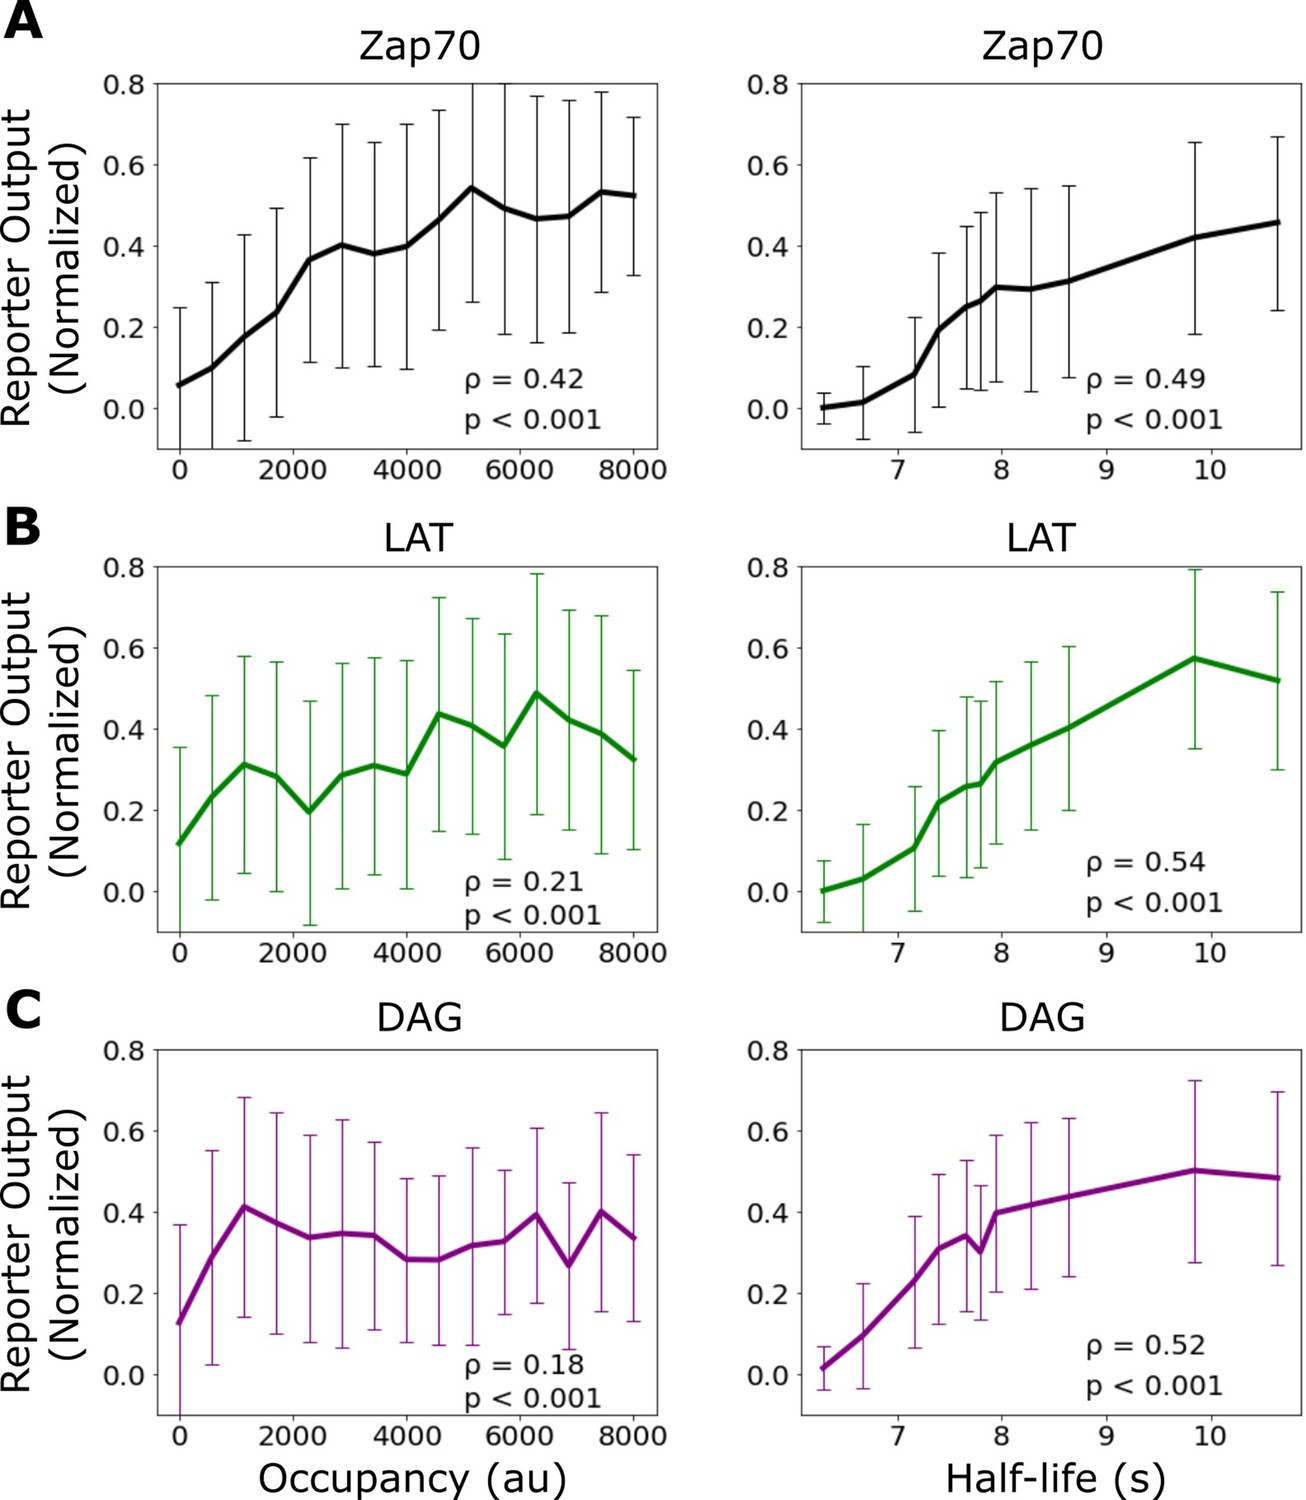
Correlation of signaling output with receptor occupancy and ligand-binding half-life.
Mean reporter output (±1 std) plotted as a function of receptor occupancy (left) and ligand-binding half-life (right) for Zap70 recruitment (A), LAT clustering (B), and diacylglycerol (DAG) generation (C). Spearman correlation shown in the inset of each graph. Each datapoint represents reporter measurment in approximately n=120 cells.
Figure 4—figure supplement 2
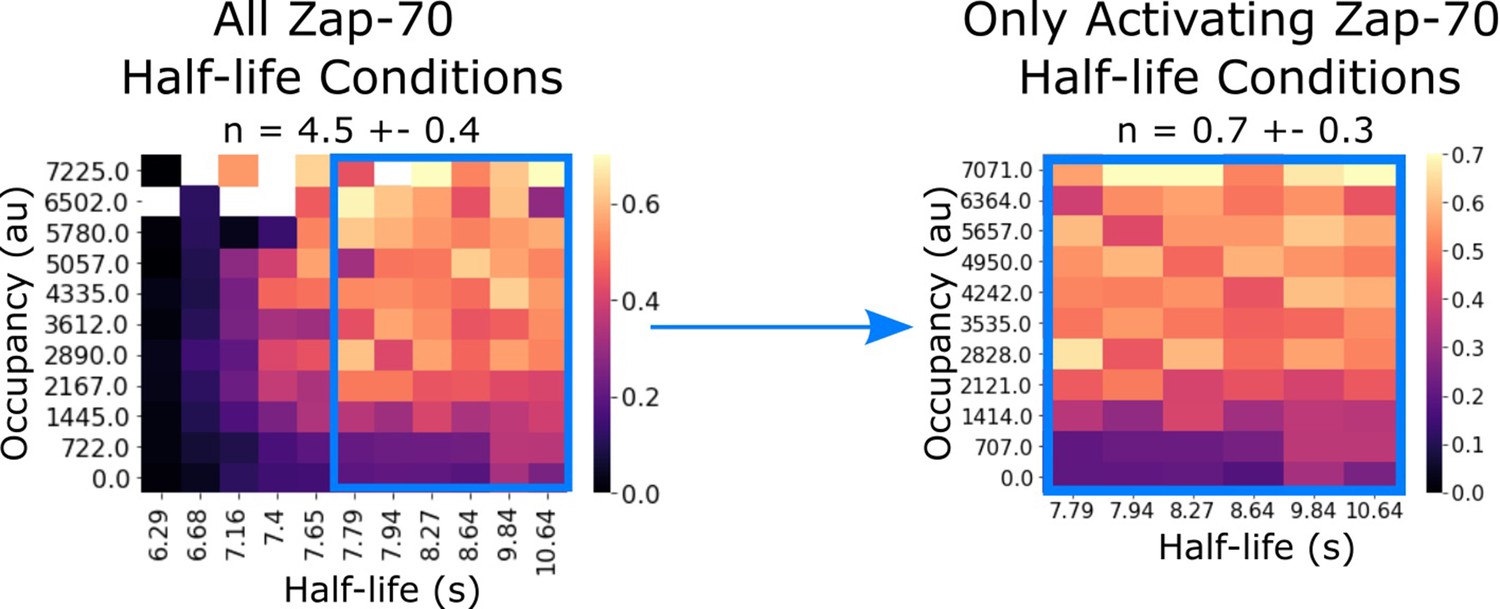
Zap70 data subset replicates previously reported kinetic proofreading value.
In our previous work, we failed to detect kinetic proofreading in Zap70 recruitment with supplementary bilayer adhesion. In our previous studies lacking light-independent bilayer adhesion, it is possible that non-activated cells did not generate sufficient footprints for segmentation. Consistent with this idea, if we restrict our analysis to only the activating half-life conditions of our current Zap70 dataset (which uses ICAM as a secondary adhesion molecule), we measure similarly low proofreading (n=0.7 ± 0.3).
Figure 4—figure supplement 3
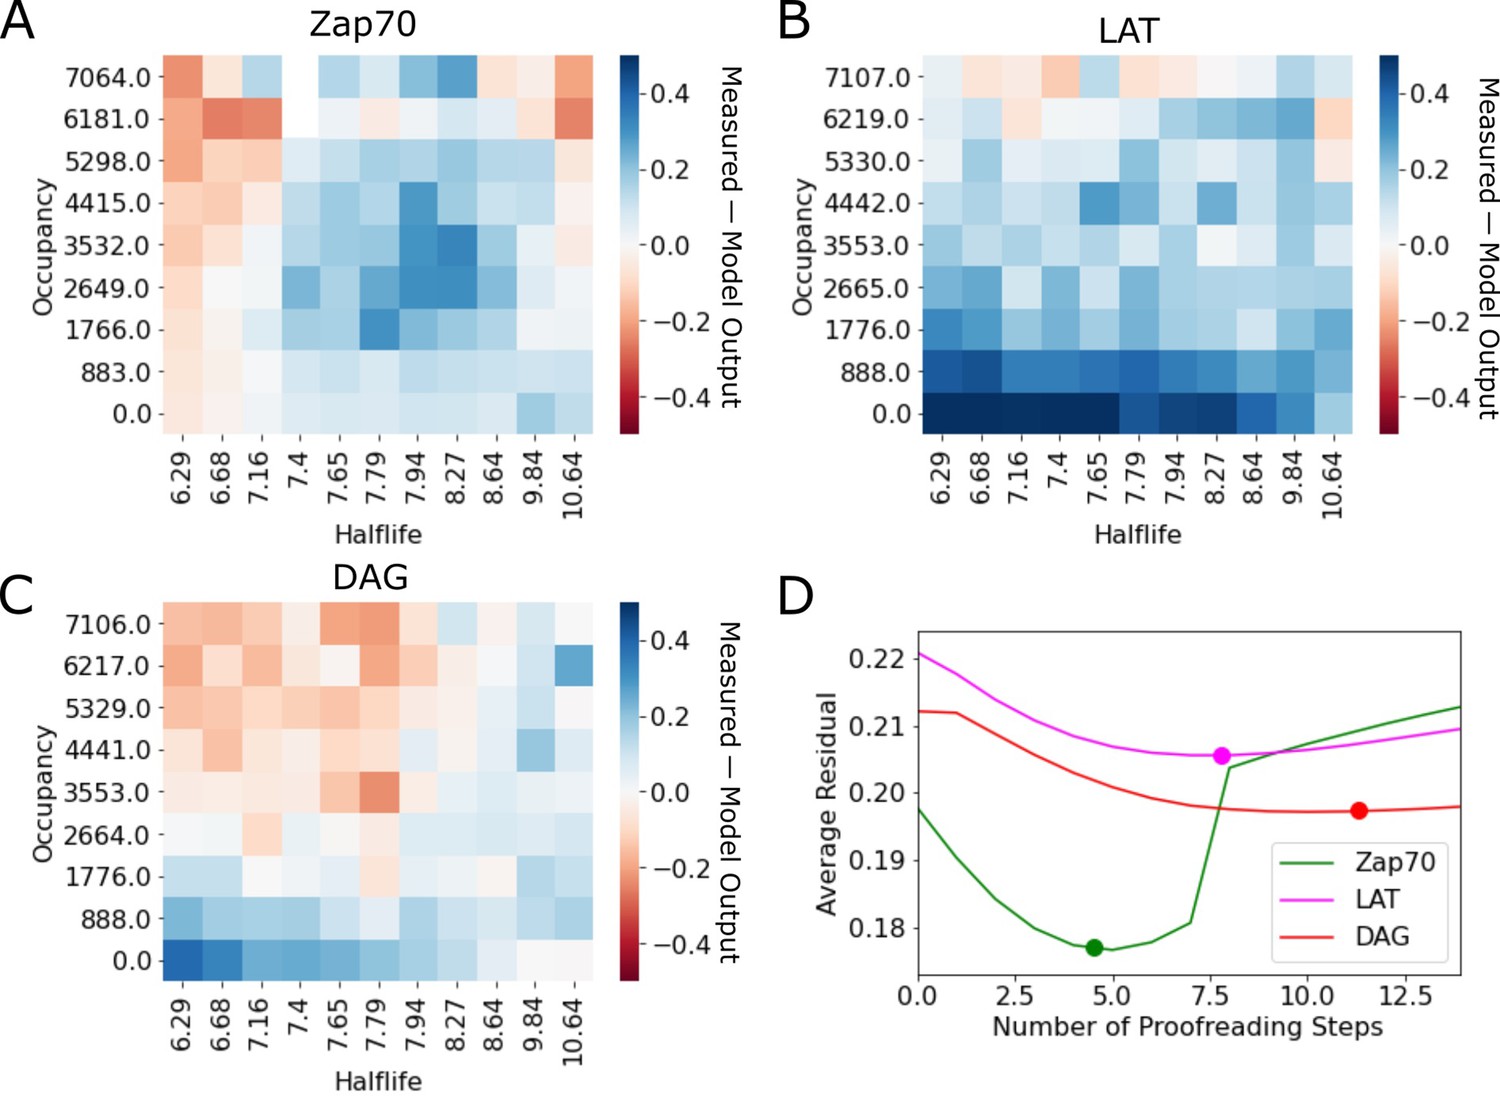
Residuals of kinetic proofreading model fits.
(A–C) Residual plots of the kinetic proofreading model fit for each reporter dataset. Heatmaps show the model fit subtracted from the underlying data, highlighting areas where the model over predicted the cell response in red and under predicted the cell response in blue. (D) Plot of the average residual for models fit with a range of constant N values. We fit each dataset to our model of kinetic proofreading while holding the number of proofreading steps (N) constant. For each constant value of N (x-axis), we calculated the average residual value of the fit (y-axis). Fit values of N reported in the main text are highlighted with a dot on each line.
Figure 4—figure supplement 4
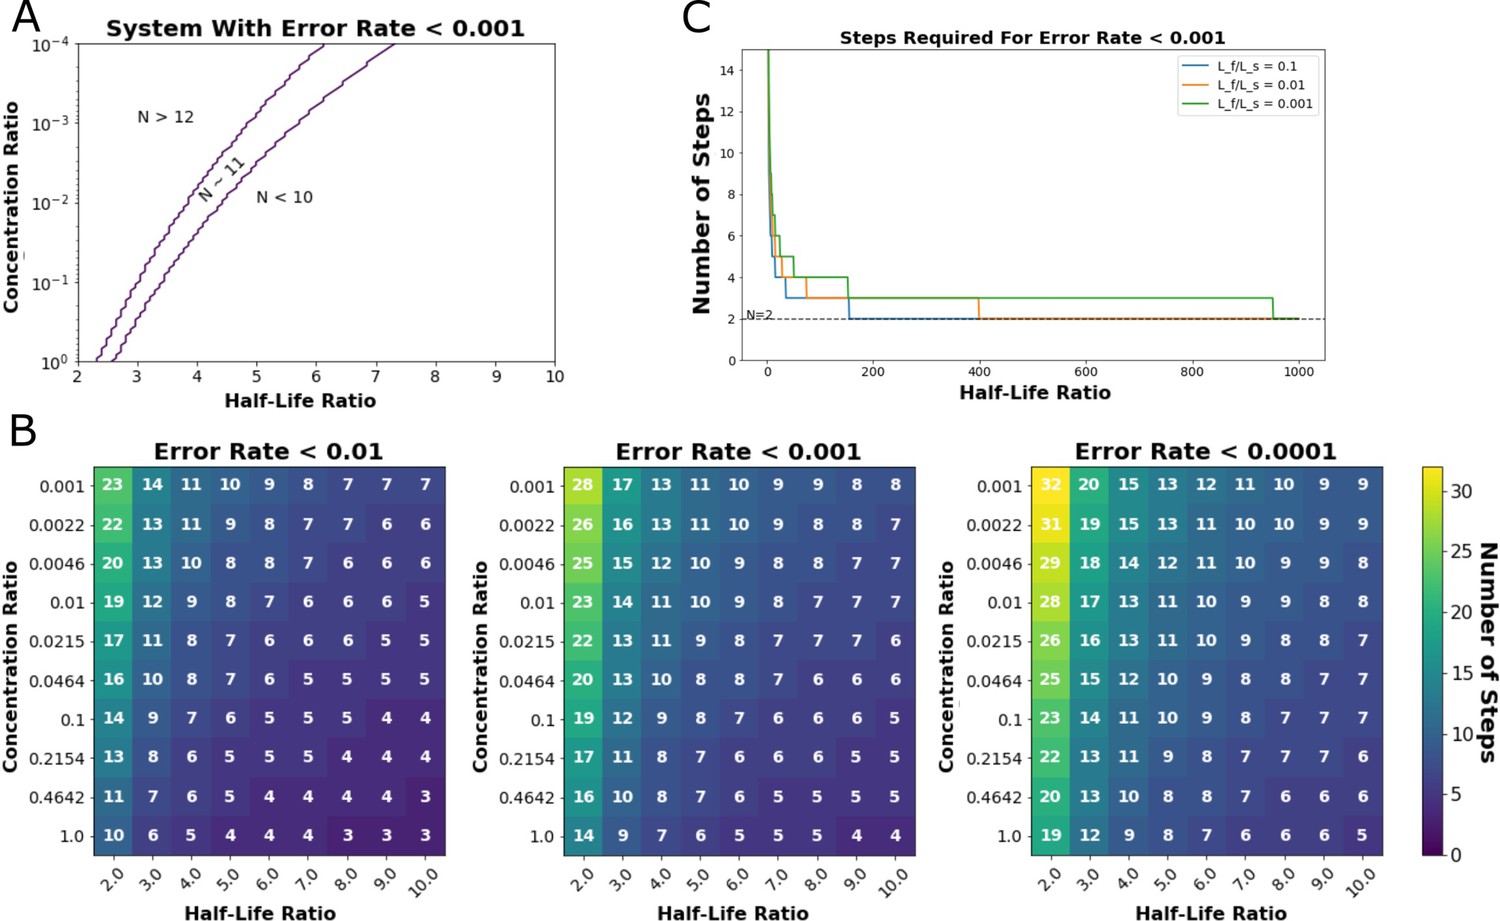
Output of steady-state model from Ganti et al., 2020.
This model predicts the minimum number of proofreading steps needed to achieve a desired Hopfield error rate at given ratios of cognate-ligand to self-ligand concentration and half-life ratios (Hopfield, 1974). (A) Exploration of the ligand concentration ratios (y-axis) and ligand half-life ratios (x-axis) where a kinetic proofreading system could achieve a Hopfield error rate of less than 0.001. An 11-step kinetic proofreading system could achieve an error rate less than 0.001 in the region indicated between the purple lines (N~11). (B) Heatmaps of the number of proofreading steps required to achieve Hopfield error rates of less than 0.01 (left), 0.001 (middle), and 0.0001 (right). (C) A minimum of two steps (N=1) are required to achieve a Hopfield error rate of less than 0.001, even at very high half-life ratios between cognate- and self-ligand.
Figure 4—figure supplement 5
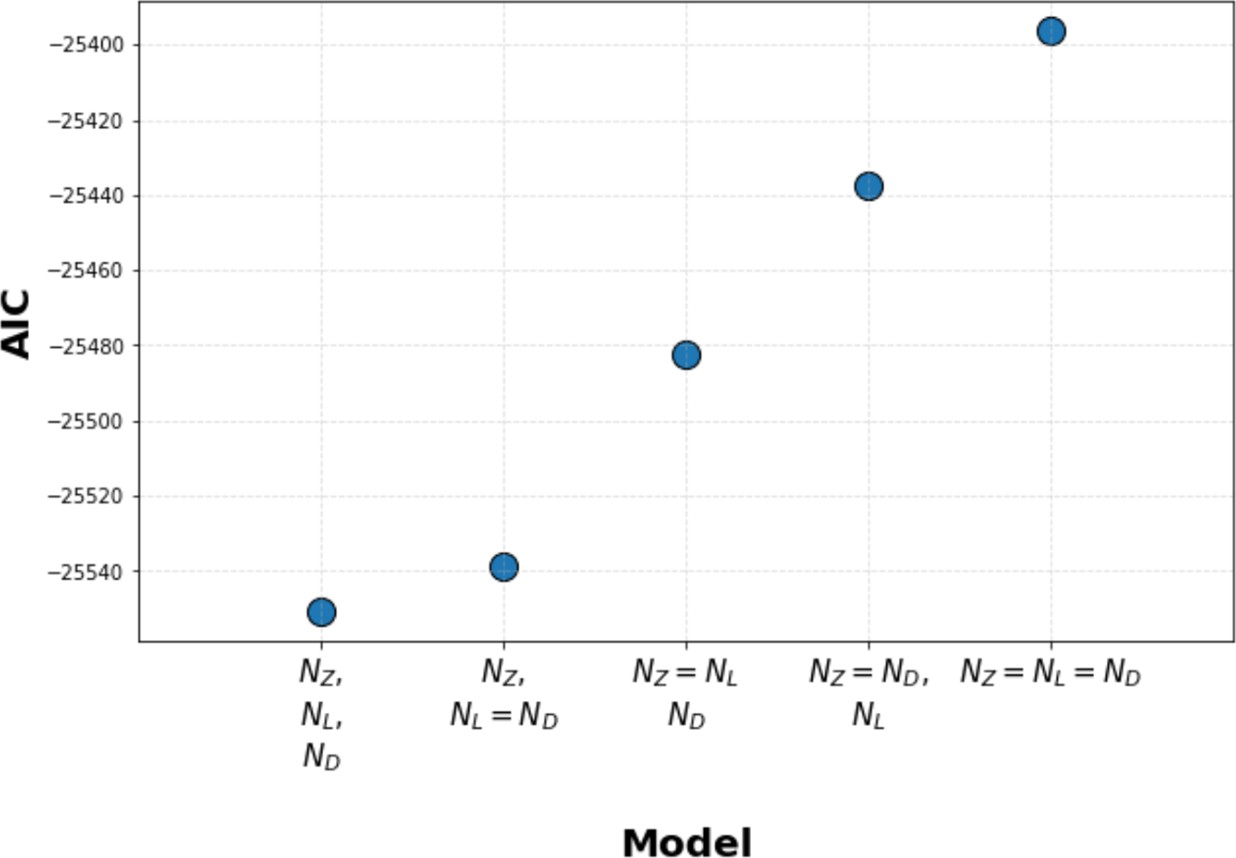
Kinetic proofreading model selection using Akaike information criterion (AIC).
We used AIC to select between models where Zap70, LAT, and diacylglycerol (DAG) each have their own unique value for the number of upstream proofreading steps (N value), models where two steps share the same N value (with a unique N value for the third step), and models where all three steps share the same N value. We found that models with unique N values for all three signaling steps have the lowest AIC, thus best explaining our data. Models where LAT and DAG share the same N value (and Zap70 has a unique N value) have a marginally worse AIC. Models where Zap70, LAT, and DAG all share the same N value perform the worst.
Figure 5 with 1 supplement
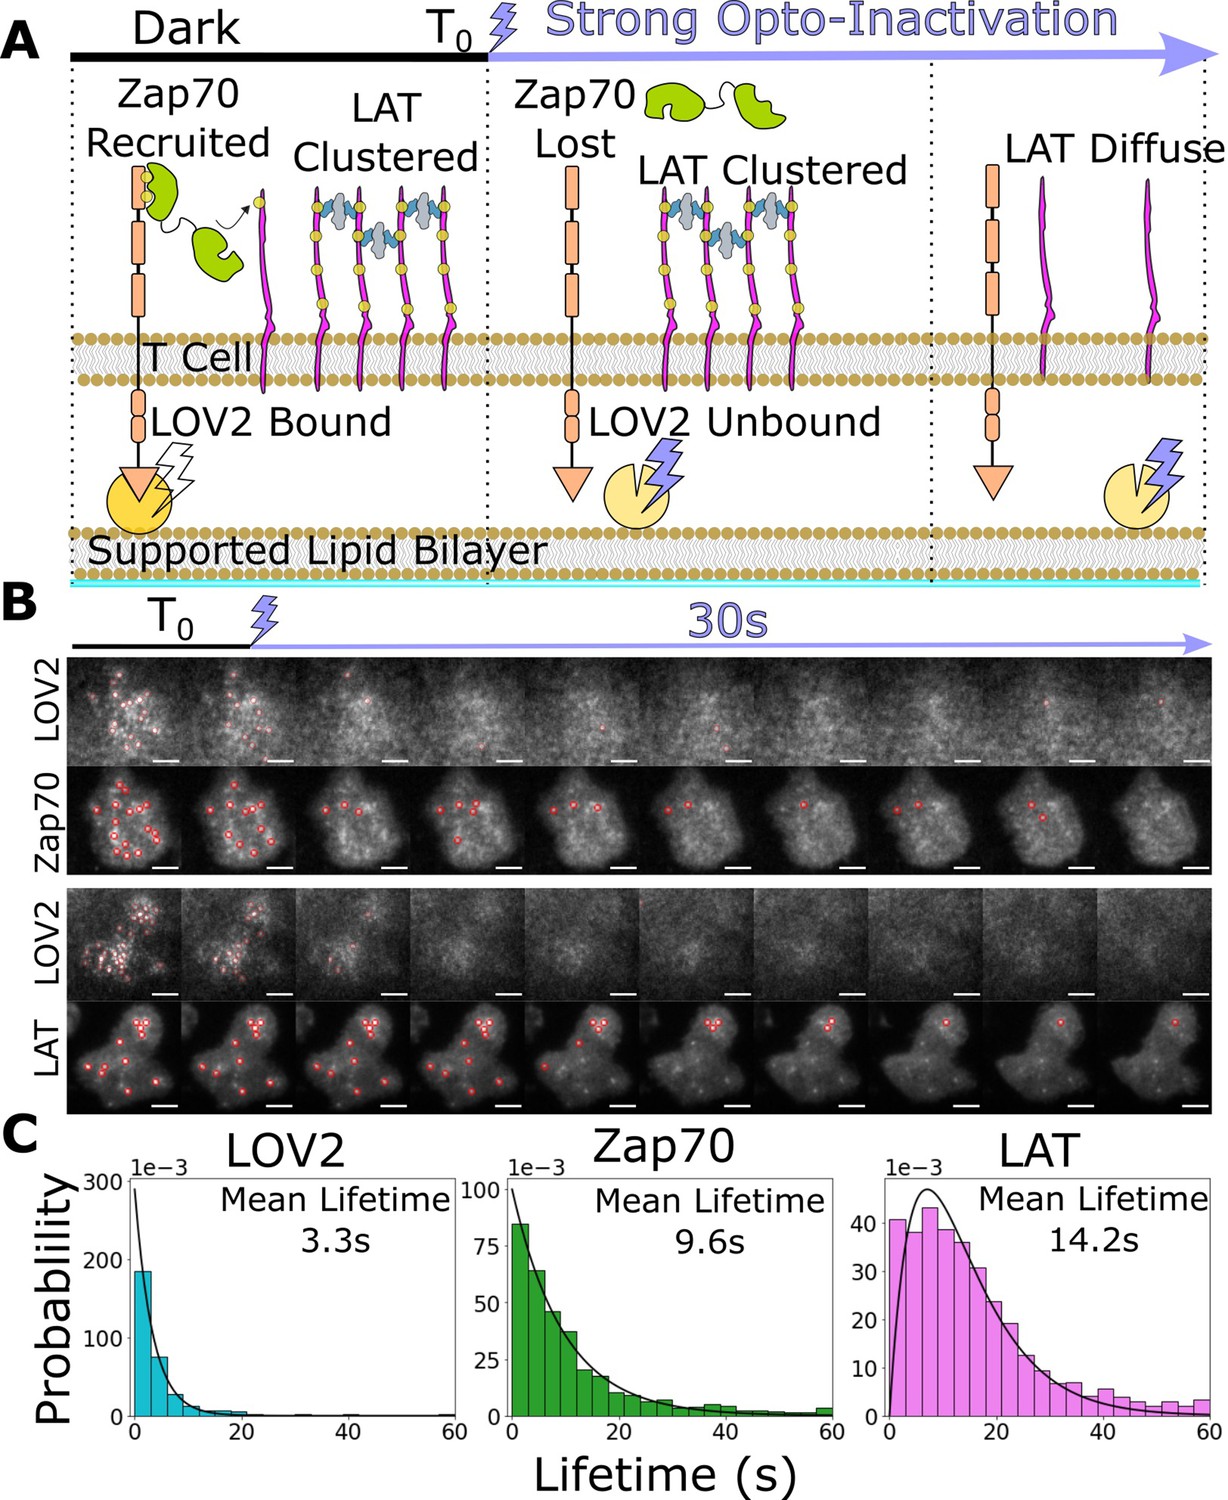
Downstream signaling complexes reset slower than active receptors upon ligand unbinding.
(A) Schematic of reset experiment. After synchronously unbinding all receptors with intense blue light, we measure the reset rate of LOV2 unbinding, Zap70 loss, and LAT cluster dissociation. (B) Representative cells of Zap70 and LAT upon receptor inactivation with respective LOV2 images. Cells expressing either Zap70-Halo (top) or LAT-Halo (bottom) were allowed to activate for 3 min before acute inactivation with intense blue light for 1 min and subsequently imaged every 3 s. The lifetimes of subcellular clusters of LOV2, Zap70, and LAT were tracked with the ImageJ TrackMate plugin (scale bar = 5μm). (C) The lifetime distributions of tracked clusters after receptor inactivation. The lifetime distributions of LOV2 unbinding and Zap70 dissociation fit exponential distributions with mean lifetimes of 3.3 and 9.3 s, respectively, suggesting a one-step reset process. The LAT declustering lifetime distribution fit an Erlang distribution of a two-step process and a mean lifetime of 14.2 s. Fitting of cluster intensity over time with exponentials gave comparable results for all three reporters (Figure 5—figure supplement 1).
-
Figure 5—source data 1
Data tables (.csv) for each cell used for the lifetime distributions of each reporter.
Each data table is the TrackMate ‘spot-statistics’ output of one cell over four cycles of blue-light illumination (frames 0–40, 100–140, 200–240, and 300–340, with 3 s interval between frames). We calculated the lifetime of TrackIDs that existed at the start of each period of blue-light illumination that did not last for the full period and fit the resulting lifetime distributions using custom Python scripts available at https://github.com/dbritain/KP-paper (copy archived at swh:1:rev:167fa456901903740f0f3ee6a3e5324bc45207ea, Britain, 2022).
- https://cdn.elifesciences.org/articles/75263/elife-75263-fig5-data1-v2.zip
Figure 5—figure supplement 1
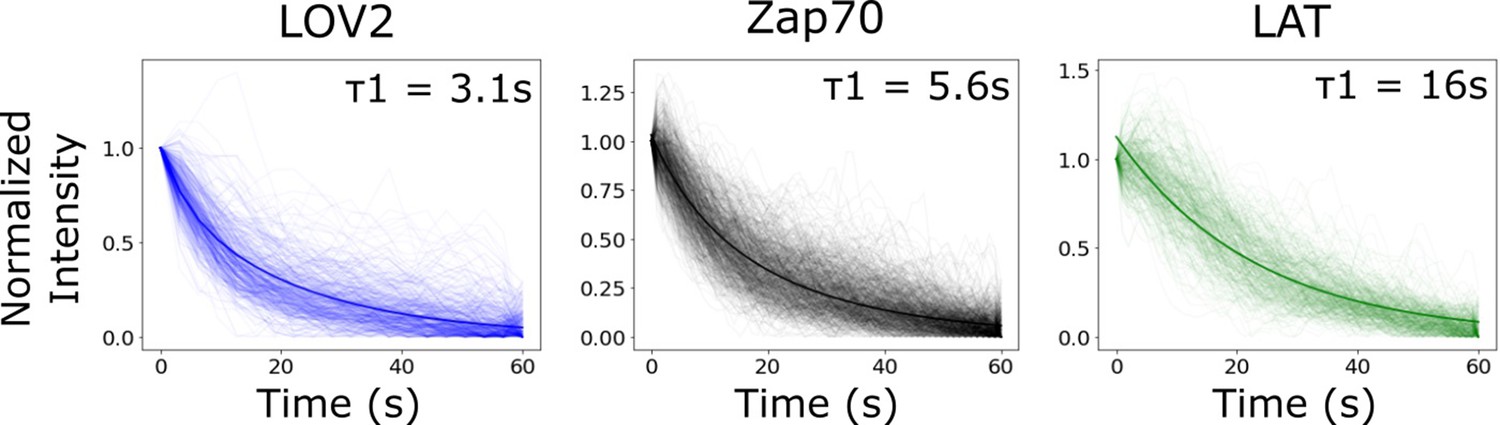
Bi-exponential fit of biosensor intensity reset curve is comparable to lifetime analysis from Figure 5.
As an alternative to tracking each reporter’s lifetime distribution, we tracked the intensity of identified cluster regions following blue-light inactivation. We fit the median curve of each biosensor to a bi-exponential function. The stronger fit half-life (weight = ~75%) for each biosensor’s bi-exponential fit (graph inset) was comparable to the mean lifetime found analyzing the lifetime distributions (Figure 5C). We found that clusters of receptor-bound LOV2 lost intensity with a half-life of 3.1 s. Clustered Zap70 lost intensity with a half-life of 5.6 s. LAT clusters lost intensity much slower than LOV2 ligand or Zap70, with a half-life of 16 s. The lesser fit half-life for each biosensor was approximately 16 s with a weight of ~25%. The longer half-life fit is likely a combination of photobleaching and/or cytoskeletal rearrangements of the cell occurring after receptor inactivation that are common between the biosensors.
Videos
Video 1
ICAM-based adhesion yields reversible LOV2 binding for optogenetically stimulated cells.
Time course of LOV2 on a supported lipid bilayer reversibly binding zdk-CARs expressed in Jurkat cells in the presence of ICAM-1 adhesion to the bilayer (light-independent cellular interaction). LOV2 is released from cell footprint under blue light and rebinds in the dark (illumination status indicated in top left). Cells were adhered to the bilayer for 5 min prior to the start of the video. Two minutes of strong blue-light illumination are followed by 3 min in the dark for two cycles (MM:SS time-stamp in top right).
Video 2
ICAM-based adhesion yields reversible Zap70 recruitment for optogenetically stimulated cells.
Time course of reversible Zap70 recruitment in Jurkat cells in the presence of ICAM-1 adhesion to the bilayer (light-independent cellular interaction). ZAP70 is recruited to phosphorylated zdk-CAR ITAMs in the dark and released back to the cell cytosol under blue light (illumination status indicated in top left). Cells were adhered to the bilayer for 5 min prior to the start of the video. Two minutes of strong blue-light illumination are followed by 3 min in the dark for two cycles (MM:SS time-stamp in top right).
Video 3
ICAM-based adhesion yields reversible LAT clustering for optogenetically stimulated cells.
Time course of reversible LAT clustering in Jurkat cells in the presence of ICAM-1 adhesion to the bilayer (light-independent cellular interaction). LAT forms clusters during active antigen signaling in the dark, and these clusters dissociate following blue-light-mediated dissociation of the receptor-ligand interaction (illumination status indicated in top left). Cells adhered to the bilayer for 5 min prior to the start of the video. Two minutes of strong blue-light illumination are followed by 3 min in the dark for two cycles (MM:SS time-stamp in top right).
Video 4
ICAM-based adhesion yields reversible diacylglycerol (DAG) generation for optogenetically stimulated cells.
Time course of reversible DAG generation in Jurkat cells in the presence of ICAM-1 adhesion to the bilayer (light-independent cellular interaction). DAG is generated during active antigen signaling in the dark, and DAG generation is terminated following blue-light-mediated dissociation of the receptor-ligand interaction (illumination status indicated in top left). Cells adhered to the bilayer for 5 min prior to the start of the video. Two minutes of strong blue-light illumination are followed by 3 min in the dark for two cycles (MM:SS time-stamp in top right).
Video 5
Lifetime of LOV2 and Zap70 after optogenetic signal termination.
Example cell from time course of bound LOV2 (left) and recruited Zap70 (right) loss after inactivation of antigen signaling with strong blue light. Jurkat cells expressing zdk-CAR and Zap70 biosensor were activated on LOV2 and ICAM-1 functionalized supported lipid bilayers (SLBs) for 3 min prior to the start of the video. Cells are illuminated with strong blue light at the start of the video, and the lifetime of bound LOV2 and recruited Zap70 are tracked using the ImageJ TrackMate plugin (magenta circles, MM:SS timestamp top left). Only tracks originating before blue-light illumination (start of the video) were included to filter out spurious tracks later in the time course (scale bar = 5μm).
Video 6
Lifetime of LOV2 and LAT after optogenetic signal termination.
Example cell from time course of bound LOV2 (left) and LAT clusters (right) loss after inactivation of antigen signaling with strong blue light. Jurkat cells expressing zdk-CAR and LAT biosensor were activated on LOV2 and ICAM-1 functionalized supported lipid bilayers (SLBs) for 3 min prior to the start of the video. Cells are illuminated with strong blue light at the start of the video, and the lifetime of bound LOV2 and recruited Zap70 are tracked using the ImageJ TrackMate plugin (magenta circles, MM:SS timestamp top left). Only tracks originating before blue-light illumination (start of the video) were included to filter out spurious tracks later in the time course (scale bar = 5μm).
Additional files
Download links
A two-part list of links to download the article, or parts of the article, in various formats.
Downloads (link to download the article as PDF)
Open citations (links to open the citations from this article in various online reference manager services)
Cite this article (links to download the citations from this article in formats compatible with various reference manager tools)
Progressive enhancement of kinetic proofreading in T cell antigen discrimination from receptor activation to DAG generation
eLife 11:e75263.
https://doi.org/10.7554/eLife.75263


