Autoinhibition and regulation by phosphoinositides of ATP8B1, a human lipid flippase associated with intrahepatic cholestatic disorders
- Université Paris-Saclay, CEA, CNRS, Institute for Integrative Biology of the Cell (I2BC), France
- DANDRITE, Nordic EMBL Partnership for Molecular Medicine, Department of Molecular Biology and Genetics, Aarhus University, Denmark
- Faculty of Chemistry and Biochemistry, Department of Molecular Biochemistry, Ruhr University Bochum, Germany
- Department of Molecular Biology and Genetics, Aarhus University, Denmark
- Department of Plant and Environmental Sciences, University of Copenhagen, Denmark
Figures
Figure 1 with 1 supplement
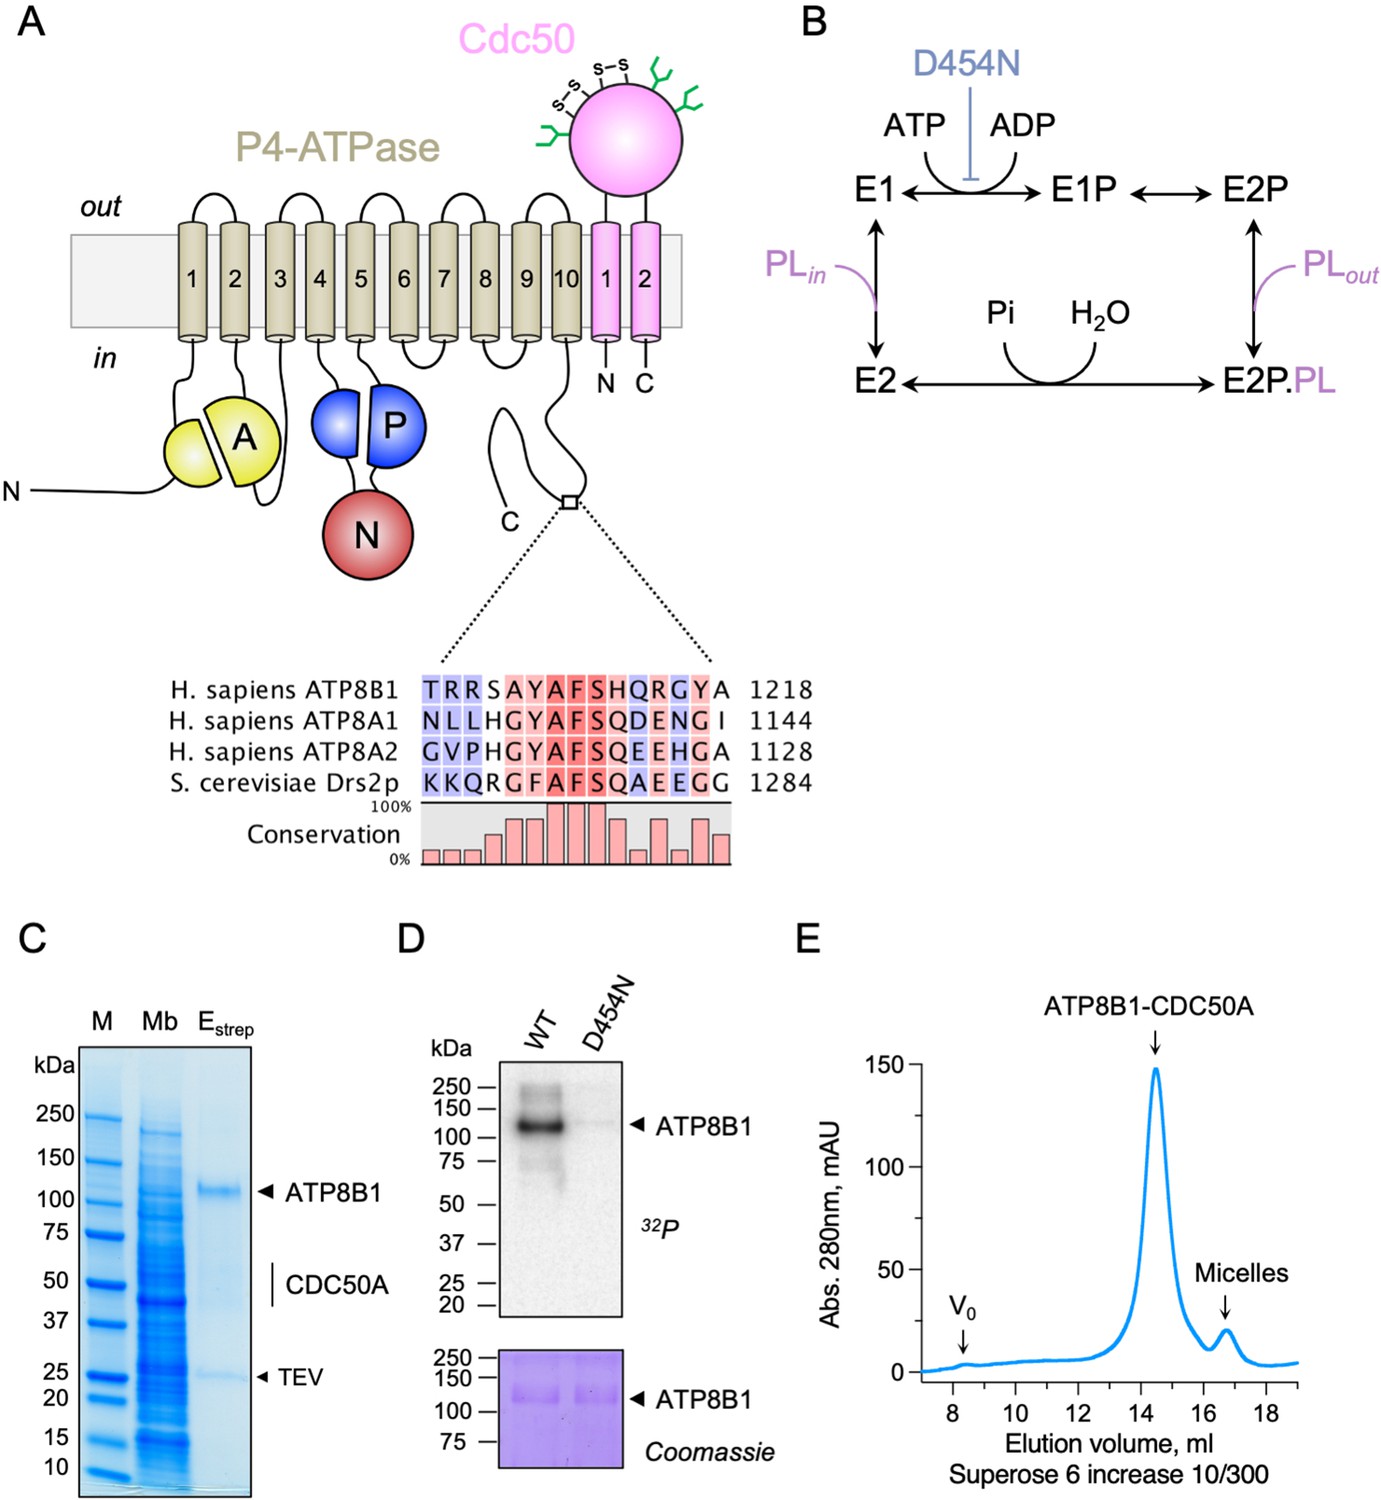
Purification and functional assessment of the ATP8B1-CDC50A complex expressed in Saccharomyces cerevisiae.
(A) Predicted topology of ATP8B1-CDC50A with the transmembrane domain of ATP8B1 in tan and the Actuator domain (A), the Nucleotide binding domain (N) and the Phosphorylation domain (P) in yellow, red, and blue, respectively. CDC50A with two transmembrane spans and a large exoplasmic loop is in pink; predicted disulphide bridges (S–S) and glycosylation sites (green) are indicated. Sequence alignment of part of the C-terminus of ATP8B1, ATP8A1, ATP8A2, and Drs2 (CLC Main Workbench, Qiagen). The shading indicates conservation (blue 0% – red 100%). Uniprot accession numbers are P39524 for Drs2, Q9Y2Q0 for ATP8A1, Q9NTI2 for ATP8A2 and O43520 for ATP8B1. (B) Post-Albers cycle for P4-ATPases. ATP8B1 mutation D454N prevents phosphorylation on the catalytic aspartate and thus blocks activity. Pi, inorganic phosphate; PL, phospholipid. (C) SDS-PAGE analysis of ATP8B1-CDC50A affinity purification on streptavidin beads. Crude yeast membranes (Mb), containing 25 µg of total proteins, of which ATP8B1 represents 0.5%, and ~1–1.5 µg proteins recovered upon TEV protease cleavage on streptavidin beads (Estrep) were loaded on the gel and visualized by Coomassie Blue staining. M, molecular weight marker. (D) Phosphoenzyme formation from [γ-32P]ATP of wild-type and catalytically-inactive D454N variant, as analyzed after electrophoretic separation on acidic gels. Coomassie Blue staining of the same gel was used to control the amount of wild-type and D454N subjected to 32P labeling. (E) Size-exclusion chromatography elution profile of the purified human ATP8B1-CDC50A complex used for cryo-EM studies. Arrows indicate the void volume of the column (V0), as well as the elution volume of the ATP8B1-CDC50A complex and detergent micelles.
Figure 1—figure supplement 1
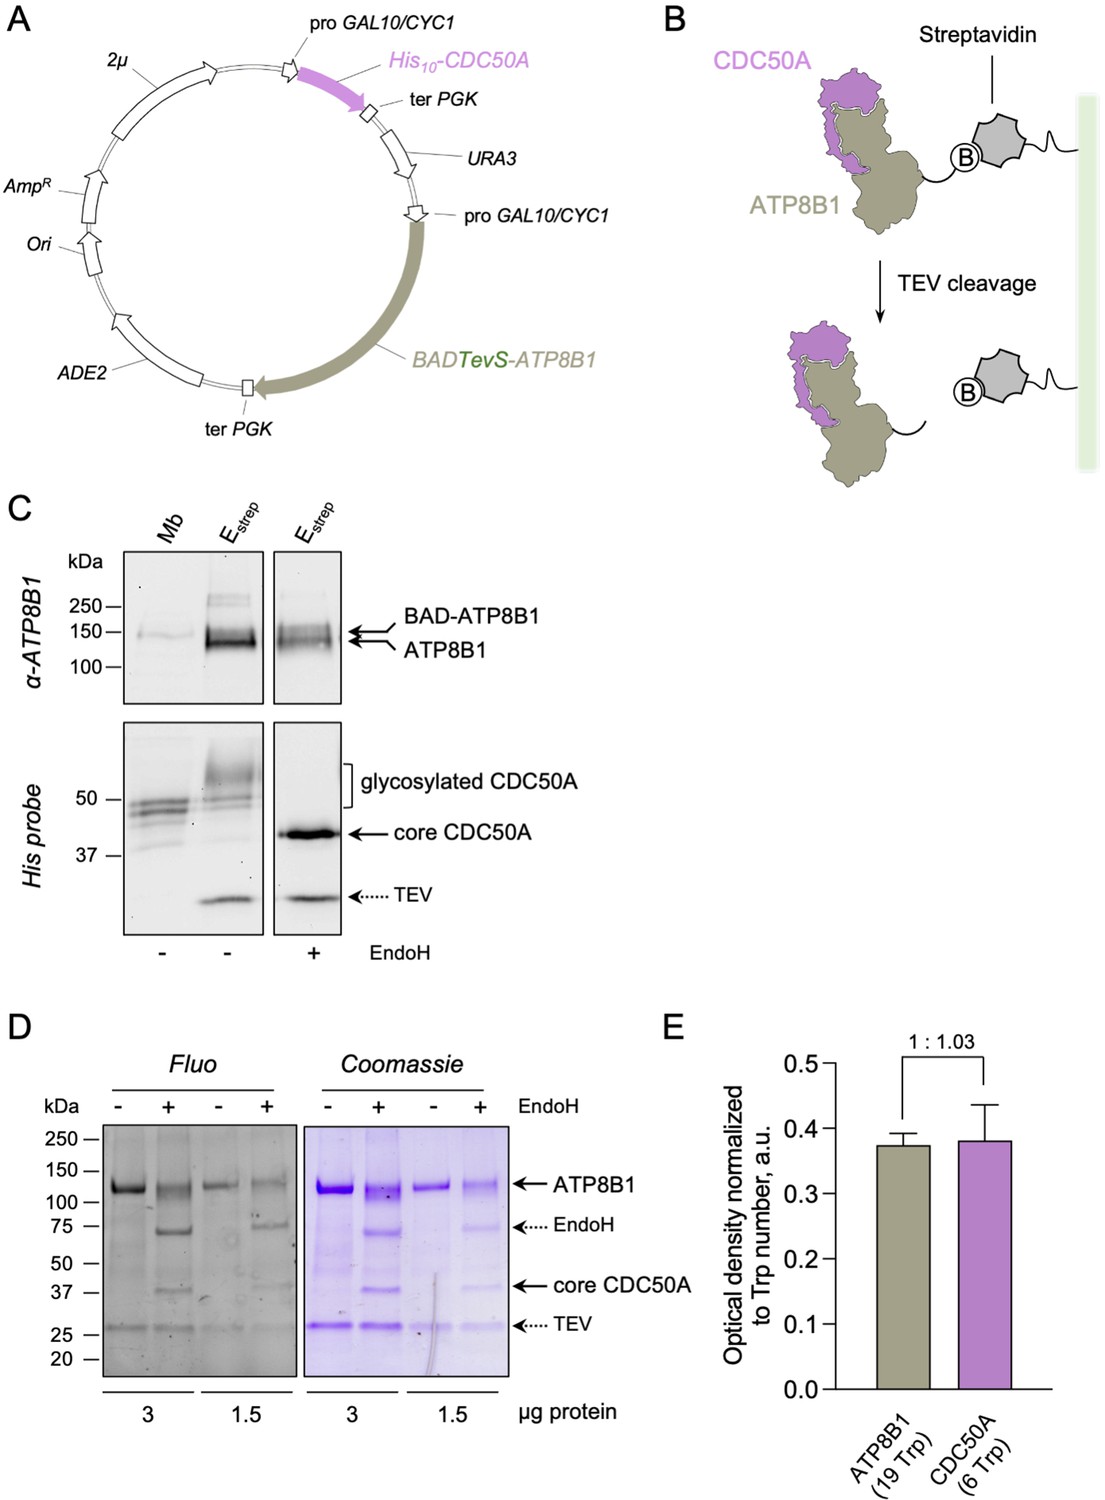
Strategy for purification of the ATP8B1-CDC50A complex.
(A) Map of the plasmid used for co-expression of BAD-ATP8B1 and His10-CDC50A. Both ATP8B1 and CDC50A genes are cloned into the same expression vector. The cDNA sequence of human CDC50A is fused to a N-terminal deca-histidine tag (His10), and the cDNA sequence of human ATP8B1 is fused to a N-terminal biotin acceptor domain (BAD) for in vivo biotinylation in yeast and further affinity purification on streptavidin beads ( Jidenko et al., 2006). The BAD tag is followed by the sequence of a TEV protease cleavage site. ATP8B1 and CDC50A open-reading frames are under the control of a strong hybrid galactose-inducible promoter (GAL10-CYC1). Ter PGK: sequence of the phosphoglycerate kinase used for termination of transcription; ADE2: auxotrophy selection marker for adenine; Ori: bacterial replication origin; AmpR: gene conferring resistance to ampicillin; 2μ: yeast replication origin; URA3: auxotrophic selection marker for uracil. (B) Purification scheme. The BAD-ATP8B1/His10-CDC50A complex is solubilized from yeast membranes and applied onto streptavidin beads. Incubation with TEV protease allows elution of ATP8B1-CDC50A complex from the beads and removal of the BAD tag. (C) ATP8B1-CDC50A purification assessed by immunoblot analysis. Yeast crude membranes (Mb) and eluted proteins (Estrep) were detected with either an anti-ATP8B1 antibody (upper panel) or a histidine probe (lower panel). For deglycosylation experiments, the eluted fraction was treated with EndoH. The band for ATP8B1 appears rather diffuse upon EndoH treatment because boiling prior loading induced aggregation. (D) Purified ATP8B1-CDC50A complex was loaded at the indicated amount onto a haloalkane-containing 4–15% gradient SDS-PAGE for in-gel fluorescence analysis (left, Fluo) and subsequent Coomassie Blue staining (right, Coomassie). Assuming that all tryptophan residues react similarly to haloalkane in denaturing conditions, the fluorescence intensity measured accurately reflects the number of tryptophans in the protein and therefore the amount of protein loaded. (E) Relative fluorescence intensity of ATP8B1 and CDC50A bands observed in panel D, as deduced from quantification using ImageJ. The error bars represent the mean ± s.d. calculated from the loading of two different quantities of purified ATP8B1-CDC50A complex (3 and 1.5 µg). The experiment displayed in (D) and (E) is representative of three independent ones with similar results. Source files related to (E) are available in Figure 1—figure supplement 1—source data 1.
-
Figure 1—figure supplement 1—source data 1
GraphPad Prism tables for results displayed in Figure 1—figure supplement 1E.
- https://cdn.elifesciences.org/articles/75272/elife-75272-fig1-figsupp1-data1-v2.pdf
Figure 2 with 3 supplements
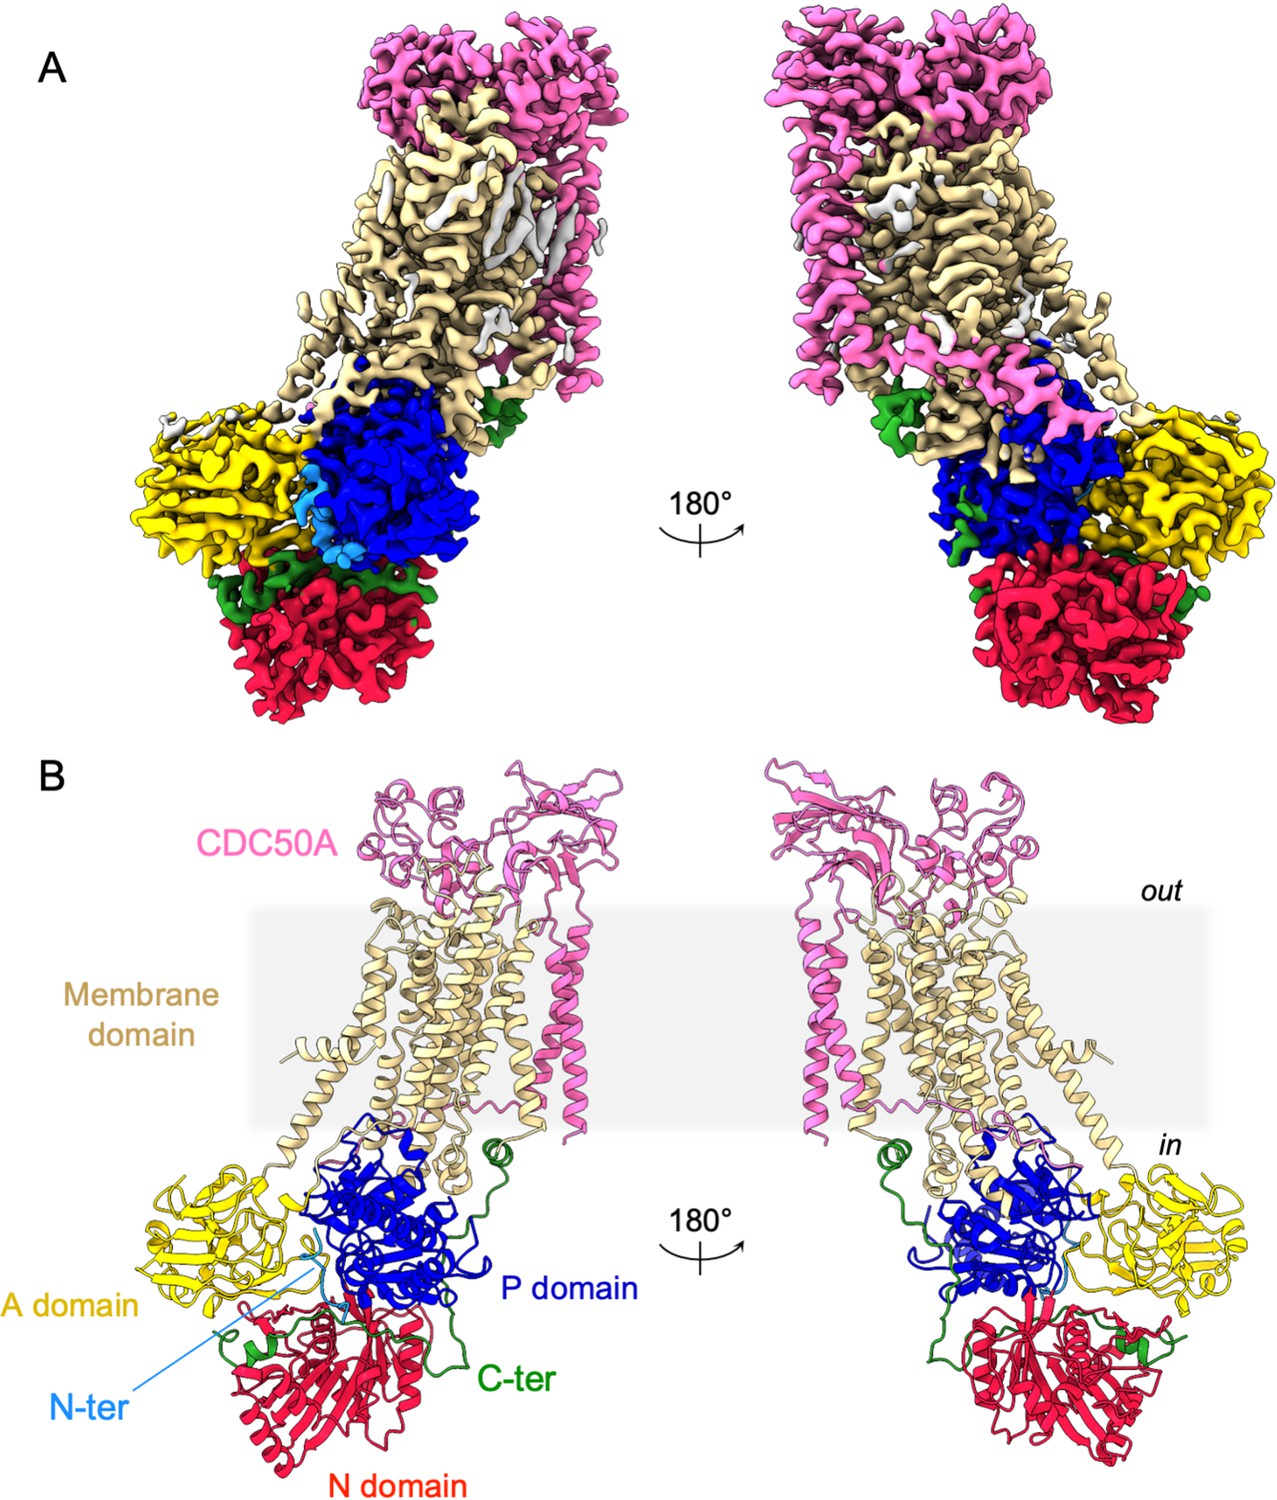
Overall ATP8B1-CDC50A structure.
(A) Cryo-EM map of ATP8B1-CDC50A in the E2P autoinhibited state. The cytosolic A-, N-, and P-domains of ATP8B1 are colored in yellow, red and blue, respectively. The transmembrane domain of ATP8B1 is colored in tan. The N- and C-terminal tails of ATP8B1 are colored in cyan and green, respectively. CDC50A is colored in pink. CHS densities and residual densities corresponding to detergent or less ordered unmodelled lipids are in grey. (B) Cartoon representation of the refined model. Colors are as in (A). Electron microscopy data bank (EMDB) accession number: EMD-13711. Protein Data Bank (PDB) accession number: 7PY4.
Figure 2—figure supplement 1

Data processing flow chart.
(A) Representative motion-corrected and dose weighted micrograph. (B) Data-processing workflow performed in CryoSparc v3.
Figure 2—figure supplement 2
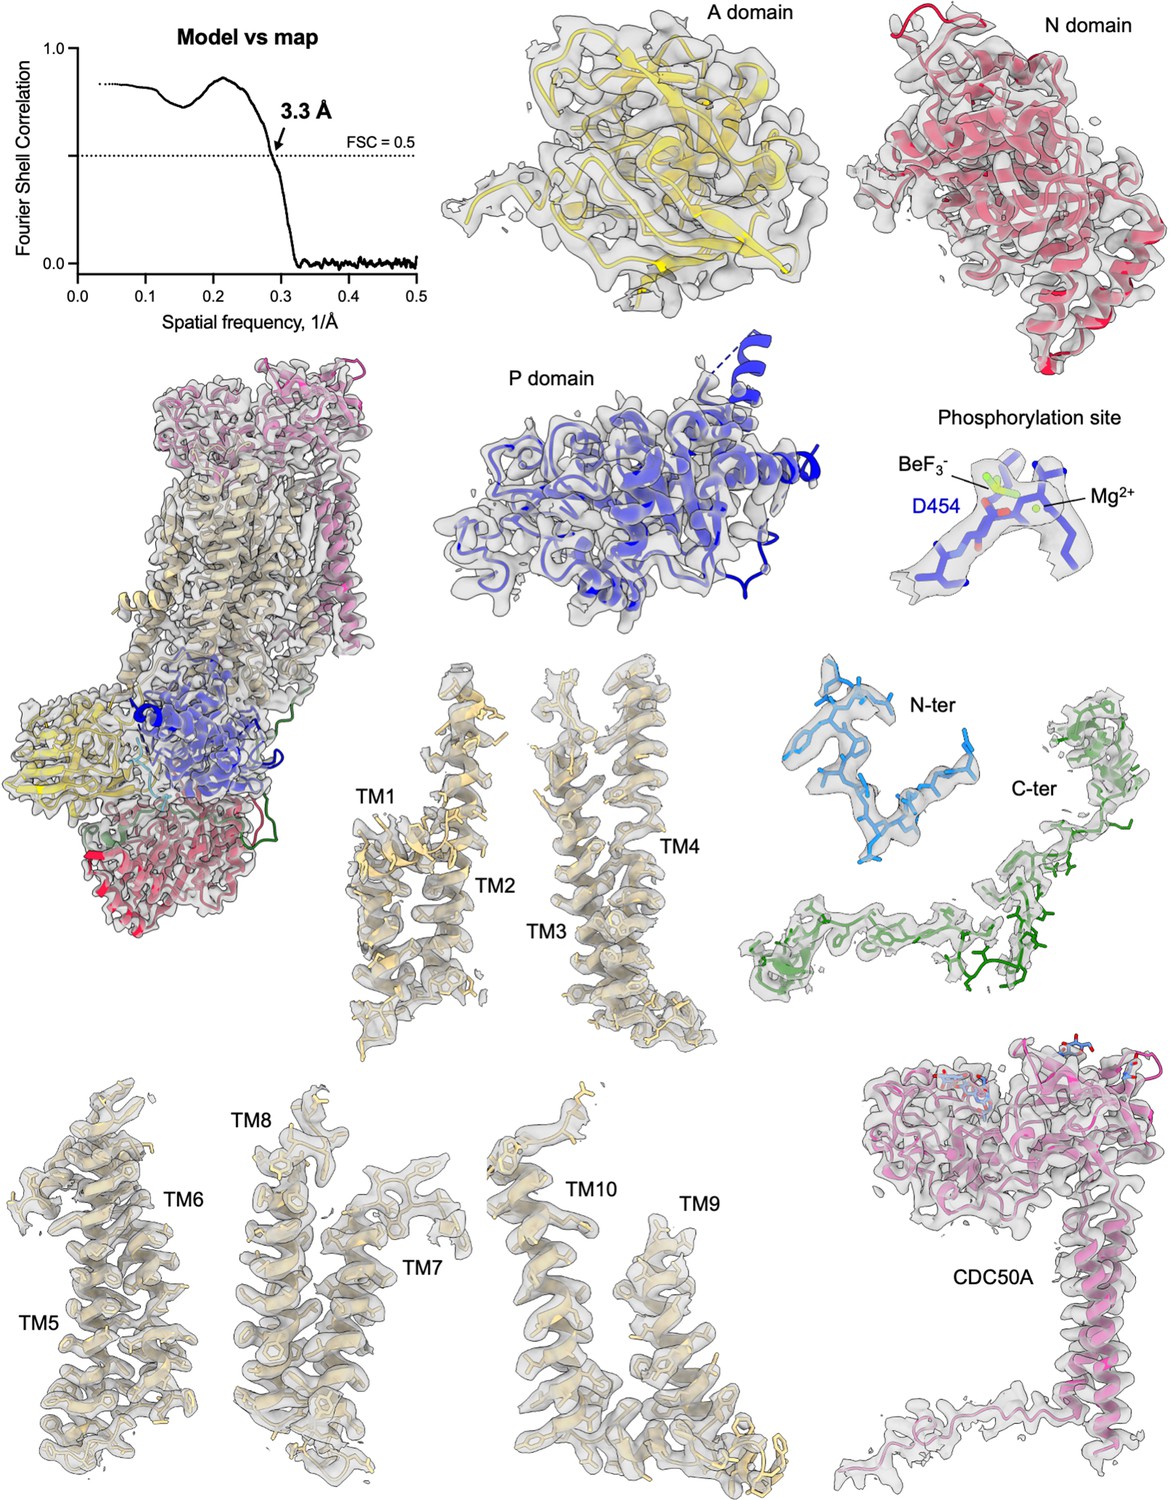
Cryo-EM density of the ATP8B1-CDC50A complex and its corresponding model.
Map to model FSC curve and cryo-EM densities from different areas of the ATP8B1-CDC50A complex in the E2P autoinhibited state. Cryo-EM map contour levels used are 5–9. TM: transmembrane helical segments.
Figure 2—figure supplement 3
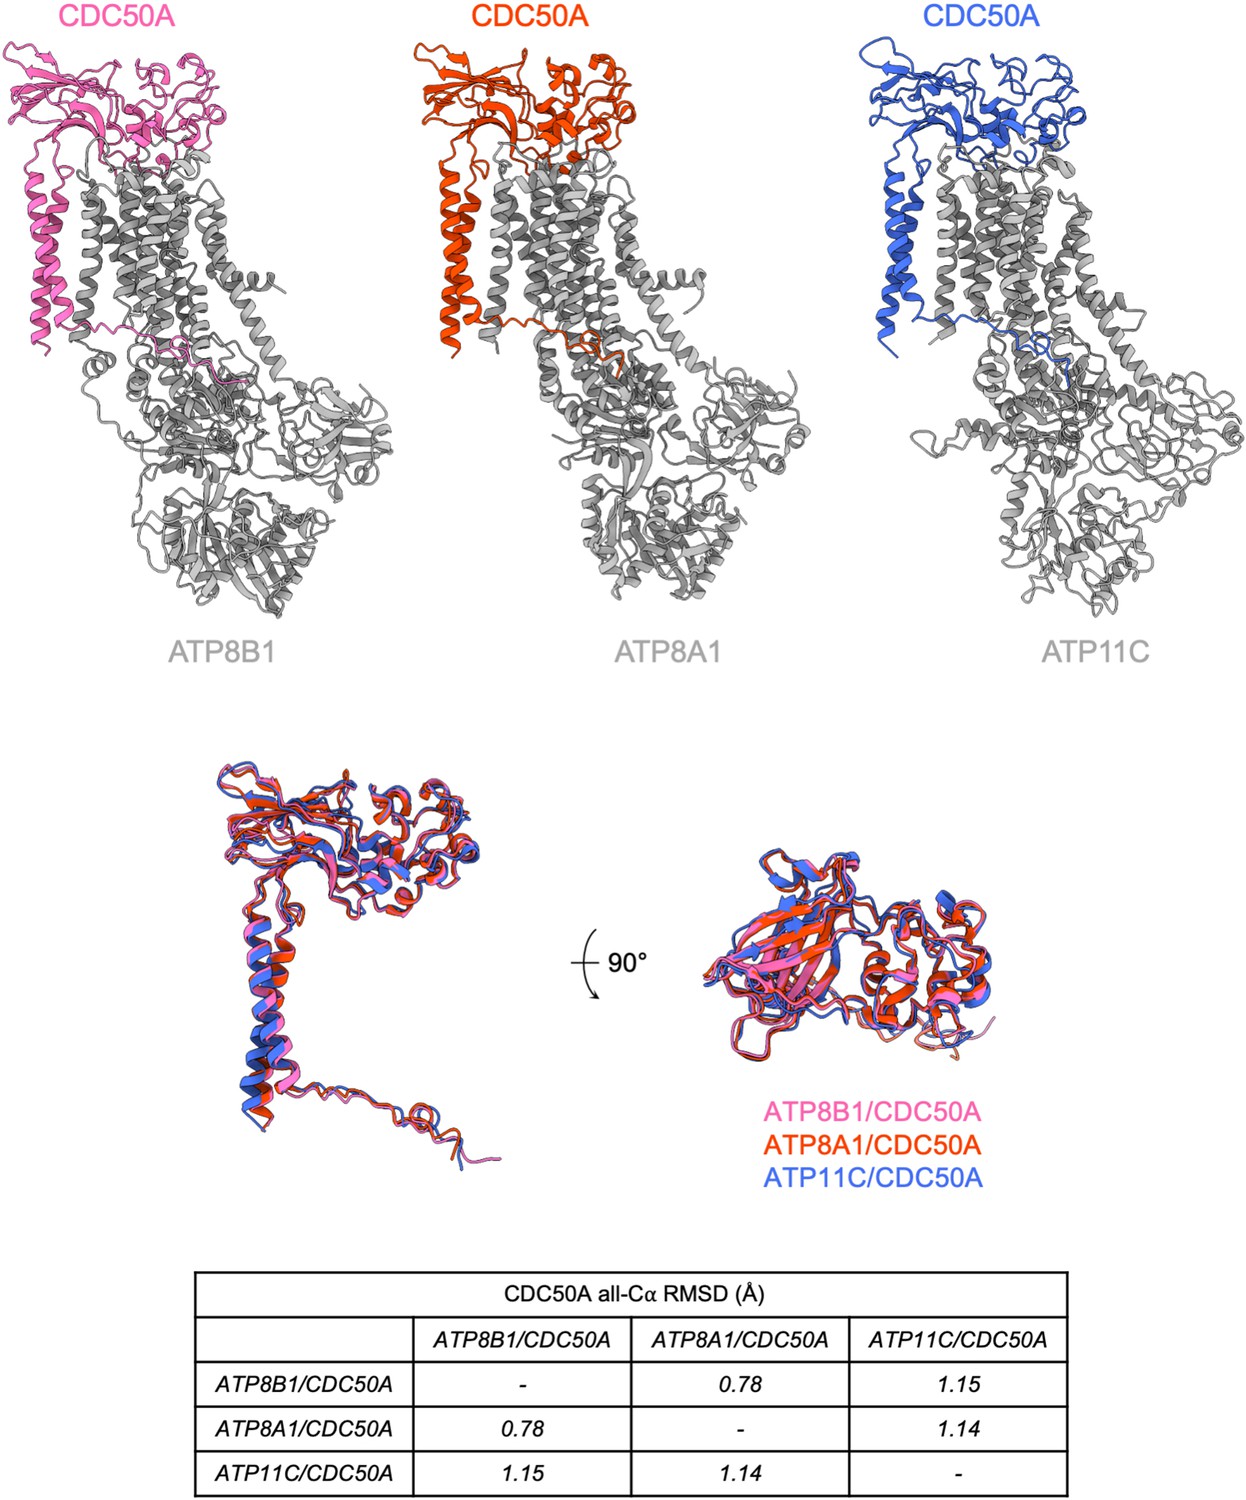
Structural comparison of P4-ATPases-CDC50A complexes of known structure.
(A) Atomic models of CDC50A in complex with ATP8B1, ATP8A1 (PDB: 6K7L) and ATP11C (6LKN), colored in pink, orange, and blue, respectively. P4-ATPases are colored in gray. (B) Structural alignment of CDC50A from 3 complexes formed with different human P4-ATPases and associated Cα-RMSD. Colors are as in (A).
Figure 3 with 1 supplement
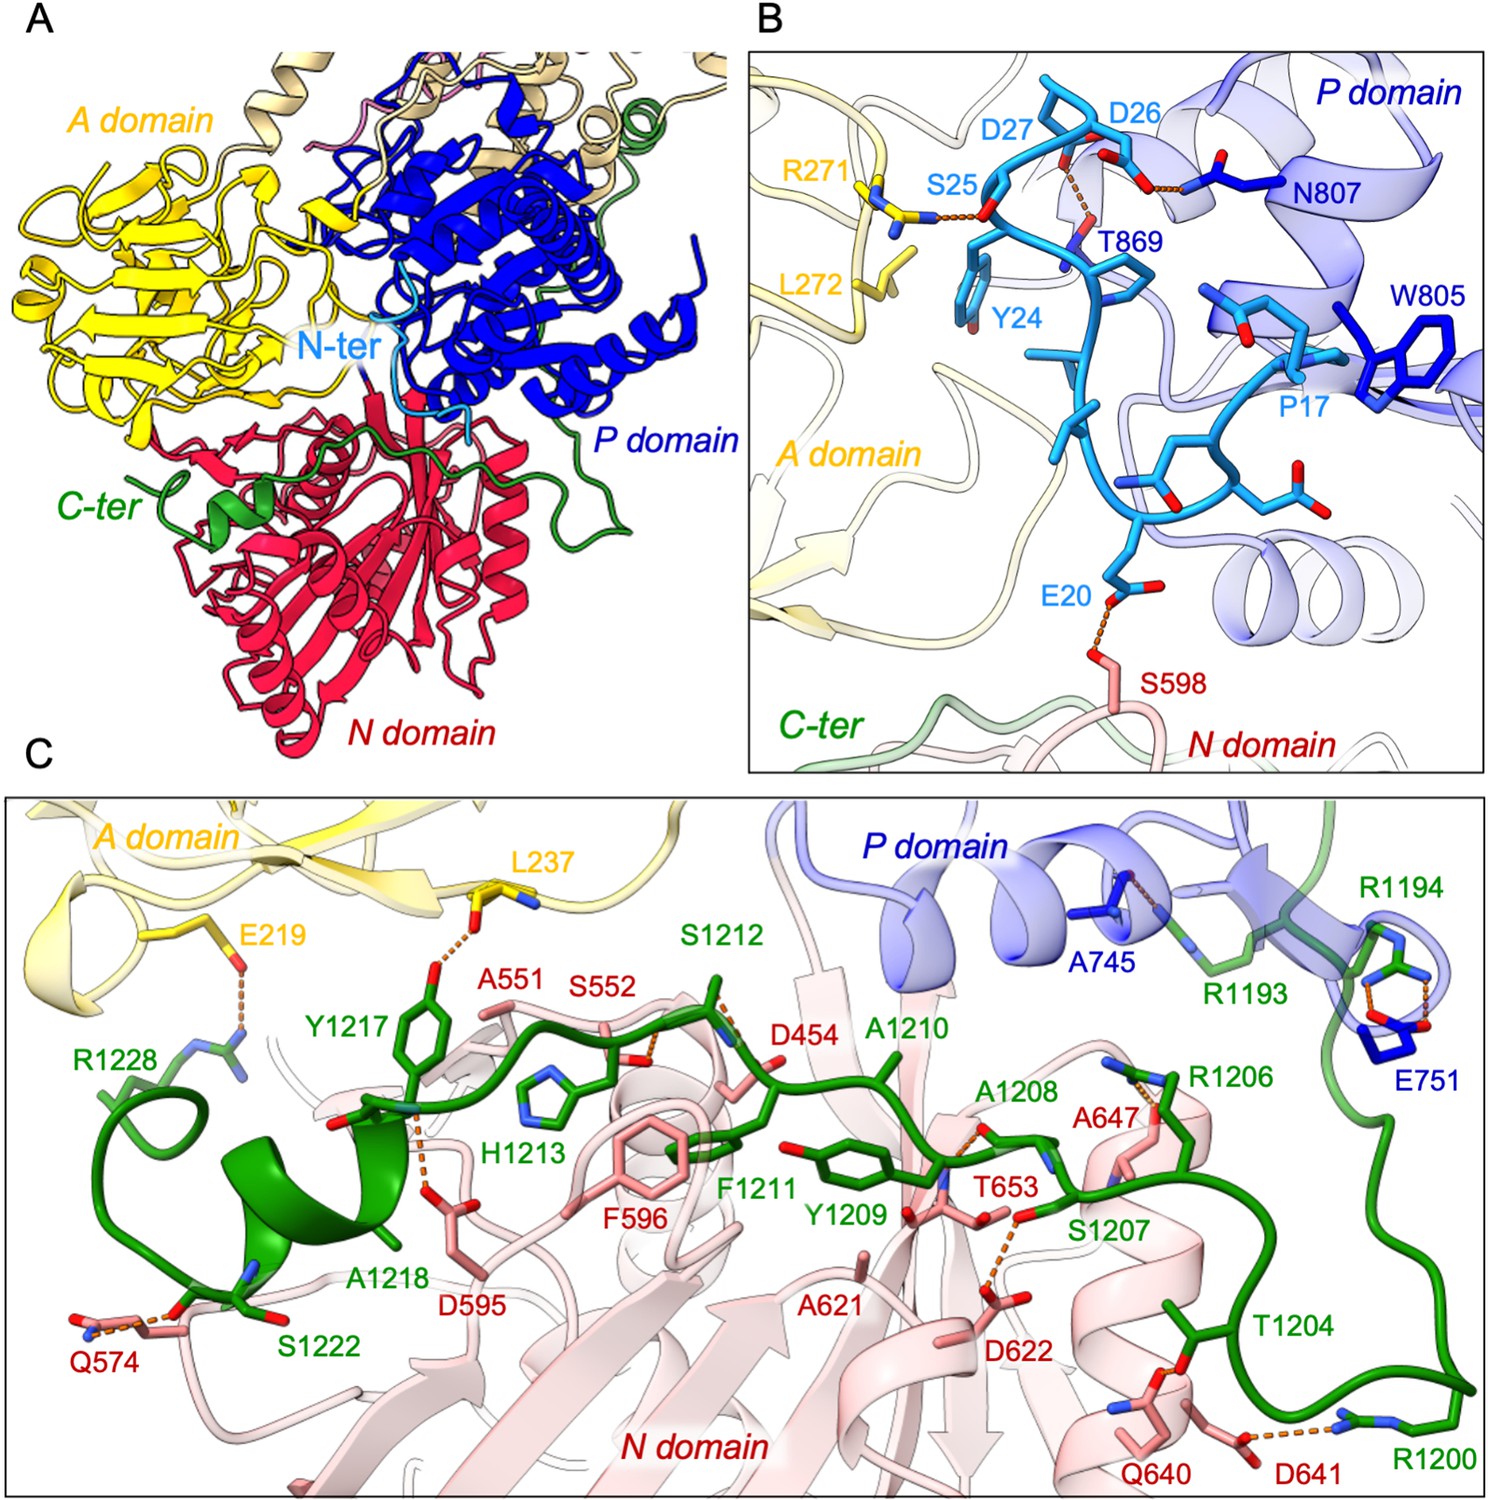
Detailed interaction of the N- and C-terminal tails with the cytosolic A-, N-, and P-domains of ATP8B1.
(A) Overall view of the cytosolic A-, N-, and P-domains colored in yellow, red and blue, respectively. The transmembrane domain is colored tan. The N- and C-terminal tails of ATP8B1 are colored in cyan and green, respectively. (B, C) Close-up view highlighting the interactions between residues in the N-terminal tail and the cytosolic domains of ATP8B1 (B) or the C-terminal tail and the cytosolic domains of ATP8B1 (C). Electrostatic interactions are shown as orange dashes.
Figure 3—figure supplement 1
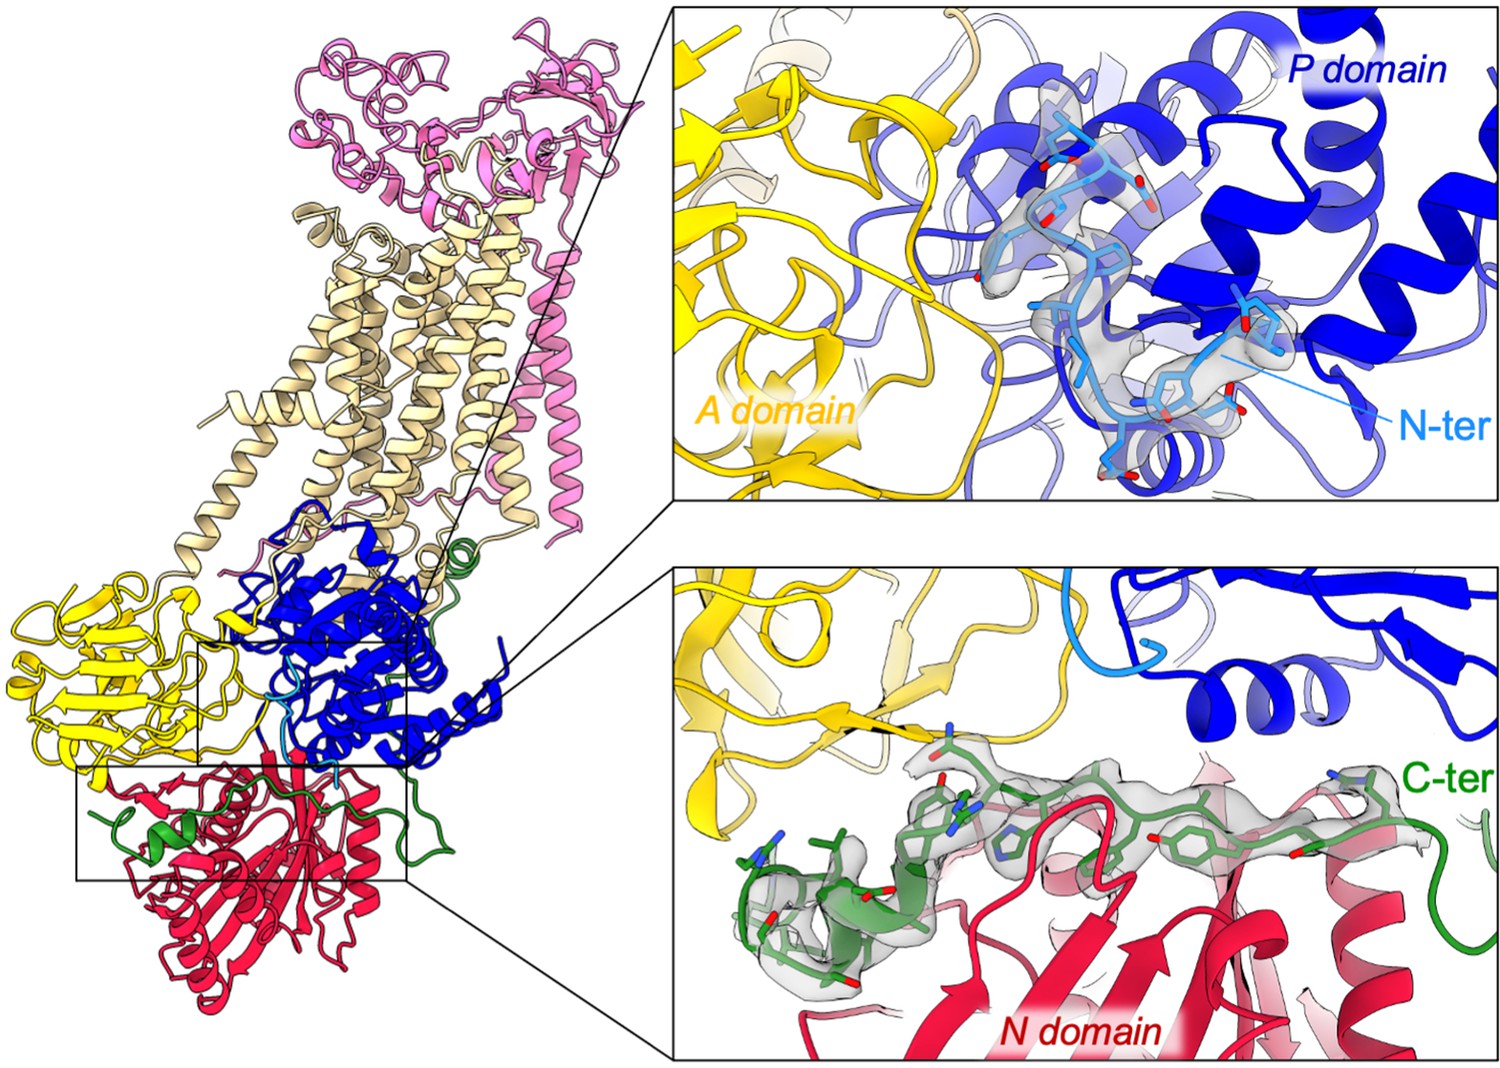
overall and close-up views of the N- and C-terminal extensions of ATP8B1 and their corresponding EM densities.
The cytosolic A-, N-, and P-domains of ATP8B1 are colored in yellow, red, and blue, respectively. The transmembrane domain of ATP8B1 is colored in tan. The N- and C-terminal tails of ATP8B1 and their side chains are colored in cyan and green, respectively. CDC50A is colored in pink.
Figure 4 with 4 supplements
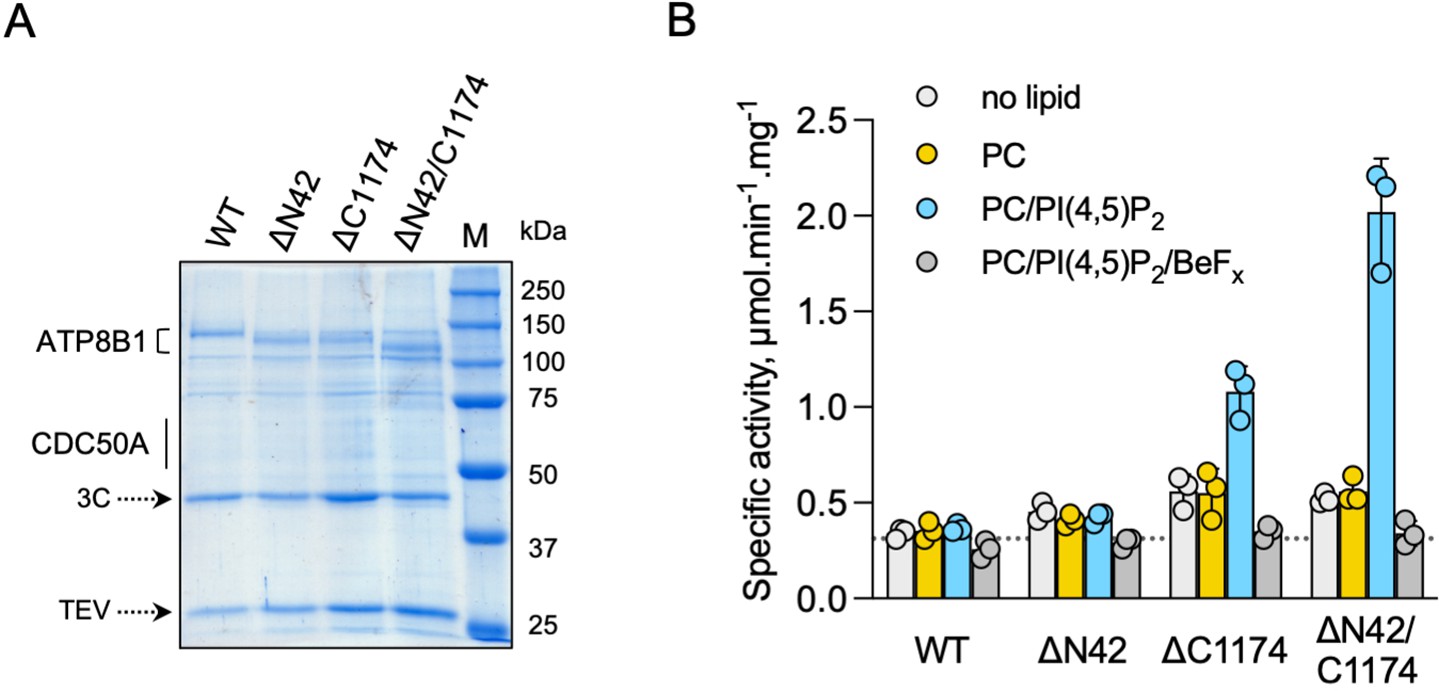
ATP8B1-CDC50A is autoinhibited by both its N- and C-terminal tails and the presence of lipids is required for its activity.
(A) Removal of N- and/or C-terminal extensions of ATP8B1 upon on-column cleavage of streptavidin-bound ATP8B1-CDC50A with both TEV and 3 C proteases assessed by Coomassie blue stained SDS-PAGE. ΔN42 lacks residues 1–42 of ATP8B1 whereas ΔC1174 lacks residues 1175–1251 and ΔN42/C1174 lacks both. M, molecular weight marker. Streptavidin-purified wild-type (WT) and truncated mutants were used for subsequent ATPase assays. (B) ATPase activity of wild-type (WT), N-terminally truncated (ΔN42), C-terminally truncated (ΔC1174) and both N- and C-terminally truncated (ΔN42/C1174) ATP8B1 ( ~ 5 µg ml–1 protein) in complex with CDC50A determined in DDM at 30 °C. The assay medium contained 1 mM MgATP, 0.5 mg ml–1 DDM, and 0.01 mg ml–1 CHS. PC and PI(4,5)P2 were added at 0.1 mg ml–1 (132 µM) and 0.025 mg ml–1 (23 µM), respectively, resulting in a DDM final concentration of 1.25 mg ml–1. The PC/PI(4,5)P2 ratio is therefore 5.8 (mol/mol) Data are a mean ± s.d. of three technical replicate experiments (purification #1, see Materials and methods). The dotted line represents background NADH oxidation due to photobleaching, measured in the absence of purified protein and lipids. Source files related to (B) are available in Figure 4—source data 1.
-
Figure 4—source data 1
GraphPad Prism tables for results displayed in Figure 4B.
- https://cdn.elifesciences.org/articles/75272/elife-75272-fig4-data1-v2.pdf
Figure 4—figure supplement 1

Sequence alignment of selected P4-ATPases.
Sequences of the human ATP8B1, ATP8B2, ATP8B3, ATP8B4, ATP8A1, ATP8A2, the S. cerevisiae Drs2, the C. elegans tat-1, tat-2, tat-4, the A. thaliana ALA3, the C. neoformans Apt2, the P. falciparum ATP2 were aligned based on the presence of the conserved motif found on the regulatory C-terminus of ATP8B1, Drs2, ATP8A1 and ATP8A2. For comparison, the sequence of the C. thermophilum P5-ATPase Ypk9 is shown. Sequences were aligned using the ClustalW server and manually edited for the C-terminal region because of the very low conservation of this region (apart from the (G/A)(Y/F)AFS motif). The shading indicates conservation (blue 0% – red 100%). Mutations found in PFIC1, BRIC1, and ICP1 are indicated with red diamonds. The various cytosolic domains and transmembrane helices of ATP8B1 are indicated above the sequences. Residues P42 and E1174, after which 3 C protease cleavage sites were added, and the S1223 which is phosphorylated in mouse ATP8B1 are highlighted with arrows. The sequence used for the synthesis of the autoinhibitory C-terminal peptide is emphasized by a green box. Uniprot identifiers: ATP8B1 (O43520), ATP8B2 (P98198), ATP8B3 (O60423), ATP8B4 (Q8TF62), ATP8A1 (Q9Y2Q0), ATP8A2 (Q9NTI2),Drs2 (P39524), tat-1 (Q9U280), tat-2 (Q9TXV2), tat-4 (H2KZ37), ALA3 (Q9XIE6), Apt2 (Q5K6X2 ), PfATP2 (Q8I5L4), Ypk9 (G0S7G9).
Figure 4—figure supplement 2

The amount of CDC50A which co-elutes with ATP8B1 upon on-column cleavage with TEV and 3 C proteases is similar for wild-type ATP8B1 (WT) and the 3 C protease cleavage site insertion mutants (ΔN42, ΔC1174, ΔN42/C1174).
The ATP8B1-CDC50A complex recovered from streptavidin beads upon proteolytic cleavage was denatured, treated with EndoH for 1 hr at 37 °C, and analyzed by immunoblotting with a Histidine probe.
Figure 4—figure supplement 3
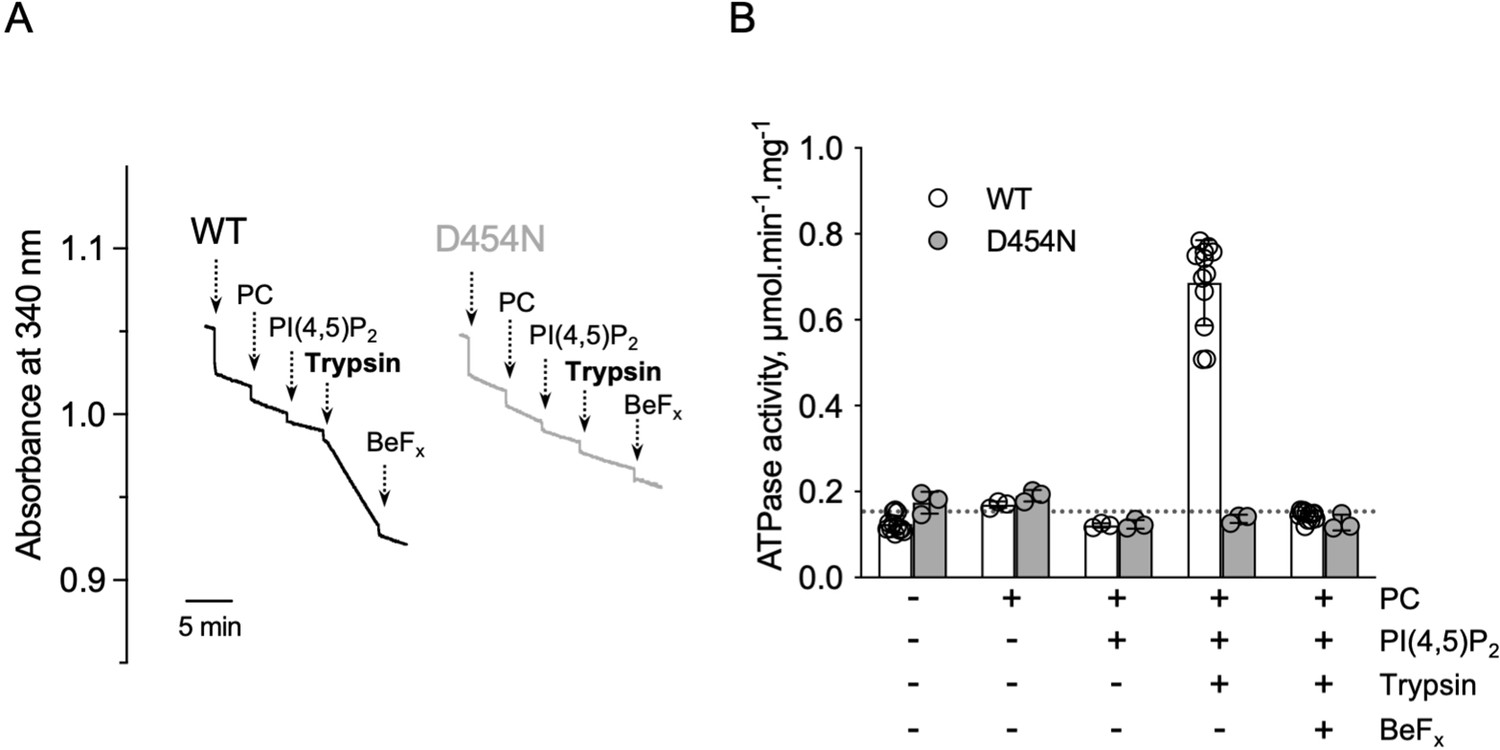
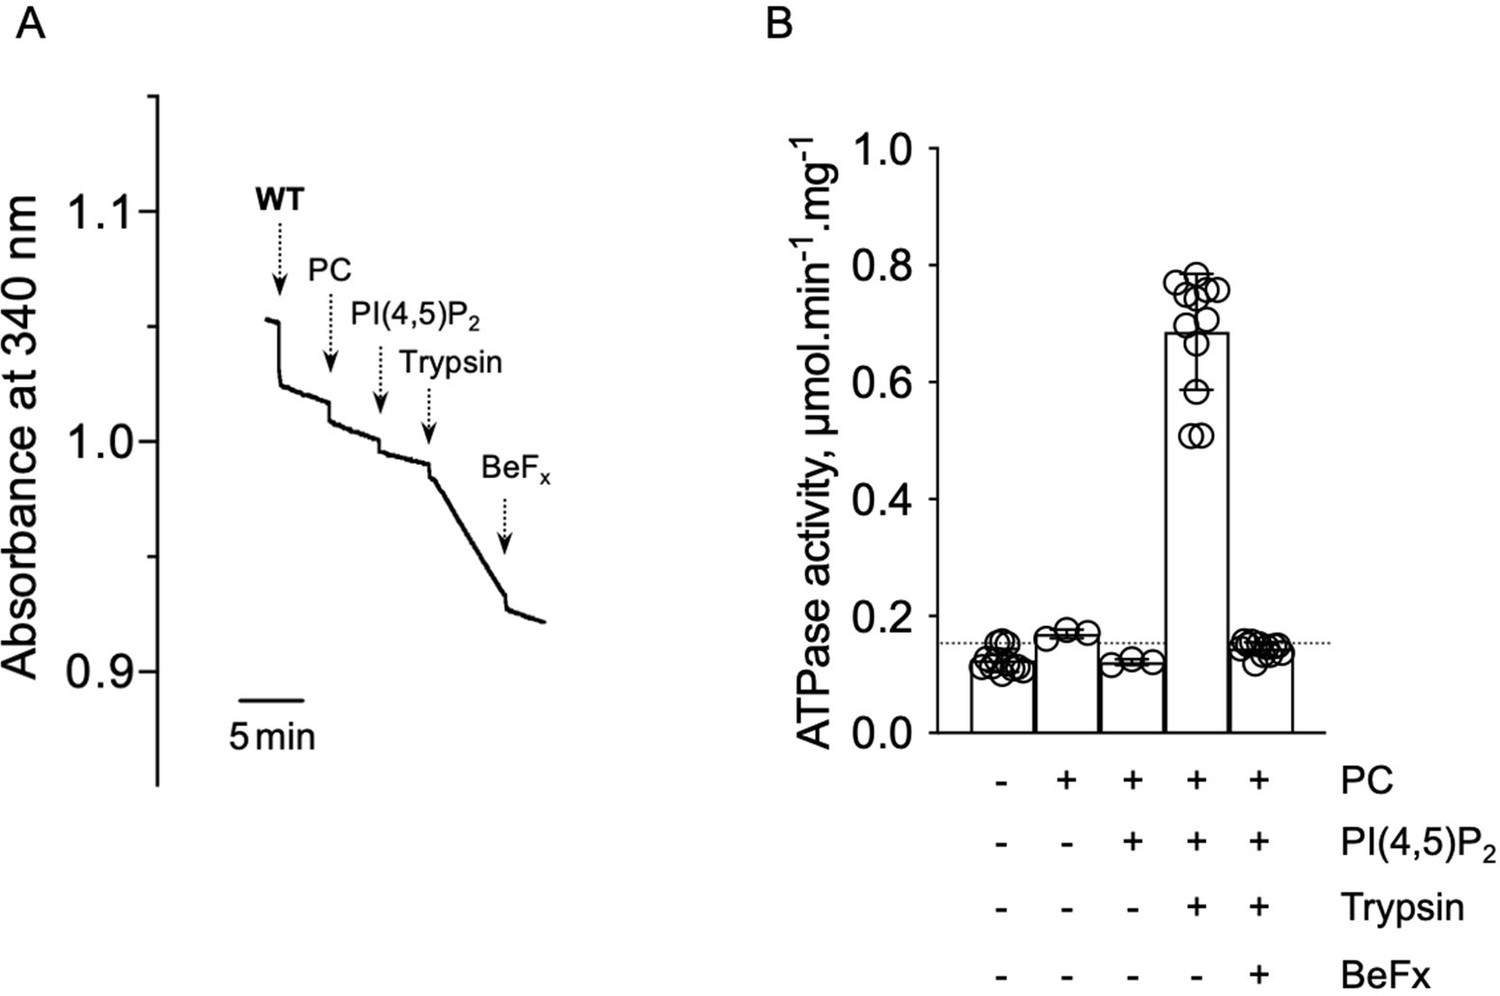
ATPase activity measurements of streptavidin-purified WT and catalytically-inactive D454N ATP8B1-CDC50A.
(A) ATPase activity of the purified ATP8B1-CDC50A complex determined in DDM/CHS at 30 °C, using an enzyme-coupled assay, where the kinetics of NADH oxidation is monitored continuously. The various additions in the assay cuvette are indicated with arrows. ATP8B1 was added at ~2 µg ml–1 to continuously stirred cuvettes in an assay medium containing 1 mM MgATP, 0.5 mg ml–1 DDM, and 0.01 mg ml–1 CHS in buffer B. PC and PI(4,5)P2 were added at 0.1 mg ml–1 and 0.025 mg ml–1, respectively, resulting in a DDM final concentration of 1.25 mg ml–1. Trypsin and BeFx were added at 0.07 mg ml–1 and 1 mM, respectively. The rate of ATP hydrolysis corresponds to the slope measured after each addition. Activity is revealed upon addition of trypsin. (B) Specific ATPase activity of WT ATP8B1-CDC50A measured from traces such as that displayed in (A). The dotted line represents the background NADH oxidation level, as measured before addition of ATP8B1-CDC50A in the assay cuvette. Data in (B) are a mean ± s.d. of 6–12 replicate experiments. PC: phosphatidylcholine. Source files related to (B) are available in Figure 4—figure supplement 3—source data 1.
-
Figure 4—figure supplement 3—source data 1
GraphPad Prism tables for results displayed in Figure 4—figure supplement 3B.
- https://cdn.elifesciences.org/articles/75272/elife-75272-fig4-figsupp3-data1-v2.pdf
Figure 4—figure supplement 4
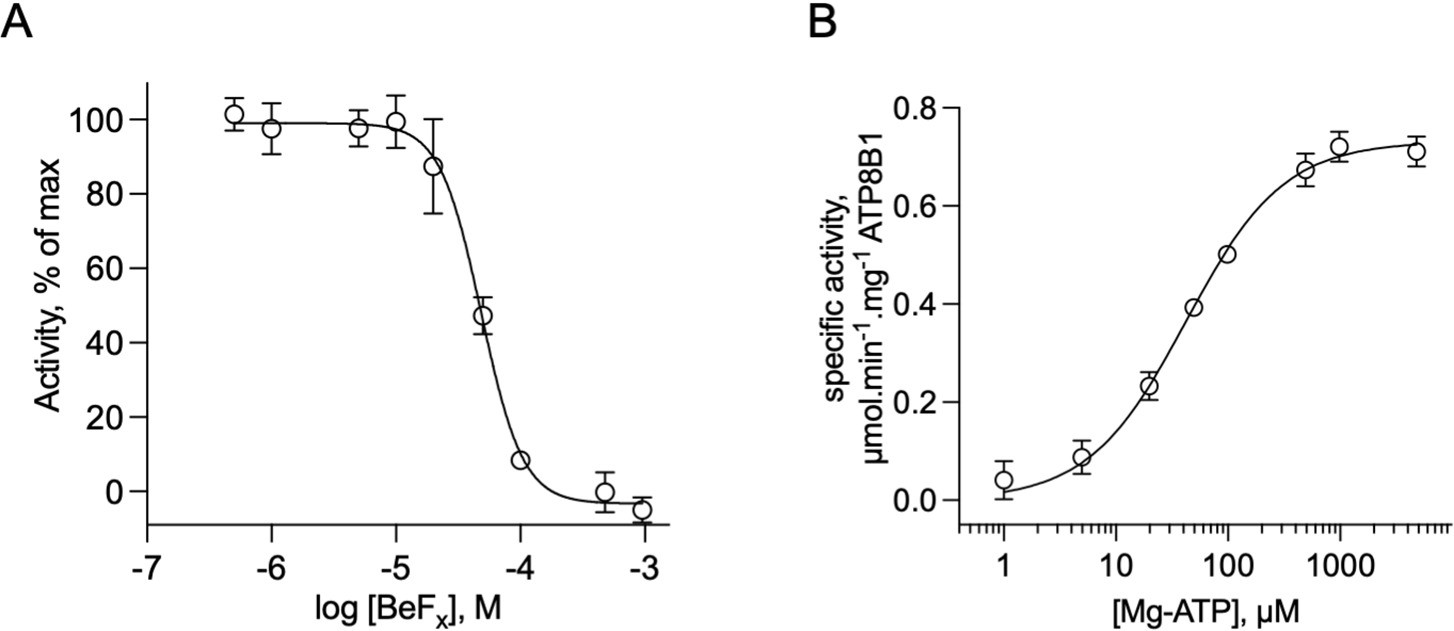
Catalytic properties of the purified ATP8B1-CDC50A complex.
(A) Sensitivity to beryllium fluoride of ATP8B1 turnover rate. ATPase activity of ΔN42/C1174 ATP8B1 was measured at 30 °C in the presence of increasing concentrations of BeFx, with 2 mM DDM, 115 µM PC, 23 µM PI(4,5)P2, and ~0.5 µg ml–1 ΔN42/C1174 in the assay cuvette. Data are a mean ± s.d. of three replicate experiments. The activity in the absence of BeFx was taken as 100% and data were fitted to an inhibitory dose-response equation with variable slope. 95% confidence interval for IC50 value: CI[4.29 × 10⁻⁵, 5.43 × 10⁻⁵]. (B) Dependence on MgATP of the turnover rate. ATPase activity of ΔN42/C1174 ATP8B1 was measured at 30 °C in the presence of increasing concentrations of MgATP, with 2 mM DDM, 115 µM PC, 23 µM PI(4,5)P2, and ~0.5 µg ml–1 ΔN42/C1174 in the assay cuvette. Data are a mean ± s.d. of three replicate experiments. The data were fitted to a Michaelis-Menten equation. For panels (B) and (C), the rate of ATP hydrolysis was corrected for NADH photobleaching. Source files related to (A, B) are available in Figure 4—figure supplement 4—source data 1.
-
Figure 4—figure supplement 4—source data 1
GraphPad Prism tables and curve fitting for results displayed in Figure 4—figure supplement 4A, B.
- https://cdn.elifesciences.org/articles/75272/elife-75272-fig4-figsupp4-data1-v2.pdf
Figure 5 with 1 supplement
Autoinhibition of ATP8B1 by its N- and C-terminal extensions.
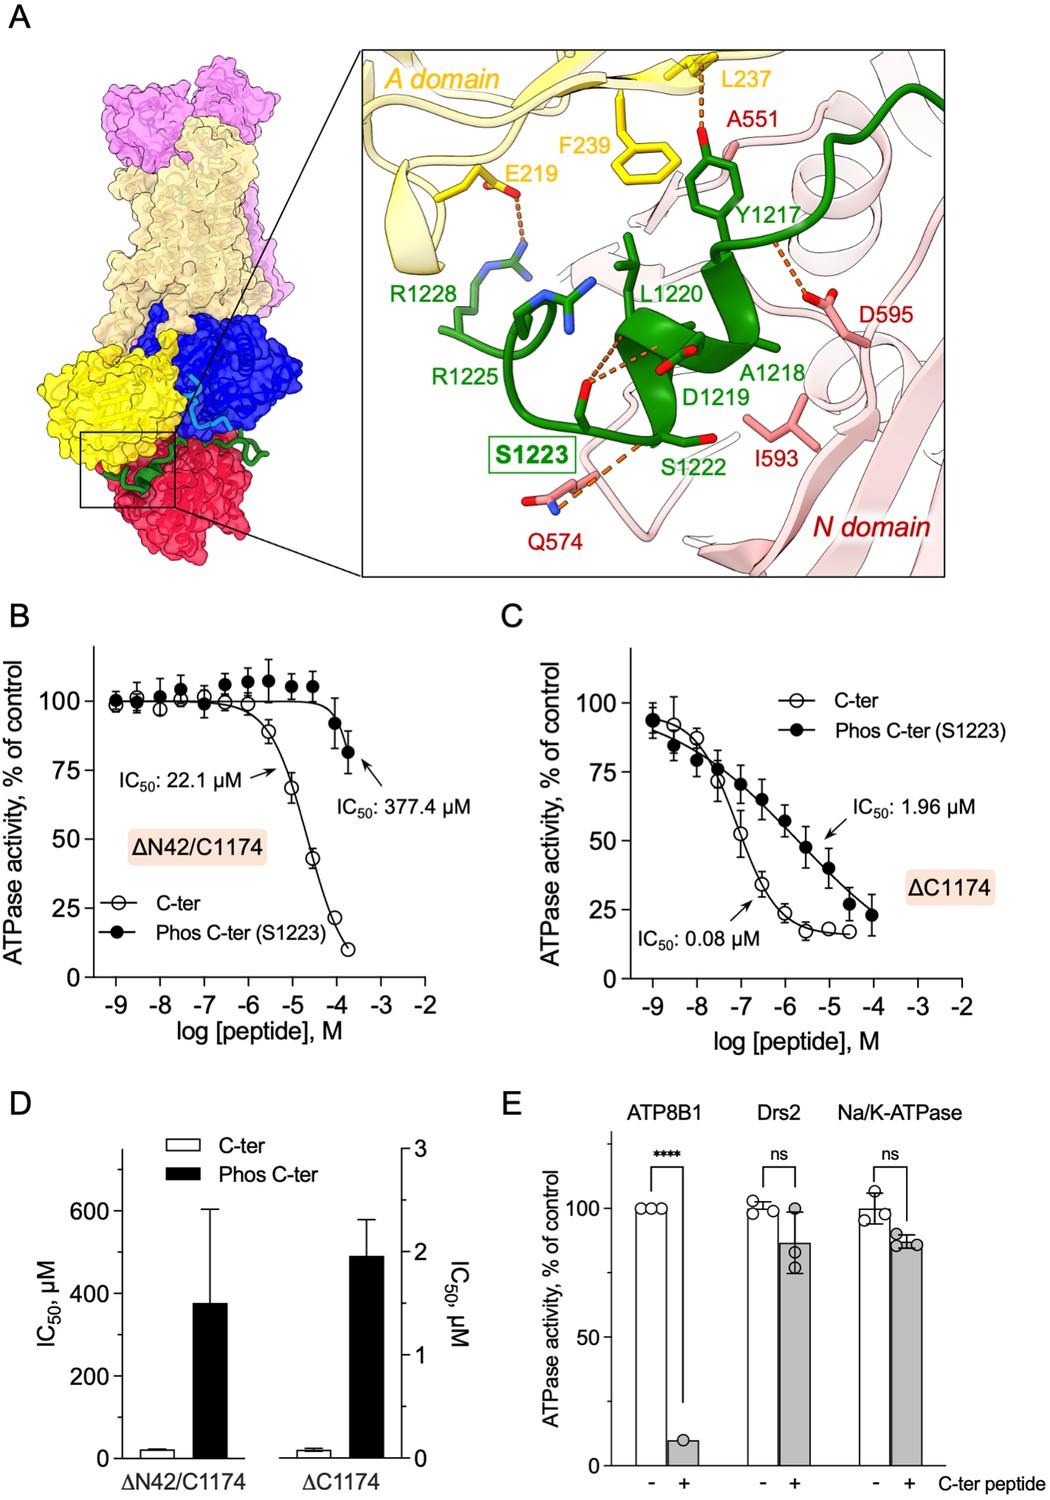
(A) Overall and close-up views of S1223 in the cleft formed by the A- and N-domains. The cytosolic A- and N-domains of ATP8B1 are colored in yellow and red, respectively, and are shown as surface and cartoon. The C-terminal tail of ATP8B1 is shown as cartoon with side chains in green. Electrostatic interactions are shown as orange dashes. (B) Back-inhibition of ΔN42/C1174 ATP8B1 ( ~ 3–3.3 µg ml–1 protein) by synthetic C-terminal peptides (C-ter, Phos C-ter). ATPase activity was determined at 37 °C. The BeFx-sensitive ATPase activity is plotted, taking the activity in the absence of the C-terminal peptide as 100%. The data were fitted to an inhibitory dose-response equation with variable slope. 95% confidence intervals for IC50 values are given as CI[lower CI, upper CI]. C-terminal peptide: CI[1.98 × 10⁻⁵, 2.48 × 10⁻⁵]; phosphorylated C-terminal peptide: CI[1.44 × 10⁻⁴, 9.90 × 10⁻⁴]. Data are mean ± s.d. of three replicate experiments (purification #2, see Materials and methods). (C) Back-inhibition of ΔC1174 ( ~ 3–3.3 µg ml–1 protein) by C-terminal peptides. ATPase activity was determined at 37 °C. The BeFx-sensitive ATPase activity is plotted, taking the activity in the absence of C-terminal peptide as 100%. The data were fitted to an inhibitory dose-response equation with variable slope. C-terminal peptide: CI[5.86 × 10⁻⁸, 1.12 × 10⁻⁷]; phosphorylated C-terminal peptide: CI[1.40 × 10⁻⁶, 2.73 × 10⁻⁶].Data are a mean ± s.d. of three to four replicate experiments (purification #2, see Materials and methods). For panels (B) and (C), the assay medium contained 1 mM MgATP, 0.5 mg ml–1 DDM, and 0.01 mg ml–1 CHS. PC and PI(4,5)P2 were added at 43 µg ml–1 (43 µM) and 0.025 mg ml–1 (23 µM), respectively. (D) Half-maximal inhibitory concentration (IC50) of ATP8B1-CDC50A ATPase activity by C-terminal peptides deduced from curves in (B) and (C). Error bars represent the mean ± s.d. based on 33–47 data points. (E) Specificity of ATP8B1 inhibition by its C-terminal tail. ATPase activity of purified DDM-solubilized Drs2-Cdc50 (20 µg ml–1) and pig α1β1 Na+/K+-ATPase (10 µg ml–1) in microsomal membranes was determined at 30°C and 37°C, respectively, in the absence or presence of 180 µM ATP8B1 C-terminal peptide. The results shown in this panel for ATP8B1 inhibition are the same as those displayed in panel (B) for a concentration of 180 µM C-terminal peptide. The rate of ATP hydrolysis was corrected for NADH photobleaching and the activity in the absence of the C-terminal peptide was taken as 100% for each species. **** p < 0.0001 according to two-way ANOVA with Tukey’s test vs activity in the absence of peptide. ns: not significant. Data are a mean ± s.d. of three replicate experiments. Source files for (B, C, D and E) are available in Figure 5—source data 1, Figure 5—source data 2, Figure 5—source data 3 and Figure 5—source data 4, respectively.
-
Figure 5—source data 1
GraphPad Prism tables and curve fitting for results displayed in Figure 5B.
- https://cdn.elifesciences.org/articles/75272/elife-75272-fig5-data1-v2.pdf
-
Figure 5—source data 2
GraphPad Prism tables and curve fitting for results displayed in Figure 5C.
- https://cdn.elifesciences.org/articles/75272/elife-75272-fig5-data2-v2.pdf
-
Figure 5—source data 3
GraphPad Prism tables for results displayed in Figure 5D.
- https://cdn.elifesciences.org/articles/75272/elife-75272-fig5-data3-v2.pdf
-
Figure 5—source data 4
GraphPad Prism tables and statistical analysis for results displayed in Figure 5E.
- https://cdn.elifesciences.org/articles/75272/elife-75272-fig5-data4-v2.pdf
Figure 5—figure supplement 1
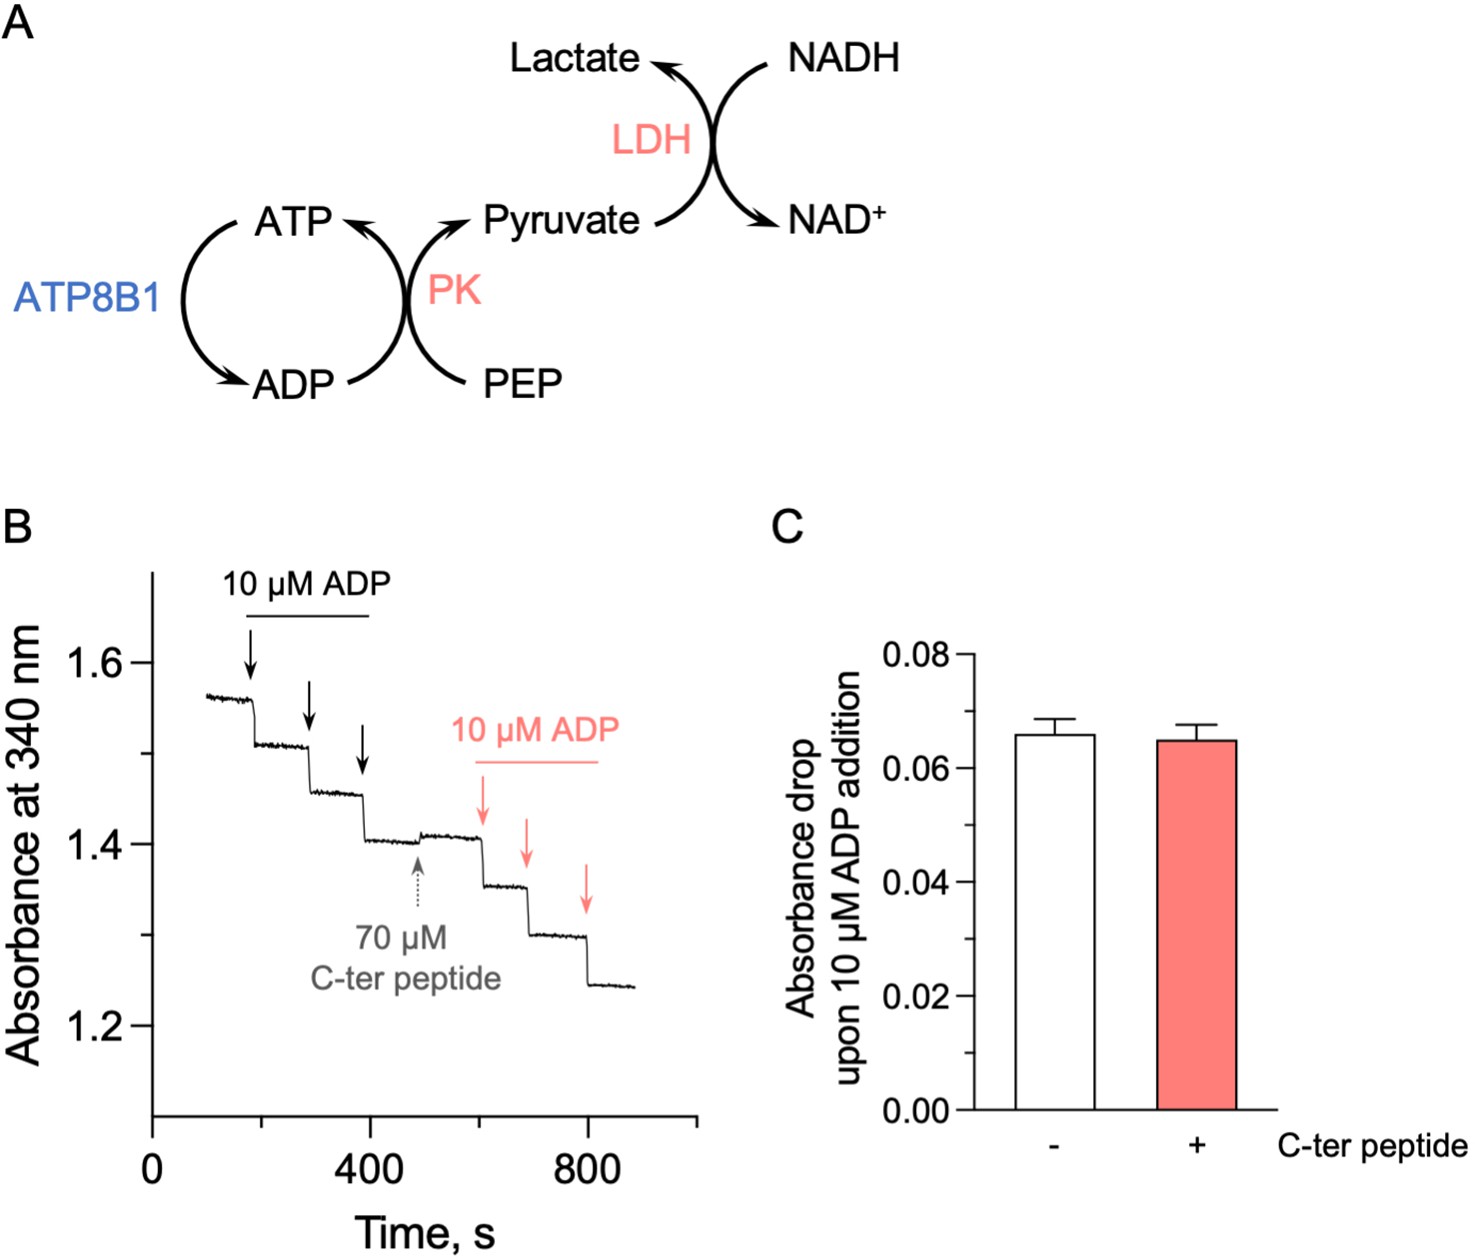
Effect of the ATP8B1 C-terminal peptide on the enzyme-coupled assay.
(A) Schematic depicting the principle of the enzyme-coupled assay. PK: pyruvate kinase; LDH: lactate dehydrogenase. For each mole of ATP consumed by the ATP8B1-CDC50A complex, one mole of NADH is oxidized. This assay also allows continued regeneration of ATP from ADP. (B) Absorbance at 340 nm was monitored at 37 °C, in the absence or presence of the ATP8B1 C-terminal peptide at 70 µM. Repeated additions of ADP at a final concentration of 10 µM (symbolized by each arrow) led to the expected oxidation of 10 µM NADH, resulting in a fast absorbance drop of ~0.06 AU at 340 nm. (C) Quantification of the absorbance decrease observed upon addition of 10 µM ADP, either in the absence (open bar) or in the presence (red bar) of the C-terminal peptide. Data are a mean ± s.d. of three technical replicates. Source files related to (C) are available in Figure 5—figure supplement 1—source data 1.
-
Figure 5—figure supplement 1—source data 1
GraphPad Prism tables for results displayed in Figure 5—figure supplement 1C.
- https://cdn.elifesciences.org/articles/75272/elife-75272-fig5-figsupp1-data1-v2.pdf
Figure 6 with 2 supplements

Sensitivity of ATP8B1-CDC50A to phospholipids.
(A) ATPase activity of the ΔN42/C1174 ATP8B1 determined in the presence of various glycerophospholipids, lipid derivatives, and sphingomyelin, at 30 °C. The assay medium contained 1 mM MgATP, 1 mg ml–1 DDM, and 0.01 mg ml–1 CHS. PI(4,5)P2 was added at 23 µM and the various lipids and lipid derivatives were added at 115 µM. The rate of ATP hydrolysis was corrected for NADH photobleaching occurring before the addition of the purified ATP8B1-CDC50A complex to the assay cuvette. The specific activity measured in the presence of PC and PI(4,5)P2 was taken as 100% (~0.15–0.3 µmol min–1 mg–1). The dotted line represents the background activity measured in the absence of any added lipid. **** p < 0.0001, *** p = 0.0002, ** p = 0.0071, * p = 0.0177 according to unpaired two-tailed t test vs SM condition. ns: not significant. Data are mean ± s.d. of 3 replicate experiments. (B) ATPase activity of the ΔN42/C1174 ATP8B1 (0.5 µg ml–1) determined in the presence of mono, di, and tri-phosphorylated phosphoinositides, at 30 °C. The activity was measured in the presence of 1 mg ml–1 DDM, 0.1 mg ml–1 CHS, 115 µM PC and 23 µM of the indicated phosphoinositides. The rate of ATP hydrolysis was corrected for NADH photobleaching occurring before the addition of the purified ATP8B1-CDC50A complex and ATP to the assay cuvette. The specific activity of the wild-type measured in the presence of PC and PI(4,5)P2 was taken as 100%. The dotted line represents the activity measured in the sole presence of PC. Data are mean ± s.d. of three replicate experiments. (C) Apparent affinity of ΔN42/C1174 ATP8B1 ( ~ 3–3.3 µg ml–1) for PI(4)P, PI(4,5)P2 and PI(3,4,5)P3. Km for phosphoinositides was measured at 37 °C in the presence of PC. The assay medium contained 1 mM MgATP, 0.5 mg ml–1 DDM, 0.01 mg ml–1 CHS, 23 µM PI(4,5)P2 and 57 µM PC. Successive additions of DDM and PC gradually decreased the PI(4,5)P2/DDM ratio. The PC/DDM ratio remained constant at 0.058 mol/mol. Plotted lines represent the best fit to a Michaelis-Menten equation. (D) Variations of the maximum velocity (Vmax) and apparent affinity (Km) of ΔN42/C1174 ATP8B1 for phosphoinositides calculated from double reciprocal plots displayed in Figure 6—figure supplement 1, with respect to that measured in the presence of PI(4)P. The data in (C) and (D) represent the mean ± s.d. of three to four replicate experiments. Source files for (A, B, C and D) are available in Figure 6—source data 1, Figure 6—source data 2, Figure 6—source data 3 and Figure 6—source data 4, respectively.
-
Figure 6—source data 1
GraphPad Prism tables and statistical analysis for results displayed in Figure 6A.
- https://cdn.elifesciences.org/articles/75272/elife-75272-fig6-data1-v2.pdf
-
Figure 6—source data 2
GraphPad Prism tables for results displayed in Figure 6B.
- https://cdn.elifesciences.org/articles/75272/elife-75272-fig6-data2-v2.pdf
-
Figure 6—source data 3
GraphPad Prism tables and curve fitting for results displayed in Figure 6C.
- https://cdn.elifesciences.org/articles/75272/elife-75272-fig6-data3-v2.pdf
-
Figure 6—source data 4
GraphPad Prism tables for results displayed in Figure 6D.
- https://cdn.elifesciences.org/articles/75272/elife-75272-fig6-data4-v2.pdf
Figure 6—figure supplement 1
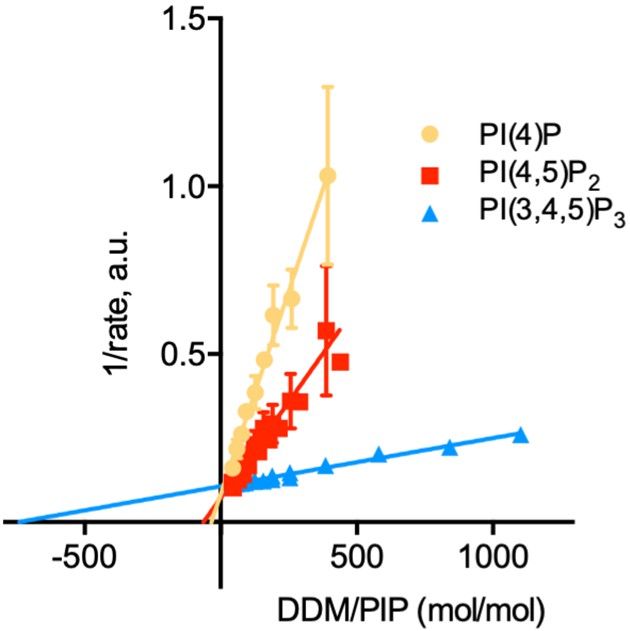
Determination of the kinetic parameters for activation of ATP8B1-CDC50A by PPIns.
Double reciprocal plot of data shown in Figure 6C. Source files related to Figure 6—figure supplement 1 are available in Figure 6—figure supplement 1—source data 1.
-
Figure 6—figure supplement 1—source data 1
GraphPad Prism tables and curve fitting for results displayed in Figure 6—figure supplement 1.
- https://cdn.elifesciences.org/articles/75272/elife-75272-fig6-figsupp1-data1-v2.pdf
Figure 6—figure supplement 2
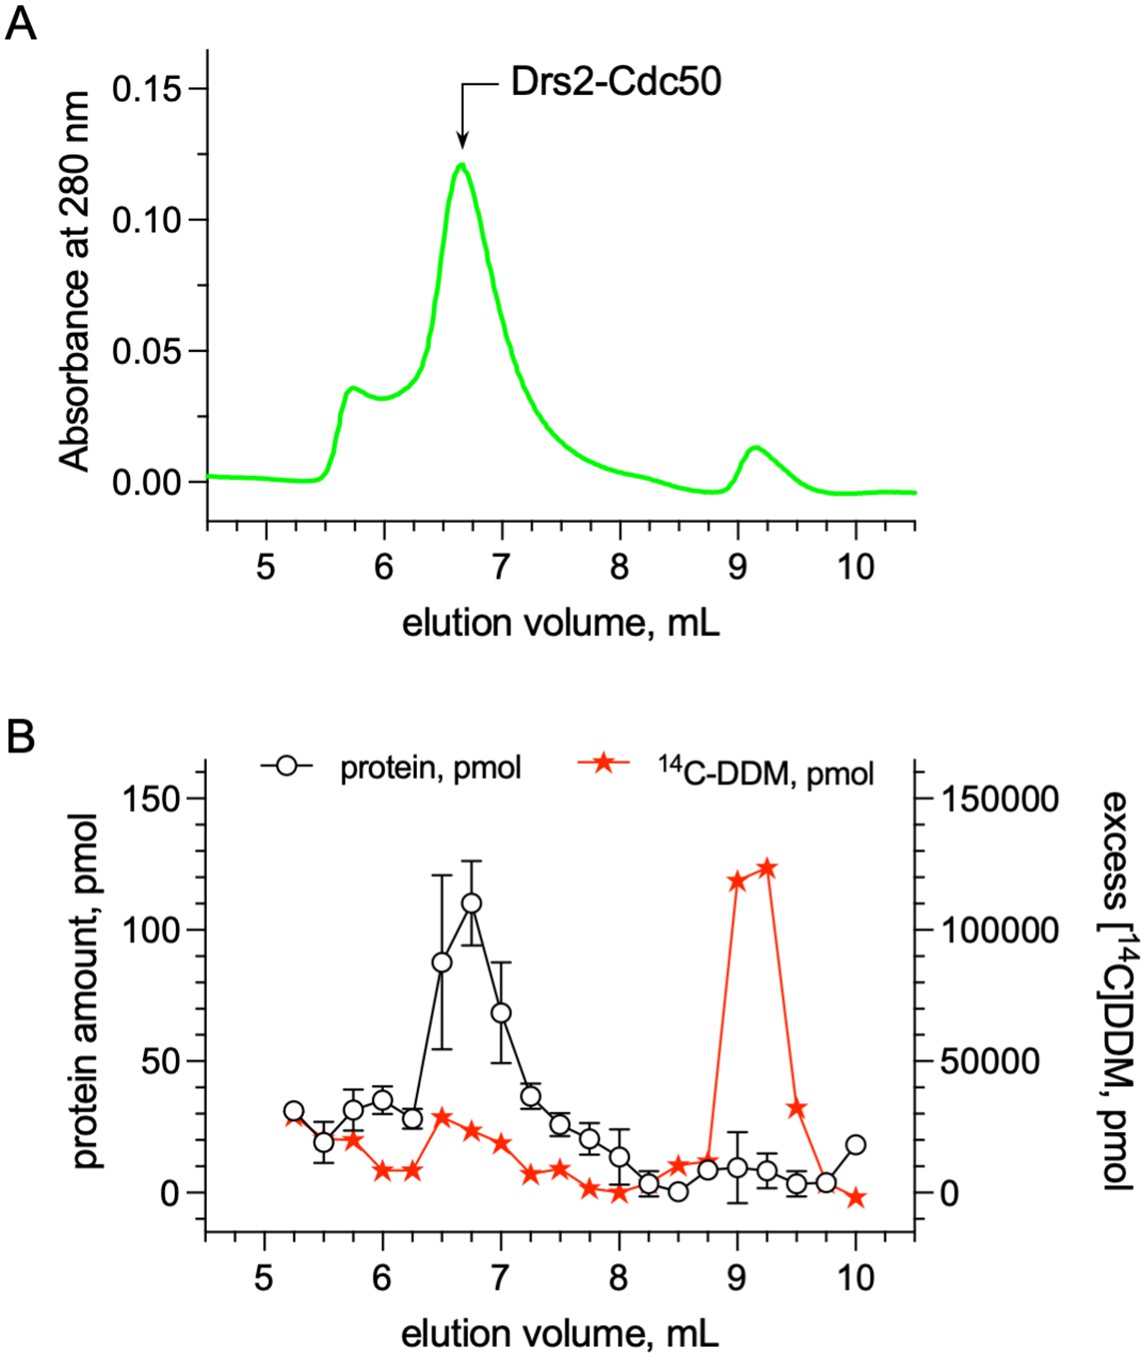
Quantification of the detergent bound to the transmembrane domain of Drs2-Cdc50.
(A) Size-exclusion chromatography (SEC) on a TSK3000 SW gel filtration column (Tosoh Bioscience) of DDM-purified Drs2-Cdc50 complex. The column was equilibrated with 50 mM MOPS-Tris pH 7, 100 mM KCl, 5 mM MgCl2 supplemented with 0.5 mg mL–1 DDM. The mobile phase also contained 14C-DDM to reach a specific activity of about 3.10–5 µCi per nmol of DDM. (B) Before loading affinity-purified Drs2-Cdc50 on the SEC column, at room temperature, the complex was incubated with 14C-DDM to reach a specific activity of 3.10–5 µCi per nmol of DDM. For each collected fraction, the protein and radioactive detergent content was quantified. The detergent/protein molar ratio of fractions collected for an elution volume of 6.5, 6.75, and 7 ml, where Drs2-Cdc50 peaks, was found to be around 272 ± 56. Error bars represent the mean ± s.d. of 2 protein concentration measurements. Source files related to (B) are available in (Figure 6—figure supplement 2—source data 1).
-
Figure 6—figure supplement 2—source data 1
GraphPad Prism tables for results displayed in Figure 6—figure supplement 2.
- https://cdn.elifesciences.org/articles/75272/elife-75272-fig6-figsupp2-data1-v2.pdf
Figure 7 with 1 supplement
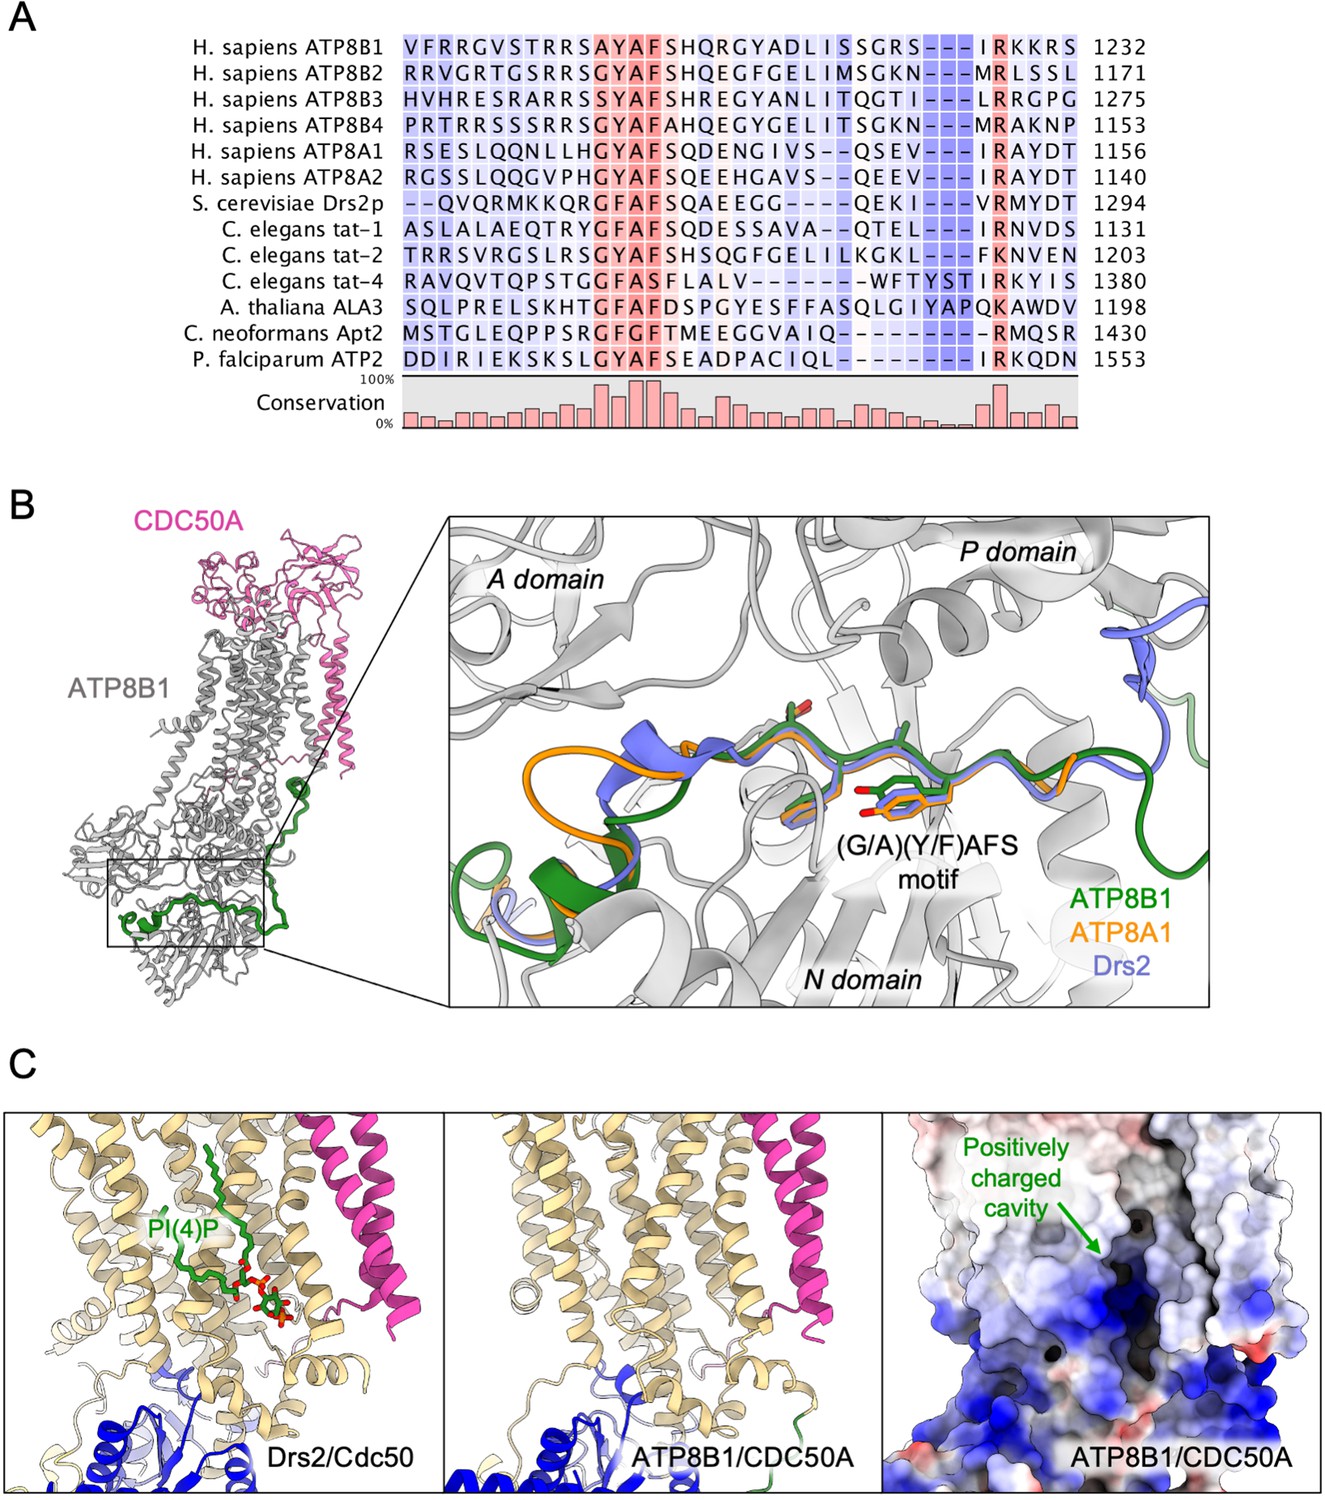
Proposed mechanism for autoinhibition and regulation by phosphoinositides of the ATP8B1-CDC50A complex.
(A) Sequence alignment of select P4-ATPases C-termini, including ATP8B1, ATP8A1 and Drs2, which are all known to be autoinhibited. The shading indicates conservation (blue 0% – red 100%). (B) Comparison of the binding sites of ATP8B1, ATP8A1 (PDB ID: 6K7N) and Drs2 (PDB ID: 6ROH) C-terminal tails, respectively in green, orange and blue reveals a common architecture and location of the inhibitory C-termini, and specifically the conserved (G/A)(Y/F)AFS motif (AYAFS for ATP8B1, GYAFS for ATP8A1 and GFAFS for Drs2) located in the ATP binding pocket. (C) Side view of the PI(4)P-binding site of Drs2 (left). PI(4)P (in stick representation) is bound in the membrane domain. The same region in ATP8B1 reveals a similar organization (middle) with the presence of a positively-charged cavity (right) suggesting a putative phosphoinositide binding pocket in ATP8B1. CDC50A and Cdc50 transmembrane helices are colored in pink.
Figure 7—figure supplement 1
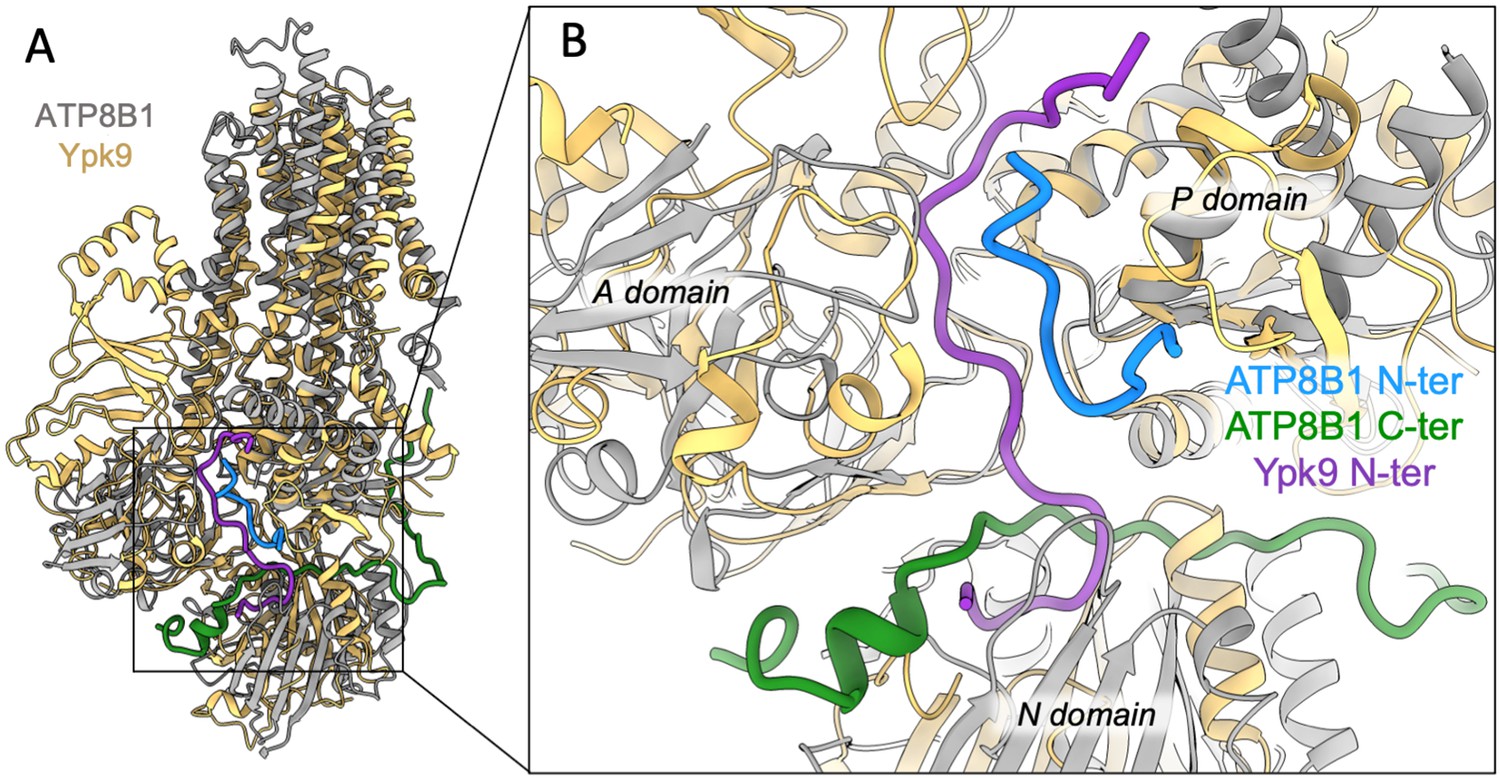
Structural comparison of ATP8B1 and Ypk9 autoinhibition mechanism.
(A) Structural alignment of Ypk9 (PDB: 7OP8; yellow) and ATP8B1 (gray), both in the E2P inhibited state. (B) Close-up view of the region where the Ypk9 N-terminal tail (purple) and ATP8B1 N- and C-terminal tails (cyan and green, respectively) bind.
Figure 8
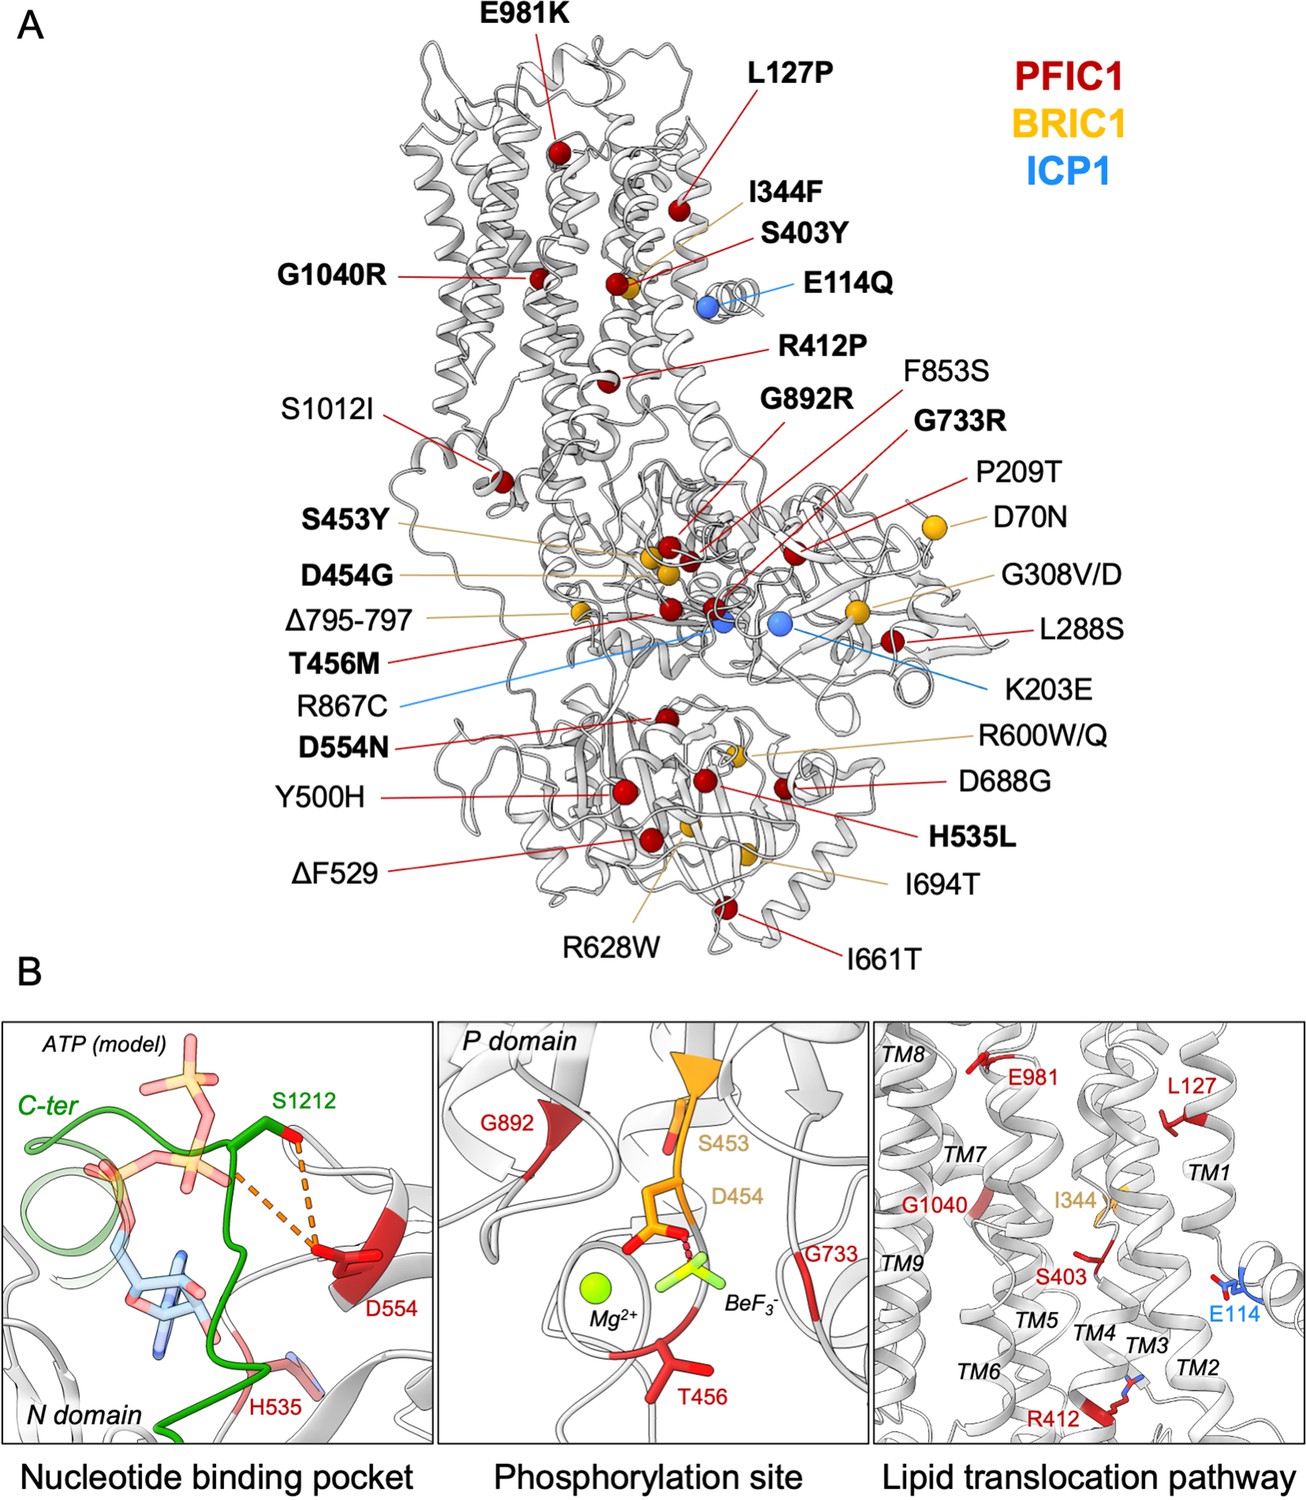
Structural map of the inherited intrahepatic cholestasis-related mutations.
(A) Mutations found in PFIC1, BRIC1 or ICP1 patients are respectively shown as red, yellow and blue spheres on ATP8B1 E2Pautoinhibited structure (in grey). Mutations indicated in bold are presented in panel (B). (B) Close-up views of the nucleotide binding site within the N-domain of ATP8B1. The ATP molecule position was modeled by aligning ATP8B1 N-domain with the N-domain of ATP8A1 in E1-ATP bound state (PDB: 6K7J) (left). (Middle) the phosphorylation site in the P-domain with Mg2+ and the phosphate mimic BeF3- in green. (Right) the lipid transport pathway.
Author response image 1
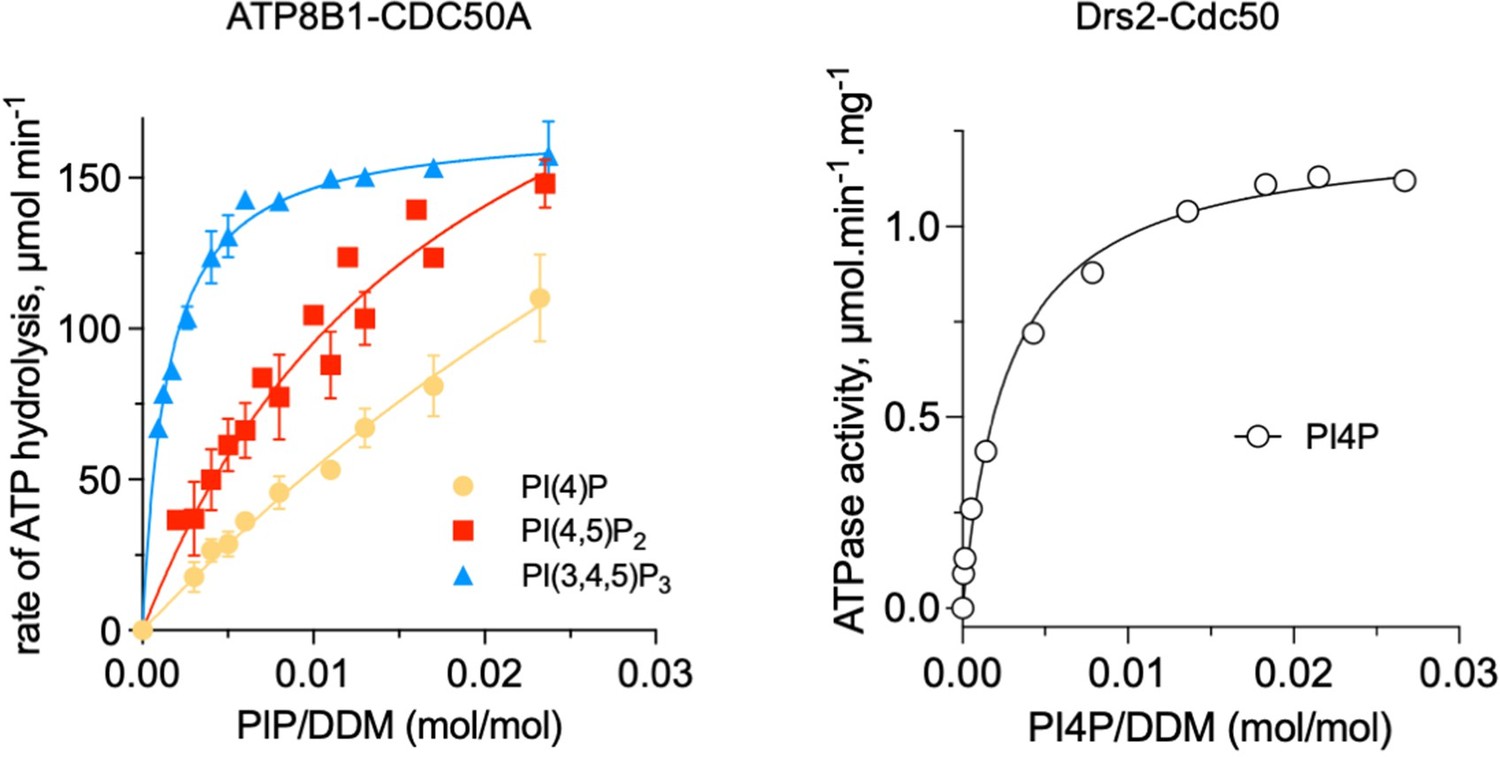
Comparison of ATP8B1-CDC50A and Drs2-Cdc50 affinities for phosphoinositides.
The results displayed for ATP8B1-CDC50A correspond to those shown in Figure 6C while the results displayed for Drs2 are adapted from Figure 5B published in Azouaoui et al., (2017) J Biol Chem 292:7954.
Author response image 2
ATPase activity measurements of streptavidin-purified WT ATP8B1-CDC50A.
(A) ATPase activity of the purified ATP8B1-CDC50A complex determined in DDM/CHS at 30°C, using an enzyme-coupled assay, where the kinetics of NADH oxidation is monitored continuously. The various additions in the assay cuvette are indicated with arrows. Wild-type (WT) was added at ~ 2 µg ml-1 to continuously stirred cuvettes in an assay medium containing 1 mM MgATP, 0.5 mg ml-1 DDM, and 0.01 mg ml-1 CHS in buffer B. PC and PI(4,5)P2 were added at 0.1 mg ml-1 and 0.025 mg ml-1, respectively, resulting in a DDM final concentration of 1.25 mg ml-1. Trypsin and BeFx were added at 0.07 mg ml-1 and 1 mM, respectively. The rate of ATP hydrolysis corresponds to the slope measured after each addition. Activity is revealed upon addition of trypsin. (B) Specific ATPase activity of WT ATP8B1-CDC50A measured from traces such as that displayed in (A). The dotted line represents the background NADH oxidation level, as measured before addition of ATP8B1-CDC50A in the assay cuvette. Data in (B) are a mean ± s.d. of 6 to 12 replicate experiments. PC: phosphatidylcholine.
Tables
Table 1
Cryo-EM data collection, refinement, and validation statistics.
| Data collection and processing | |
|---|---|
| Magnification | ×130,000 |
| Voltage (kV) | 300 |
| Microscope | Titan Krios (Aarhus University) |
| Camera | Gatan K3 |
| Physical pixel size (Å/pix) | 0.66 |
| Electron exposure (e–/Å2) | 60 |
| Defocus range (μm) | 0.7–1.8 |
| Number of movies | 3,918 |
| Initial particle images (no.) | 470,103 |
| Final particle images (no.) | 104,643 |
| Symmetry imposed | C1 |
| Map resolution (Å)FSC threshold | 3.10.143 |
| Map resolution range (Å) | 2.7–4.5 |
| Refinement | |
| Initial model used (PDB code) | ATP8B1: I-TASSER homology model based on 6ROHCDC50A: 6K7L |
| Model resolution (Å)FSC threshold | 3.30.5 |
| Map sharpening B factor (Å2) | –84 |
| Model compositionNon-hydrogen atomsProtein residuesLigands | 11,8681,4391 MG, 1 BEF, 4 Y01, 4 NAG, 1 BMA |
| B factors (Å2, min/max/mean)ProteinLigand | 33.89/136.87/67.0941.58/110.52/60.89 |
| R.m.s. deviationsBond lengths (Å)Bond angles (°) | 0.0020.492 |
| Validation MolProbity score Clashscore Poor rotamers (%) | 1.434.740.08 |
| Ramachandran plot Favored (%) Allowed (%) Disallowed (%) | 96.923.080.0 |
Table 2
Half-maximal inhibitory concentration (IC50) values for the C-terminal peptide, in comparison with its phosphorylated form.
The values indicated in the table were deduced from dose-response curves displayed in Figure 5B and C. The number of data points used to calculate the IC50 is indicated in parenthesis. IC50 values are expressed as mean ± s.d.
| ATP8B1-CDC50A | Inhibitory peptide | IC50 (µM) |
|---|---|---|
| ΔN42/C1174(n = 33) | C-terminal | 22.1 ± 1.2 |
| ΔN42/C1174(n = 35) | PhosphorylatedC-terminal | 377.4 ± 227 |
| ΔC1174 (n = 34) | C-terminal | 0.081 ± 0.014 |
| ΔC1174 (n = 47) | PhosphorylatedC-terminal | 1.96 ± 0.35 |
Key resources table
| Reagent type (species) or resource | Designation | Source or reference | Identifiers | Additional information |
|---|---|---|---|---|
| Strain, strain background (Saccharomyces cerevisiae, MATα) | W303.1b/Δpep4 | López-Marqués laboratory | Strain deficient for the main vacuolar protease | |
| Strain, strain background (Saccharomyces cerevisiae, MATα) | W303.1b/GAL4-2 | Pompon Laboratory | Additional copy of the GAL4 gene in the yeast chromosome | |
| Antibody | FIC1 (H-91) rabbit polyclonal anti-ATP8B1 antibody | Santa-Cruz Biotechnology | Cat#sc-134967 | (1:10000)This product has been discontinued |
| Antibody | Goat anti-rabbit HRP-coupled polyclonal IgG antibody | Biorad | Cat#1706515 | (1:2000) |
| Recombinant DNA reagent | ATP8B1 cDNA | Joost Holthuis laboratory | Uniprot: O43520 | |
| Recombinant DNA reagent | CDC50 cDNA | Joost Holthuis laboratory | Uniprot: Q9NV96 | |
| Peptide, recombinant protein | ATP8B1 C-terminal peptide | Biomatik Company | ||
| Peptide, recombinant protein | ATP8B1 phosphorylated C-terminal peptide | Biomatik Company | Phosphorylated on S1223 | |
| Peptide, recombinant protein | HRV 3 C protease | This study | Expressed (pGEX-4T-2) and purified in Lenoir laboratory. The purification procedure of N-terminally tagged HRV 3 C protease can be found in the Materials and methods section | |
| Peptide, recombinant protein | TEV protease | This study | Expressed (pRK793) and purified in Lenoir laboratory. The purification procedure of N-terminally tagged TEV protease can be found in the Materials and methods section | |
| Commercial assay or kit | NucleoSpin Plasmid, Mini kit for Plasmid DNA | Macherey-Nagel | Cat#740588.250 | |
| Commercial assay or kit | QuickChange II XL site-directed mutagenesis kit | Agilent technologies | Cat#200,521 | |
| Commercial assay or kit | Amicon 100 kDa cutoff | EMD Millipore | Cat#UFC510024 | For volume ≤0.5 ml |
| Commercial assay or kit | Vivaspin 500 | Sartorius | Cat#VS0142 | For volumes from 0.5 to 0.005 ml |
| Commercial assay or kit | Vivaspin 6 | Sartorius | Cat#VS0641 | For volumes from 0.5 to 6 ml |
| Commercial assay or kit | Vivaspin 20 | Sartorius | Cat#VS2041 | For volumes from 2 to 20 ml |
| Commercial assay or kit | Superose 6 Increase 10/300 GL | GE Healthcare/Cytiva | Cat#29091596 | |
| Commercial assay or kit | TSK3000-SW | Tosoh Bioscience | Cat#08541 | |
| Commercial assay or kit | Streptavidin-sepharose resin | GE Healthcare/Cytiva | Cat#17511301 | |
| Chemical compound, drug | n-dodecyl-β-D-maltopyranoside, Anagrade | Anatrace | Cat#D310 | |
| Chemical compound, drug | Cholesteryl hemisuccinate | Sigma | Cat#C6013 | |
| Chemical compound, drug | Lauryl maltose neopentyl glycol | Anatrace | Cat#NG310 | |
| Chemical compound, drug | Sodium chloride | ROTH | Cat#3957.2 | |
| Chemical compound, drug | Potassium chloride | Sigma-Aldrich | Cat#P9541 | |
| Chemical compound, drug | Magnesium chloride | Sigma-Aldrich | Cat#M2670 | |
| Chemical compound, drug | MOPS | Sigma-Aldrich | Cat#M1254 | |
| Chemical compound, drug | ATP | Sigma-Aldrich | Cat#A2383 | |
| Chemical compound, drug | Phospho(enol)pyruvic acid | Sigma-Aldrich | Cat#860,077 | |
| Chemical compound, drug | β-nicotinamide adenine dinucleotide, reduced disodium salt hydrate (NADH) Grade I, disodium salt | Roche | Cat#10107730001 | |
| Chemical compound, drug | Glycerol | VWR Chemicals | Cat#24387.292 | |
| Chemical compound, drug | D-glucose | Becton Dickinson | Cat#215,530 | |
| Chemical compound, drug | D-galactose | Sigma Aldrich | Cat#G5388 | |
| Chemical compound, drug | SIGMAFAST EDTA-free protease inhibitor cocktail | Sigma | Cat#S8830 | |
| Chemical compound, drug | Brain phosphatidylinositol-4-phosphate (PI4P) | Avanti Polar Lipids, Inc | Cat#840045 P | |
| Chemical compound, drug | Brain phosphatidylinositol-4,5-bisphosphate (PI(4,5)P2) | Avanti Polar Lipids, Inc | Cat#840046 P | |
| Chemical compound, drug | 1,2-dioleoyl-sn-glycero-3-phospho-(1'-myo-inositol-3'-phosphate) (PI(3)P) | Avanti Polar Lipids, Inc | Cat#850150 P | |
| Chemical compound, drug | 1,2-dioleoyl-sn-glycero-3-phospho-(1'-myo-inositol-5'-phosphate) (PI(5)P) | Avanti Polar Lipids, Inc | Cat#850152 P | |
| Chemical compound, drug | 1,2-dioleoyl-sn-glycero-3-phospho-(1'-myo-inositol-3',4'-bisphosphate) (PI(3,4)P2) | Avanti Polar Lipids, Inc | Cat#850153 P | |
| Chemical compound, drug | 1,2-dioleoyl-sn-glycero-3-phospho-(1'-myo-inositol-3',5'-bisphosphate) (PI(3,5)P2) | Avanti Polar Lipids, Inc | Cat#850154 P | |
| Chemical compound, drug | 1,2-dioleoyl-sn-glycero-3-phospho-(1'-myo-inositol-3',4',5'-trisphosphate) (PI(3,4,5)P3) | Avanti Polar Lipids, Inc | Cat#850156 P | |
| Chemical compound, drug | Brain phosphatidylserine (PS) | Avanti Polar Lipids, Inc | Cat#840032 P | |
| Chemical compound, drug | 1-palmitoyl-2-oleoyl-sn-glycero-3-phosphocholine (POPC) | Avanti Polar Lipids, Inc | Cat#850457 P | |
| Chemical compound, drug | 1-palmitoyl-2-oleoyl-sn-glycero-3-phosphoethanolamine (POPE) | Avanti Polar Lipids, Inc | Cat#850757 P | |
| Chemical compound, drug | 1-palmitoyl-2-oleoyl-sn-glycero-3-phosphoserine (POPS) | Avanti Polar Lipids, Inc | Cat#840034 P | |
| Chemical compound, drug | Bovine heart cardiolipin (CL) | Avanti Polar Lipids, Inc | Cat#840012 P | |
| Chemical compound, drug | egg chicken sphingomyelin (SM) | Avanti Polar Lipids, Inc | Cat#860061 P | |
| Chemical compound, drug | edelfosine | Avanti Polar Lipids, Inc | Cat#999995 P | |
| Chemical compound, drug | Miltefosine(Fos-Choline-16) | Anatrace | Cat#F316 | |
| Chemical compound, drug | 1-stearoyl-2-hydroxy-sn-glycero-3-phosphocholine (Lyso-PC) | Sigma | Cat#L2131 | |
| Chemical compound, drug | Pyruvate kinase | Sigma | Cat#P7768 | |
| Chemical compound, drug | Lactate dehydrogenase | Sigma | Cat#L1006 | |
| Chemical compound, drug | [γ-32P]ATP | Perkin-Elmer | Cat#BLU002A | |
| Chemical compound, drug | His-probe-HRP | Thermo Scientific | Cat#15,165 | |
| Software, algorithm | EPU v 2.3 | Thermo Fisher | https://www.thermofisher.com/it/en/home/electron-microscopy/products/software-em-3d-vis/epu-software.html | |
| Software, algorithm | cryoSPARC v3 | Punjani et al., 2017,Structura Biotechnology Inc | https://www.nature.com/articles/nmeth.4169 | |
| Software, algorithm | ChimeraX 1.4 | Goddard et al., 2018 | https://www.cgl.ucsf.edu/chimerax/ | |
| Software, algorithm | I-TASSER | Yang et al., 2015 | https://zhanggroup.org/I-TASSER/ | |
| Software, algorithm | Coot 0.9.6 | Emsley et al., 2010 | https://doi.org/10.1107/S0907444904019158https://www2.mrc-lmb.cam.ac.uk/personal/pemsley/coot/ | |
| Software, algorithm | Phenix 1.19.2 | Liebschner et al., 2019 | https://doi.org/10.1107/S2059798318006551http://phenix-online.org/ | |
| Software, algorithm | Molprobity 4.5.1 | Williams et al., 2018 | https://doi.org/10.1002/pro.3330http://molprobity.biochem.duke.edu | |
| Software, algorithm | ImageJ | Schneider et al., 2012 | https://imagej.nih.gov/ij/ | |
| Software, algorithm | Prism 9 | GraphPad | https://www.graphpad.com/scientific-software/prism/ | |
| Other | C-Flat 1.2/1.3 Cryo-EM Grid - Copper (400 Grid Mesh, 20 nm Carbon Thickness) | Molecular Dimensions | CF-1.2/1.3-4CU-50 | Support film for biological samples in cryo-EM techniques -20 nm C-flat carbon film with 1.2 μm hole size and 1.3 μm hole spacing |
Table 3
Primers used in this study.
| Primers | |
|---|---|
| FwBadATP8B1 | 5’- ACAGTTTAAACGGTGGTGAGAATCTTTATTTT CAGGGCGGTGGTGGTGGTATGAGTACAGAAAGAGACTCAG - 3’ |
| RevBadATP8B1 | 5’- AGCATGGAGCTCTCAGCTGTCCCCGGTGCGCCTGTA - 3’ |
| FwHisCDC50A | 5’ – CACAGAATTCTAGTATGCATCATCATCATCATCATCAT CATCATCACCTAGGTGGTATGGCGATGAACTATAACGCG – 3’ |
| RevHisCDC50A | 5’ – CACAGAGCTCCTAAATGGTAATGTCAGCTGTATTAC - 3’ |
| FwdD454N | 5’- GATCCATTATATCTTCTCTAATAAGACGGGGACACTCACAC –3’ |
| RevD454N | 5’- GTGTGAGTGTCCCCGTCTTATTAGAGAAGATATAATGGATC –3’ |
| Fwd3 C-P43 | 5’ – CTGGAGGTGCTGTTCCAGGGCCCGG AACAAAACCGAGTCAACAGGGAAGC – 3’ |
| Rev3 C-P43 | 5’ – CGGGCCCTGGAACAGCACCTCCAGTG GTTCAACAGCAGACCCCTGGTCATCAAG – 3’ |
| Fwd3C-E1174 | 5’ – CTGGAGGTGCTGTTCCAGGGCCCGAGTGATAAGATCCAGAAGCATC – 3’ |
| Rev3C-E1174 | 5’ – CGGGCCCTGGAACAGCACCTCCAGTTCTGATGGCCAGATGGTCAT– 3’ |
Table 4
Plasmids used in this study.
| Plasmids | References |
|---|---|
| pYeDP60_BAD-TevS-ATP8B1 (WT) / His10CDC50A | This study |
| pYeDP60_BAD-TevS-ATP8B1 (D454N) / His10CDC50A | This study |
| pYeDP60_BAD-TevS-ATP8B1 (P42-3CS) / His10CDC50A | This study |
| pYeDP60_BAD-TevS-ATP8B1 (P42-3CS) / His10CDC50A | This study |
| pYeDP60_BAD-TevS-ATP8B1 (E1174-3CS) / His10CDC50A | This study |
| pYeDP60_BAD-TevS-ATP8B1 (P43 +E1174-3 CS) / His10CDC50A | This study |
| pRK793 MBP-Tevsite-His7-TEVS219V-Arg5 | Kapust et al., 2001 |
| pGEX-4T-2 His6-Arg8-GST-3C |
Additional files
Download links
A two-part list of links to download the article, or parts of the article, in various formats.
Downloads (link to download the article as PDF)
Open citations (links to open the citations from this article in various online reference manager services)
Cite this article (links to download the citations from this article in formats compatible with various reference manager tools)
Autoinhibition and regulation by phosphoinositides of ATP8B1, a human lipid flippase associated with intrahepatic cholestatic disorders
eLife 11:e75272.
https://doi.org/10.7554/eLife.75272


