Synchronization in renal microcirculation unveiled with high-resolution blood flow imaging
- Department of Clinical Medicine, Faculty of Health, Aarhus University, Denmark
- Biomedical Sciences Institute, Faculty of Health and Medical Sciences, Copenhagen University, Denmark
- Division of Biology and Medicine, Brown University, United States
- Department of Biomedical Physiology and Kinesiology, Simon Fraser University, Canada
Figures
Figure 1 with 2 supplements
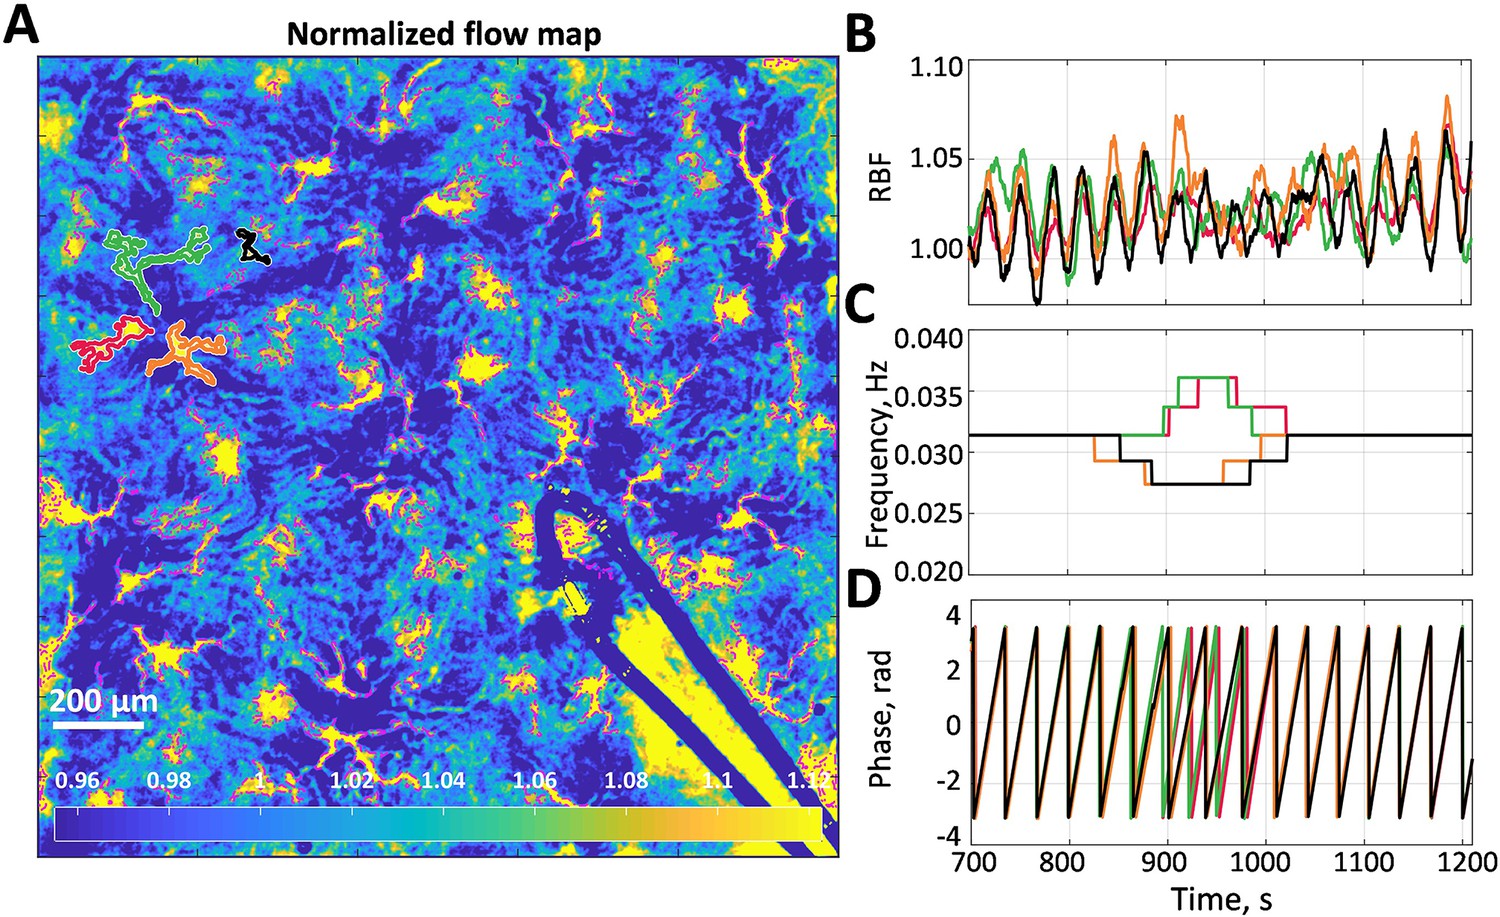
Blood flow data example.
(A) Normalized flow map with microcirculatory vessels. Yellow and blue colors correspond to high and low blood flow, respectively. (B) Relative blood flow (RBF) dynamics in four vessels, which are outlined in (A) with corresponding colors. (C) Dominant frequency in the tubuloglomerular feedback (TGF) band of the blood flow oscillations is shown in (B). (D) Phase value at the dominant frequency. One can see that there are two vessel pairs in which blood flow is synchronized for more than 90% of the time. Synchronization between the pairs is also well observed but breaks down when TGF activity change its frequency at 850–1050 s.
Figure 1—figure supplement 1
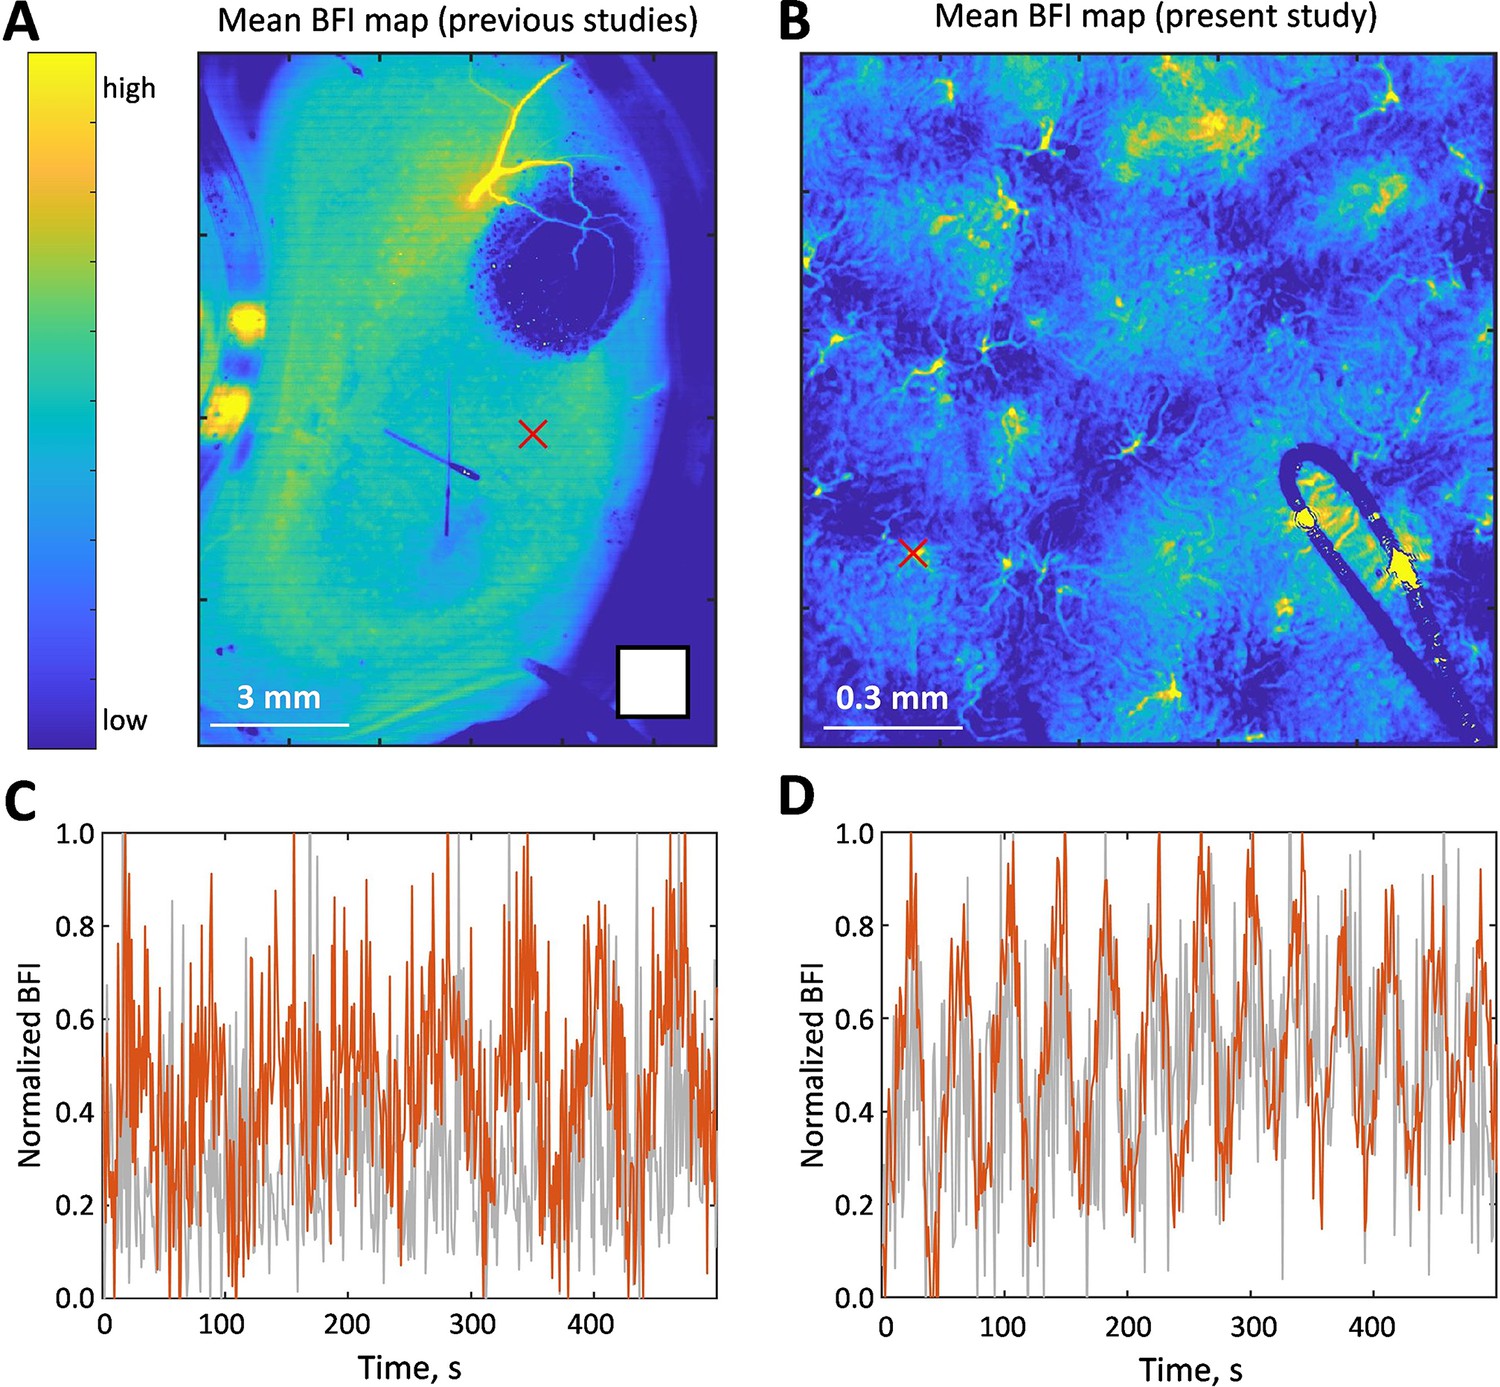
Example of the data collected with the same imaging system (FLPI 1, Moor Instruments Ltd, UK) as used in the previous studies (Holstein-Rathlou et al., 2011; Scully et al., 2013; Mitrou et al., 2015) versus the data shown in the present study.
(A) and (B) mean blood flow index (BFI) maps obtained using the respective systems. The area of the white square shown in (A) corresponds to the entire field of view shown in (B). Resolutions of the respective images are 400 µm2/px (A) and 2.25 µm2/px (B). (C) BFI dynamics recorded from a single pixel (gray line), marked in red in (A), and averaged over 15 × 15 pixels neighborhood (orange line) as was done in previous study (Holstein-Rathlou et al., 2011). (D) BFI dynamics recorded with the new system from an area equivalent to the one used in (C) for respective traces. As can be seen, the improved spatial and temporal resolution allows recording BFI with less noise and better spatial localization, e.g., identifying blood flow belonging to a single microcirculatory vessel. For more details on the benefits of high-resolution imaging for identifying vessel-specific oscillations frequency and phase, see our recent study (Lee et al., 2022).
Figure 1—figure supplement 2
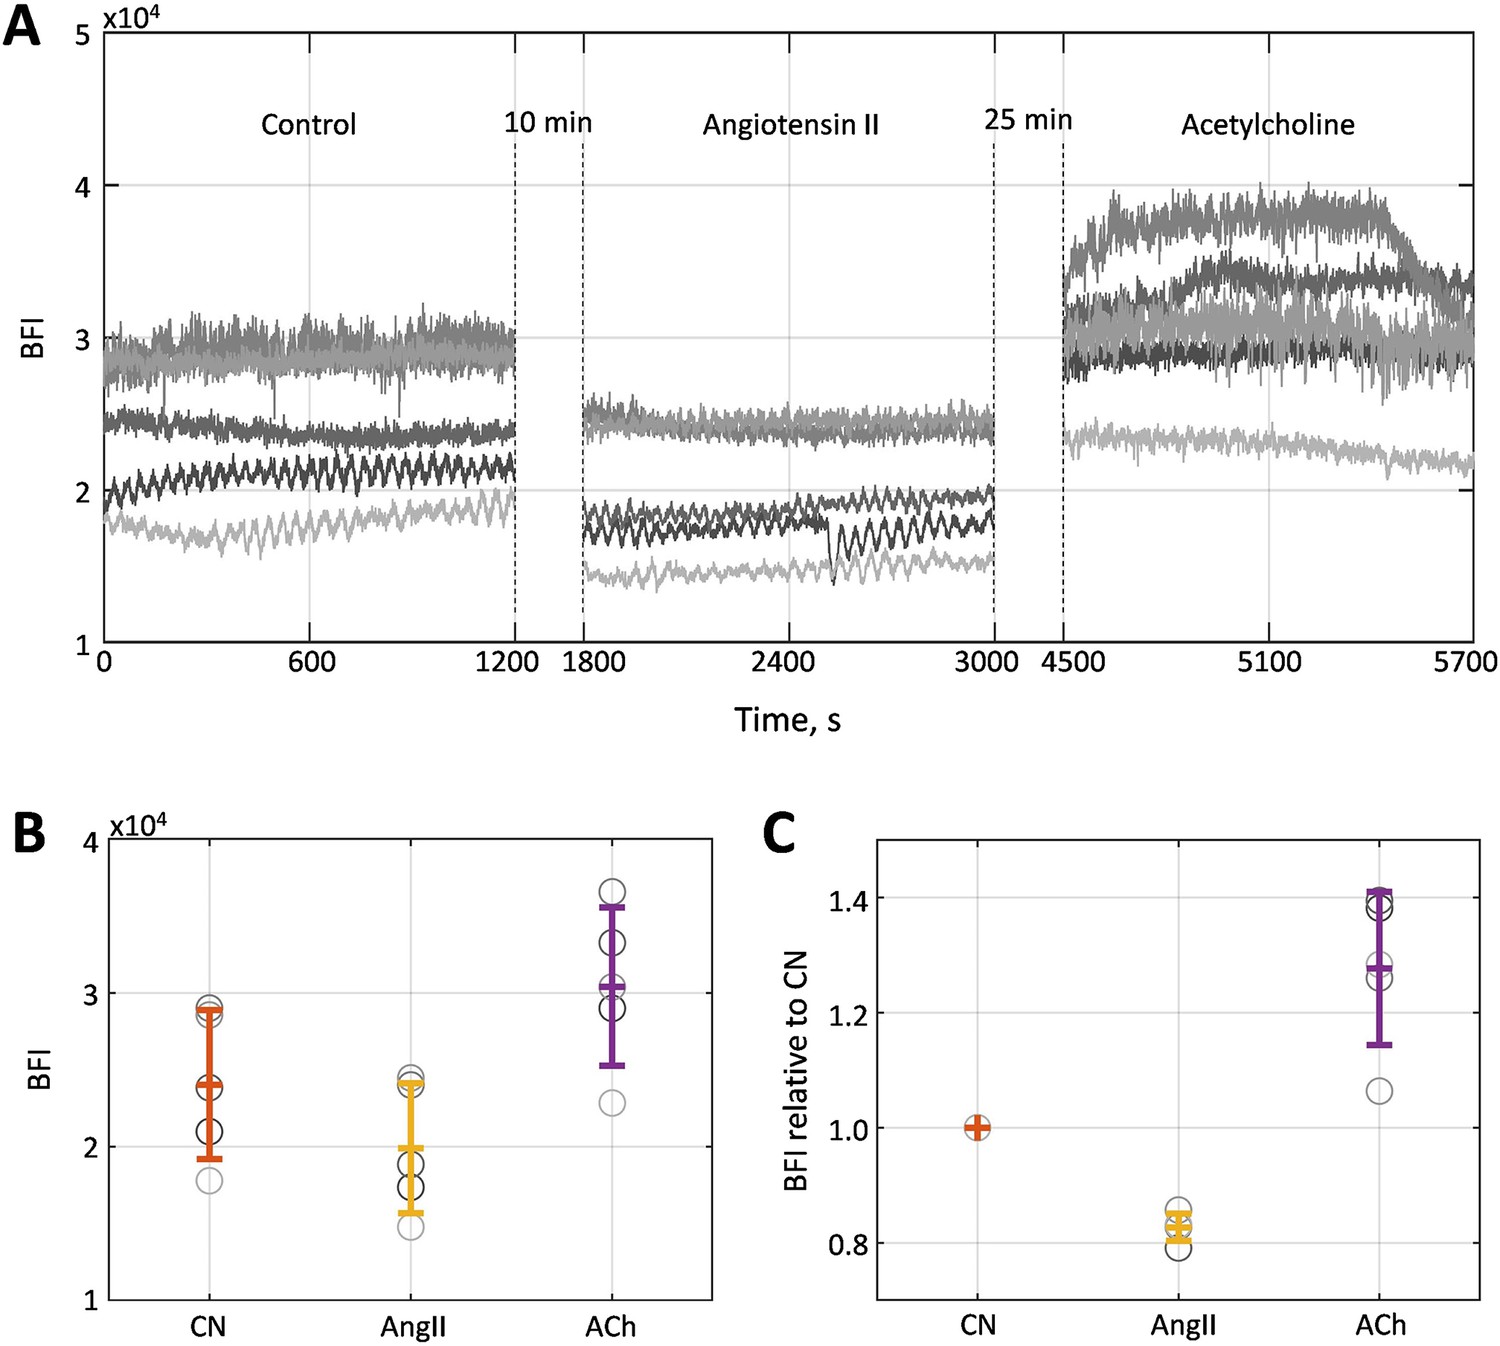
Average changes in blood flow index.
(A) BFI traces averaged across all segmented vessels for each animal in control during angiotensin II (AngII) and acetylcholine (ACh) infusions. Different shades of gray correspond to different animals. (B) BFI values averaged across time and animals: 2.4±0.5e+04 in control, 2.0±0.42e+0.4 during AngII infusion, and 3.0±0.5e+0.4 during ACh infusion. (C) Relative BFI normalized by the respective control BFI. Respective values for AngII and ACh infusions are 0.827±0.023 and 1.28±0.13. N = 5 animals were used to create these graphs.
Figure 2

Examples of instantaneous frequency patterns.
Each circle location corresponds to a segmented vessel with color-coded frequency. Bottom panels show normalized blood flow in each segmented vessel over 5 min centered around the time corresponding to the frequency pattern snapshot. (A) High synchronization degree - large cluster covers the whole field of view. (B) Moderate synchronization degree - most of the vessels are split between two clusters. (C) Low synchronization degree - no clear clustering pattern, some vessels do not have pronounced tubuloglomerular feedback activity (frequency color-coded as black). All data were captured in the same animal but under different conditions: control (A), angiotensin II infusion (B), and acetylcholine infusion (C). Black-colored circles represent vessels where TGF activity was considered too weak (less than 10% prominence of the activity peak).
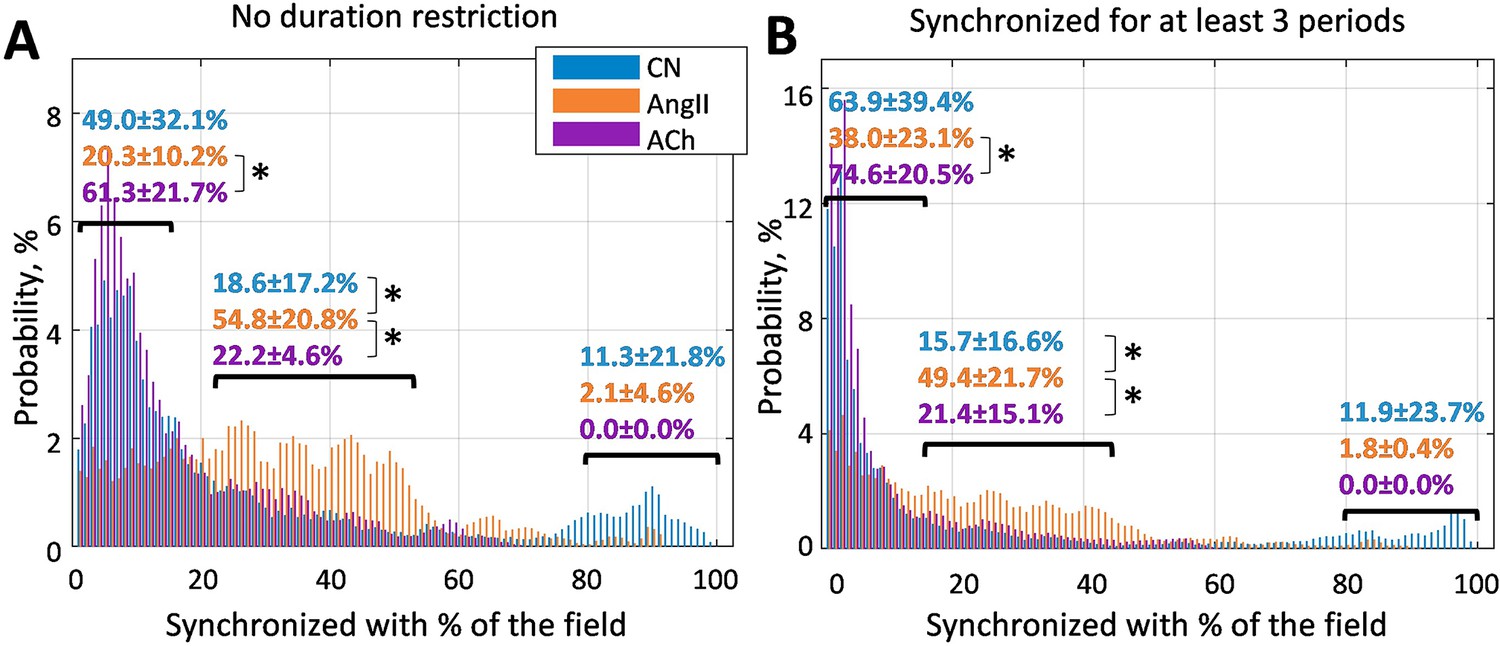
Figure 3
Probability of a randomly chosen vessel displaying the same dominant tubuloglomerular feedback (TGF) frequency as X% of the vessels in the field of view.
(A) Any duration of frequency matching is considered, and (B) dominant frequency should match for at least three TGF periods. It can be seen that infusion of angiotensin II significantly (p<0.05) increases the prevalence of clusters covering 20–50% of the vessels - chances that a randomly chosen vessel belongs to such a cluster at any given moment are ≈50%, while for control and acetylcholine infusion they are ≈20%. N = 5 animals were used to create these graphs. Paired t-test was used to produce p-values. p-values smaller than 0.05 are considered to be significant and marked with ‘*’.
Figure 4 with 3 supplements
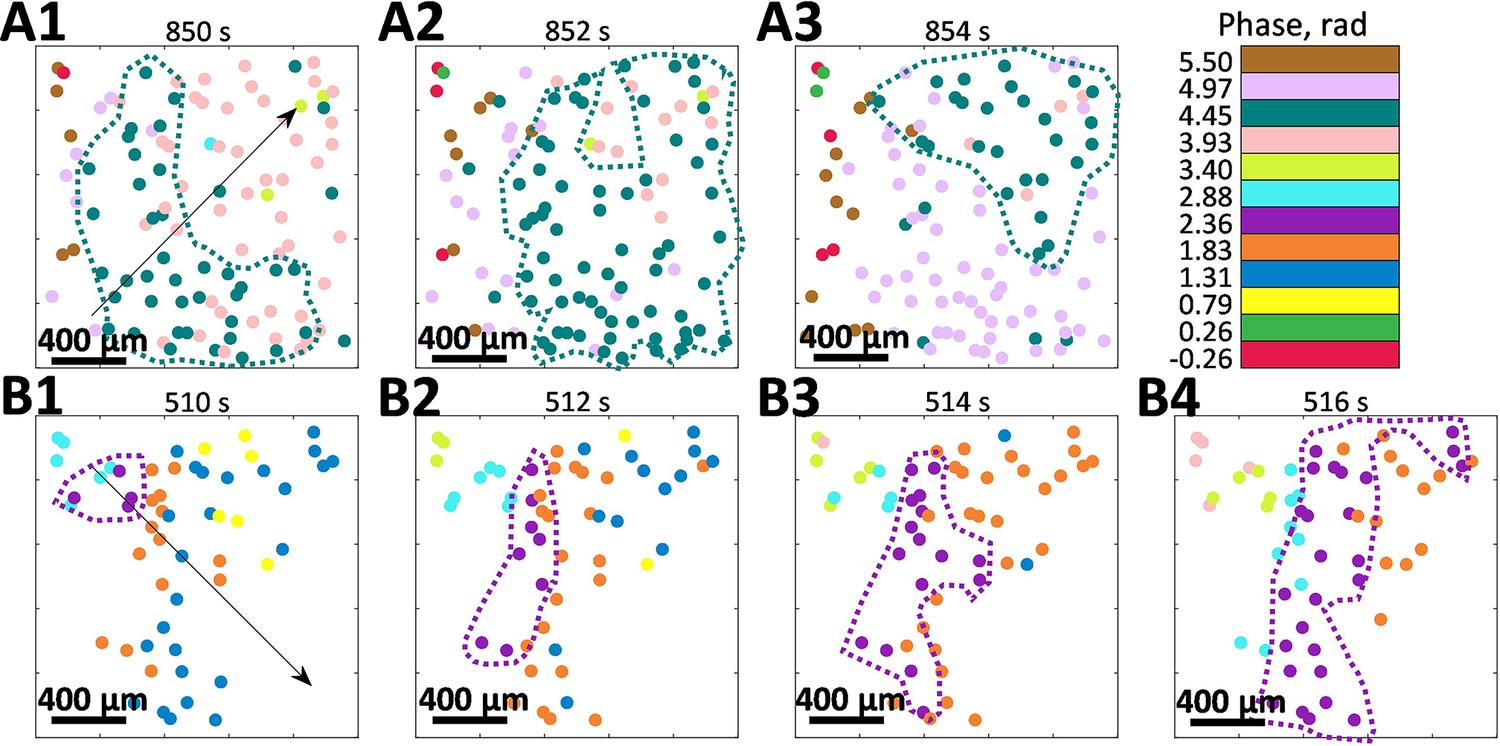
Phase waves.
(A) and (B) show the spatio-temporal evolution of tubuloglomerular feedback activity phase in vessels that belong to the largest cluster observed during control and angiotensin II infusion. Both observations are from the same animal as shown in Figure 2A, B. Arrows indicate the wave direction.
Figure 4—video 1
Example of phase dynamics and phase waves visualization during angiotensin II (AngII) infusion.
Figure 4—video 2
Example of phase dynamics and phase waves visualization in control.
Figure 4—video 3
Example of phase dynamics during acetylcholine (ACh) infusion.
Figure 5

Localization of phase and synchronization in space.
(A) Phase differences prevalence for synchronized vessels. (B) Phase differences distribution over the distance between vessels. (C) Synchronization duration normalized by the total observation time for different distances between vessels. N = 5 animals were used to create these graphs. Paired t-test was used to produce p-values. p-values smaller than 0.05 are considered to be significant and marked with ‘*.’ Values between 0.05 and 0.1 are shown as p<0.1, where relevant, to highlight a trend in the data.
Figure 6
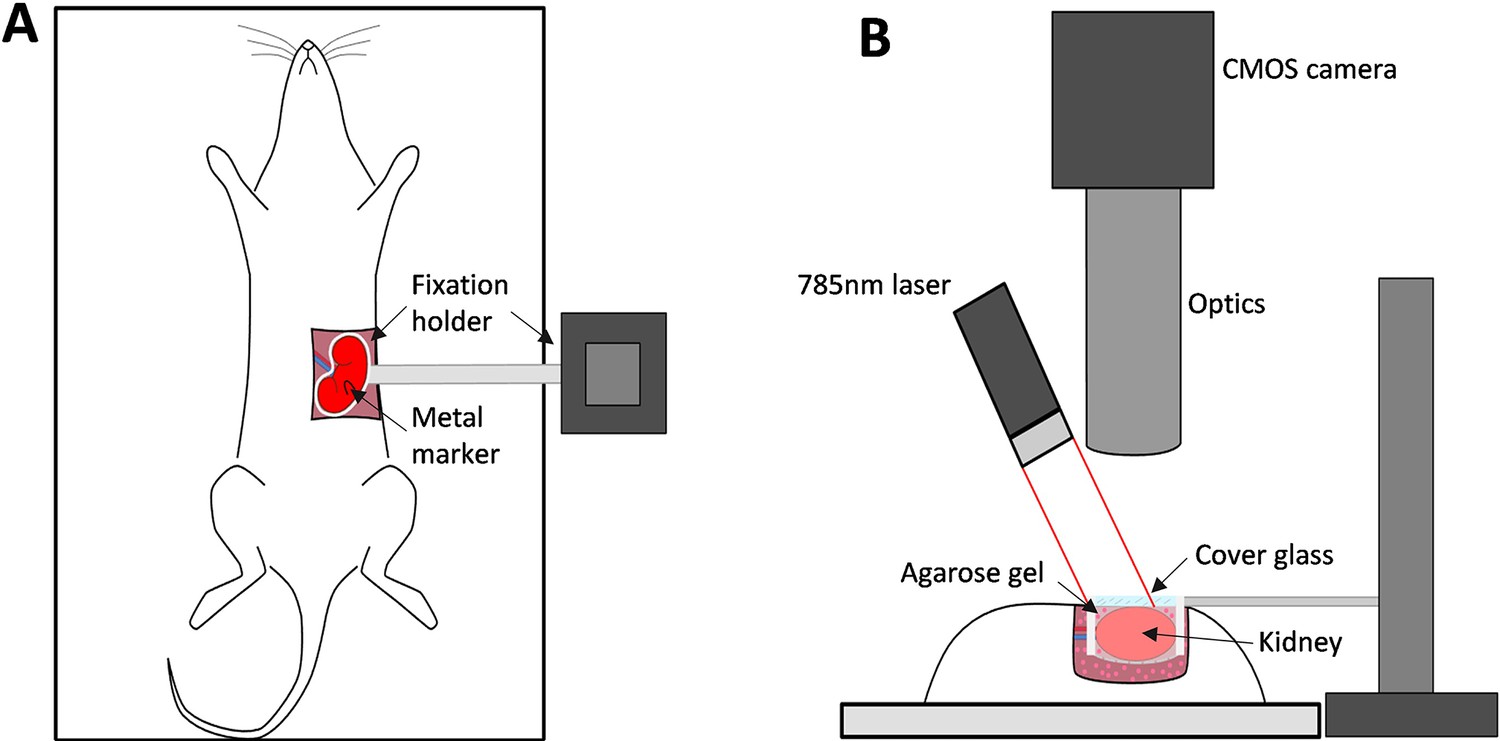
The imaging setup and its key components.
(A) and (B) - top and side views respectively.
Additional files
Download links
A two-part list of links to download the article, or parts of the article, in various formats.
Downloads (link to download the article as PDF)
Open citations (links to open the citations from this article in various online reference manager services)
Cite this article (links to download the citations from this article in formats compatible with various reference manager tools)
Synchronization in renal microcirculation unveiled with high-resolution blood flow imaging
eLife 11:e75284.
https://doi.org/10.7554/eLife.75284


