Oligogenic heterozygous inheritance of sperm abnormalities in mouse
- Institute for Advanced Biosciences, INSERM, CNRS, Université Grenoble Alpes, France
- UM de Génétique Chromosomique, Hôpital Couple-Enfant, CHU Grenoble Alpes, France
- UM GI-DPI, CHU Grenoble Alpes, France
- Department of Genetic Medicine and Development, University of Geneva Medical School, Switzerland
- Station de Primatologie, UPS 846, CNRS, France
Figures
Figure 1
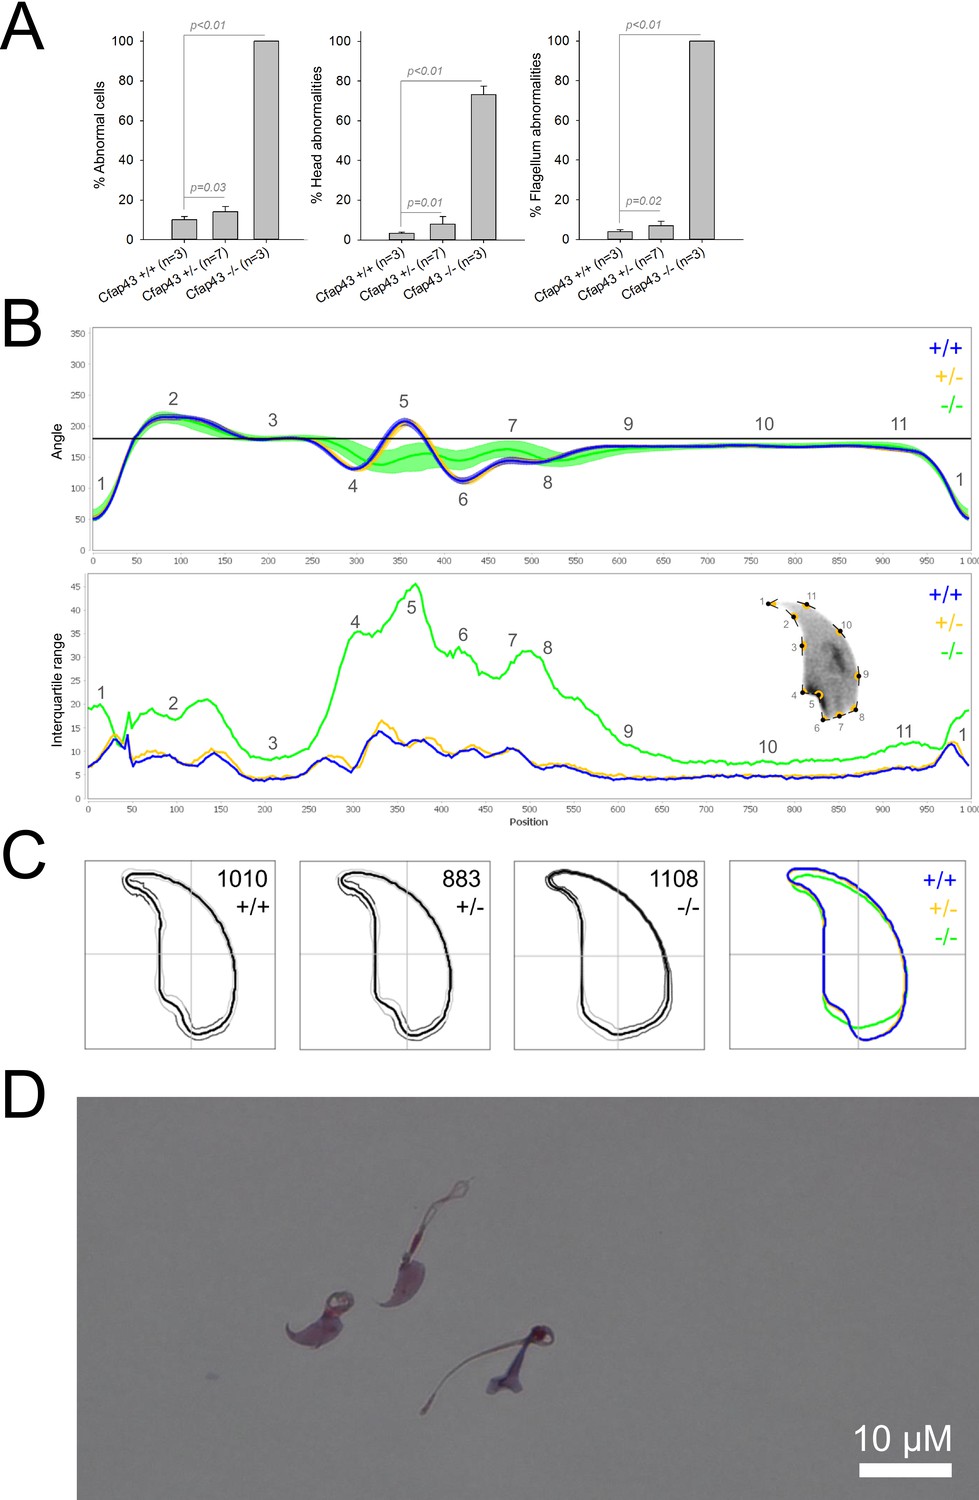
Sperm morphology analysis for the Cfap43 mouse strain.
(A) Histogram showing proportions of morphological anomalies (mean ± SD) for each Cfap43 genotype observed by light microscopy. Statistical significance was assessed by applying an unpaired Welch t-test; p-values are indicated. (B) Angle profiles (top) and variability profiles (bottom) from Cfap43+/+ (blue), Cfap43+/- (yellow), and Cfap43-/- (green) mice. The x axis represents an index of the percentage of the total perimeter as measured counterclockwise from the apex of the sperm hook. The y axis, corresponding to the angle profile, represents the interior angle measured across a sliding window centered on each index location. The y axis, corresponding to the variability profile, represents the Interquartile Range (IQR) value (the difference between the 75th and 25th percentiles). Specific regions of the nuclei are mapped on the profile and the graphical representation (from Skinner et al., 2019) with: 1-tip; 2-under-hook concavity; 3-vertical; 4-ventral angle; 5-tail socket; 6-caudal bulge; 7-caudal base; 8-dorsal angle; 9–11-acrosomal curve. (C) Consensus nuclear outlines for each genotype alongside a merged consensus nucleus (blue = Cfap43+/+, yellow = Cfap43+/-, green = Cfap43-/-). The numbers assigned to each consensus outline correspond to the number of nuclei processed per condition. (D) Optical microscopy analysis showing a representative MMAF phenotype for Cfap43 KO mice (scale bar, 10 µm).
Figure 2
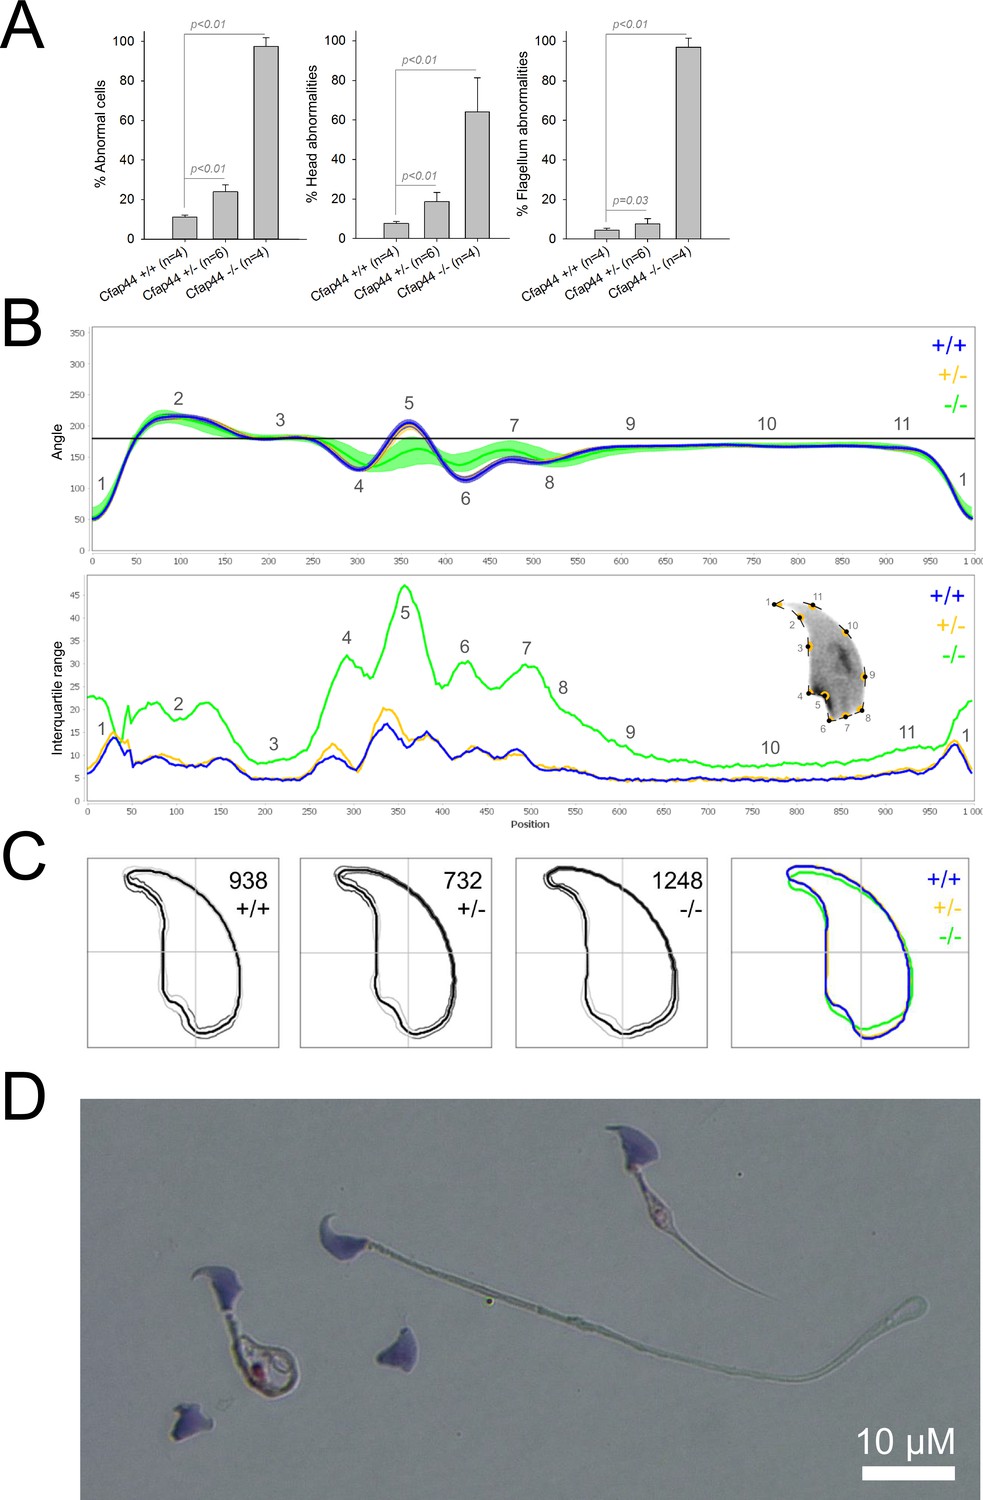
Sperm morphology analysis for the Cfap44 mouse strain.
(A) Histogram showing proportions of morphological anomalies (mean ± SD) for each Cfap44 genotype. Statistical significance was assessed by applying an unpaired Welch t-test; p-values are indicated. (B) Angle profiles (top) and variability profiles (bottom) for Cfap44+/+ (blue), Cfap44+/- (yellow), and Cfap44-/- (green) mice. The x axis represents an index of the percentage of the total perimeter, as measured counterclockwise from the apex of the sperm hook. The y axis corresponding to the angle profile is the interior angle measured across a sliding window centered on each index location. The y axis corresponding to the variability profile represents the Interquartile Range (IQR) value (the difference between the 75th and 25th percentiles). Specific regions of the nuclei are mapped on the profile and the graphical representation (from Skinner et al., 2019) with: 1-tip; 2-under-hook concavity; 3-vertical; 4-ventral angle; 5-tail socket; 6-caudal bulge; 7-caudal base; 8-dorsal angle; 9–11-acrosomal curve. (C) Consensus nuclear outlines for each genotype alongside a merged consensus nucleus (blue = Cfap44+/+, yellow = Cfap44+/-, green = Cfap44-/-). The numbers assigned to each consensus outline correspond to the number of nuclei processed per condition. (D) Optical microscopy analysis showing a representative MMAF phenotype for Cfap44 KO mice (scale bar, 10 µm).
Figure 3
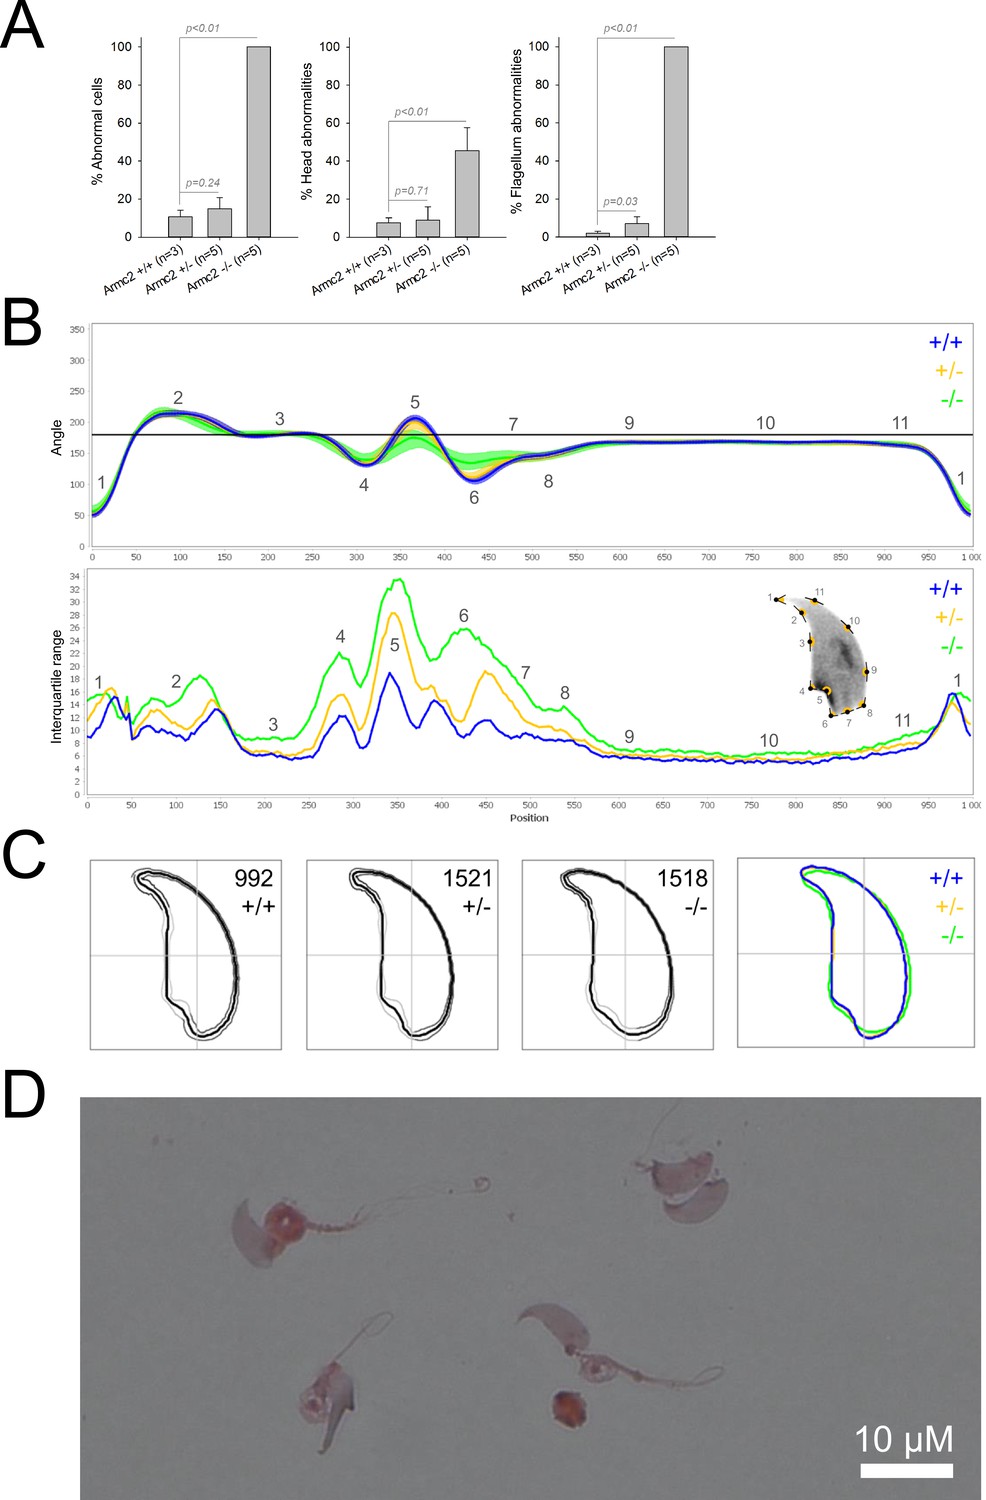
Sperm morphology analysis for the Armc2 mouse strain.
(A) Histogram showing proportions of morphological anomalies (mean ± SD) for each Armc2 genotype. Statistical significance was assessed by applying an unpaired Welch t-test; p-values are indicated. (B) Angle profiles (top) and variability profiles (bottom) for Armc2+/+ (blue), Armc2+/- (yellow), and Armc2-/- (green) mice. The x axis represents an index of the percentage of the total perimeter, as measured counterclockwise from the apex of the sperm hook. The y axis corresponding to the angle profile represents the interior angle measured across a sliding window centered on each index location. The y axis corresponding to the variability profile represents the Interquartile Range (IQR) value (the difference between the 75th and 25th percentiles). Specific regions of the nuclei are mapped on the profile and the graphical representation (from Skinner et al., 2019) with: 1-tip; 2-under-hook concavity; 3-vertical; 4-ventral angle; 5-tail socket; 6-caudal bulge; 7-caudal base; 8-dorsal angle; 9–11-acrosomal curve. (C) Consensus nuclear outlines for each genotype alongside a merged consensus nucleus (blue = Armc2+/+, yellow = Armc2+/-, green = Armc2-/-). The numbers assigned to each consensus outline correspond to the number of nuclei processed per condition. (D) Optical microscopy analysis showing a representative MMAF phenotype for Armc2 KO mice (scale bar, 10 µm).
Figure 4
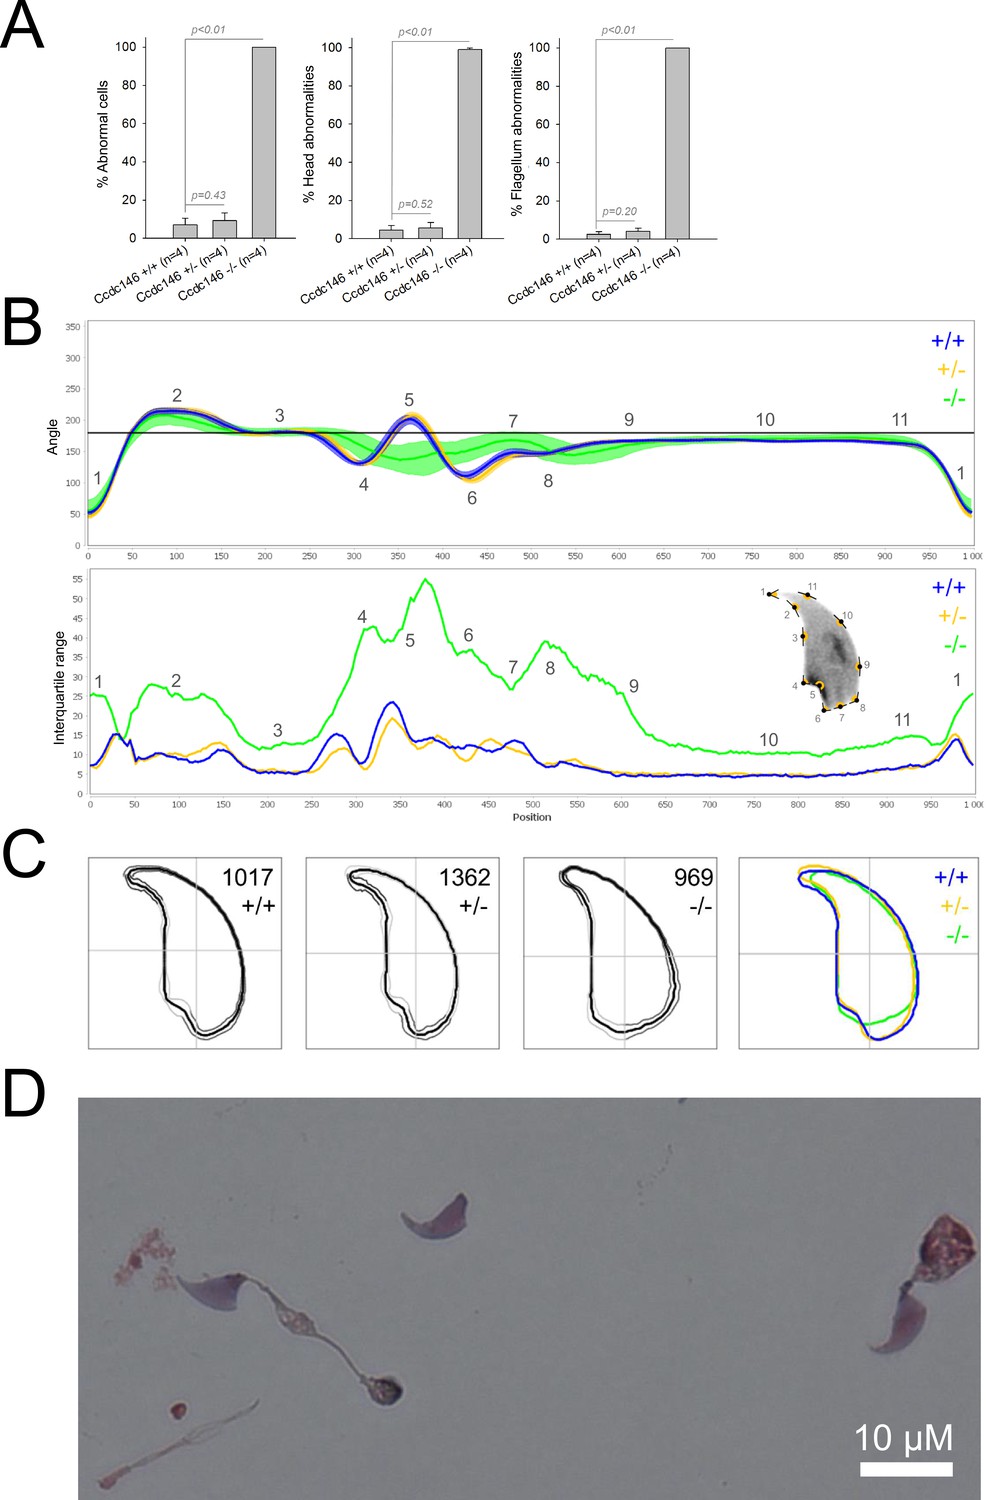
Sperm morphology analysis for the Ccdc146 mouse strain.
(A) Histogram showing proportions of morphological anomalies (mean ± SD) for each Ccdc146 genotype. Statistical significance was assessed by applying an unpaired Welch t-test; p-values are indicated. (B) Angle profiles (top) and variability profiles (bottom) for Ccdc146+/+ (blue), Ccdc146+/- (yellow) and Ccdc146-/- (green) mice. The x axis represents an index of the percentage of the total perimeter as measured counterclockwise from the apex of the sperm hook. The y axis corresponding to the angle profile is the interior angle measured across a sliding window centered on each index location. The y axis corresponding to the variability profile represents the Interquartile Range (IQR) (the difference between the 75th and 25th percentiles). Specific regions of the nuclei are mapped on the profile and the graphical representation (from Skinner et al., 2019) with: 1-tip; 2-under-hook concavity; 3-vertical; 4-ventral angle; 5-tail socket; 6-caudal bulge; 7-caudal base; 8-dorsal angle; 9–11-acrosomal curve. (C) Consensus nuclear outlines for each genotype alongside a merged consensus nucleus (blue = Ccdc146+/+, yellow = Ccdc146+/-, green = Ccdc146-/-). The numbers assigned to each consensus outline correspond to the number of nuclei processed per condition. (D) Optical microscopy analysis showing a typical MMAF phenotype for Ccdc146 KO mice (scale bar, 10 µm).
Figure 5
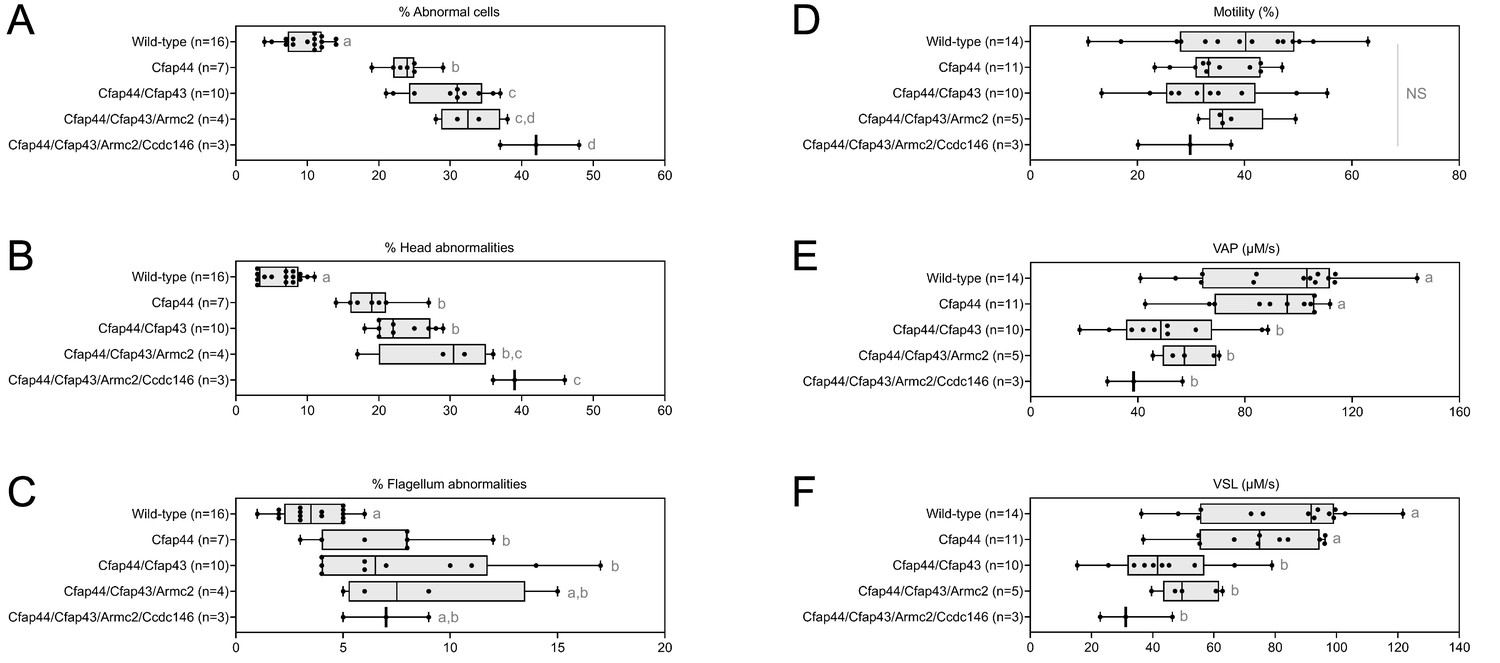
Increasing the number of heterozygous mutated genes involved in the MMAF syndrome has a drastic effect on sperm morphology and motility.
(A) Sperm morphological defects, (B) head defects, (C) flagellum defects, showing only slight impact. Increasing the number of heterozygous gene mutations had little effect on (D) Percentage of motile sperm, but considerably reduced sperm motility parameters including (E) average path velocity (VAP), and (F) curvilinear velocity (VCL). All data are presented simultaneously as box-plot and individual datapoints. Statistical significance was assessed using an unpaired Welch t-test. Each group was compared individually with all other groups one by one. For each histogram, plots sharing different small letters represent statistically significantly differences between the groups (p < 0.05), and plots with a common letter do not present statistically significantly differences between the groups (p > 0.05). The corresponding statistical data can be found in Figure 5—source data 2–3 and raw data can be found in Figure 5—source data 1.
-
Figure 5—source data 1
Raw data of Figure 5.
- https://cdn.elifesciences.org/articles/75373/elife-75373-fig5-data1-v2.xlsx
-
Figure 5—source data 2
Statistical data linked to the Welch t-tests performed in Figure 5D–F.
DoF = Degrees of Freedom; CI = Confidence Interval.
- https://cdn.elifesciences.org/articles/75373/elife-75373-fig5-data2-v2.docx
-
Figure 5—source data 3
Statistical data linked to the Welch t-tests performed in Figure 5A–C.
DoF = Degrees of Freedom; CI = Confidence Interval.
- https://cdn.elifesciences.org/articles/75373/elife-75373-fig5-data3-v2.docx
Figure 6
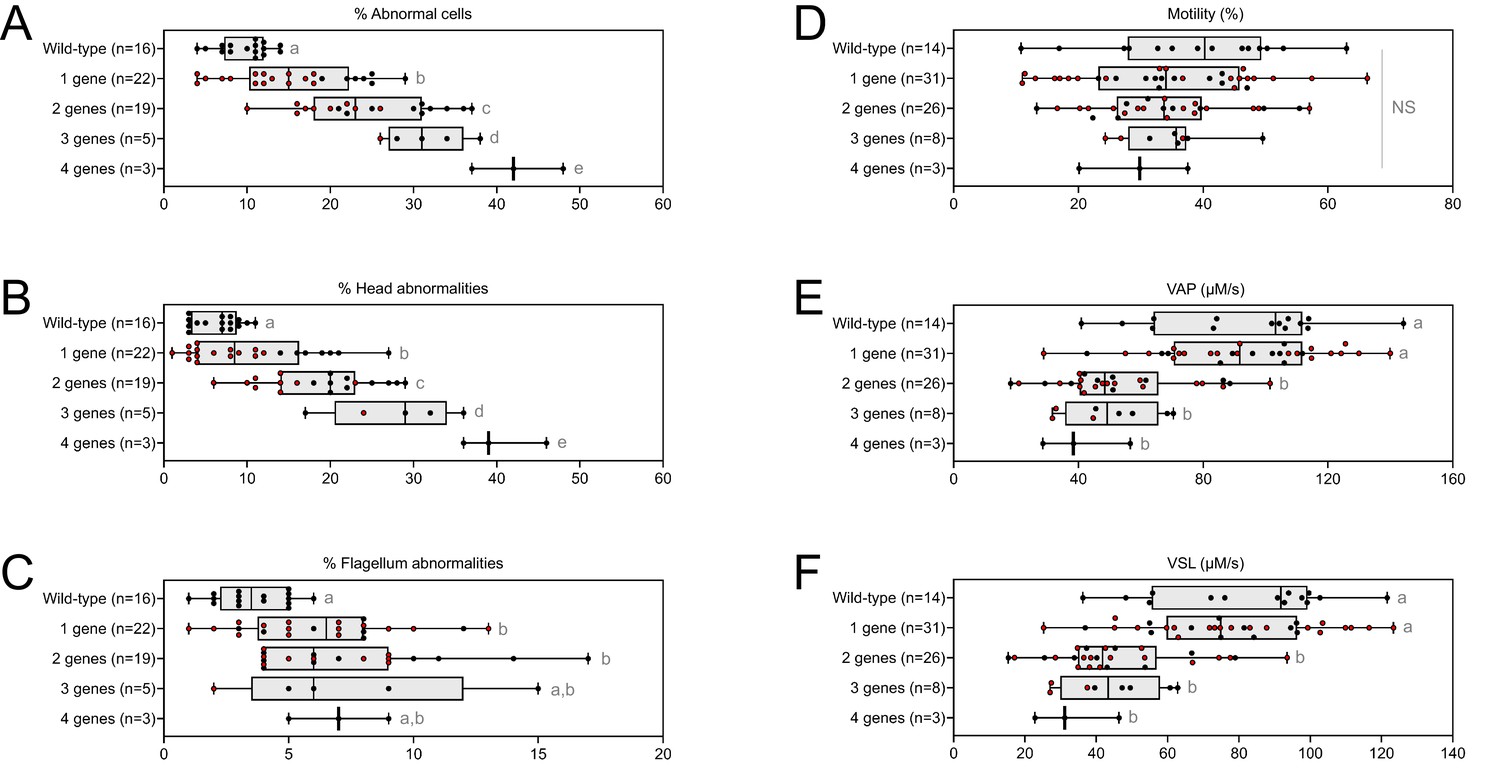
Very similar head morphology defects and decreased motility parameters, whatever the combination of mutated genes.
Black dots correspond to the different combinations (2 = Cfap43 and Cfap44; 3 = Cfap43, Cfap44 and Armc2; 4 = Cfap43, Cfap44, Armc2 and Ccdc146) of mutations presented in Figure 5; red dots correspond to alternative combinations obtained with the same four genes. The range of (A) sperm morphological defects, (B) head anomalies, and (C) flagellum defects was similar for black and red dots. Likewise, (D) percentage of motile sperm, (E) average path velocity (VAP) and (F) curvilinear velocity (VCL), showed similar ranges for black and red dots. All data are presented simultaneously as box-plot and individual datapoints. Statistical significance was assessed using unpaired Welch t-test. Each group was compared individually with all other groups one by one. For each histogram, plots sharing different small letters represent statistically significantly differences between the groups (p < 0.05), and plots with a common letter do not present statistically significantly differences between the groups (p > 0.05). Statistical significance of differences between means calculated for all black and red dots were also assessed by applying an unpaired Welch t-test and the corresponding statistical data can be found in Figure 6—source data 2–3 and raw data can be found in Figure 6—source data 1.
-
Figure 6—source data 1
Raw data and genotypes of Figure 6.
- https://cdn.elifesciences.org/articles/75373/elife-75373-fig6-data1-v2.xlsx
-
Figure 6—source data 2
Statistical data linked to the Welch t-tests performed in Figure 6D–F.
DoF = Degrees of Freedom; CI = Confidence Interval.
- https://cdn.elifesciences.org/articles/75373/elife-75373-fig6-data2-v2.docx
-
Figure 6—source data 3
Statistical data linked to the Welch t-tests performed in Figure 6A–C.
DoF = Degrees of Freedom; CI = Confidence Interval.
- https://cdn.elifesciences.org/articles/75373/elife-75373-fig6-data3-v2.docx
Figure 7
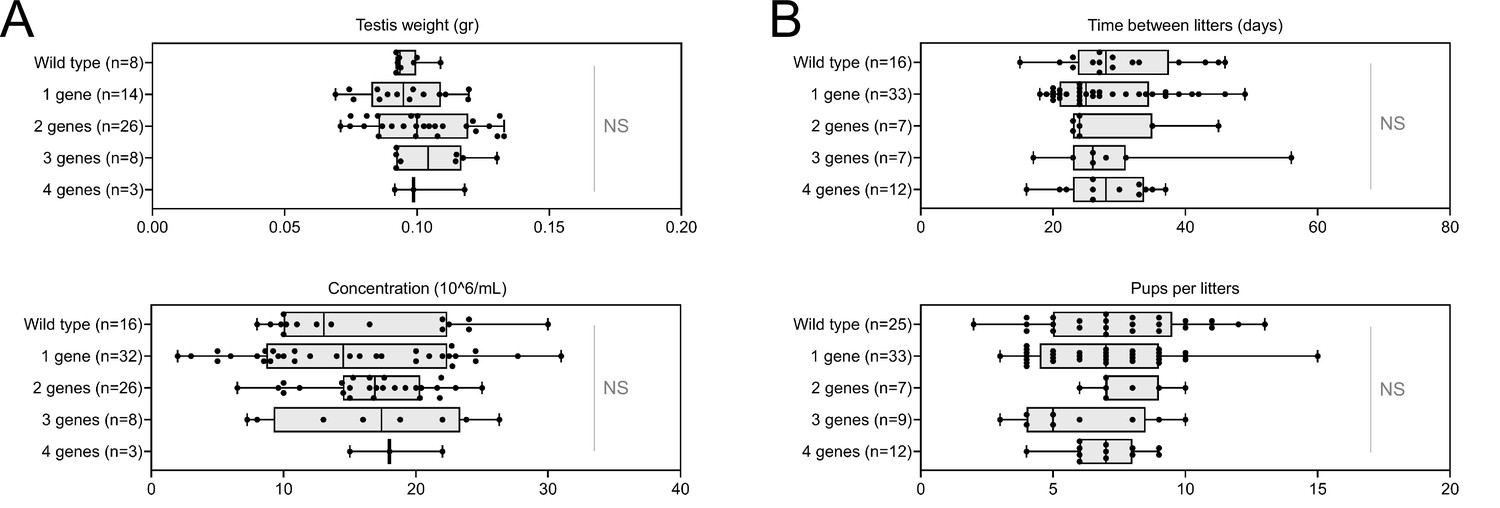
Increasing the number of mutated genes has little effect on overall fertility.
(A) Sperm production data (B) Overall fertility of animals (measured as the interval between two litters and the number of pups per litter). All data are presented simultaneously as box-plot and individual datapoints. Statistical significance was assessed using unpaired Welch t-test. Each group was compared individually with all other groups one by one. For each histogram, plots sharing different small letters represent statistically significantly differences between the groups (p < 0.05), and plots with a common letter do not present statistically significantly differences between the groups (p > 0.05). The corresponding statistical data can be found in Figure 7—source data 2 and raw data can be found in Figure 7—source data 1.
-
Figure 7—source data 1
Raw data and genotypes of Figure 7.
- https://cdn.elifesciences.org/articles/75373/elife-75373-fig7-data1-v2.xlsx
-
Figure 7—source data 2
Statistical data linked to the Welch t-tests performed in Figure 7B.
DoF = Degrees of Freedom; CI = Confidence Interval.
- https://cdn.elifesciences.org/articles/75373/elife-75373-fig7-data2-v2.docx
-
Figure 7—source data 3
Statistical data linked to the Welch t-tests performed in Figure 7A.
DoF = Degrees of Freedom; CI = Confidence Interval.
- https://cdn.elifesciences.org/articles/75373/elife-75373-fig7-data3-v2.docx
Figure 8
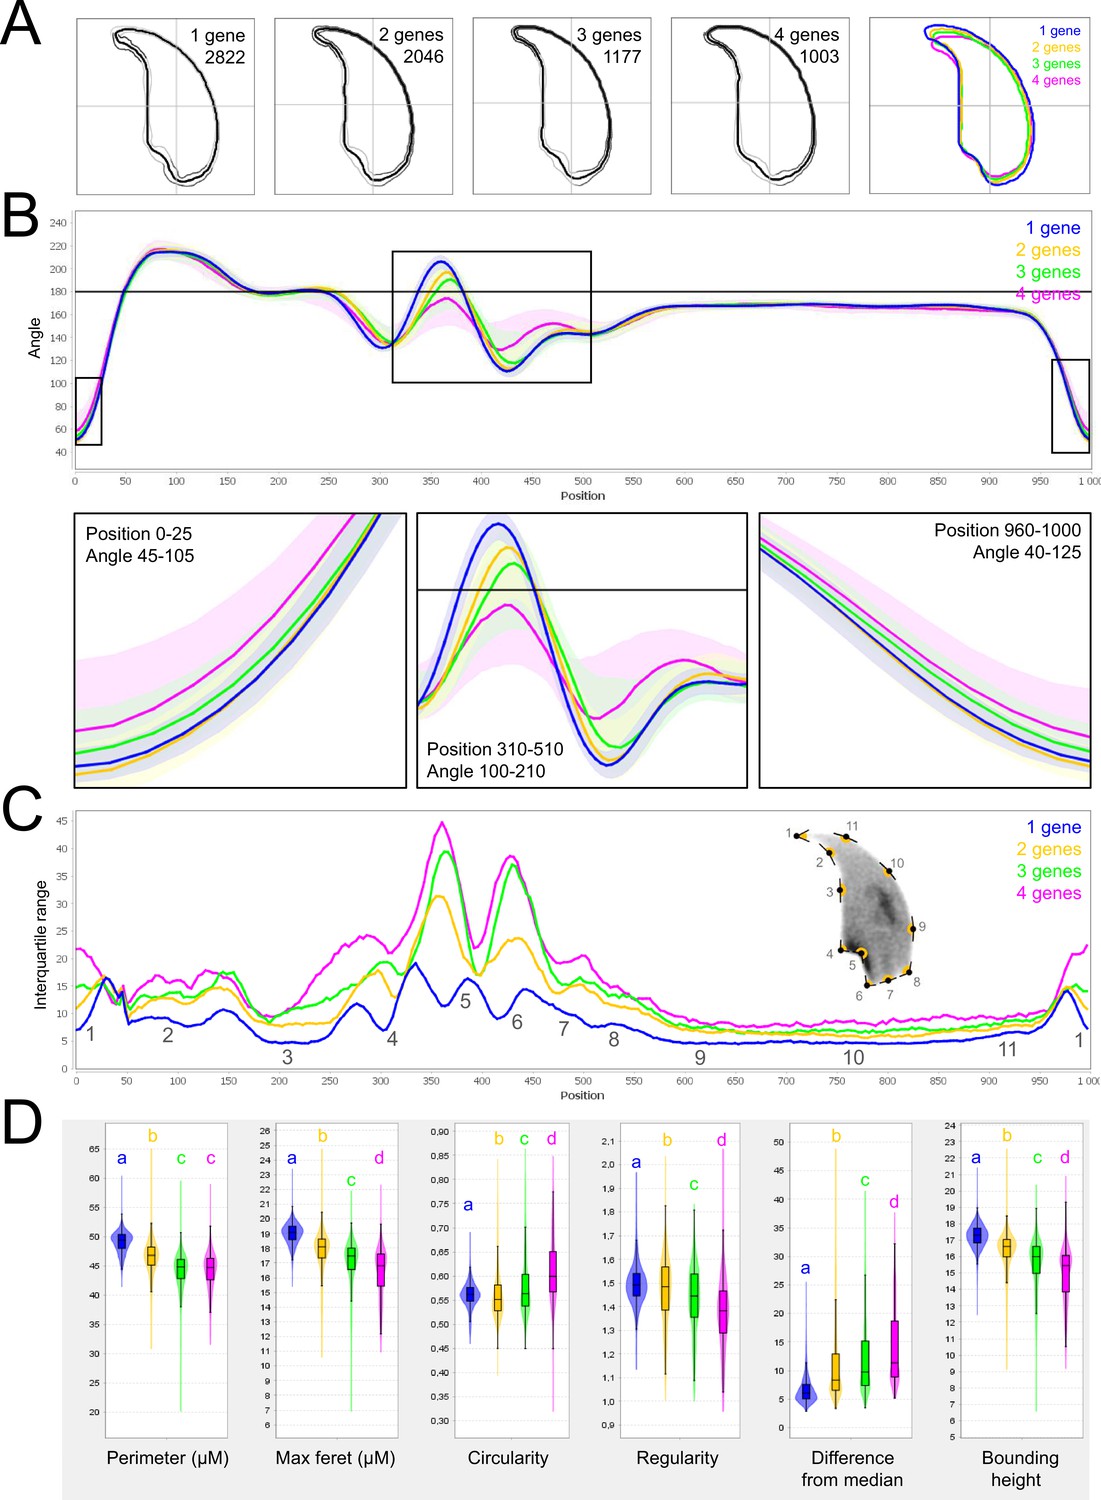
Fine nuclear morphology analysis of multi-mutant mice with one to four heterozygous mutations.
(A) Consensus nuclear outlines for each strain alongside a merged consensus nucleus (blue = one mutation, yellow = two mutations, green = three mutations and pink = four mutations). The numbers assigned to each consensus outline correspond to the number of nuclei processed per condition. (B) Angle profiles for each strain focusing (black boxes) on positions of specific interest. The x axis represents an index of the percentage of the total perimeter, as measured counterclockwise from the apex of the sperm hook. The y axis shows the interior angle measured across a sliding window centered on each index location. (C) Variability profiles for each strain. The x axis is the same as for the angle profile, and the y axis represents the Interquartile Range (IQR) (the difference between the 75th and 25th percentiles). Specific regions of the nuclei are mapped on the profile and the graphical representation (from Skinner et al., 2019), with: 1-tip; 2-under-hook concavity; 3-vertical; 4-ventral angle; 5-tail socket; 6-caudal bulge; 7-caudal base; 8-dorsal angle; 9–11-acrosomal curve. (D) Violin plots of nuclear parameters for each strain. Statistical significance of differences between populations were assessed by the software, applying a Mann-Whitney U test; significantly different populations are identified by distinct letters.
Appendix 1—figure 1
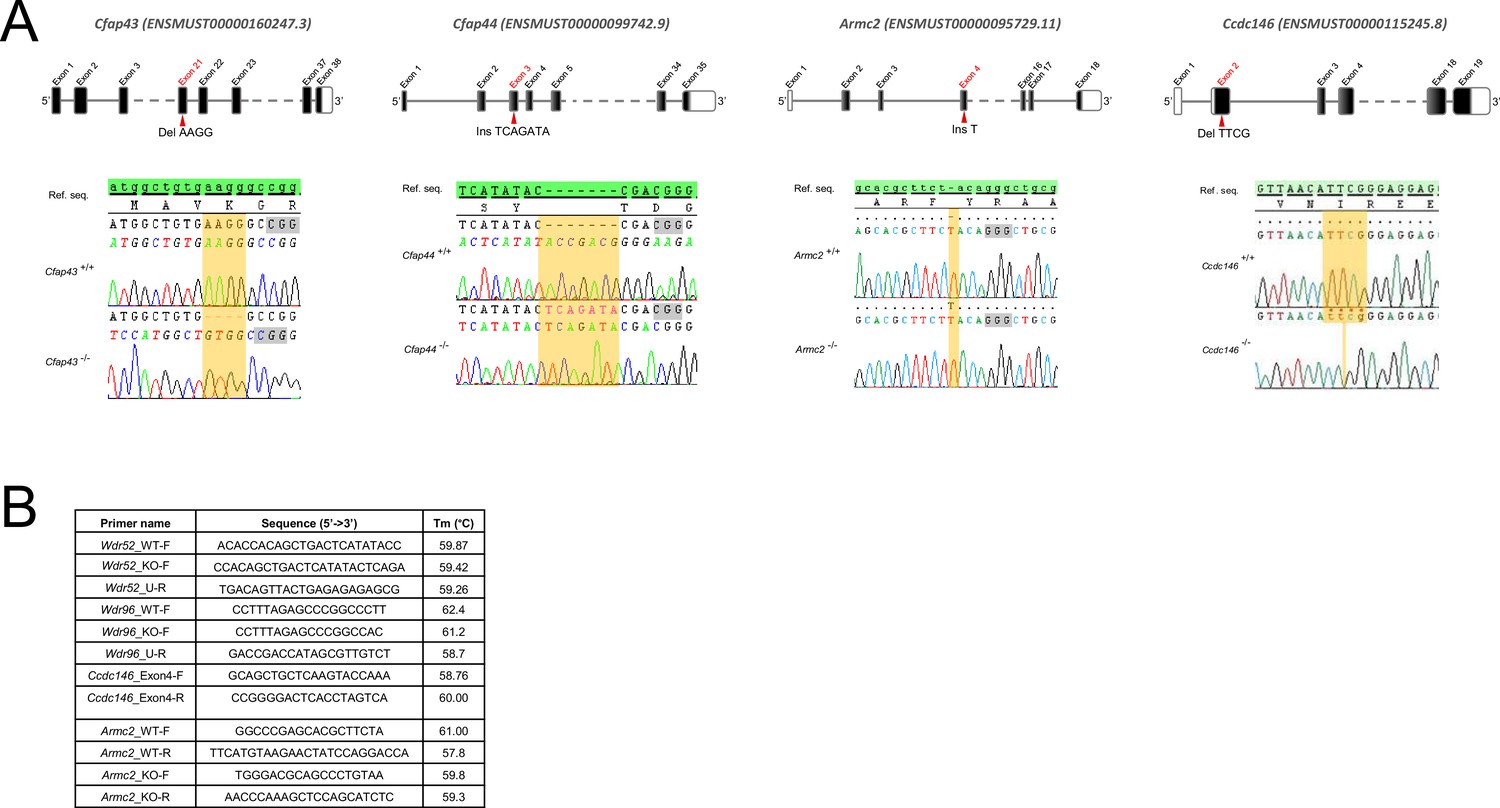
Genetic data associated with strains creation.
(A) Location of mutations and electropherograms from Sanger sequencing of mutated forms of murine Cfap43, Cfap44, Armc2, and Ccdc146 compared to their respective reference sequences. We confirmed a 4 bp deletion in Cfap43 exon 21 (delAAGG), a 7 bp insertion in Cfap44 exon 3 (InsTCAGATA), a 1 bp insertion (InsT) in Armc2 exon 4, and a 4 bp deletion in Ccdc146 exon 2 (delTTCG). Red arrows indicate the CRISPR/Cas9 targeting sequence, mutations are highlighted in yellow, and the gray boxes indicate the position of the protospacer-adjacent motif (PAM) sequences used during mutagenesis. (B) List of the primers used for PCR screening of each strain.
Appendix 1—figure 2
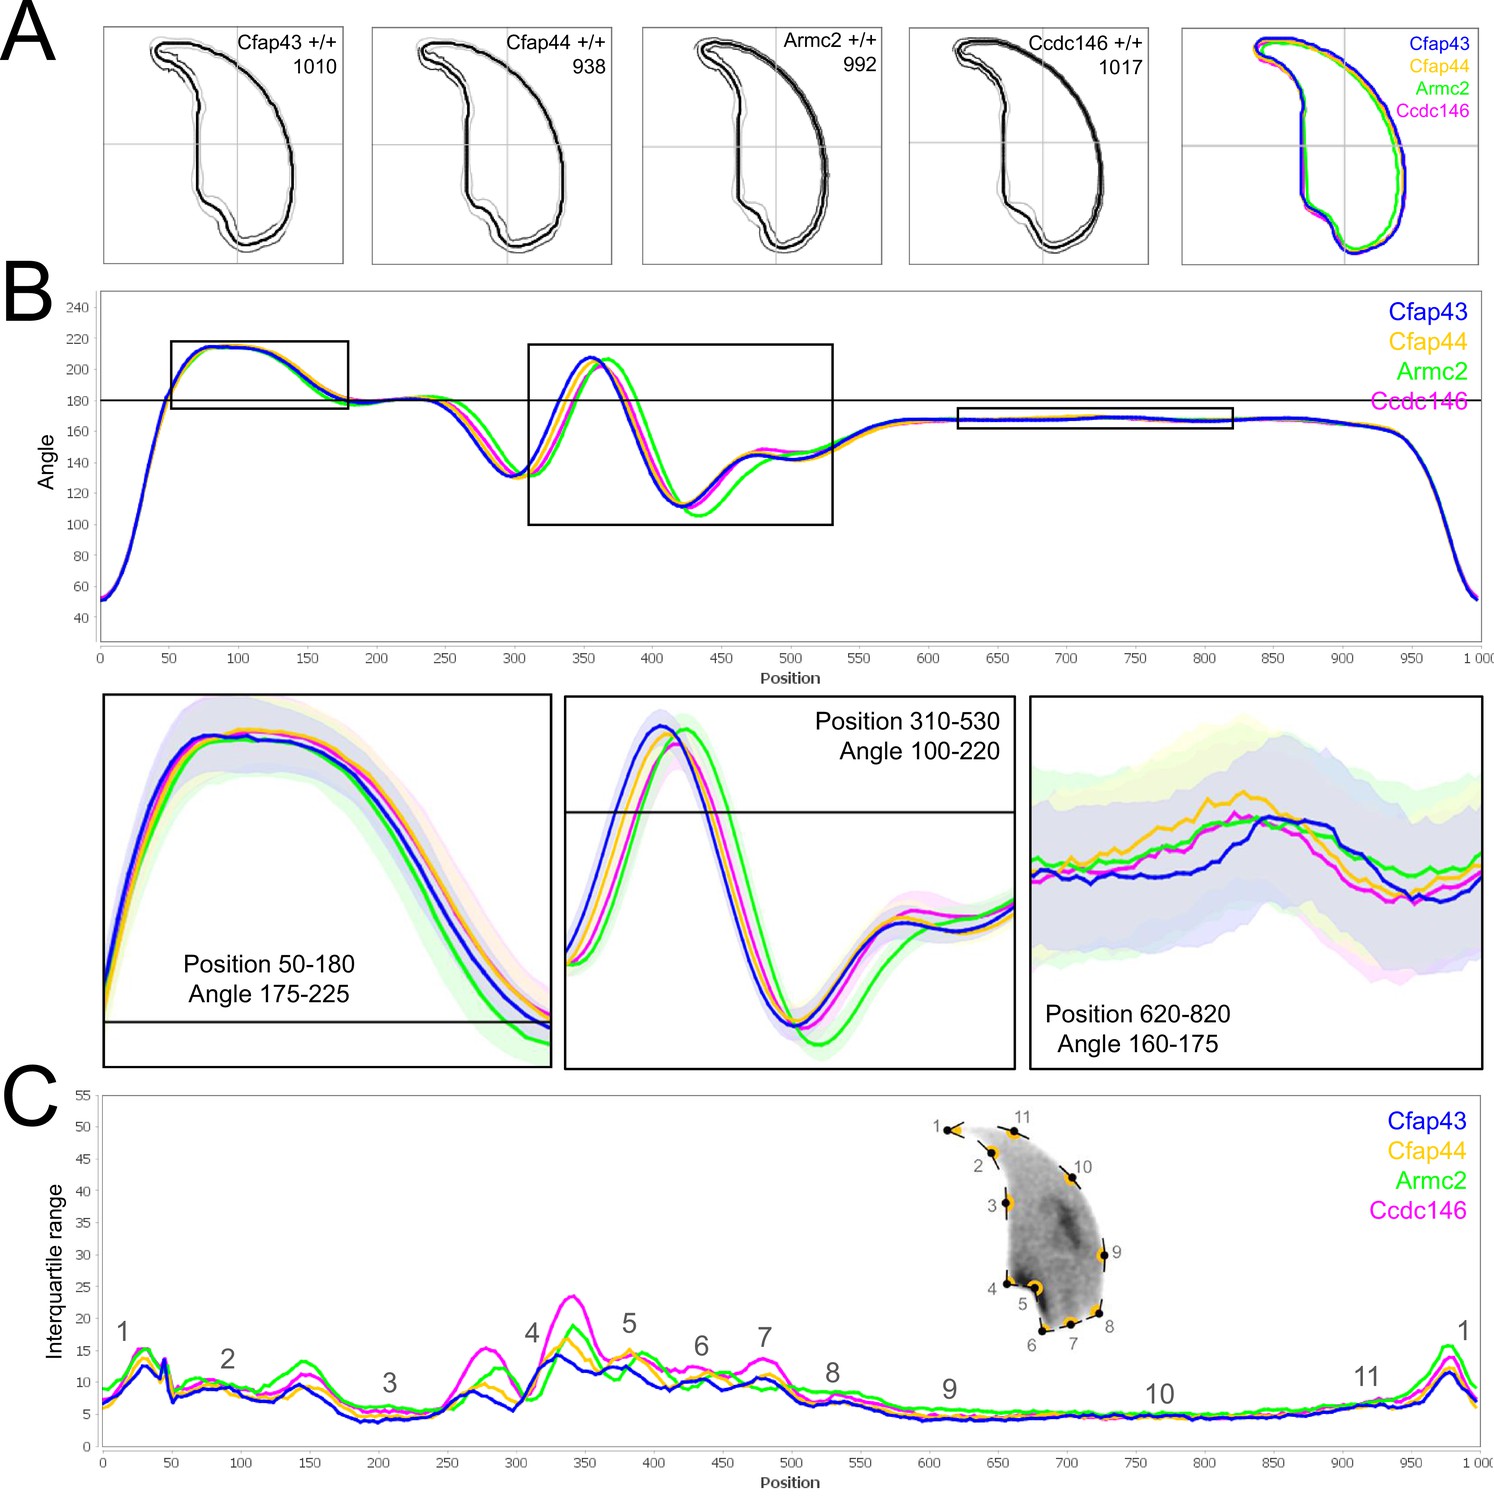
Comparison of fine nuclear morphology for wild-type animals produced from crosses of all strains studied.
(A) Consensus nuclear outlines for each strain alongside a merged consensus nucleus (blue = Cfap43, yellow = Cfap44, green = Armc2 and pink = Ccdc146). The numbers assigned to each consensus outline correspond to the number of nuclei processed per condition. (B) Angle profiles for each strain focusing (black boxes) on positions of specific interest. The x axis represents an index of the percentage of the total perimeter, as measured counterclockwise from the apex of the sperm hook. The y axis shows the interior angle measured across a sliding window centered on each index location (C) Variability profiles for each strain. The x axis is the same as for the angle profile, and the y axis represents the Interquartile Range (IQR) (the difference between the 75th and 25th percentiles). Specific regions of the nuclei are mapped on the profile and the graphical representation (from Skinner et al., 2019), with: 1-tip; 2-under-hook concavity; 3-vertical; 4-ventral angle; 5-tail socket; 6-caudal bulge; 7-caudal base; 8-dorsal angle; 9–11-acrosomal curve.
Appendix 1—figure 3
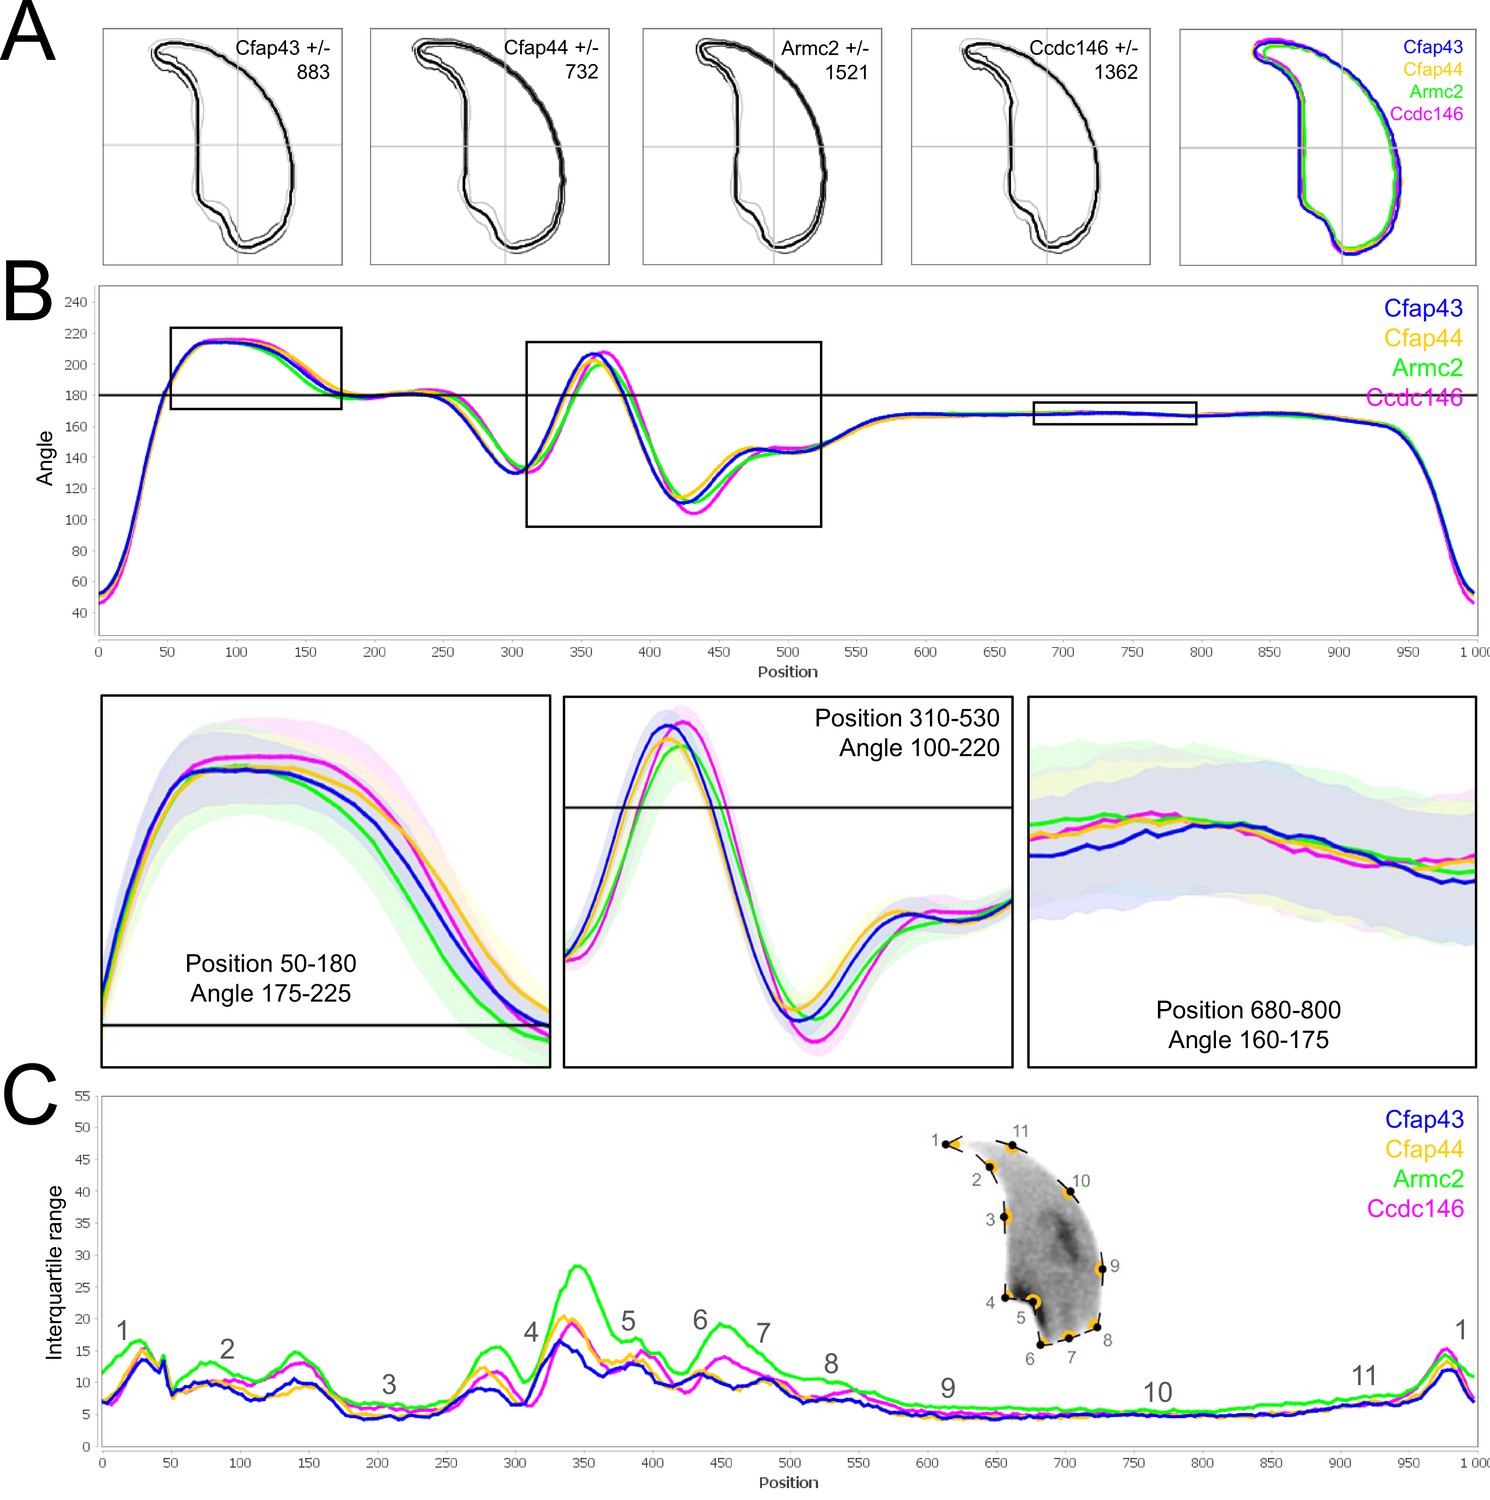
Comparison of fine nuclear morphology for heterozygous animals produced during crosses of all strains.
(A) Consensus nuclear outlines for each strain alongside a merged consensus nucleus (blue = Cfap43, yellow = Cfap44, green = Armc2, and pink = Ccdc146). The numbers assigned to each consensus outline correspond to the number of nuclei processed per condition. (B) Angle profiles for each strain focusing (black boxes) on positions of specific interest. The x axis represents an index of the percentage of the total perimeter, as measured counterclockwise from the apex of the sperm hook. The y axis shows the interior angle measured across a sliding window centered on each index location (C) Variability profiles for each strain. The x axis is the same as for the angle profile, and the y axis represents the Interquartile Range (IQR) (the difference between the 75th and 25th percentiles). Specific regions of the nuclei are mapped on the profile and the graphical representation (from Skinner et al., 2019) with: 1-tip; 2-under-hook concavity; 3-vertical; 4-ventral angle; 5-tail socket; 6-caudal bulge; 7-caudal base; 8-dorsal angle; 9–11-acrosomal curve.
Appendix 1—figure 4

Comparison of fine nuclear morphology for sperm heads from KO and WT animals.
(A) Consensus nuclear outlines for each KO strain alongside a merged consensus nucleus, and (far right) superimposition of the outlines of the four strains (blue = Cfap43, yellow = Cfap44, green = Armc2, and pink = Ccdc146). The numbers assigned to each consensus outline corresponds to the number of nuclei processed per condition. (B) Angle profiles for each strain alongside an angle profile for wild-type mice (black), focusing (black boxes) on positions of specific interest. The x axis represents an index of the percentage of the total perimeter, as measured counterclockwise from the apex of the sperm hook. The y axis corresponds to the interior angle measured across a sliding window centered on each index location (C) Variability profiles for each strain. The x axis is the same as for the angle profile, and the y axis represents the Interquartile Range (IQR) value (the difference between the 75th and 25th percentiles). Specific regions of the nuclei are mapped on the profile and the graphical representation (from Skinner et al., 2019), with: 1-tip; 2-under-hook concavity; 3-vertical; 4-ventral angle; 5-tail socket; 6-caudal bulge; 7-caudal base; 8-dorsal angle; 9–11-acrosomal curve. (D) Violin plots presenting mean data for representative nuclear parameters associated with each gene. Statistical significance of differences between populations was assessed by the NMAS software, applying a Mann-Whitney U test. Significantly different populations are identified by distinct letters.
Appendix 1—figure 5
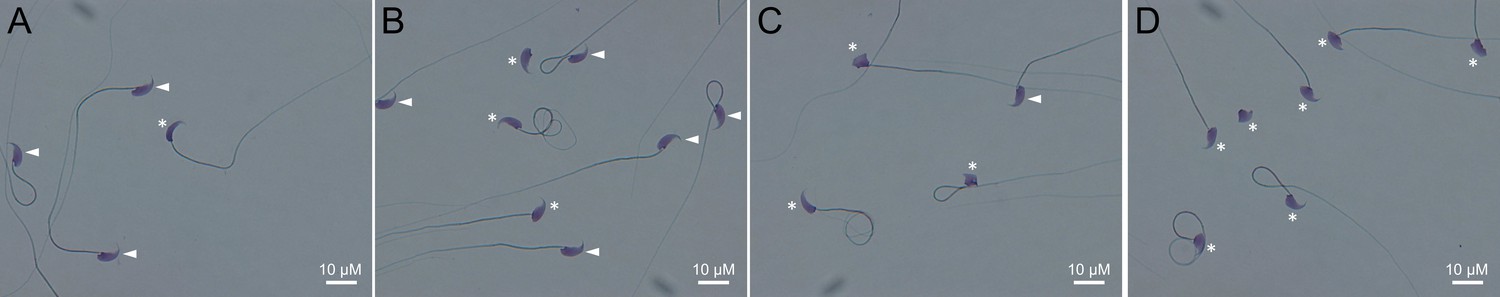
Light microscopy pictures of spermatozoa from mice bearing one mutation (A), two mutations (B), three mutations (C) or four mutations (D).
Sperm with normal morphology are marked with a white arrow and those with a morphological abnormality are marked with a white asterisk.
Appendix 1—figure 6

Consensus and percentage distribution of the distinct sperm populations classified based on nuclear morphology and according to the number of heterozygous mutations.
Appendix 1—figure 7

Light microscopy pictures of Harris-Schorr stained spermatozoa with (A) typical morphology, (B) head abnormalities, (C) flagellum abnormalities or (D) head and flagellum abnormalities.
Defects are pointed by white arrows.
Videos
Video 1
Representative video of living sperm cells from wild-type mouse provided by Computer Assisted Sperm Analysis device.
Sperm were introduced into a Leja slide (100 µm thick) and maintained at 37 °C during recording.
Video 2
Representative video of living sperm cells from mouse bearing one heterozygous mutation provided by Computer Assisted Sperm Analysis device.
Sperm were introduced into a Leja slide (100 µm thick) and maintained at 37 °C during recording.
Video 3
Representative video of living sperm cells from mouse bearing two heterozygous mutation provided by Computer Assisted Sperm Analysis device.
Sperm were introduced into a Leja slide (100 µm thick) and maintained at 37 °C during recording.
Video 4
Representative video of living sperm cells from mouse bearing three heterozygous mutation provided by Computer Assisted Sperm Analysis device.
Sperm were introduced into a Leja slide (100 µm thick) and maintained at 37°C during recording.
Video 5
Representative video of living sperm cells from mouse bearing four heterozygous mutation provided by Computer Assisted Sperm Analysis device.
Sperm were introduced into a Leja slide (100 µm thick) and maintained at 37 °C during recording.
Additional files
Download links
A two-part list of links to download the article, or parts of the article, in various formats.
Downloads (link to download the article as PDF)
Open citations (links to open the citations from this article in various online reference manager services)
Cite this article (links to download the citations from this article in formats compatible with various reference manager tools)
Oligogenic heterozygous inheritance of sperm abnormalities in mouse
eLife 11:e75373.
https://doi.org/10.7554/eLife.75373


