Assessing the causal role of epigenetic clocks in the development of multiple cancers: a Mendelian randomization study
- MRC Integrative Epidemiology Unit, University of Bristol, United Kingdom
- Population Health Sciences, Bristol Medical School, United Kingdom
- Centre for Genomic and Experimental Medicine, Institute of Genetics and Cancer, University of Edinburgh, United Kingdom
- Department of Human Genetics, David Geffen School of Medicine, University of California, Los Angeles, United States
- Department of Epidemiology and Biostatistics, School of Public Health, Imperial College London, United Kingdom
- Department of Hygiene and Epidemiology, School of Medicine, University of Ioannina, Greece
- Public Health Sciences Division, Fred Hutchinson Cancer Research Center, United States
- Department of Epidemiology, School of Public Health, University of Washington, United States
- Department of Clinical Pathology, Melbourne Medical School, University of Melbourne, Australia
- Cancer Prevention Institute of California, United States
- National Institute for Health Research (NIHR) Bristol Biomedical Research Centre, University Hospitals Bristol and Weston NHS Foundation Trust and the University of Bristol, United Kingdom
- Department of Biostatistics, Fielding School of Public Health, University of California, Los Angeles, United States
- Novo Nordisk Research Centre, United Kingdom
Figures
Figure 1
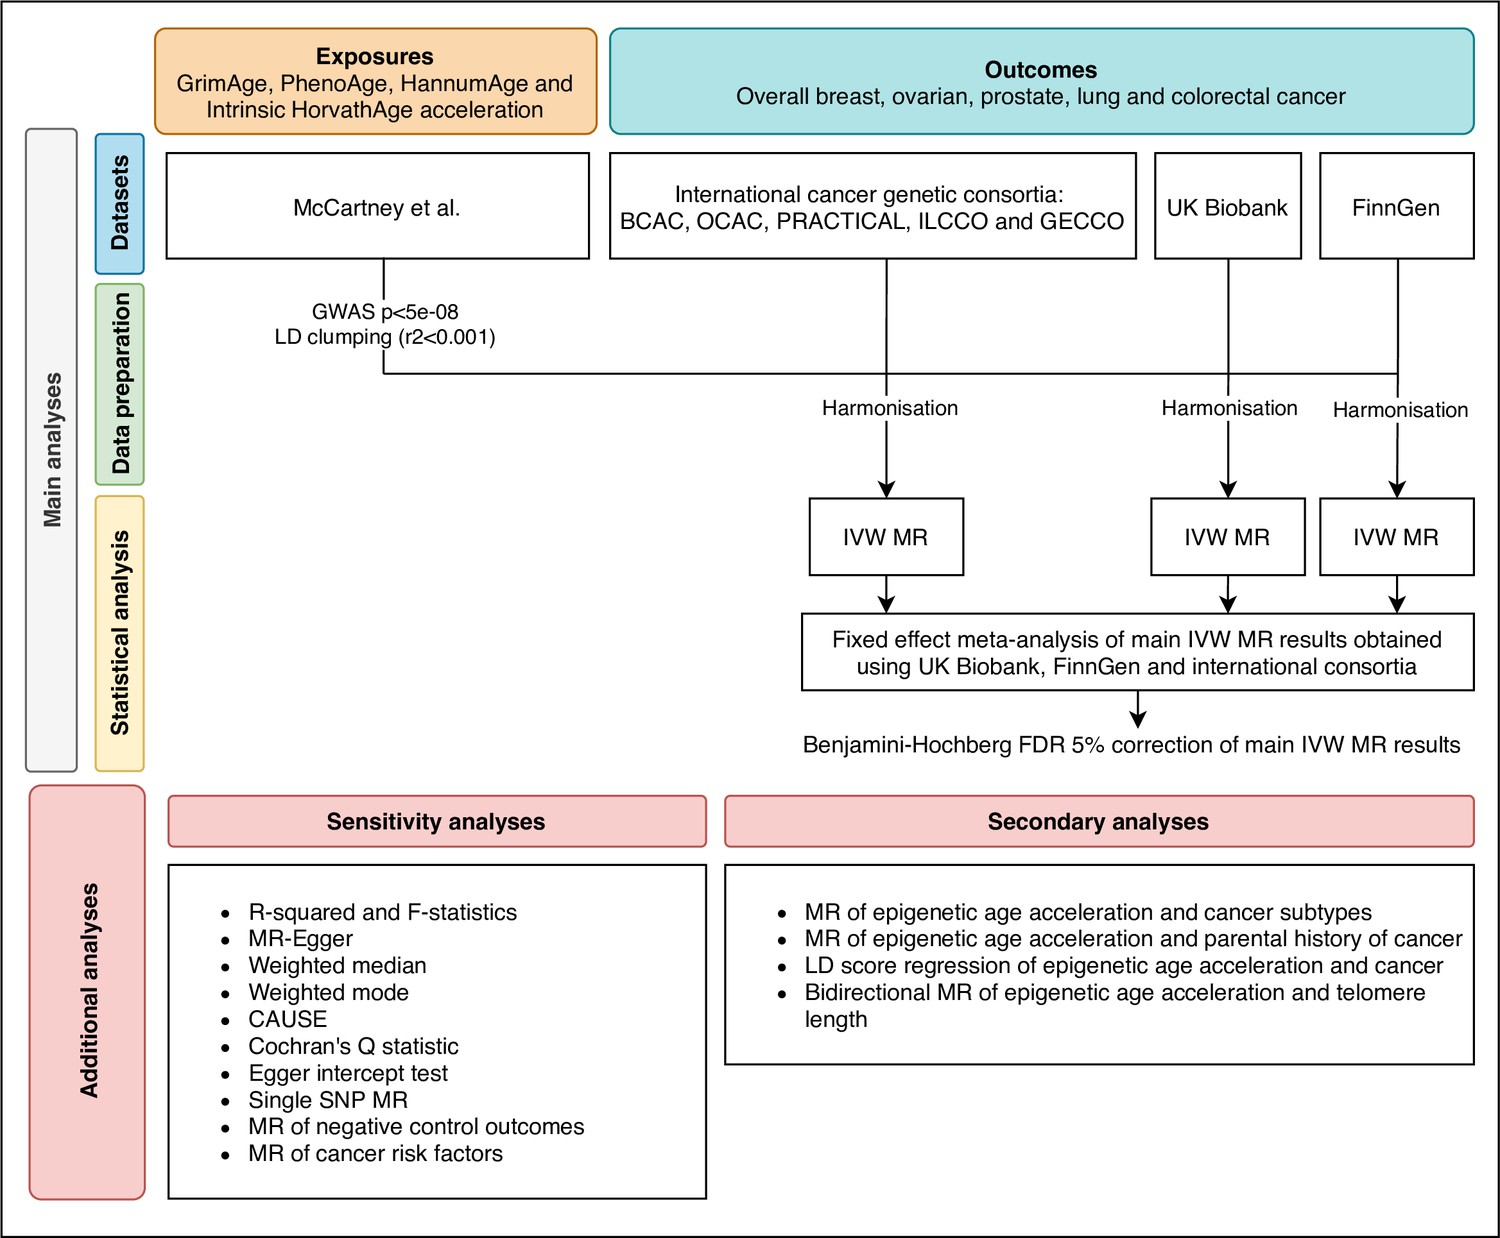
Flowchart summarising study methods.
Abbreviations: BCAC, Breast Cancer Association Consortium; OCAC, Ovarian Cancer Association Consortium; PRACTICAL, Prostate Cancer Association Group to Investigate Cancer Associated Alterations in the Genome; ILCCO, International Lung Cancer Consortium; GECCO, Genetics and Epidemiology of Colorectal Cancer Consortium; LD, linkage disequilibrium; IVW, inverse variance weighted; MR, Mendelian randomization; FDR, false discovery rate; GWAS, genome-wide association study; CAUSE, Causal Analysis Using Summary Effect estimates, SNP, single-nucleotide polymorphism.
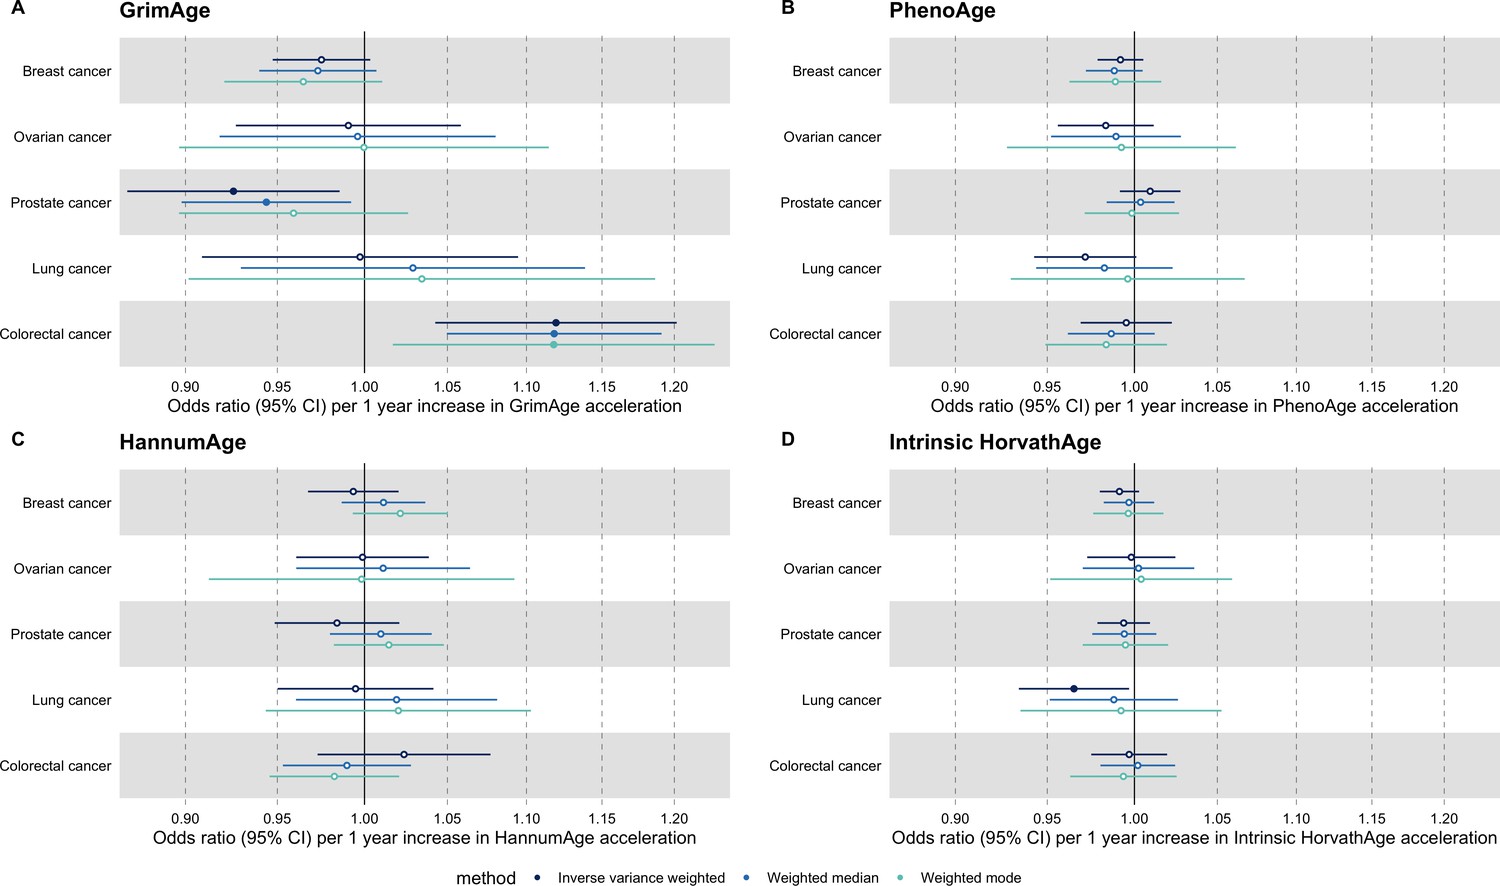
Figure 2
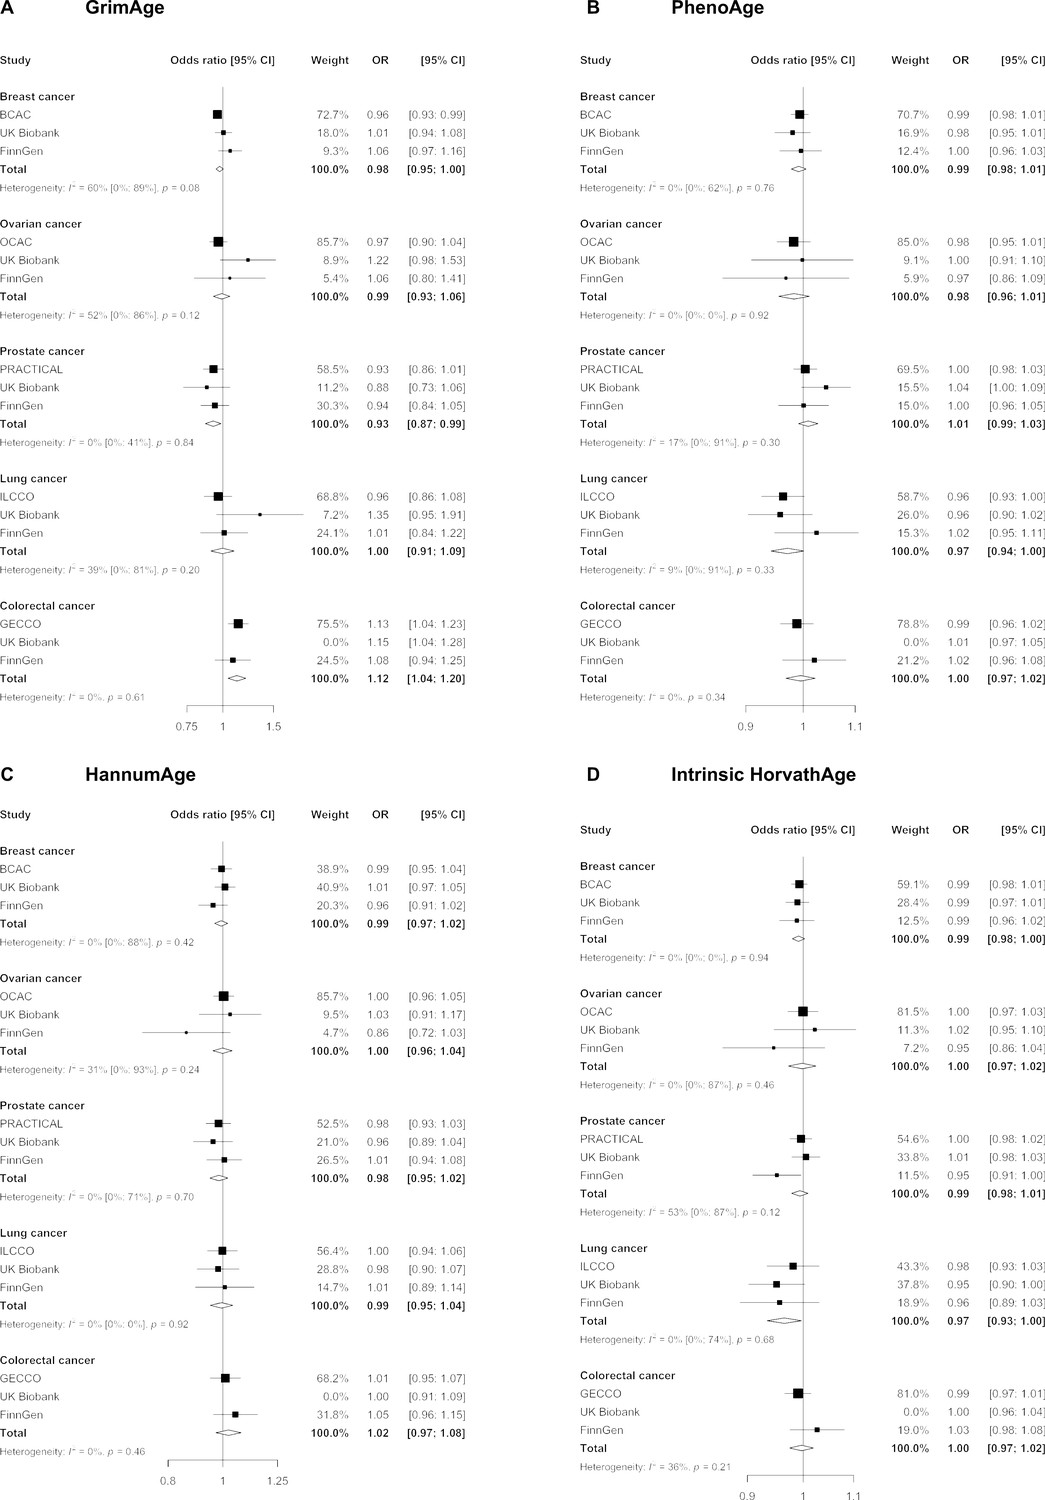
Fixed effect meta-analysis of inverse-variance weighted Mendelian randomization estimates for genetically predicted effects of epigenetic age acceleration on multiple cancers.
Odds ratios and 95% confidence intervals are reported per 1 year increase in (A) GrimAge acceleration, (B) PhenoAge acceleration, (C) HannumAge acceleration and (D) Intrinsic HorvathAge acceleration. GrimAge, PhenoAge, HannumAge and Intrinsic HorvathAge acceleration were instrumented by 4, 11, 9, and 24 genetic variants, respectively. All meta-analysis estimates were calculated using data from UK Biobank, FinnGen and international consortia, except for colorectal cancer estimates, which exclude UK Biobank data to avoid double counting.
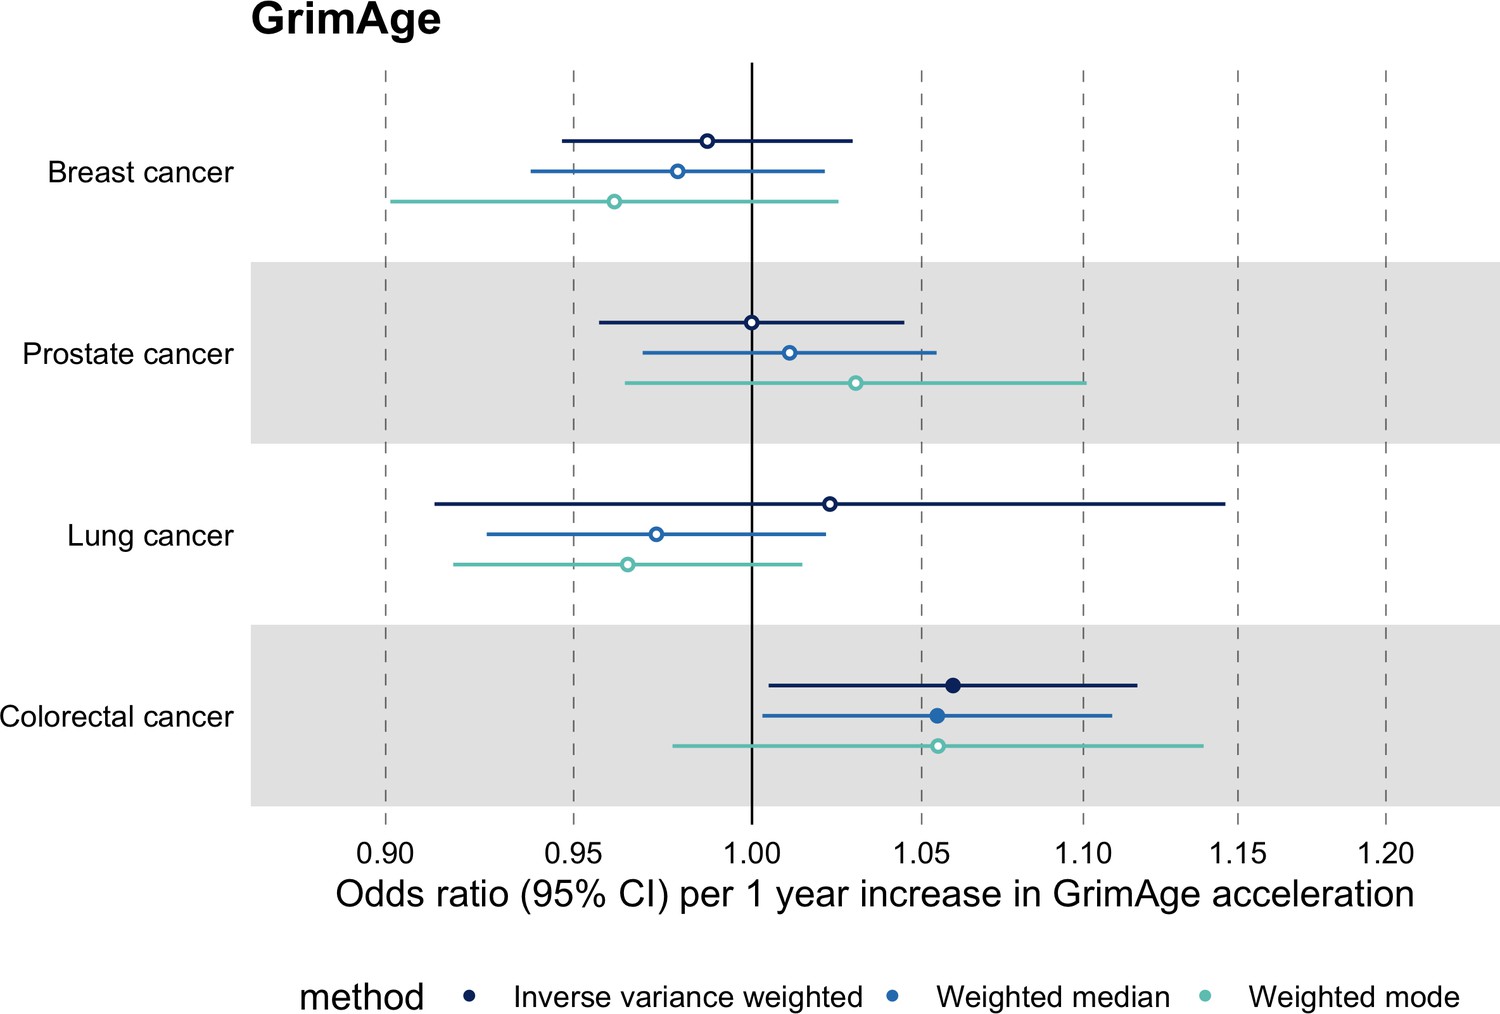
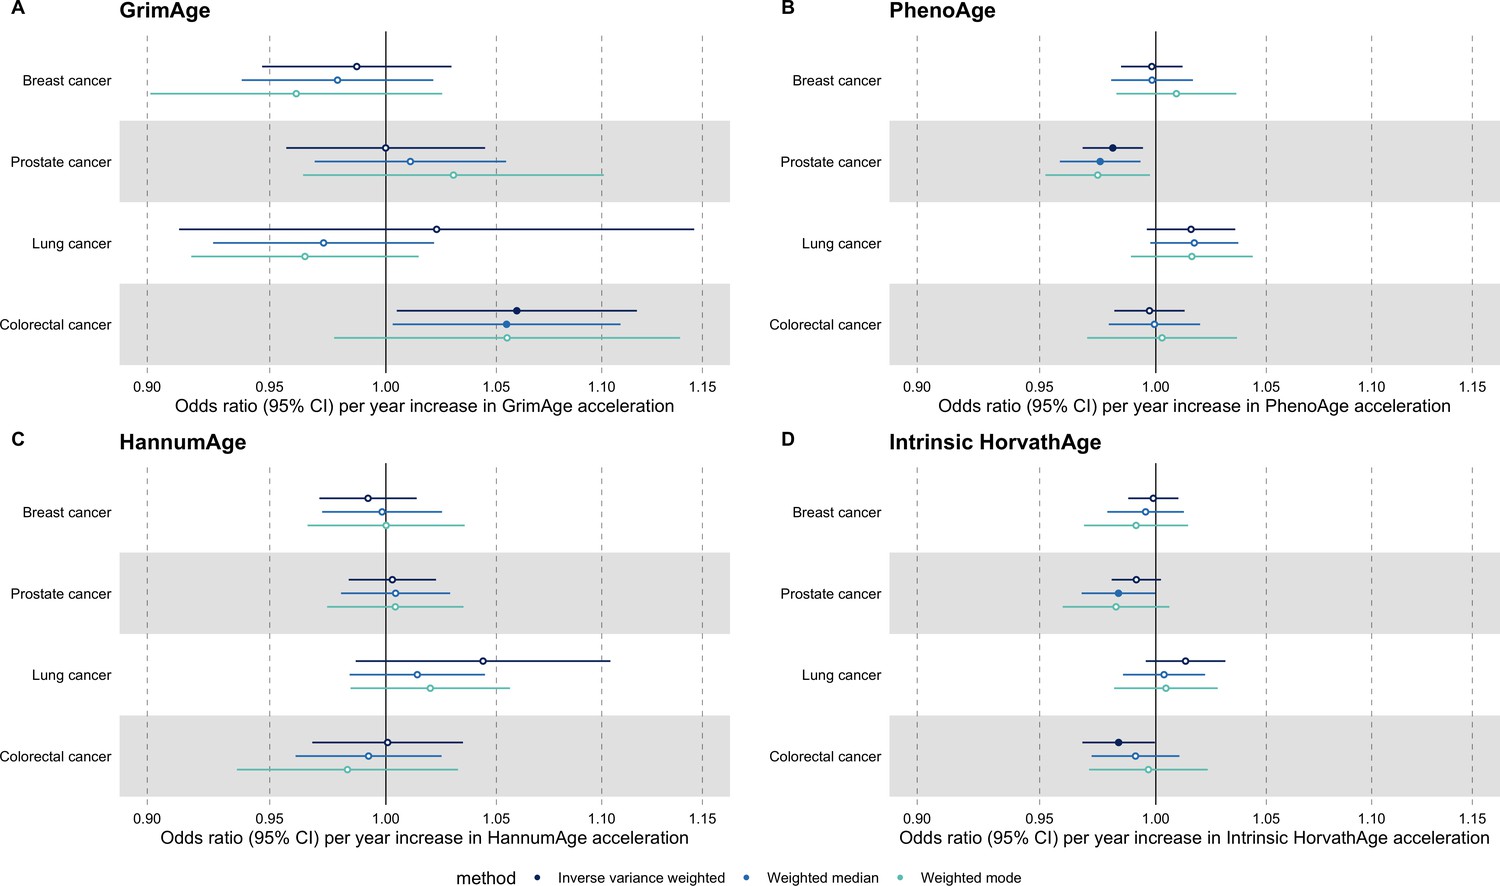
Figure 3
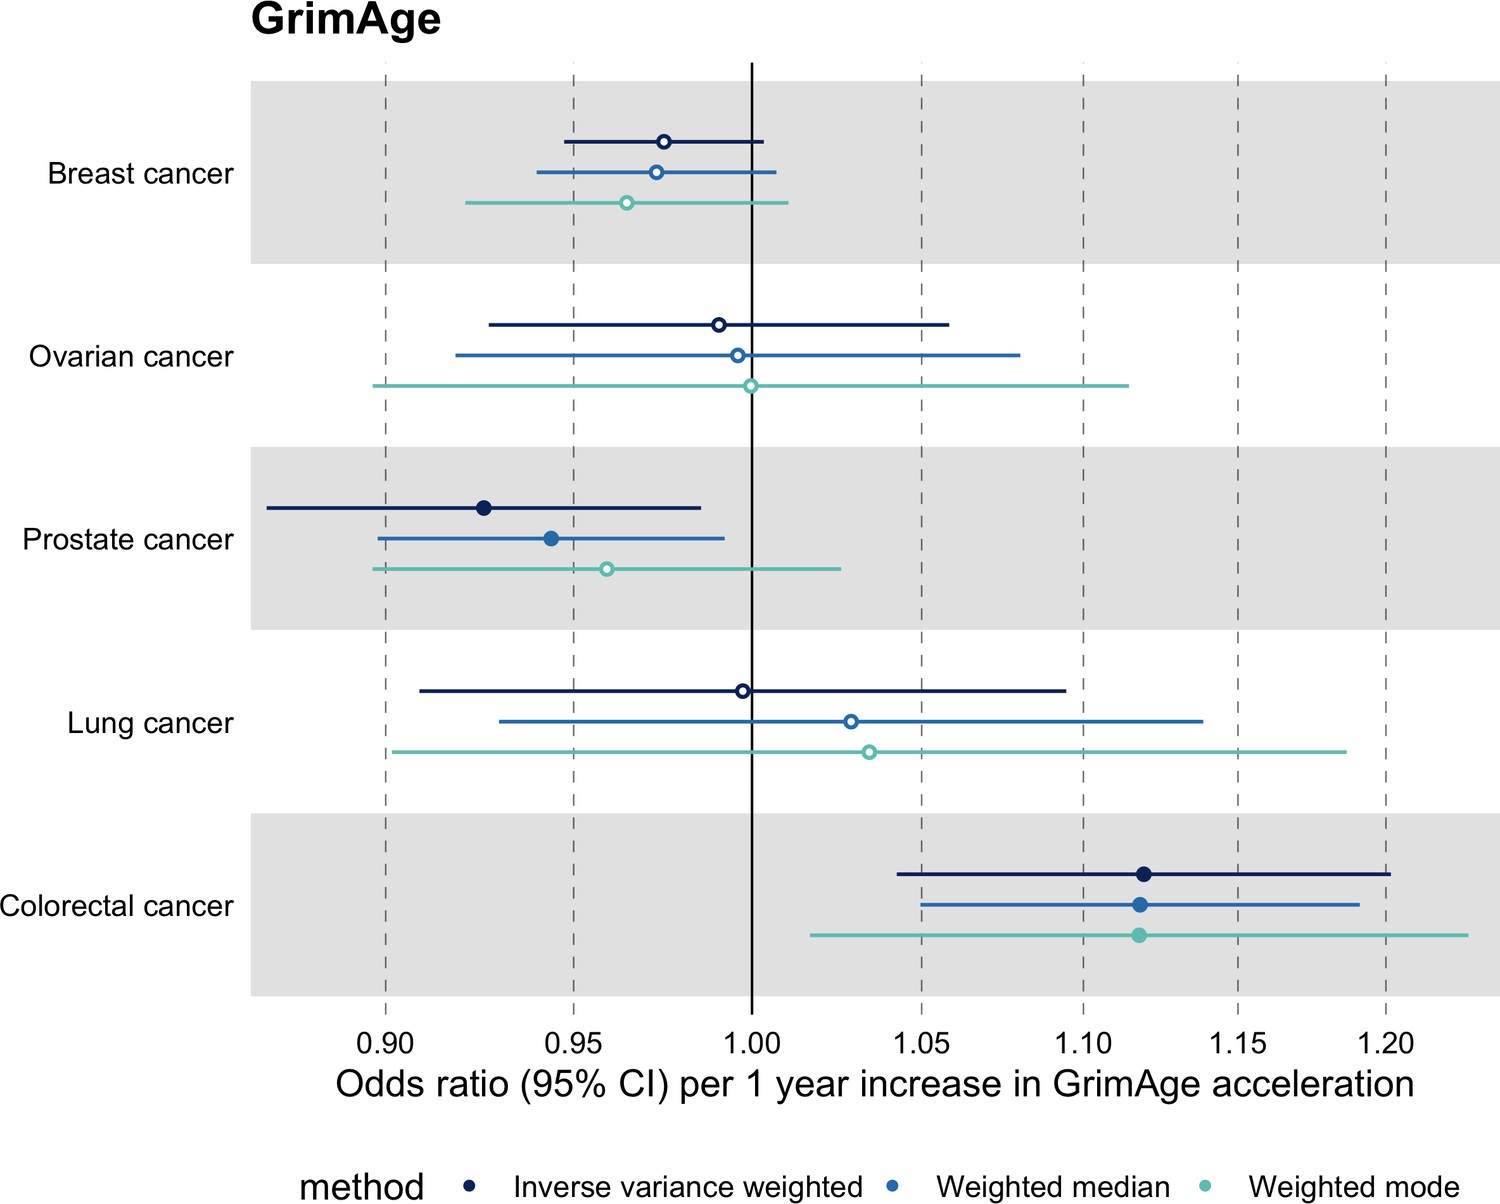
Fixed effect meta-analysis of Mendelian randomization estimates for genetically predicted effects of GrimAge acceleration on multiple cancers.
Odds ratios and 95% confidence intervals are reported per 1 year increase in GrimAge acceleration. GrimAge acceleration was instrumented by four genetic variants. Results were obtained using inverse variance weighted MR (dark blue), weighted median (sky blue) and weighted mode (turquoise) methods. All meta-analysis estimates were calculated using data from UK Biobank, FinnGen and international consortia, except for colorectal cancer estimates, which exclude UK Biobank data to avoid double counting.
Figure 4

Scatter plot showing the effect of genetic instruments on GrimAge acceleration against their effect on colorectal cancer.
FinnGen and Genetics and Epidemiology of Colorectal Cancer (GECCO) genome-wide association estimates for colorectal cancer were meta-analysed using the METAL software. UK Biobank estimates were not included in the meta-analysis to avoid double counting participants included in the GECCO consortium. Results were obtained using inverse variance weighted MR (light blue), weighted median (dark blue) and weighted mode (light green) methods.
Figure 5
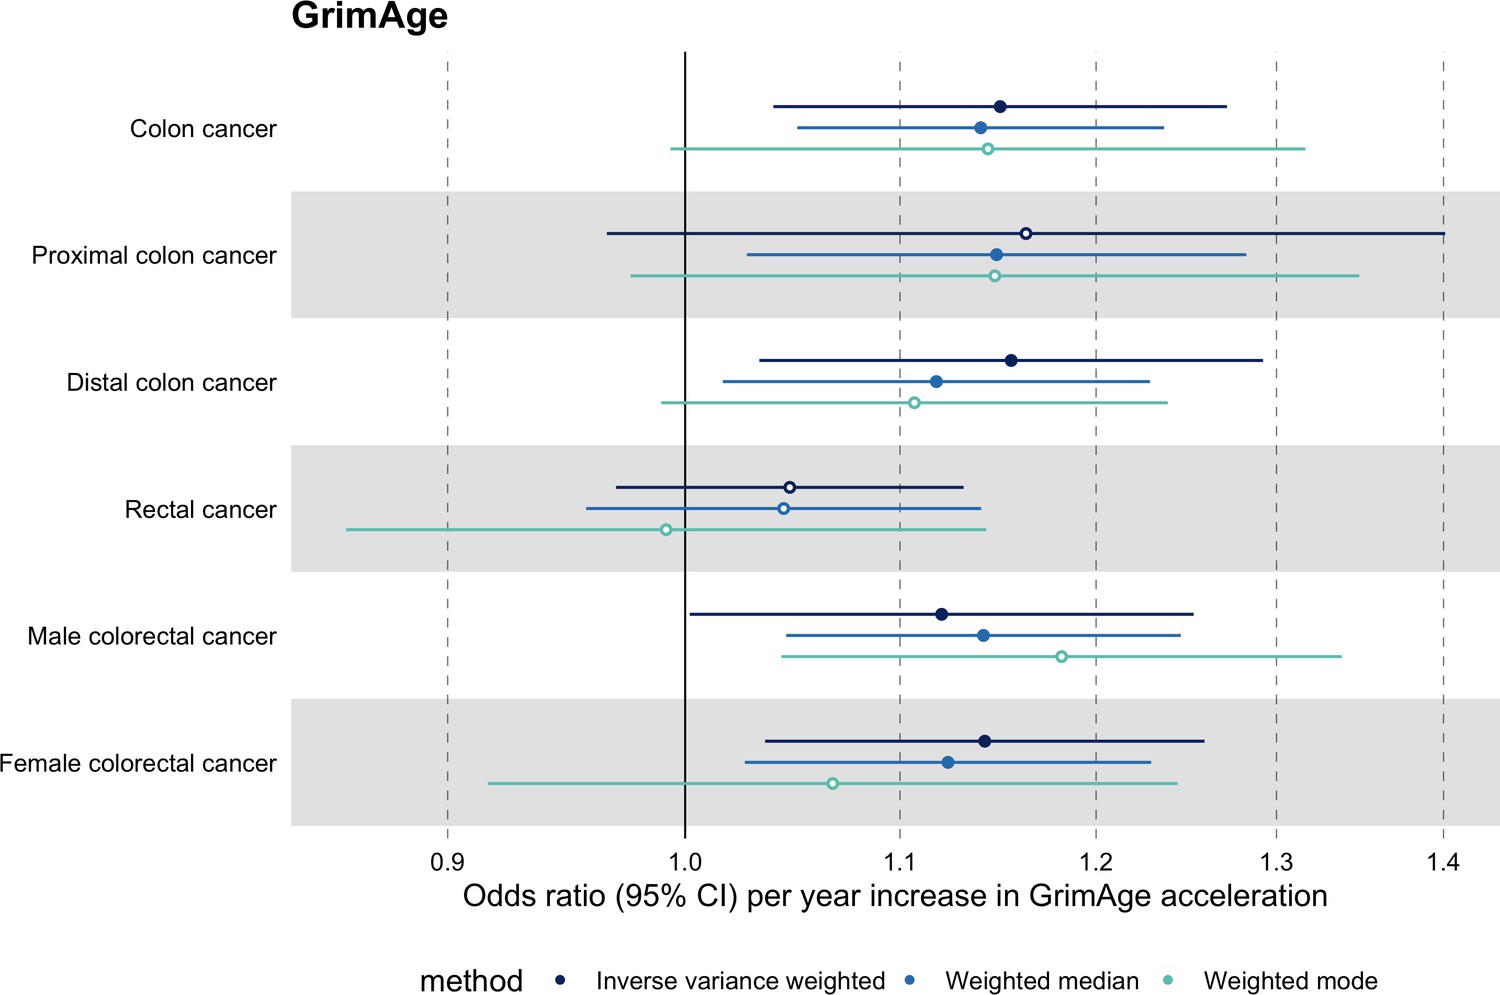
Mendelian randomization estimates for genetically predicted effects of GrimAge acceleration on colorectal cancer subtypes.
Odds ratios and 95% confidence intervals are reported per 1 year increase in GrimAge acceleration. GrimAge acceleration was instrumented by four genetic variants. Results were obtained using inverse variance weighted MR (dark blue), weighted median (sky blue) and weighted mode (turquoise) methods. Data source: GECCO.
Figure 6
Mendelian randomization estimates for genetically predicted effects of GrimAge acceleration on parental history of multiple cancers.
Odds ratios and 95% confidence intervals are reported per 1 year increase in GrimAge acceleration. GrimAge acceleration was instrumented by four genetic variants. Results were obtained using inverse variance weighted MR (dark blue), weighted median (sky blue) and weighted mode (turquoise) methods. Data source: UK Biobank.
Appendix 2—figure 1
Fixed effect meta-analysis of Mendelian randomization estimates for genetically predicted effects of epigenetic age acceleration on multiple cancers.
Odds ratios and 95% confidence intervals are reported per 1 year increase in (A) GrimAge acceleration, (B) PhenoAge acceleration, (C) HannumAge acceleration and (D) Intrinsic HorvathAge acceleration. Results were obtained using inverse variance weighted MR (dark blue), weighted median (sky blue) and weighted mode (turquoise) methods. All meta-analysis estimates were calculated using data from UK Biobank, FinnGen and international consortia, except for colorectal cancer estimates, which exclude UK Biobank data to avoid double counting.
Appendix 2—figure 2
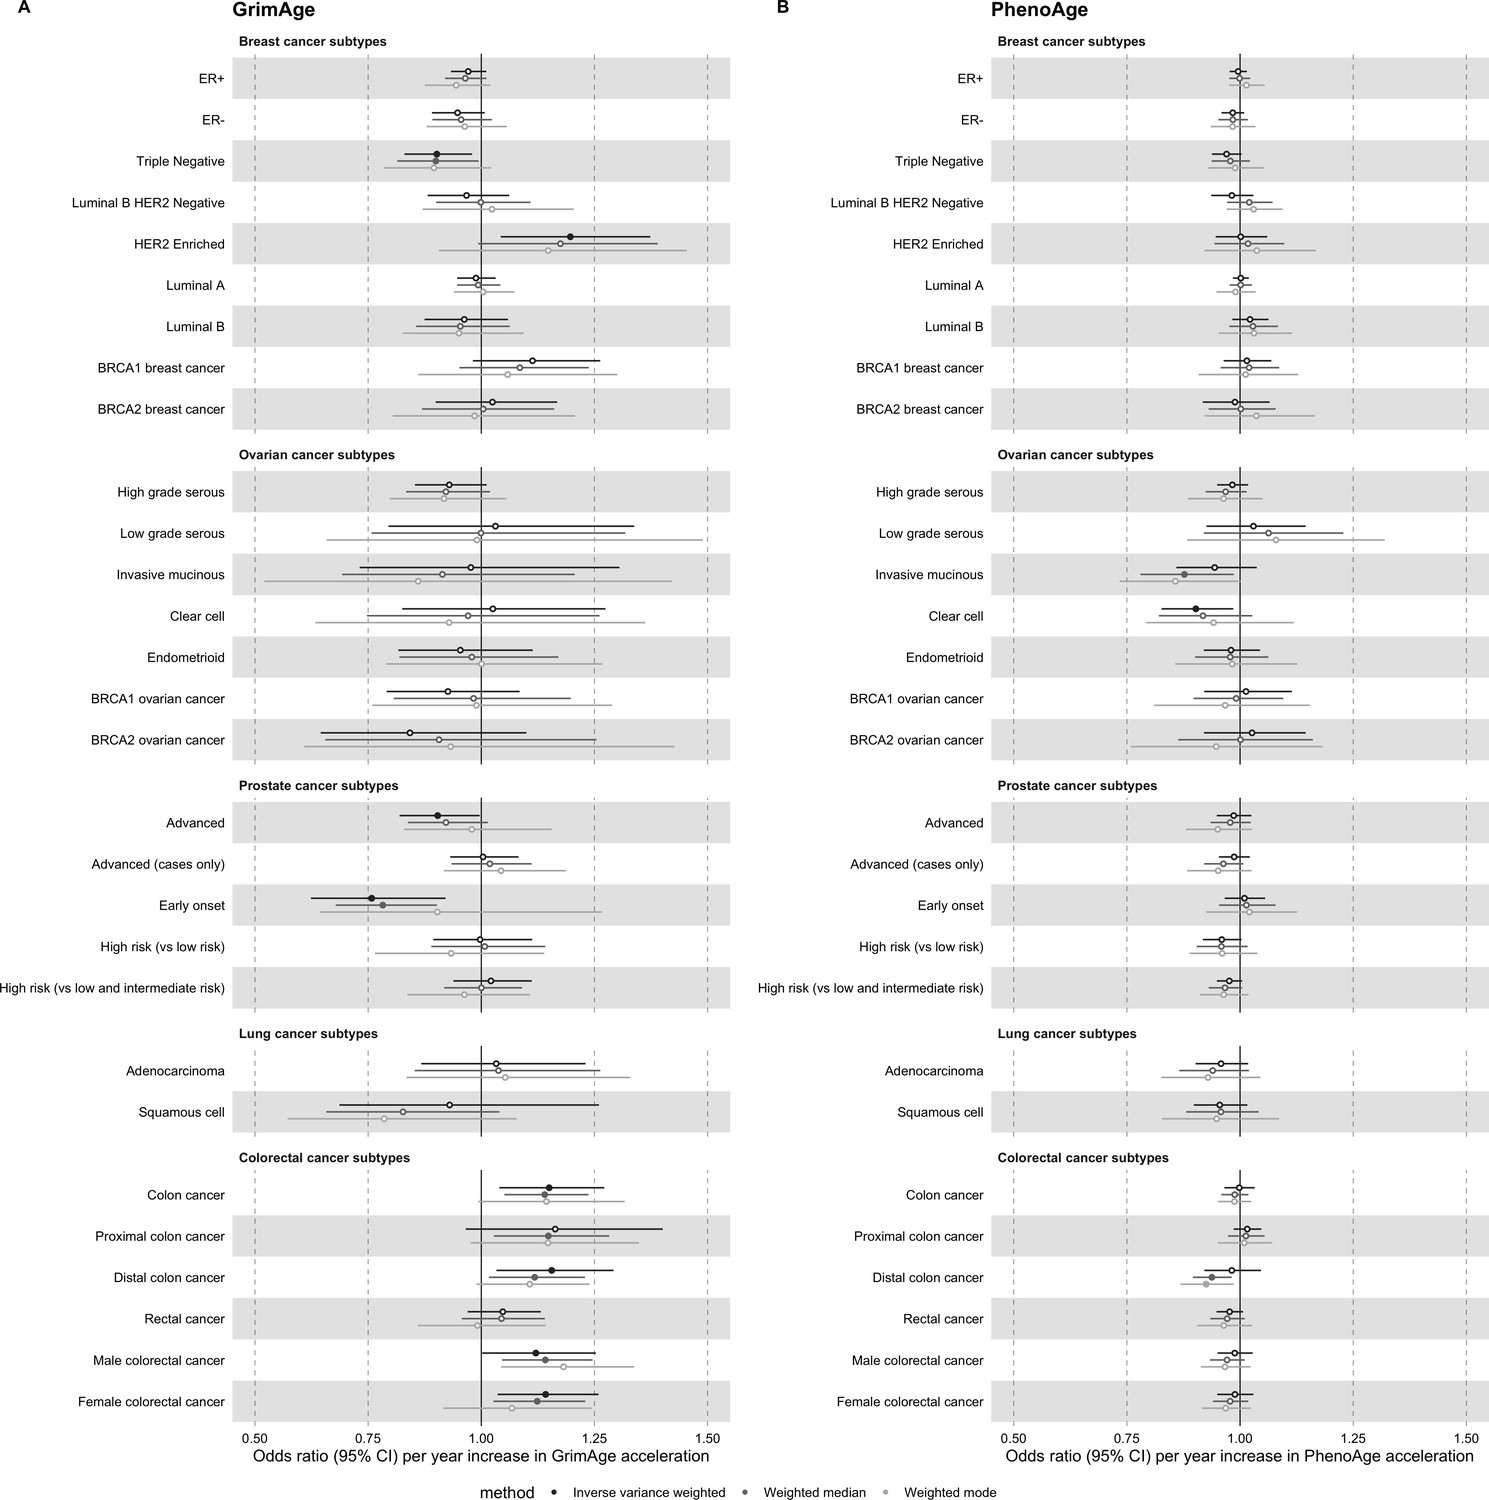
Mendelian randomization estimates for genetically predicted effects of GrimAge and PhenoAge acceleration on multiple cancer subtypes.
Odds ratios and 95% confidence intervals are reported per 1 year increase in (A) GrimAge acceleration, (B) PhenoAge acceleration. GrimAge and PhenoAge acceleration were instrumented by four and 11 genetic variants, respectively. Results were obtained using inverse variance weighted MR (dark blue), weighted median (sky blue) and weighted mode (turquoise) methods. Data sources: BCAC, OCAC, CIMBA, PRACTICAL, ILCCO and GECCO.
Appendix 2—figure 3
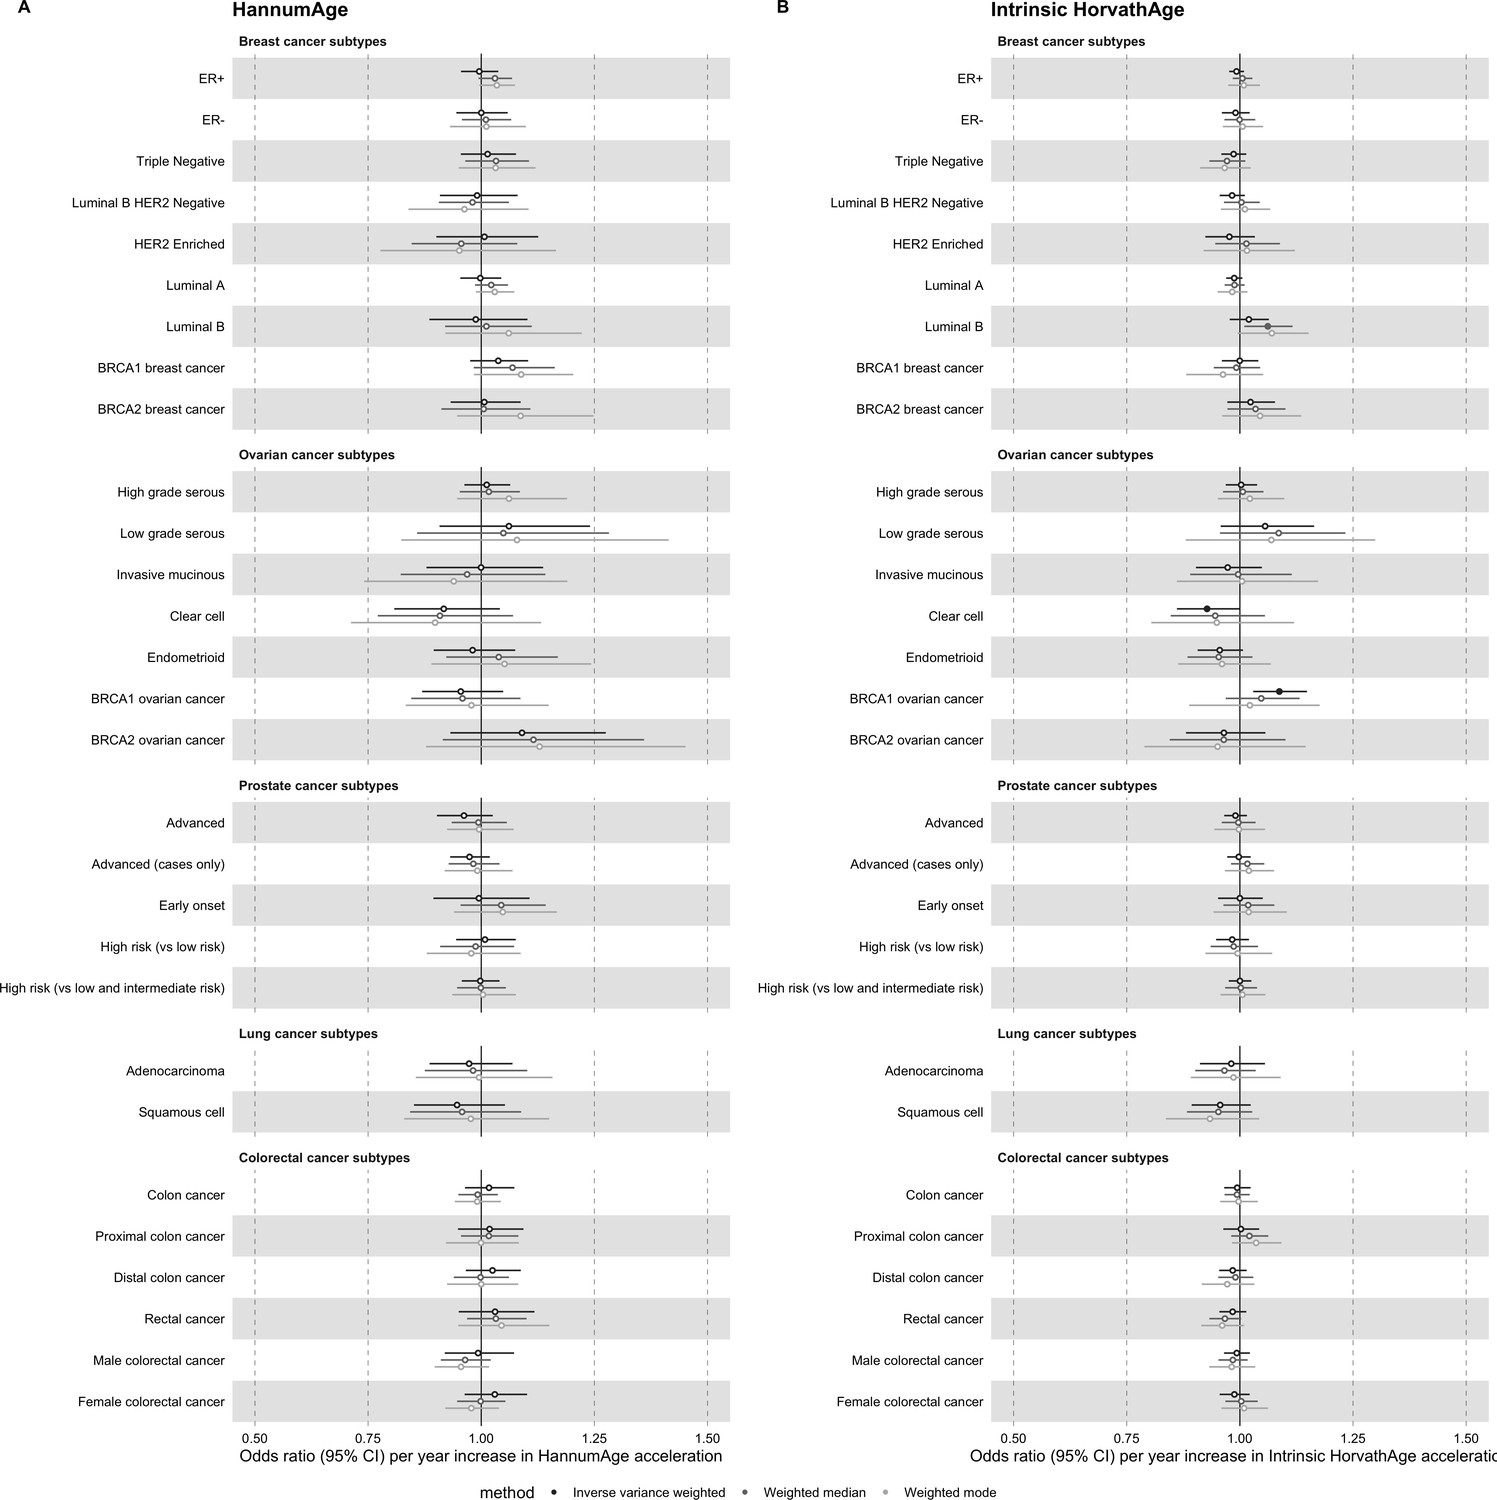
Mendelian randomization estimates for genetically predicted effects of HannumAge and Intrinsic HorvathAge acceleration on multiple cancer subtypes.
Odds ratios and 95% confidence intervals are reported per 1 year increase in (A) HannumAge acceleration, (B) Intrinsic HorvathAge acceleration. HannumAge and Intrinsic HorvathAge acceleration were instrumented by nine and 24 genetic variants, respectively. Results were obtained using inverse variance weighted MR (dark blue), weighted median (sky blue) and weighted mode (turquoise) methods. Data sources: BCAC, OCAC, CIMBA, PRACTICAL, ILCCO and GECCO.
Appendix 2—figure 4
Mendelian randomization estimates for genetically predicted effects of epigenetic age acceleration on parental history of multiple cancers.
Odds ratios and 95% confidence intervals are reported per 1 year increase in (A) GrimAge acceleration, (B) PhenoAge acceleration, (C) HannumAge acceleration and (D) Intrinsic HorvathAge acceleration. GrimAge, PhenoAge, HannumAge and Intrinsic HorvathAge acceleration were instrumented by 4, 11, 9 and 24 genetic variants, respectively. Results were obtained using inverse variance weighted MR (dark blue), weighted median (sky blue) and weighted mode (turquoise) methods. Data source: UK Biobank.
Appendix 2—figure 5
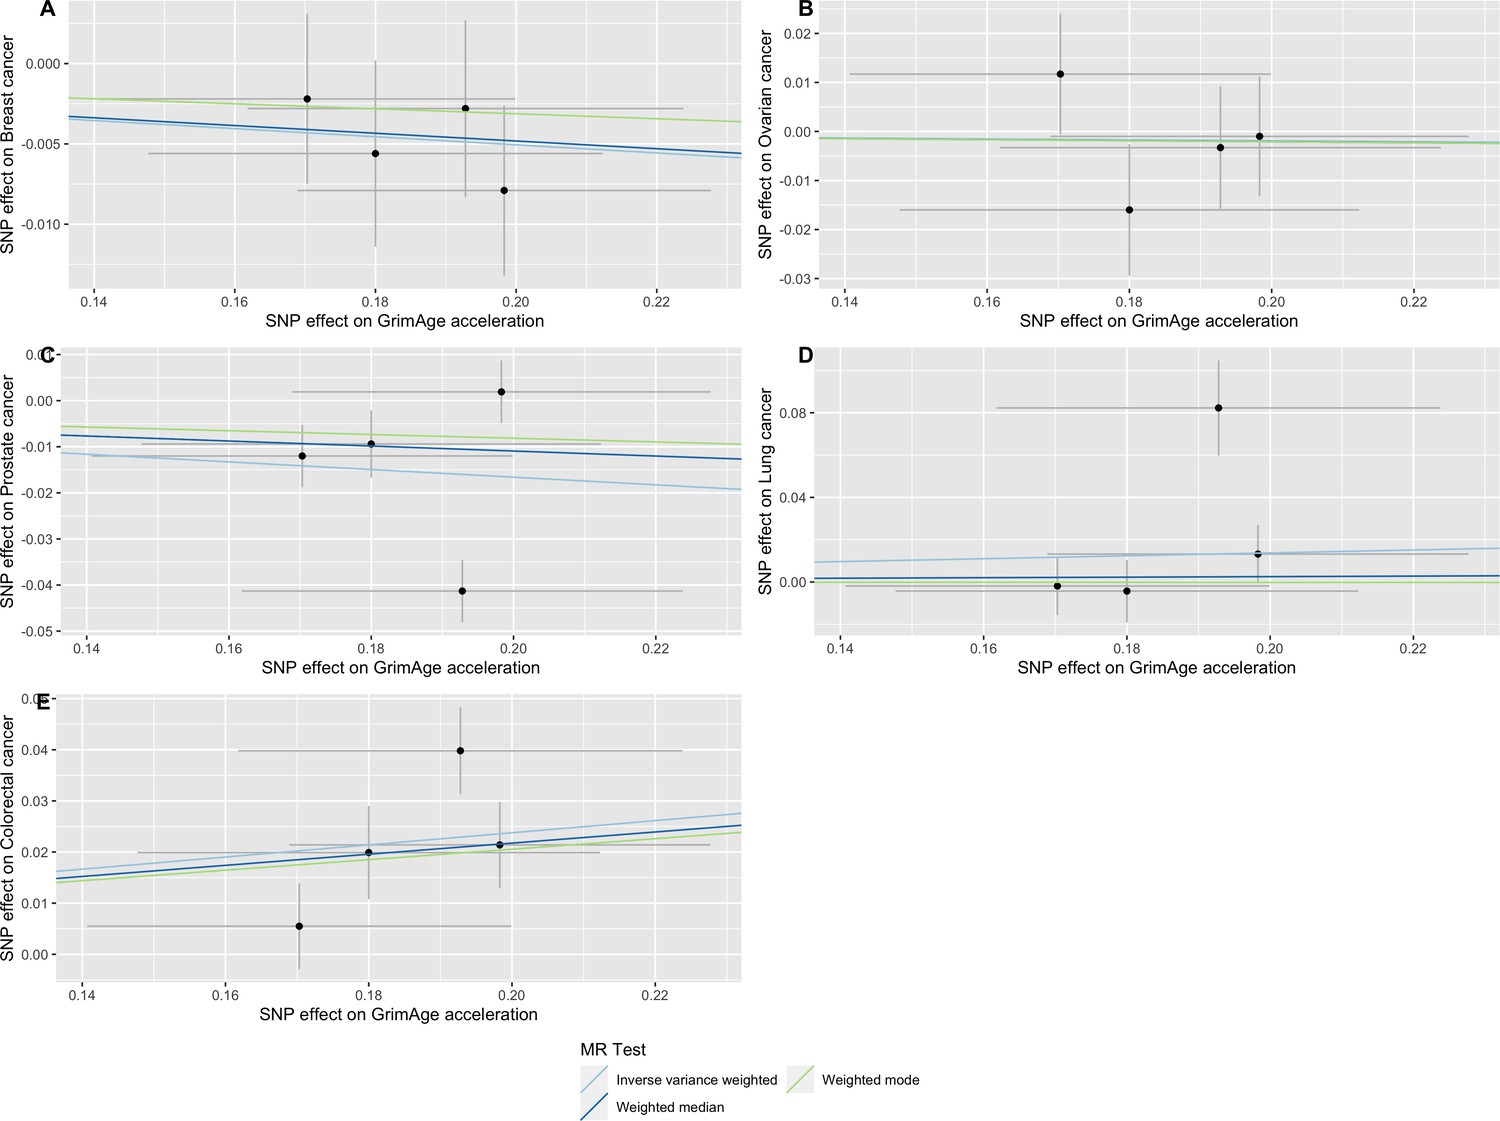
Scatter plot showing the effect of genetic instruments on GrimAge acceleration against their effect on multiple cancer.
Genome-wide association estimates for (A) breast, (B) ovarian, (C) prostate, (D) lung and (E) colorectal cancer were meta-analysed using the METAL software. Results were obtained using inverse variance weighted MR (light blue), weighted median (dark blue) and weighted mode (light green) methods. Data sources: UK Biobank, FinnGen and international cancer genetic consortia. For colorectal cancer, UK Biobank estimates were not included in the meta-analysis to avoid double counting participants included in the GECCO consortium.
Appendix 2—figure 6
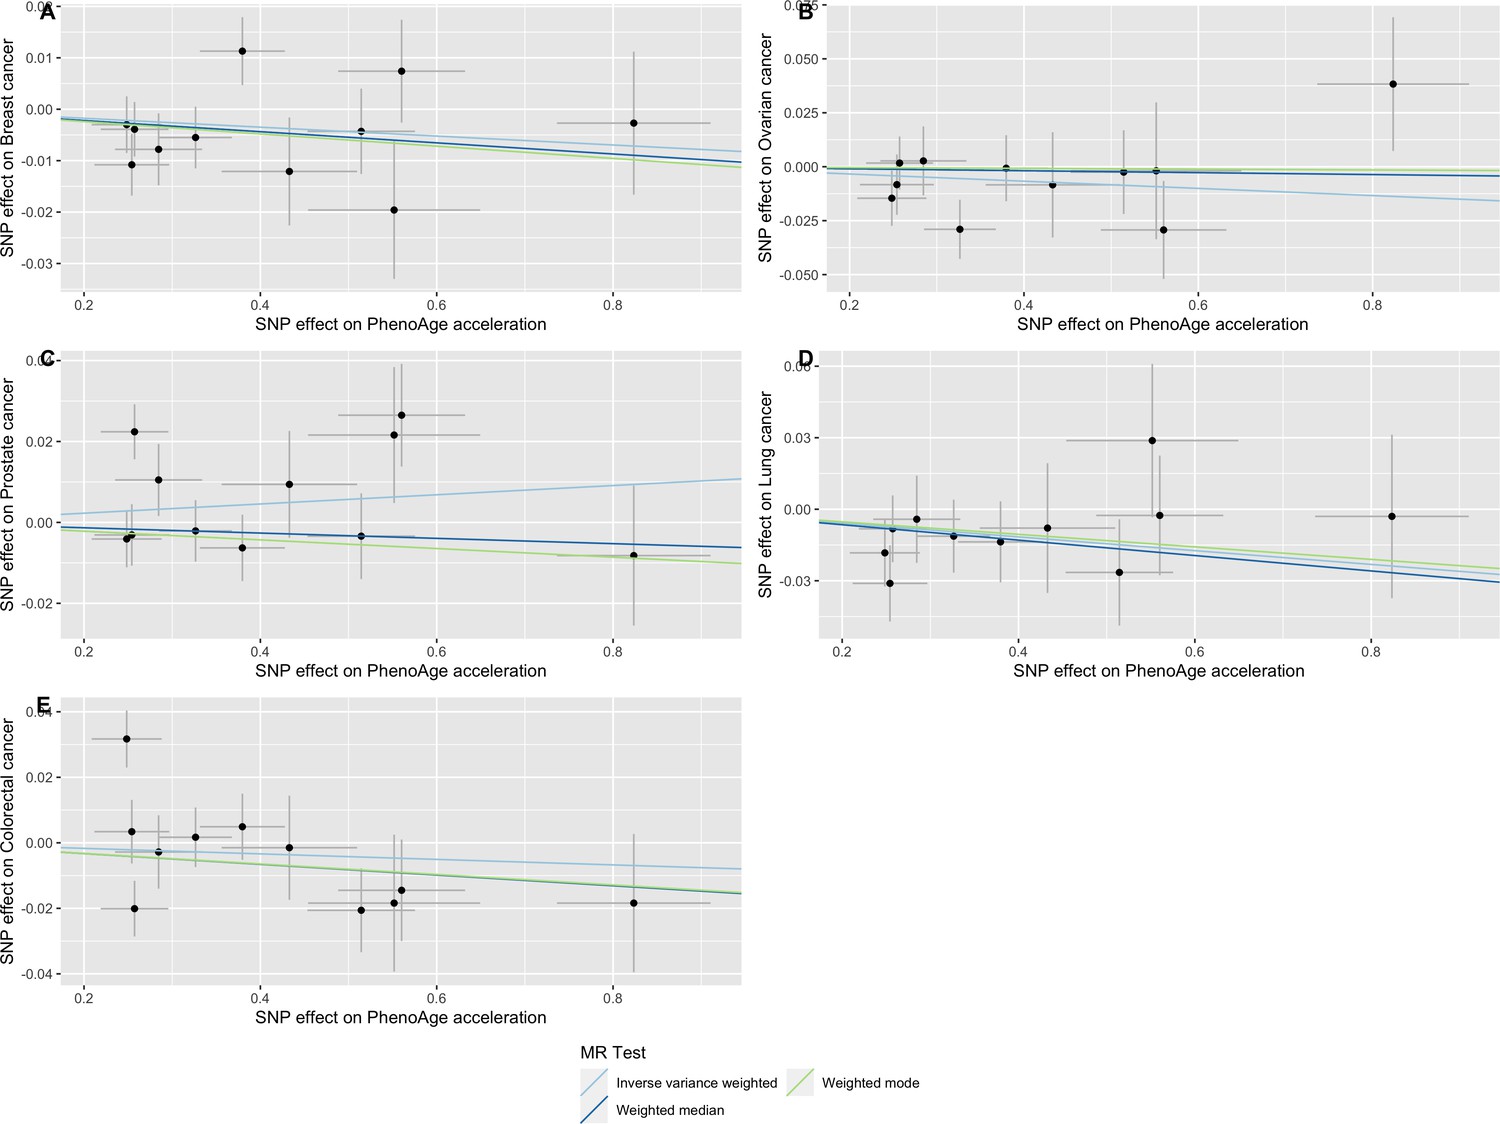
Scatter plot showing the effect of genetic instruments on PhenoAge acceleration against their effect on multiple cancer.
Genome-wide association estimates for (A) breast, (B) ovarian, (C) prostate, (D) lung and (E) colorectal cancer were meta-analysed using the METAL software. Results were obtained using inverse variance weighted MR (light blue), weighted median (dark blue) and weighted mode (light green) methods. Data sources: UK Biobank, FinnGen and international cancer genetic consortia. For colorectal cancer, UK Biobank estimates were not included in the meta-analysis to avoid double counting participants included in the GECCO consortium.
Appendix 2—figure 7
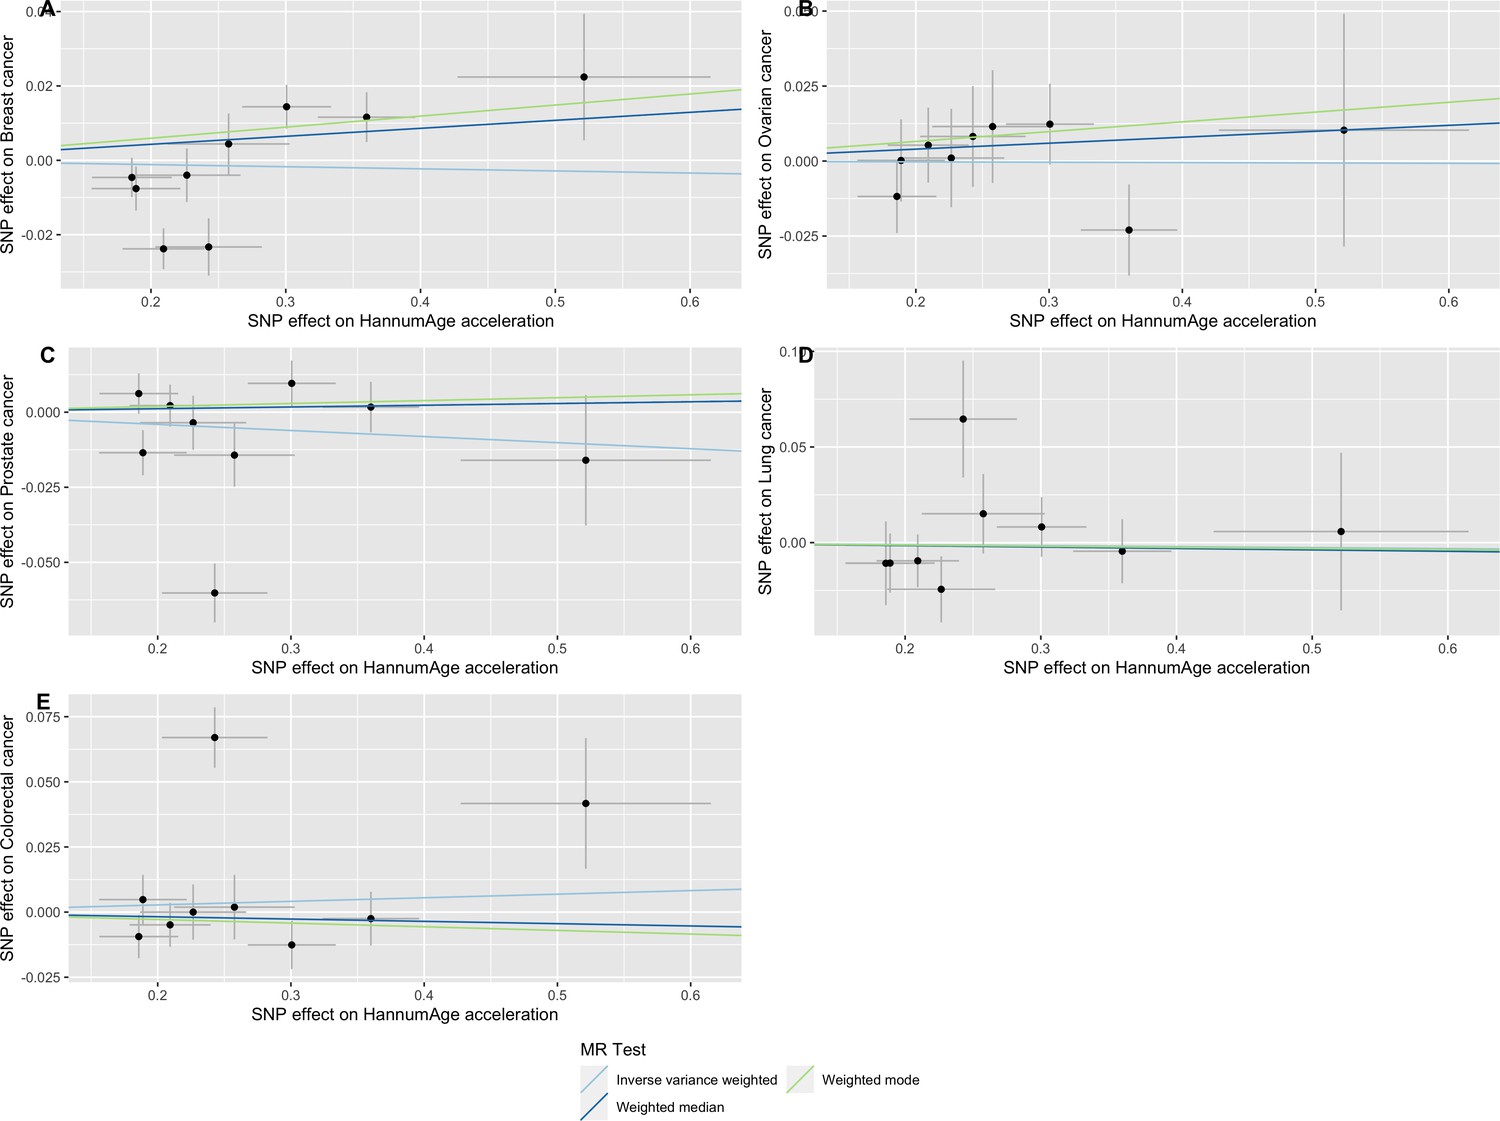
Scatter plot showing the effect of genetic instruments on HannumAge acceleration against their effect on multiple cancer.
Genome-wide association estimates for (A) breast, (B) ovarian, (C) prostate, (D) lung and (E) colorectal cancer were meta-analysed using the METAL software. Results were obtained using inverse variance weighted MR (light blue), weighted median (dark blue) and weighted mode (light green) methods. Data sources: UK Biobank, FinnGen and international cancer genetic consortia. For colorectal cancer, UK Biobank estimates were not included in the meta-analysis to avoid double counting participants included in the GECCO consortium.
Appendix 2—figure 8
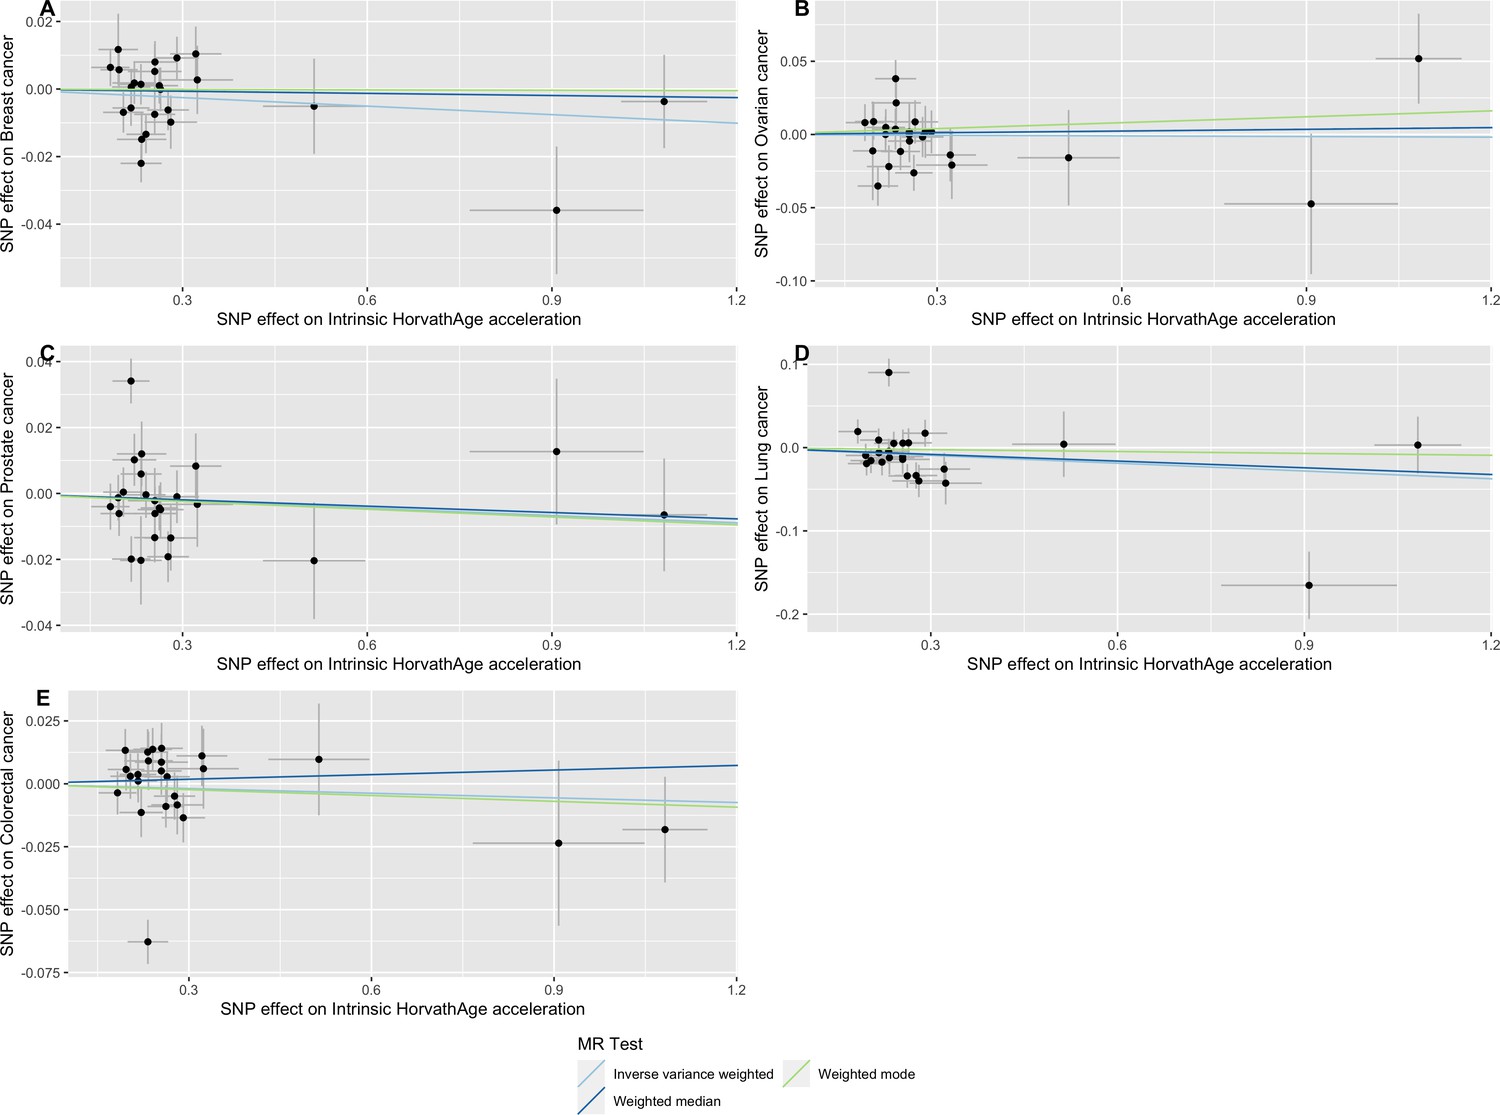
Scatter plot showing the effect of genetic instruments on Intrinsic HorvathAge acceleration against their effect on multiple cancer.
Genome-wide association estimates for (A) breast, (B) ovarian, (C) prostate, (D) lung and (E) colorectal cancer were meta-analysed using the METAL software. Results were obtained using inverse variance weighted MR (light blue), weighted median (dark blue) and weighted mode (light green) methods. Data sources: UK Biobank, FinnGen and international cancer genetic consortia. For colorectal cancer, UK Biobank estimates were not included in the meta-analysis to avoid double counting participants included in the GECCO consortium.
Appendix 2—figure 9
Mendelian randomization estimates for genetically predicted effects of GrimAge acceleration on negative control outcomes.
Odds ratios and 95% confidence intervals are reported per 1 year increase in GrimAge acceleration. GrimAge was instrumented by four genetic variants. Results were obtained using inverse variance weighted MR (dark blue), weighted median (sky blue) and weighted mode (turquoise) methods. Data source: UK Biobank.
Appendix 2—figure 10
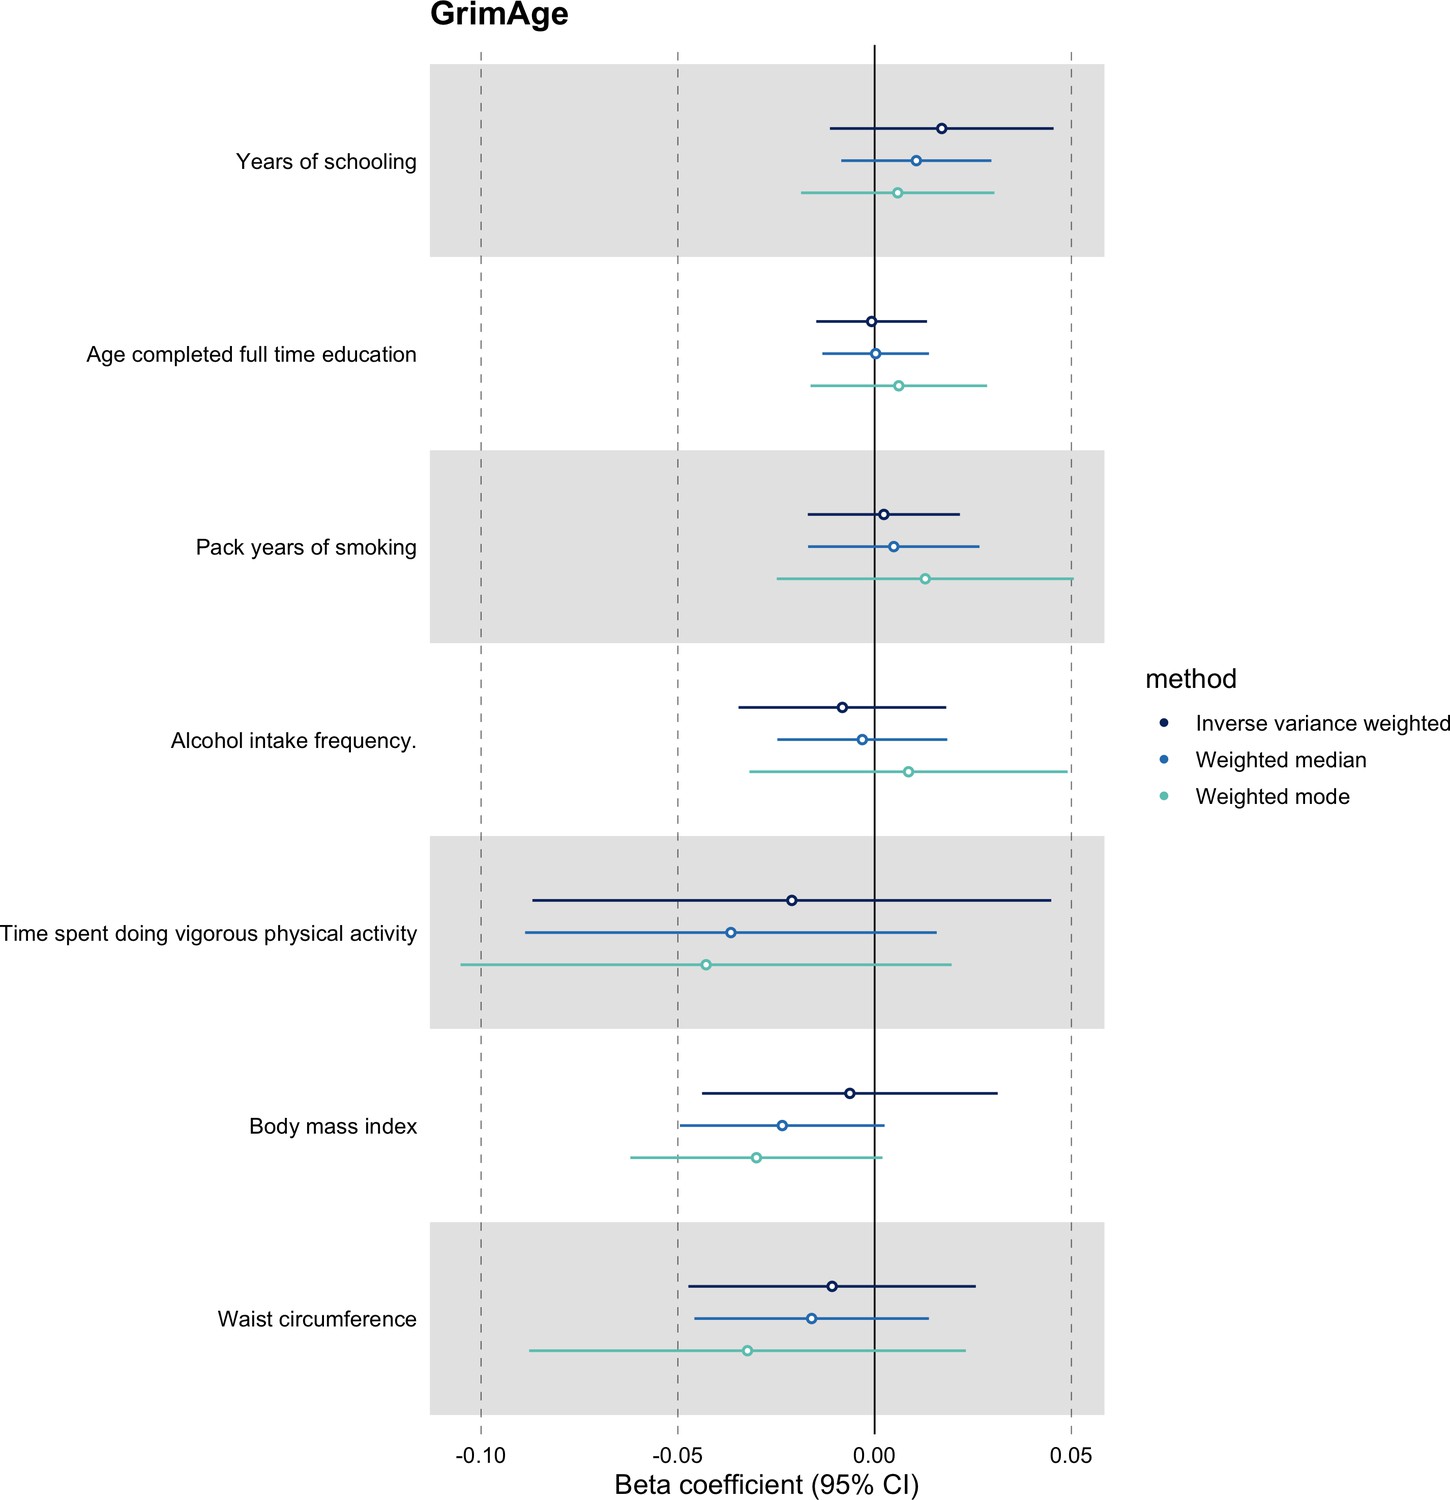
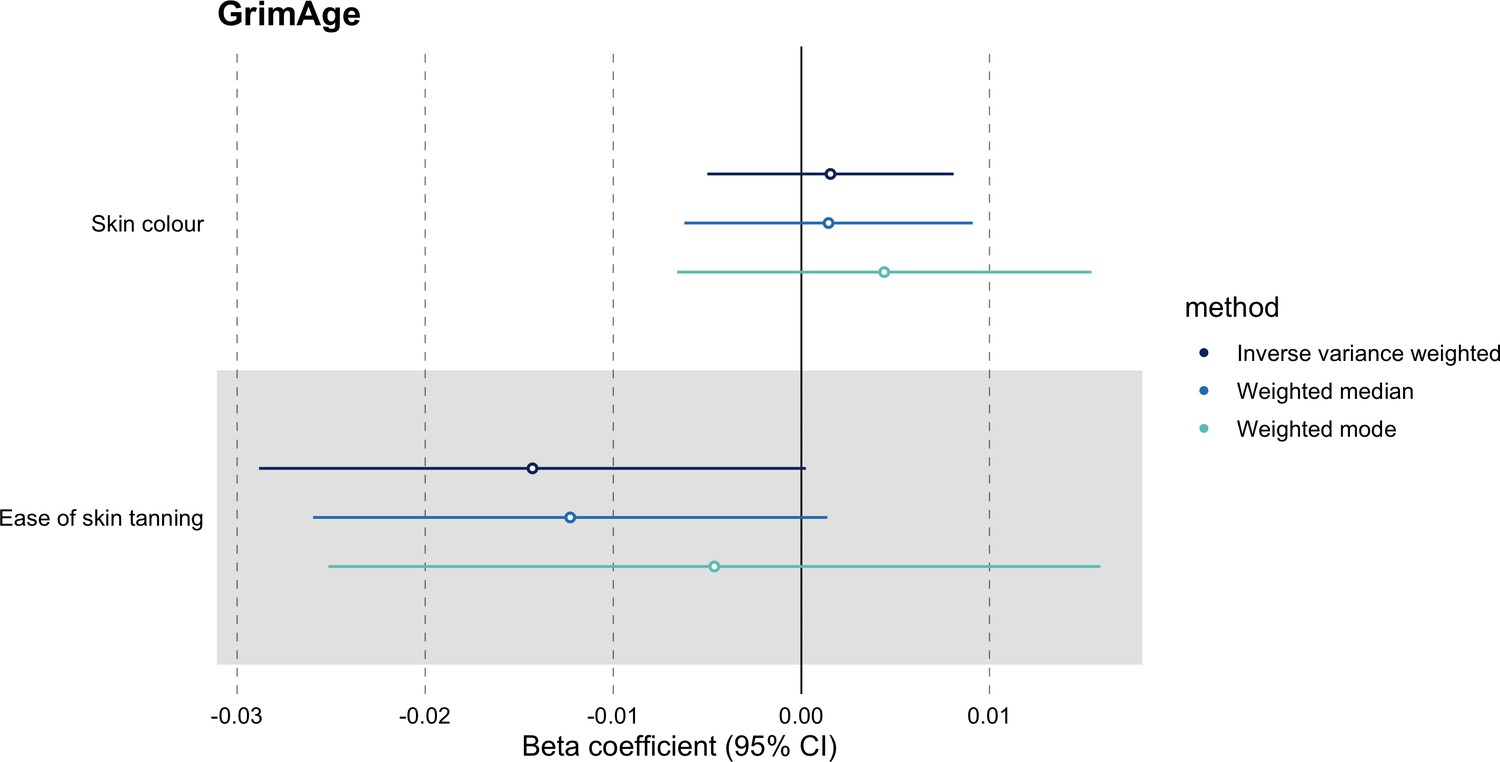
Mendelian randomization estimates for genetically predicted effects of GrimAge acceleration on potential confounders of the association between GrimAge acceleration and colorectal cancer.
Odds ratios and 95% confidence intervals are reported per 1 year increase in GrimAge acceleration. GrimAge was instrumented by four genetic variants. Results were obtained using inverse variance weighted MR (dark blue), weighted median (sky blue) and weighted mode (turquoise) methods. Data sources: UK Biobank (for time spent doing vigorous physical activity, pack years of smoking, alcohol intake frequency and age completed full time education), GIANT consortium (for waist circumference and body mass index) and the SSAGC consortium (for years of schooling).
Appendix 2—figure 11
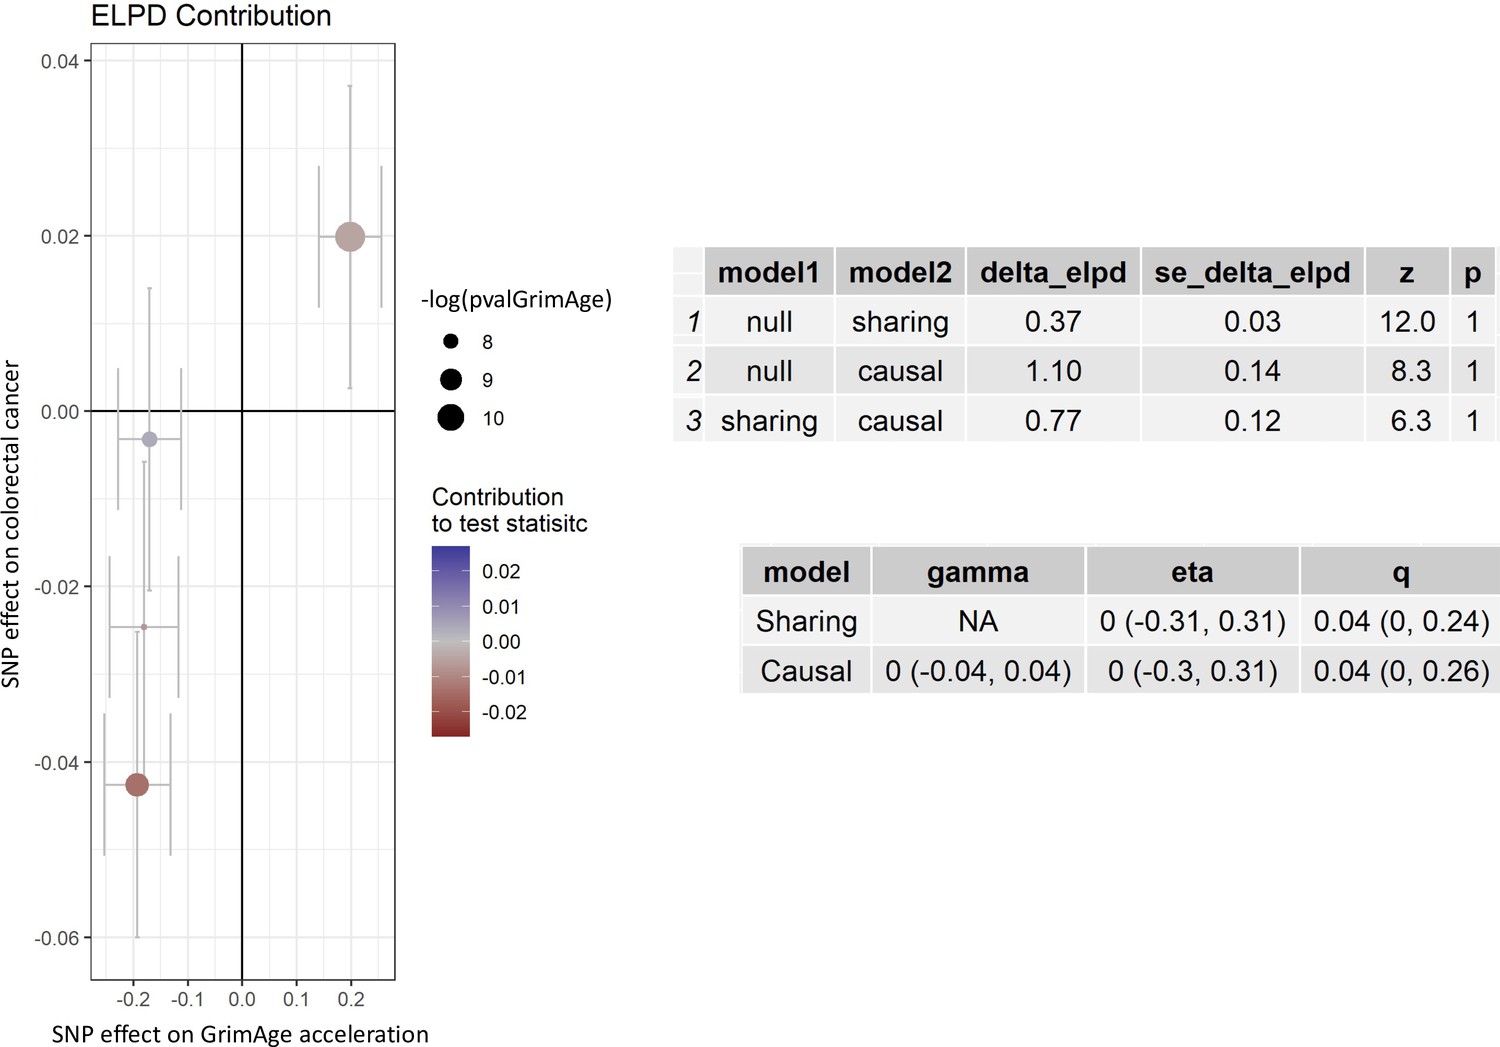
CAUSE analysis for the genetically predicted effect of GrimAge acceleration on colorectal cancer in GECCO.
CAUSE estimates for colorectal cancer reported per 1 year increase in GrimAge acceleration. The ELPD Contribution plot shows the relative contribution of each SNP to the CAUSE test statistic. Only SNPs with P < 5e-8 are shown. SNPs represented by larger circles reflect smaller p-values for the associations between genetic variants and GrimAge acceleration. SNPs that contribute more to the causal model are shown in warmer tones (i.e. red), while those that contribute more to the sharing model are shown in colder tones (i.e. blue). The delta_elpd is the statistic used to compare models. It is equal to elpd(model 1)- elpd(model 2). In the upper table, positive delta_elpd’s suggest that model one is a better fit to the data than model 2 (i.e. that the null model is better than the sharing model in row 1, that the null model is better than the causal model in row 2, and that the sharing model is better than the causal model in row 3). The corresponding p-values test whether model two is a better fit than model 1. Here, row three suggests that the causal model is not a better fit than the sharing model (the delta_elpd is positive and the p-value is 1, so there is no detectable evidence against the null hypothesis that the sharing model is better than the causal model). In the bottom table, eta represents the sharing factor effect (SNPs affect shared factor and shared factor simultaneously affects GrimAge and colorectal cancer) and gamma represents the causal factor effect (SNPs affect GrimAge and GrimAge affects colorectal cancer). Here, “0 (-0.04, 0.04)” represents the genetically predicted effect of GrimAge acceleration on colorectal cancer after adjusting for correlated and uncorrelated horizontal pleiotropy (results in log odds ratio scale). The intervals shown are credible intervals. Data source: GECCO, Genetics and Epidemiology of Colorectal Cancer Consortium.
Appendix 2—figure 12
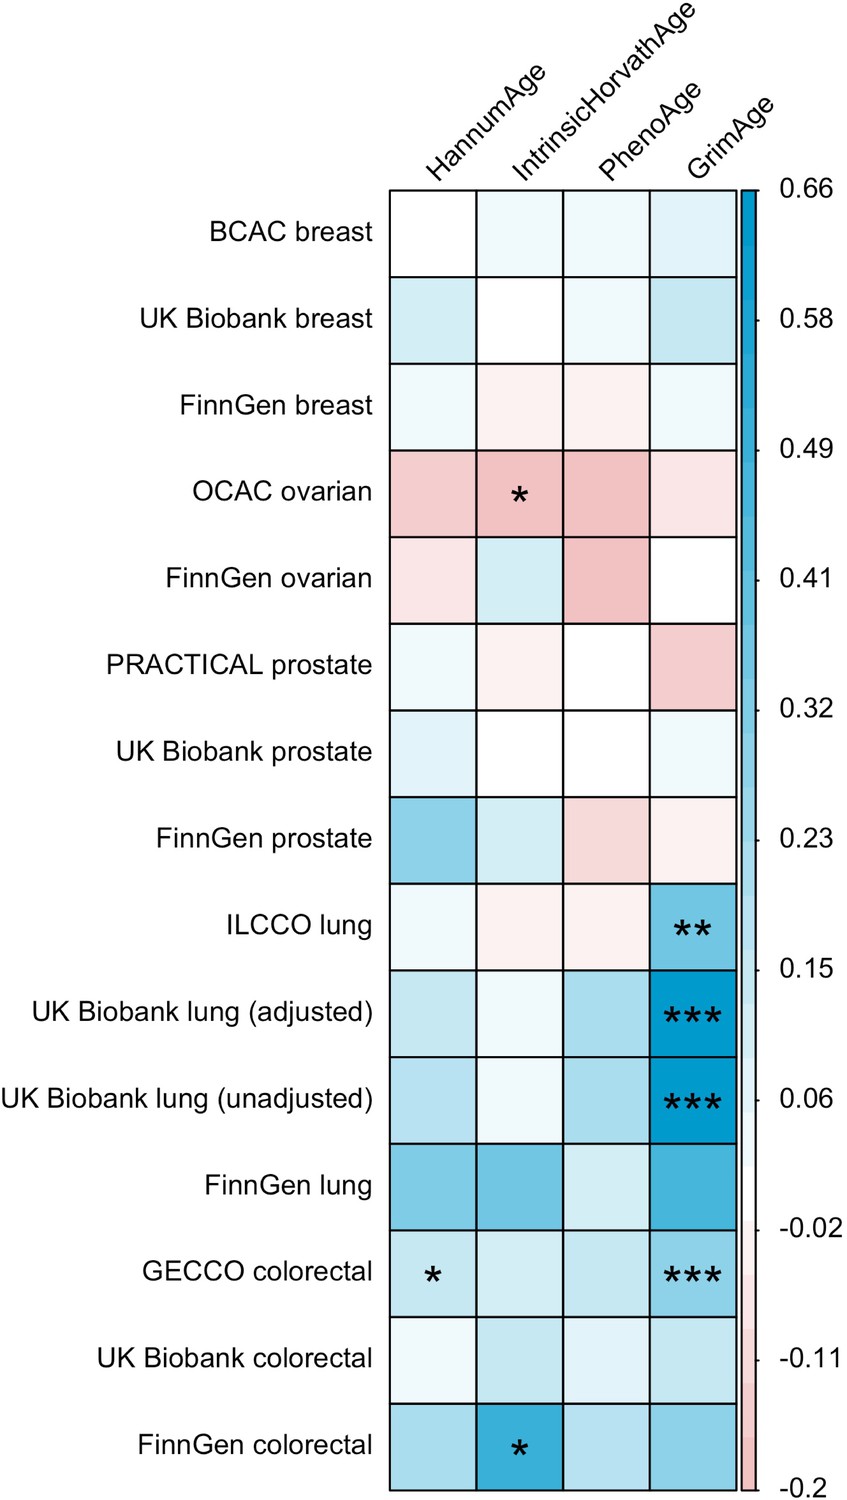
Genetic correlation estimates for epigenetic age acceleration and multiple cancers.
Genetic correlation coefficients are reported per 1 year increase in epigenetic age acceleration. Results were obtained using LD Score regression. Abbreviations: BCAC, Breast Cancer Association Consortium; OCAC, Ovarian Cancer Association Consortium; PRACTICAL, Prostate Cancer Association Group to Investigate Cancer Associated Alterations in the Genome; ILCCO, International Lung Cancer Consortium; GECCO, Genetics and Epidemiology of Colorectal Cancer Consortium. For UK Biobank lung cancer results, adjusted means results have been adjusted for genotyping chip and unadjusted means results have not been adjusted for genotyping chip.
Appendix 2—figure 13
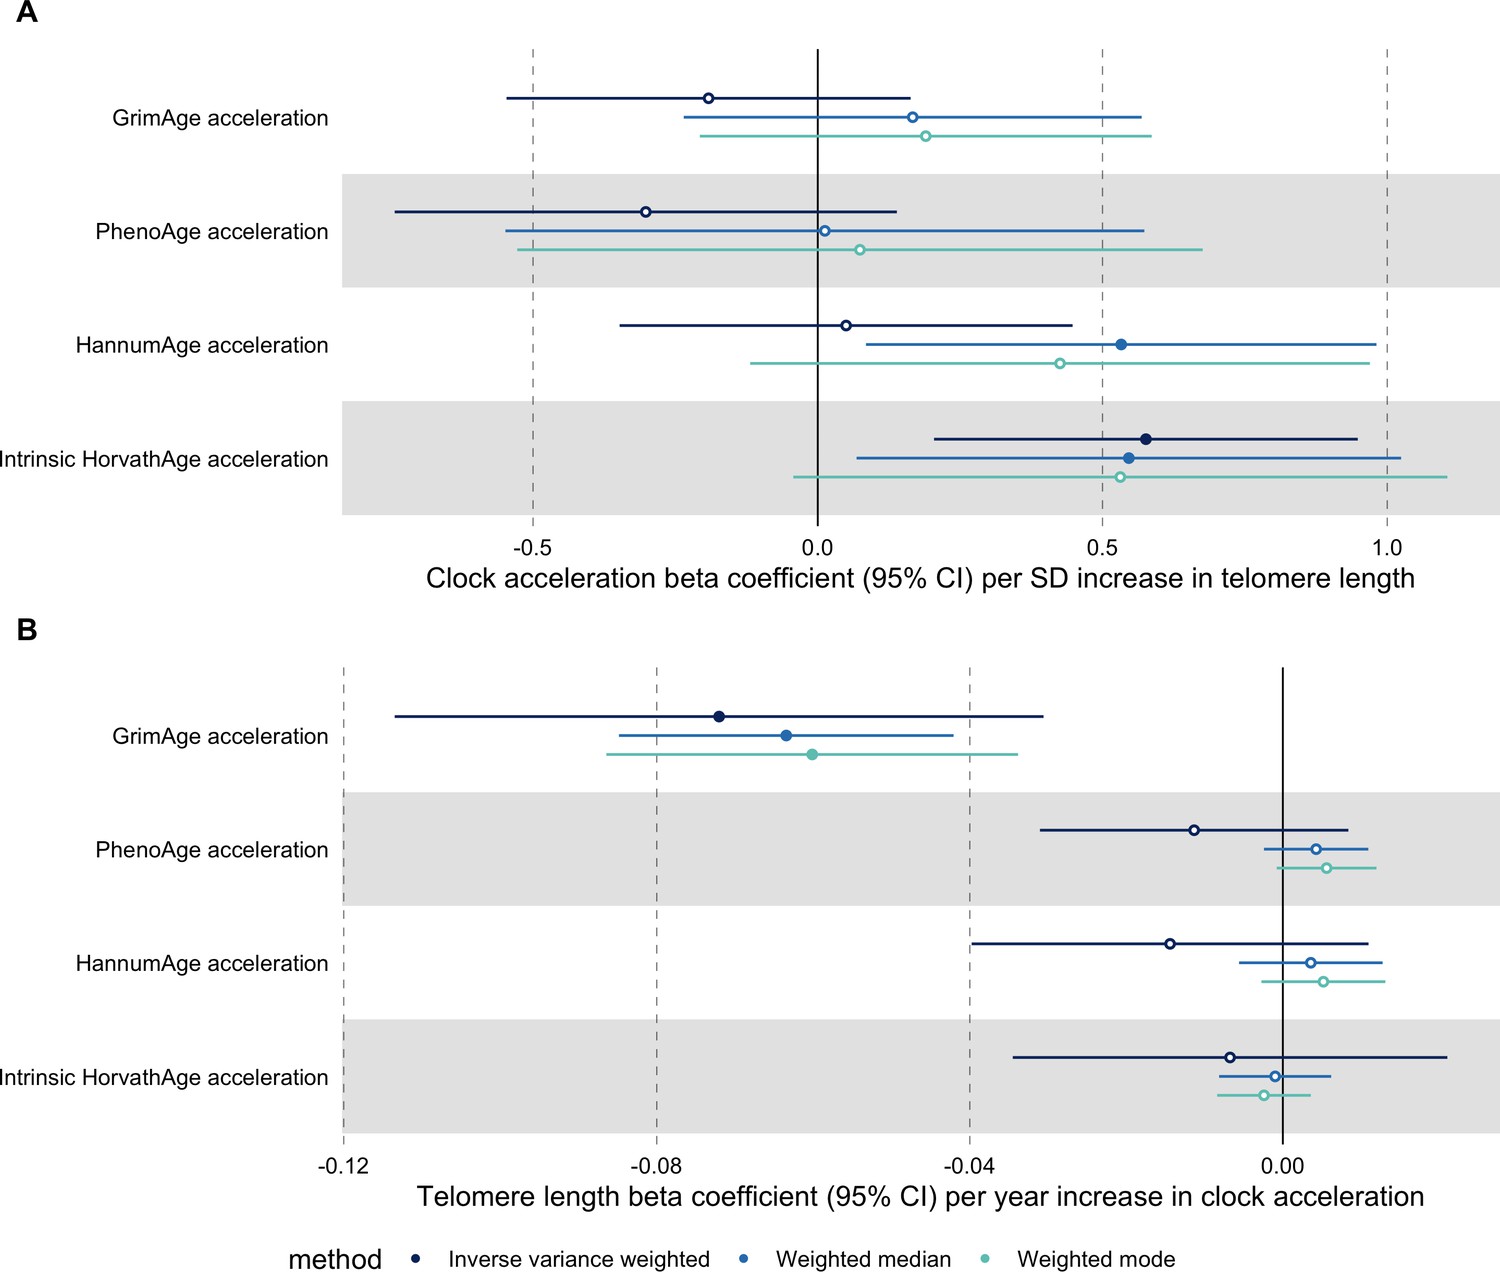
Bidirectional Mendelian randomization estimates for epigenetic age acceleration and measured telomere length.
Beta coefficients and 95% confidence intervals are reported per (A) one standard deviation increase in telomere length and (B) 1 year increase in epigenetic clock acceleration. Results were obtained using inverse variance weighted MR (dark blue), weighted median (sky blue) and weighted mode (turquoise) methods. Telomere length, GrimAge, PhenoAge, HannumAge and Intrinsic HorvathAge acceleration were instrumented by 128, 4, 11, 9 and 23 genetic variants, respectively.
Appendix 2—figure 14
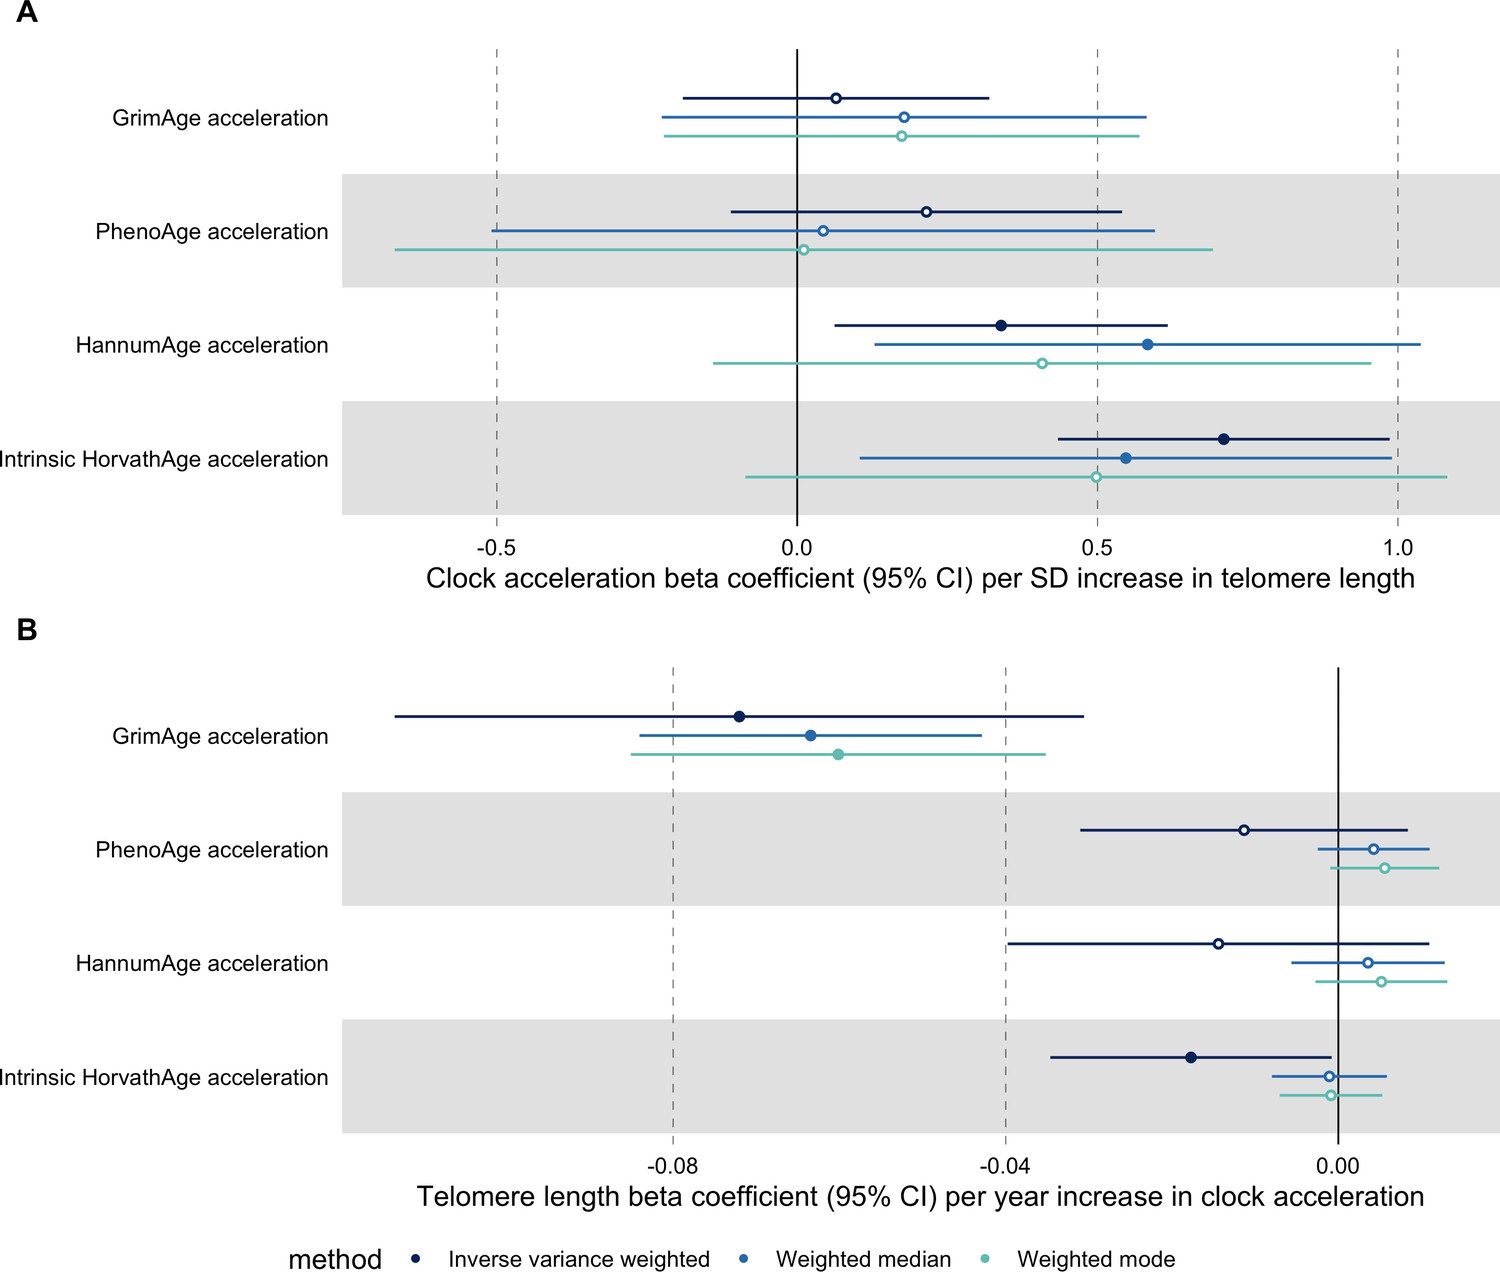
Bidirectional Mendelian randomization estimates for epigenetic age acceleration and measured telomere length after Steiger filtering.
Beta coefficients and 95% confidence intervals are reported per (A) one standard deviation increase in telomere length and (B) 1 year increase in epigenetic clock acceleration. Results were obtained using inverse variance weighted MR (dark blue), weighted median (sky blue) and weighted mode (turquoise) methods. GrimAge, PhenoAge, HannumAge and Intrinsic HorvathAge acceleration were instrumented by 4, 11, 9 and 22 genetic variants, respectively. Telomere length was instrumented by 104, 105, 105 and 109 genetic variants in GrimAge, PhenoAge, HannumAge and Intrinsic HorvathAge acceleration analyses, respectively,.
Author response image 1

Bidirectional Mendelian randomization estimates for GrimAge acceleration and telomere length.
Here we see the genetically predicted effect of (A) telomere length on GrimAge acceleration and (B) GrimAge acceleration on telomere length.
Author response image 2

Causal associations between GrimAge acceleration, shorter telomere length and colorectal cancer.
Author response image 3

Causal associations between GrimAge acceleration, shorter telomere length and breast, ovarian, prostate and lung cancer.
Author response image 4

Inverse-variance weighted Mendelian randomization estimates for genetically predicted effects of parental longevity (combined parental age at death) on multiple cancers.
Author response image 5

Bidirectional Mendelian randomization estimates for GrimAge acceleration and parental longevity.
Here we see the genetically predicted effect of (A) parental longevity estimated as combined parental age at death on GrimAge acceleration and (B) GrimAge acceleration on parental longevity estimated as combined parental age at death.
Tables
Table 1
Numbers of overall cancer cases and controls by data source.
| Cancer type | Source | N cases (%)* | N controls |
|---|---|---|---|
| Breast | BCAC | 122,977 (53.7%) | 105,974 |
| UK Biobank | 13,879 (6.5%) | 198,523 | |
| FinnGen | 8401 (7.8%) | 99,321 | |
| Ovarian | OCAC | 25,509 (38.4%) | 40,941 |
| UK Biobank | 1218 (0.6%) | 198,523 | |
| FinnGen | 719 (0.7%) | 99,321 | |
| Prostate | PRACTICAL | 79,148 (56.4%) | 61,106 |
| UK Biobank | 9132 (5.0%) | 173,493 | |
| FinnGen | 6311 (7.8%) | 74,685 | |
| Lung | ILCCO | 11,348 (41.7%) | 15,861 |
| UK Biobank | 2671 (0.7%) | 372,016 | |
| FinnGen | 1681 (1.0%) | 173,933 | |
| Colorectal | GECCO | 58,131 (46.3%) | 67,347 |
| UK Biobank | 5657 (1.5%) | 372,016 | |
| FinnGen | 3022 (1.7%) | 174,006 |
-
*
Percentage (%) of cases within each study source was calculated using the following formula: 100 * N cases / (N cases + N controls).
-
BCAC, Breast Cancer Association Consortium; OCAC, Ovarian Cancer Association Consortium; PRACTICAL, Prostate Cancer Association Group to Investigate Cancer Associated Alterations in the Genome; ILCCO, International Lung Cancer Consortium; GECCO, Genetics and Epidemiology of Colorectal Cancer Consortium.
Additional files
-
Supplementary file 1
Supplementary Tables 1-17.
Table s1. Genetic instruments for epigenetic age acceleration. Table s2. Power calculations. Table s3. MR for genetically predicted epigenetic age acceleration and cancer (international consortia). Table s4. MR for genetically predicted epigenetic age acceleration and cancer (UK Biobank). Table s5. MR for genetically predicted epigenetic age acceleration and cancer (FinnGen). Table s6. Fixed effect meta-analysis of MR for genetically predicted epigenetic age acceleration and cancer (Consortia, UK Biobank and FinnGen). Table s7. Mendelian randomization analyses for the genetically predicted effects of epigenetic clock acceleration on negative control outcomes. Table s8. Mendelian randomization analyses for the genetically predicted effects of epigenetic clock acceleration on potential confounders of the association between epigenetic age acceleration and cancer. Table s9. Single SNP analyses for the genetically predicted effects of epigenetic clock acceleration on multiple cancers. Table s10. Cochran’s Q and MR-Egger Intercept for the genetically predicted effects of epigenetic age acceleration on multiple cancers. Table s11. MR for genetically predicted epigenetic age acceleration and cancer subtypes (international consortia). Table s12. MR for genetically predicted epigenetic age acceleration and parental history of cancer (UK Biobank). Table s13. LD Score regression results for genetically predicted epigenetic age acceleration and cancer. Table s14. Bidirectional MR of epigenetic age acceleration and telomere length. Table s15. Steiger filtering for Bidirectional MR of epigenetic age acceleration and telomere length. Table s16. Bidirectional MR of epigenetic age acceleration and telomere length after Steiger filtering. Table s17. Preexisting evidence on epigenetic age acceleration and cancer.
- https://cdn.elifesciences.org/articles/75374/elife-75374-supp1-v2.xlsx
-
Supplementary file 2
STROBE-MR checklist of recommended items to address in reports of Mendelian randomization studies.
- https://cdn.elifesciences.org/articles/75374/elife-75374-supp2-v2.docx
-
Transparent reporting form
- https://cdn.elifesciences.org/articles/75374/elife-75374-transrepform1-v2.pdf
Download links
A two-part list of links to download the article, or parts of the article, in various formats.
Downloads (link to download the article as PDF)
Open citations (links to open the citations from this article in various online reference manager services)
Cite this article (links to download the citations from this article in formats compatible with various reference manager tools)
Assessing the causal role of epigenetic clocks in the development of multiple cancers: a Mendelian randomization study
eLife 11:e75374.
https://doi.org/10.7554/eLife.75374


