Rapid genome editing by CRISPR-Cas9-POLD3 fusion
- Centre for Molecular Medicine Norway, University of Oslo, Norway
- Department of Informatics, Computational Biology Unit, University of Bergen, Norway
- Center for Biotechnology, University of Helsinki, Finland
- Stem Cells and Metabolism Research Program, Faculty of Medicine, University of Helsinki, Finland
- Faculty of Social Sciences, University of Helsinki, Finland
- Department of Core Facilities, Institute for Cancer Research, Oslo University Hospital, Norway
- Department of Cancer Immunology, Institute of Cancer Research, Oslo University Hospital, Norway
- Department of Clinical Molecular Biology, Akershus University Hospital, Norway
- Department of Haematology, Oslo University Hospital, Norway
- Department of Medical Biochemistry and Biophysics, Karolinska Institute, Sweden
- Department of Biochemistry, University of Cambridge, United Kingdom
- Genome-Scale Biology Program, University of Helsinki, Norway
- Department of Pediatrics, Oslo University Hospital, Norway
Figures
Figure 1 with 6 supplements
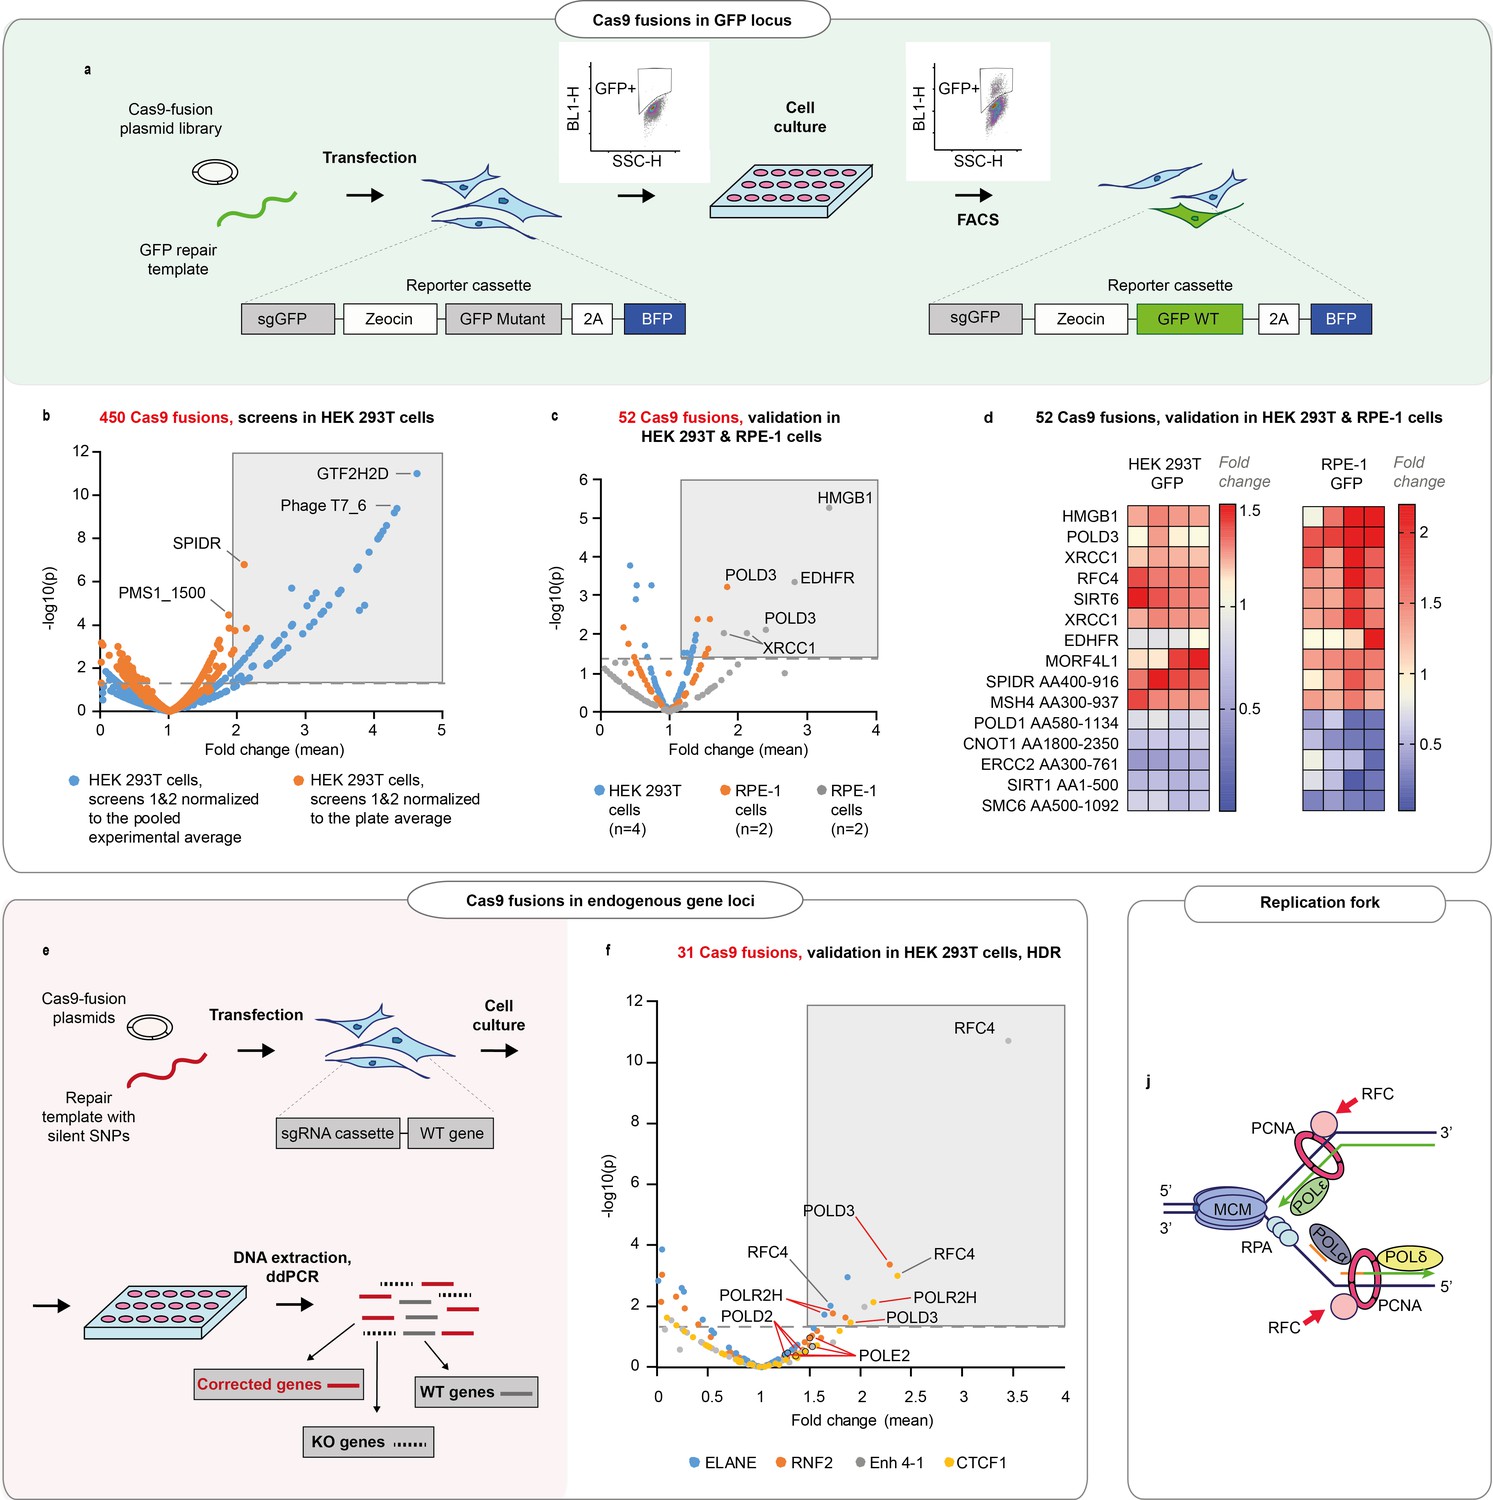
DNA repair proteins that affect genome editing outcomes.
(a) Schematic representation of the screen. Human embryonic kidney (HEK293T) cell line contains a reporter cassette expressing a selection marker, guide (sgGFP) and a mutant GFP-BFP protein. The line is transfected with a GFP repair oligo and an arrayed plasmid library containing ~450 DNA repair proteins that are fused to the C-terminus of Cas9WT. The homology-directed repair (HDR) editing efficiency for each fusion is defined by the percentage of cells with restored GFP function in each transfected well (measured by FACS). (b) Normalized GFP recovery values from two independent screens. Both experiments n = 3, each data point represents an average of value of all six replicas (n = 2 × 3), where each replicate was normalized either to the experimental average (blue dots) or to the plate average (orange dots). p-Values were calculated by one-way ANOVA test, where the mean of each triplicate is compared to the combined mean of all other triplicates from the screen. (c) Experiment average-normalized GFP recovery values for 52 fusions, chosen based on their performance in panel (b). In HEK293T n = 4, one independent biological experiment, in retinal pigment epithelium (RPE-1), n = 2, two independent biological experiments. Statistical significance is calculated as in (b). (d) Normalized GFP recovery values for 10 best-performing and five worst-performing Cas9 fusions from panel (c). Protein fragments are denoted based on the position in canonical transcript (i.e. SPIDR AA400-916 corresponds to a fragment of SPIDR protein which starts at amino acid 400 and ends at amino acid 916). (e) Schematic representation of the experiment shown in f. (f) Experiment average-normalized HDR editing for 31 fusions in four endogenous loci (ELANE, RNF2, Enh 4–1, and CTCF1) in HEK293T cells, quantified by droplet digital PCR. Polymerase fusions are marked with red pointers. n = 3, one independent biological experiment for each locus. Statistical significance is calculated as in (b). The raw data points are visible in Figure 1—figure supplements 3–6 . (j) Replication fork schematics. For all experiments, Cas9 was delivered as plasmid, the repair template as single-stranded oligonucleotide, and the guide was expressed from the genome.
Figure 1—figure supplement 1

Plasmid sizes and molar quantities of plasmids used in the high-throughput screens.
(a) Percentage distribution of plasmids used in the high-throughput screens according to their size; 90% of plasmids range from 11.5 to 13 kbp in size. (b) Percentage distribution of plasmids used in the high-throughput screens according to their molar amounts per well; 90% of plasmids were used in quantities ranging from 49 to 56 fmol per well.
Figure 1—figure supplement 2
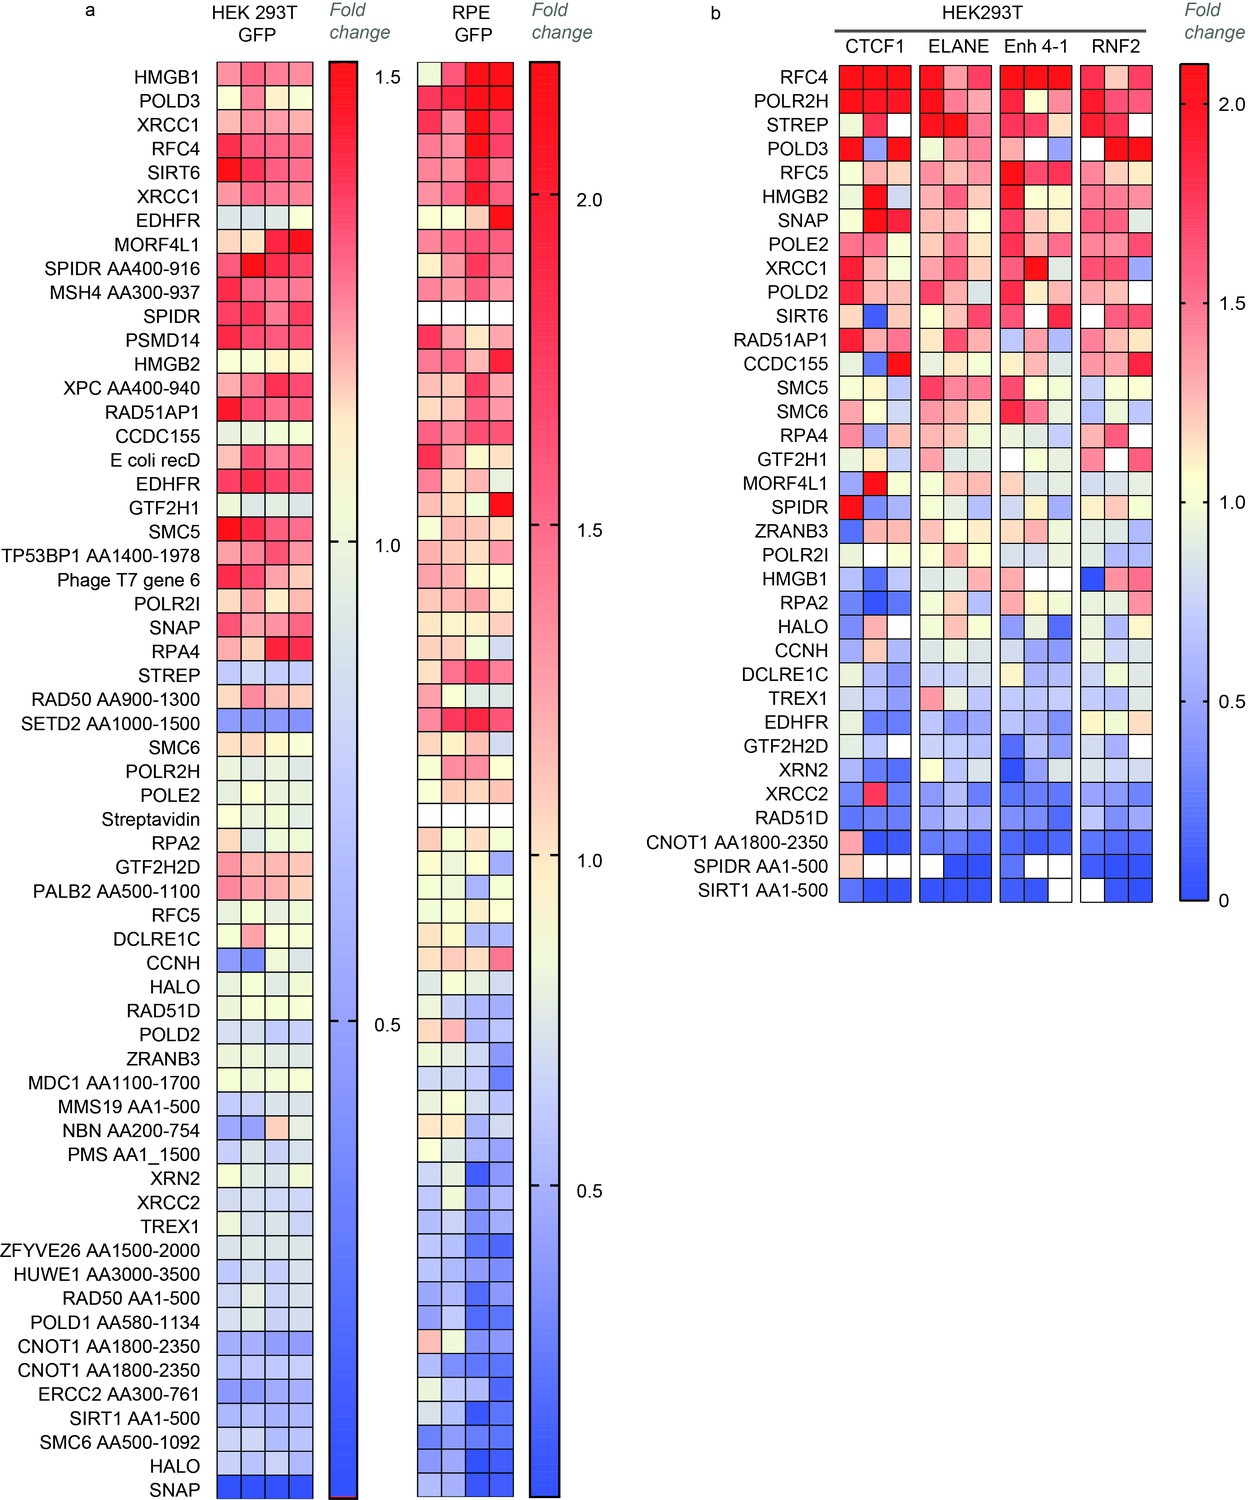
Homology-directed repair (HDR) efficiency of the best-performing fusions.
Each cell in the heat map illustrates an HDR value that is normalized to the average HDR efficiency of the whole experiment (‘fold change’). The sets have an upper limit threshold and values above it are color-coded as a scale maximum (bright-red). For protein fragments, the start and end of the fragment are indicated in relation to the canonical transcript (i.e. RAD50 AA900-1300 corresponds to a fragment of RAD50 which starts from amino acid 900 and ends in amino acid 1300). (a) Normalized GFP conversion rate in human embryonic kidney (HEK293T) (n = 4, one independent biological experiment) and RPE (n = 2, two independent biological experiments) reporter cell lines. (b) Normalized HDR editing in HEK293T cells that stably express guides targeting endogenous loci (ELANE, RNF2, Enh 4–1, and CTCF1) (n = 3, one independent biological experiment for each locus). The same dataset is shown in Figure 1e-f and Figure 1—figure supplements 3–6.
Figure 1—figure supplement 3
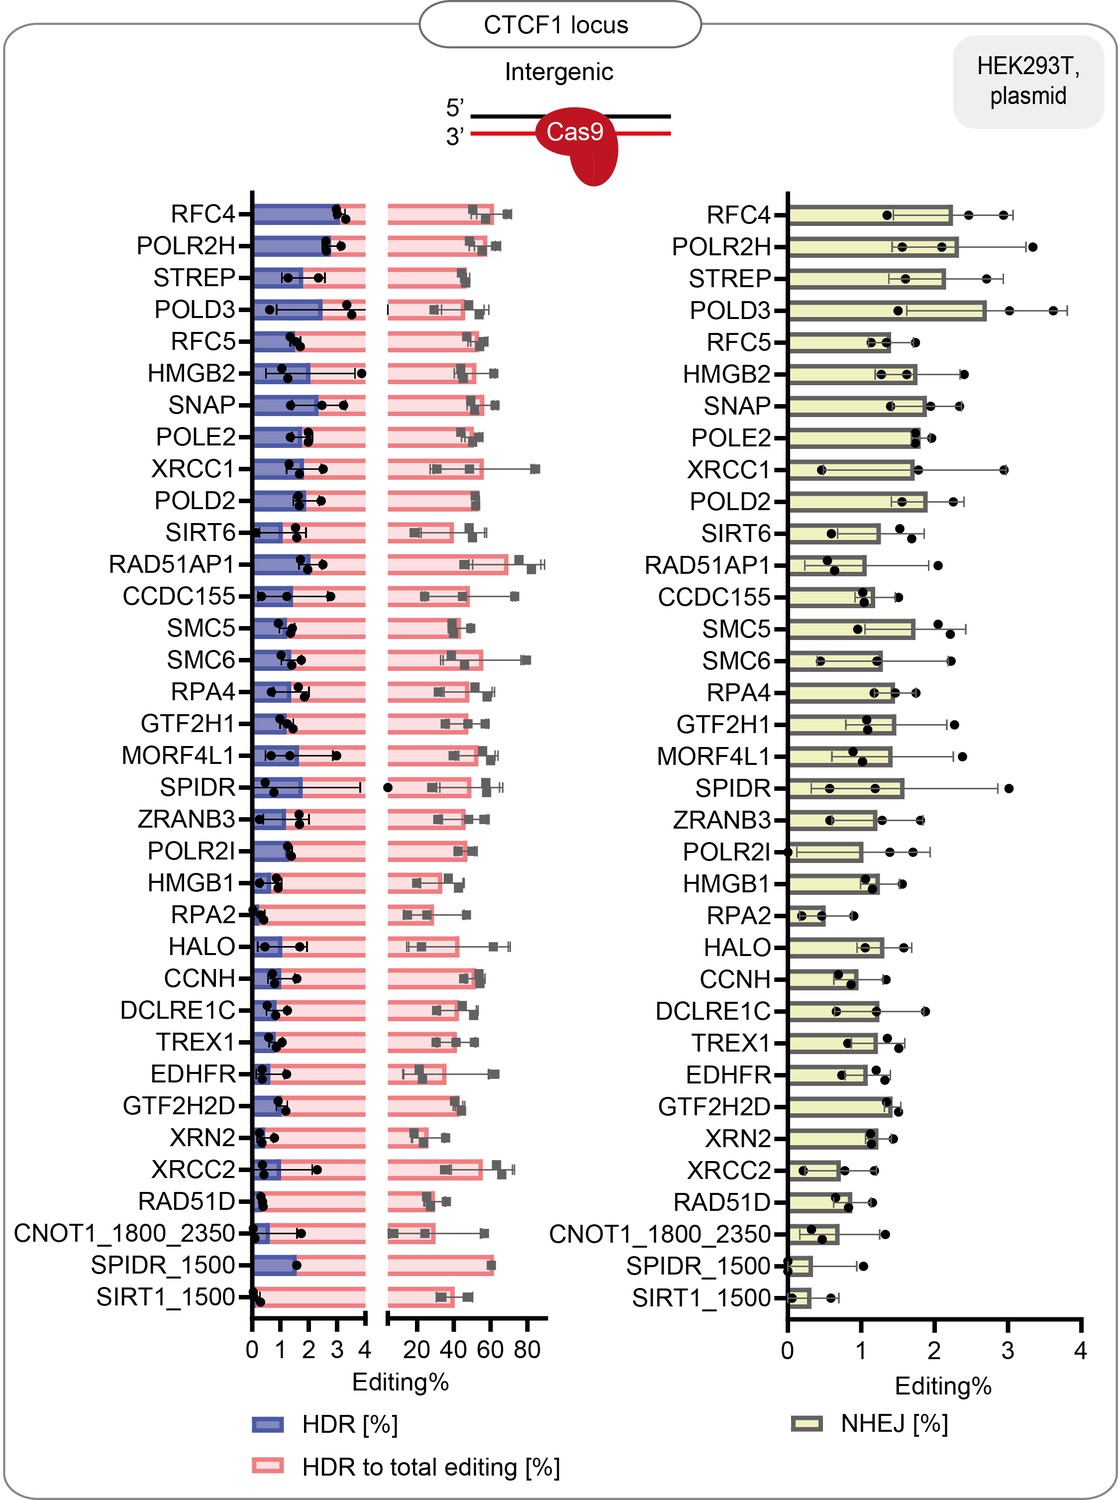
HDR efficiency of the best-performing fusions: % of HDR, % HDR of total editing and % of NHEJ in HEK293T cells that stably express the guide targeting CTCF1 endogenous locus.
Data are the mean values, error bars represent ±S.D. Top illustrations depict the positioning of the CRISPR-Cas9 complex at the target locus. The red arrow shows the direction of the approaching polymerase. The same dataset is shown in Figure 1f and Figure 1—figure supplement 2b.
Figure 1—figure supplement 4
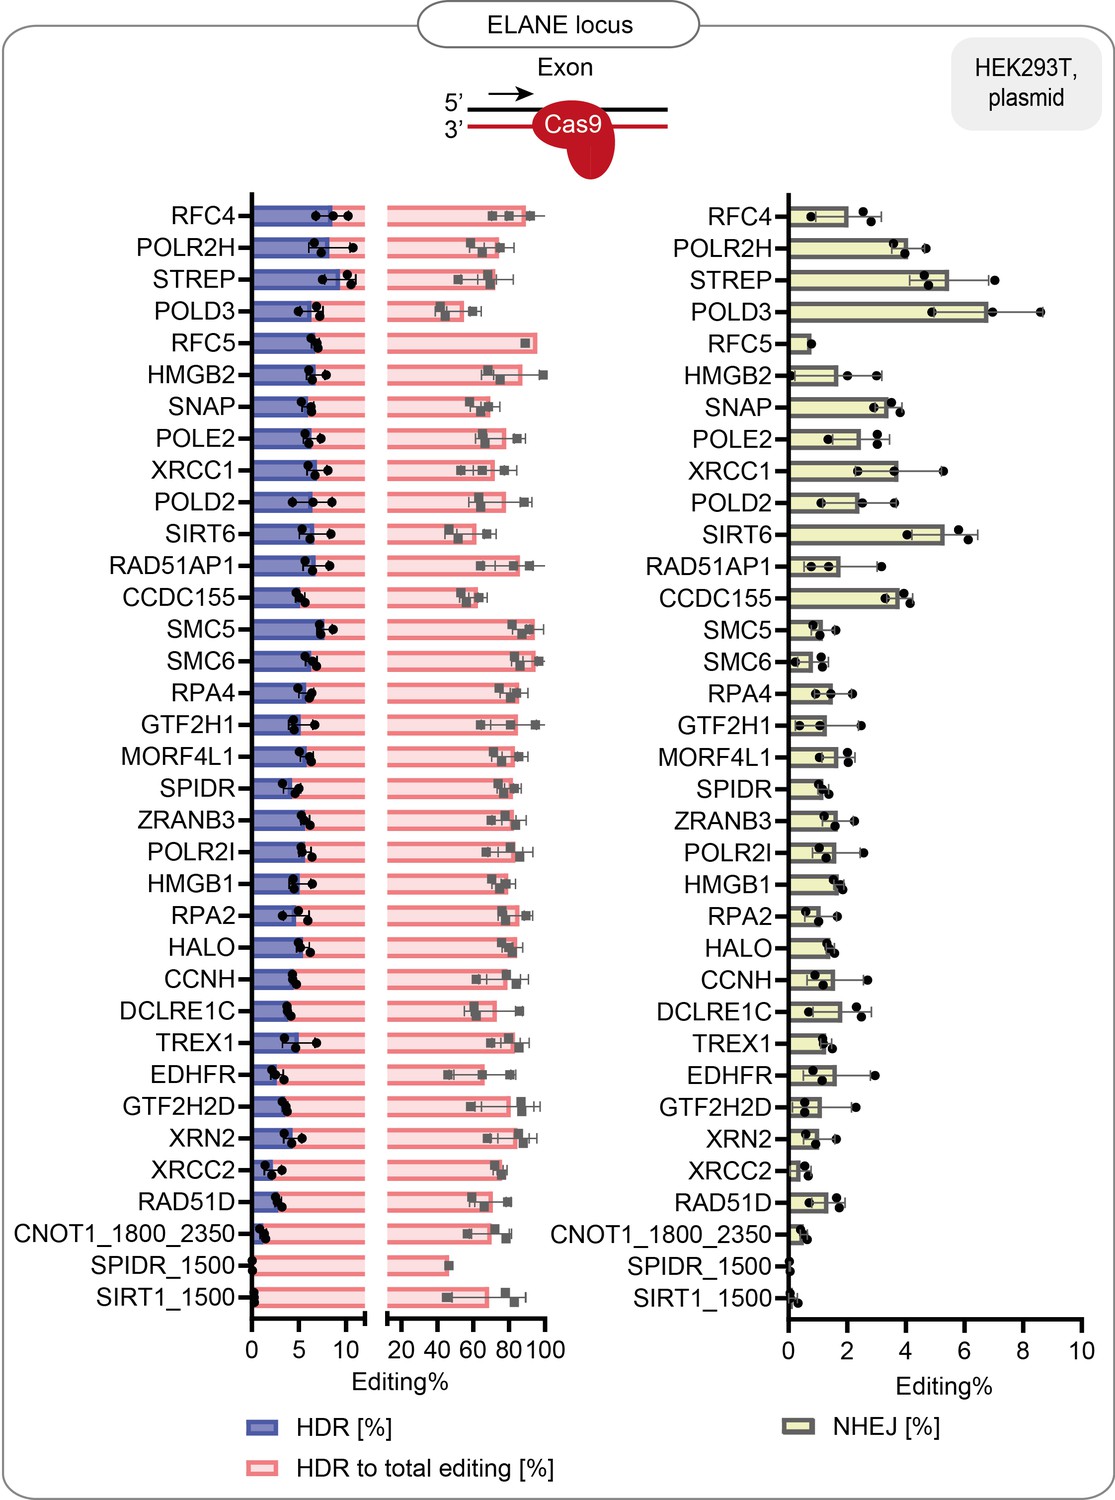
HDR efficiency of the best-performing fusions: % of HDR, % HDR of total editing and % of NHEJ in HEK293T cells that stably express the guide targeting ELANE endogenous locus.
Data are the mean values, error bars represent ±S.D. Top illustrations depict the positioning of the CRISPR-Cas9 complex at the target locus. The red arrow shows the direction of the approaching polymerase. The same dataset is shown in Figure 1f and Figure 1—figure supplement 2b.
Figure 1—figure supplement 5
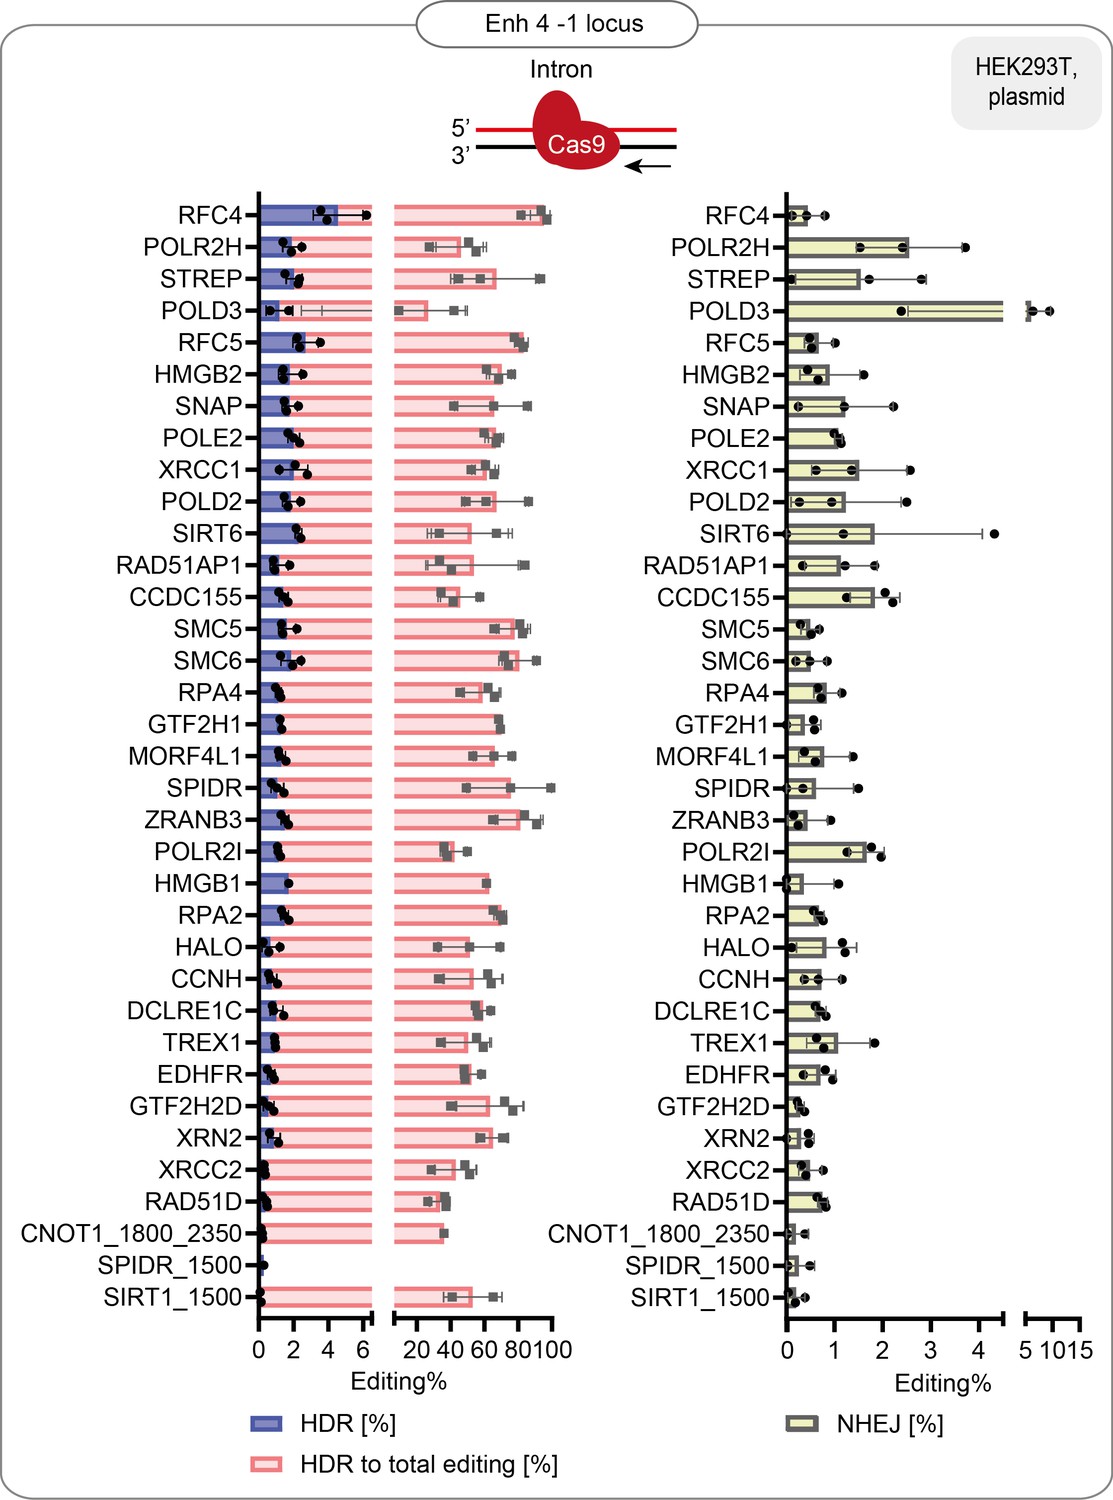
HDR efficiency of the best-performing fusions: % of HDR, % HDR of total editing and % of NHEJ in HEK293T cells that stably express the guide targeting Enh 4-1 endogenous locus.
Data are the mean values, error bars represent ±S.D. Top illustrations depict the positioning of the CRISPR-Cas9 complex at the target locus. The red arrow shows the direction of the approaching polymerase. The same dataset is shown in Figure 1f and Figure 1—figure supplement 2b.
Figure 1—figure supplement 6
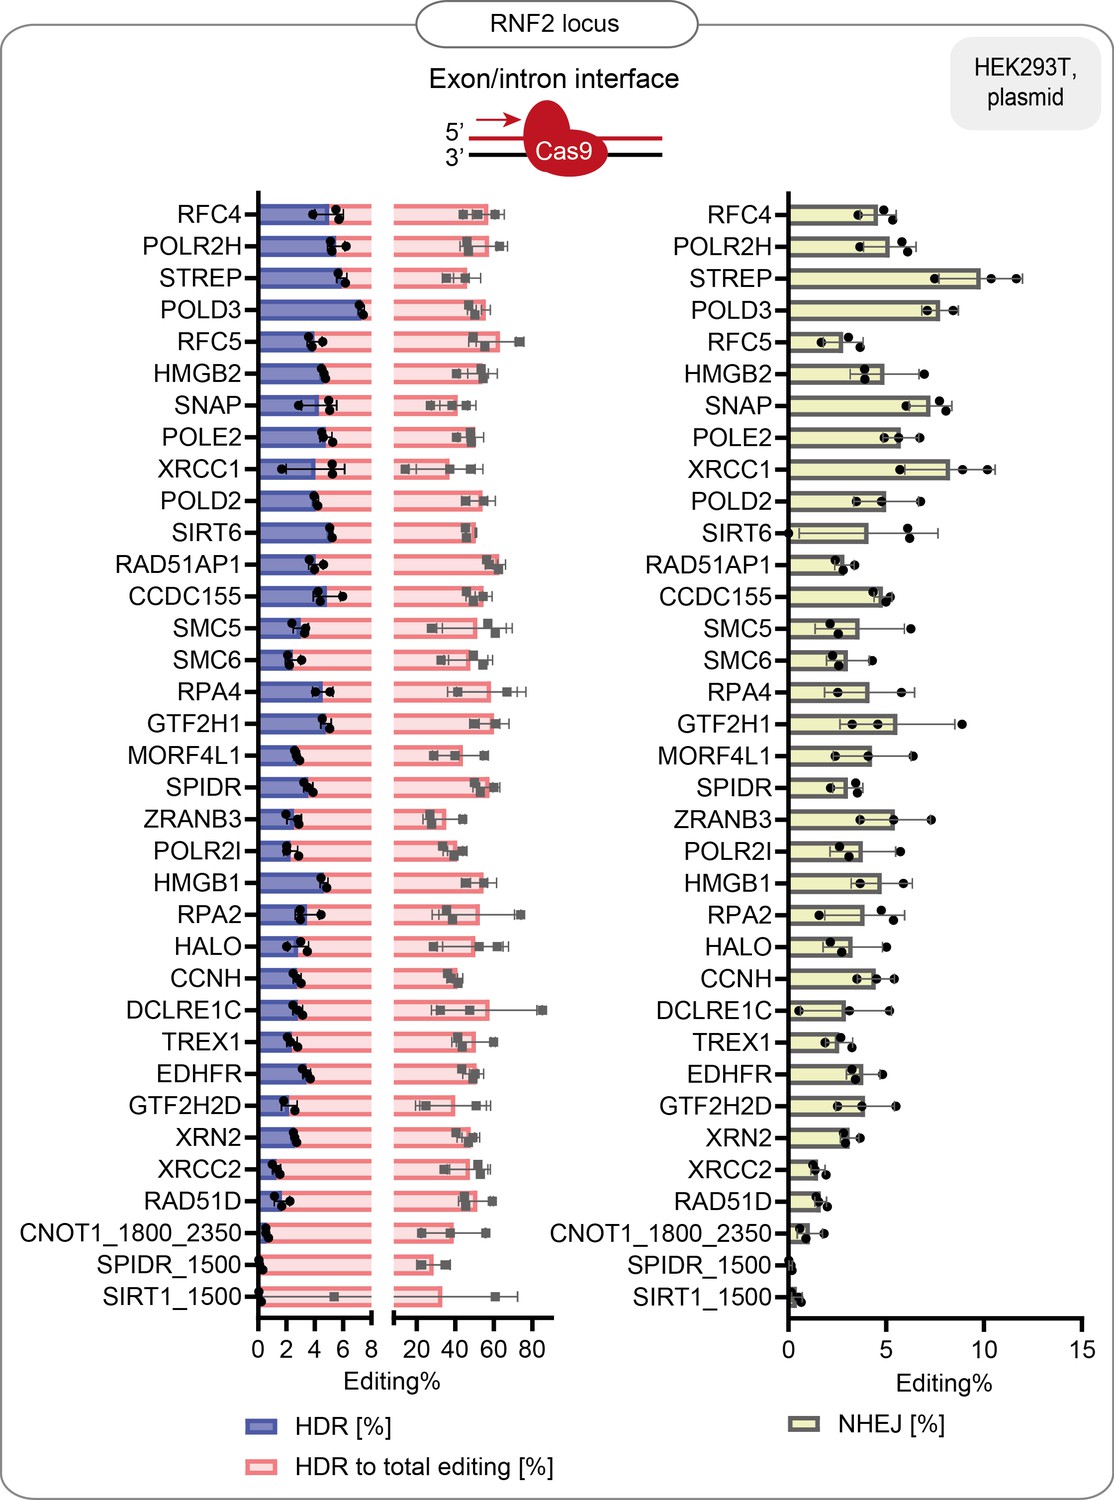
HDR efficiency of the best-performing fusions: % of HDR, % HDR of total editing and % of NHEJ in HEK293T cells that stably express the guide targeting RNF2 endogenous locus.
Data are the mean values, error bars represent ±S.D. Top illustrations depict the positioning of the CRISPR-Cas9 complex at the target locus. The red arrow shows the direction of the approaching polymerase. The same dataset is shown in Figure 1f and Figure 1—figure supplement 2b.
Figure 2 with 2 supplements
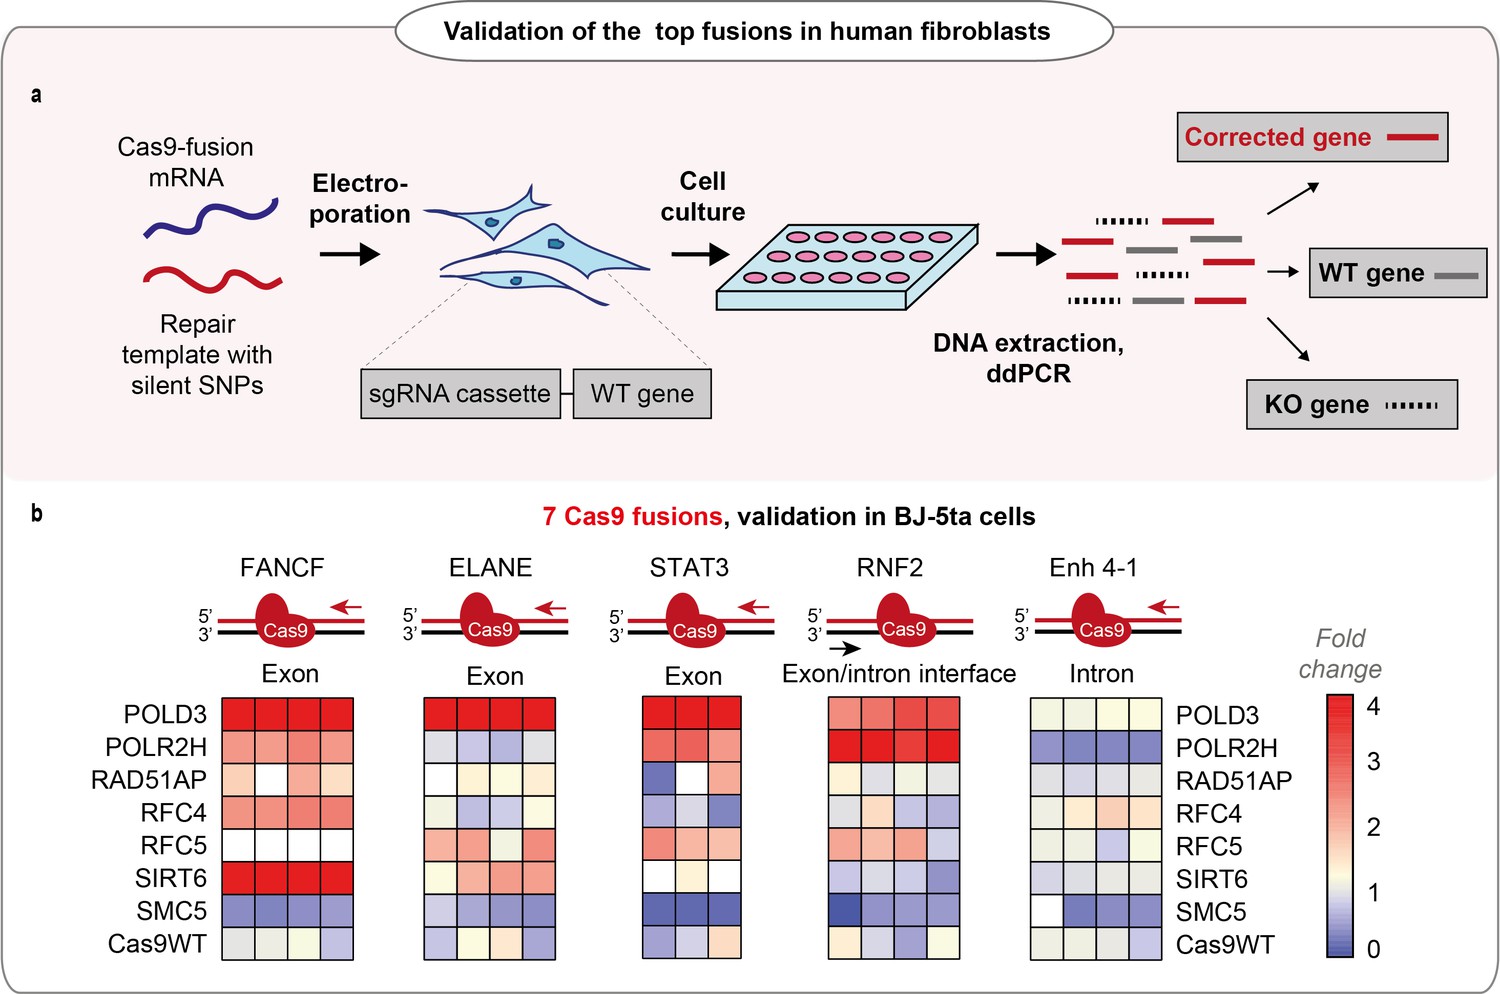
Performance of the fusions in BJ-5ta cell line.
(a) Schematic representation of the experiment shown in b. (b) Normalized homology-directed repair (HDR) efficiency of the seven best-performing fusions in five endogenous loci in hTERT immortalized fibroblasts (BJ-5ta), quantified by droplet digital PCR (ddPCR). Heat maps represent values normalized to Cas9WT for each gene locus. The sets have an upper limit threshold and values above it are color-coded as a scale maximum (bright-red). One independent experiment for each gene locus, n = 4 for FANCF, Enh 4–1, RNF2, ELANE gene loci; n = 3 for STAT3 gene. The raw data points are visible in Figure 2—figure supplement 1a-j. For all experiments, Cas9 was delivered as mRNA, the repair template as single-stranded oligonucleotide, and the guide was expressed from the genome.
Figure 2—figure supplement 1
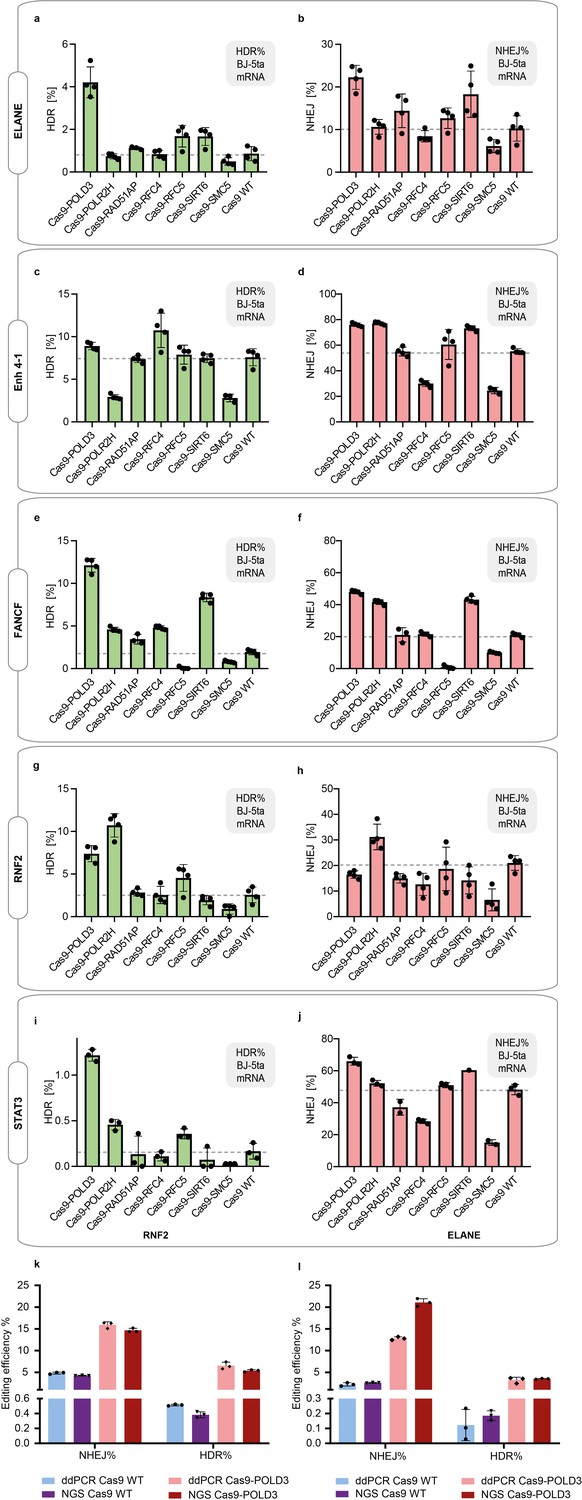
Cas9 fusion editing efficiency in immortalized fibroblasts (BJ-5ta) that stably express sgRNA targeting the indicated loci.
(a–j) The cells were electroporated with Cas9 mRNA and repair DNA. Homology-directed repair (HDR) and non-homologous end-joining (NHEJ) editing were measured with droplet digital PCR (ddPCR). n = 3, one independent experiment, bar denotes mean value, error bars represent ± SD. The dataset is also presented in Figure 2b. (k–l) Comparison between the ddPCR and NGS-based editing detection, for RNF2 site (k) and ELANE site (l). n = 3, one independent experiment, bar denotes mean value, error bars represent ± SD.
Figure 2—figure supplement 2
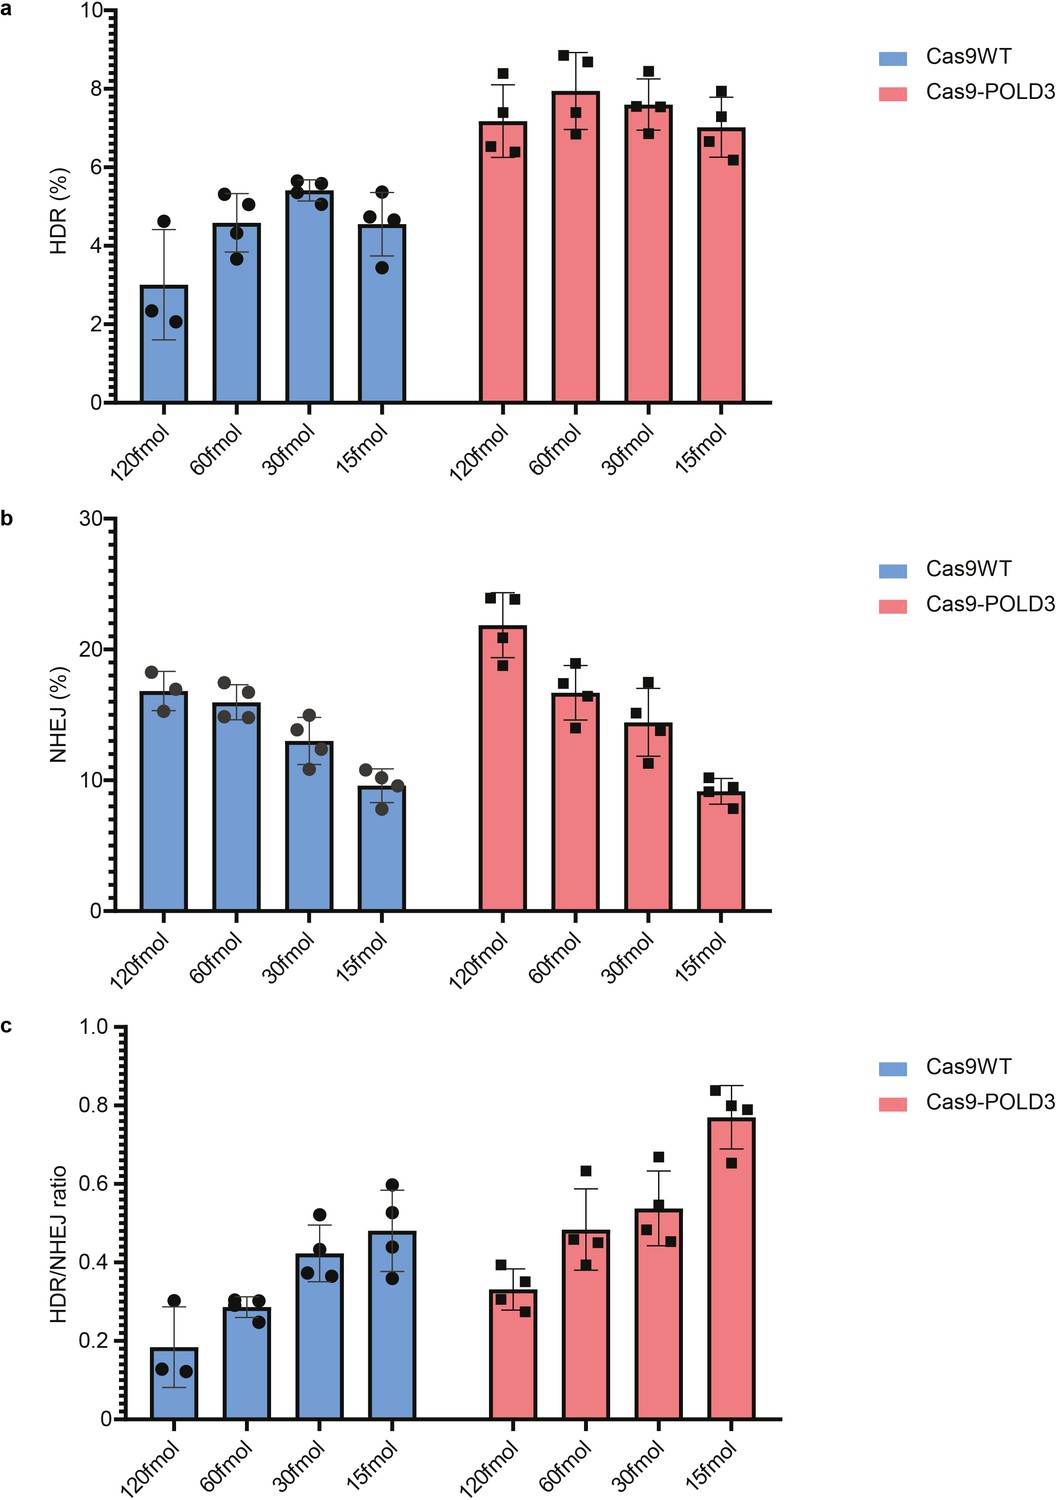
Cas9 fusion to DNA polymerase delta subunit 3 (Cas9-POLD3) editing in decreased concentrations.
(a-c) % of homology-directed repair (HDR), % non-homologous end-joining (NHEJ), and HDR/NHEJ evaluated by droplet digital PCR (ddPCR) represent fusion protein performance across different plasmid concentrations in reporter RPE-1 cells, GFP locus. n = 4, representative of two independent experiments, bar denotes mean value, error bars represent ± SD.
Figure 3
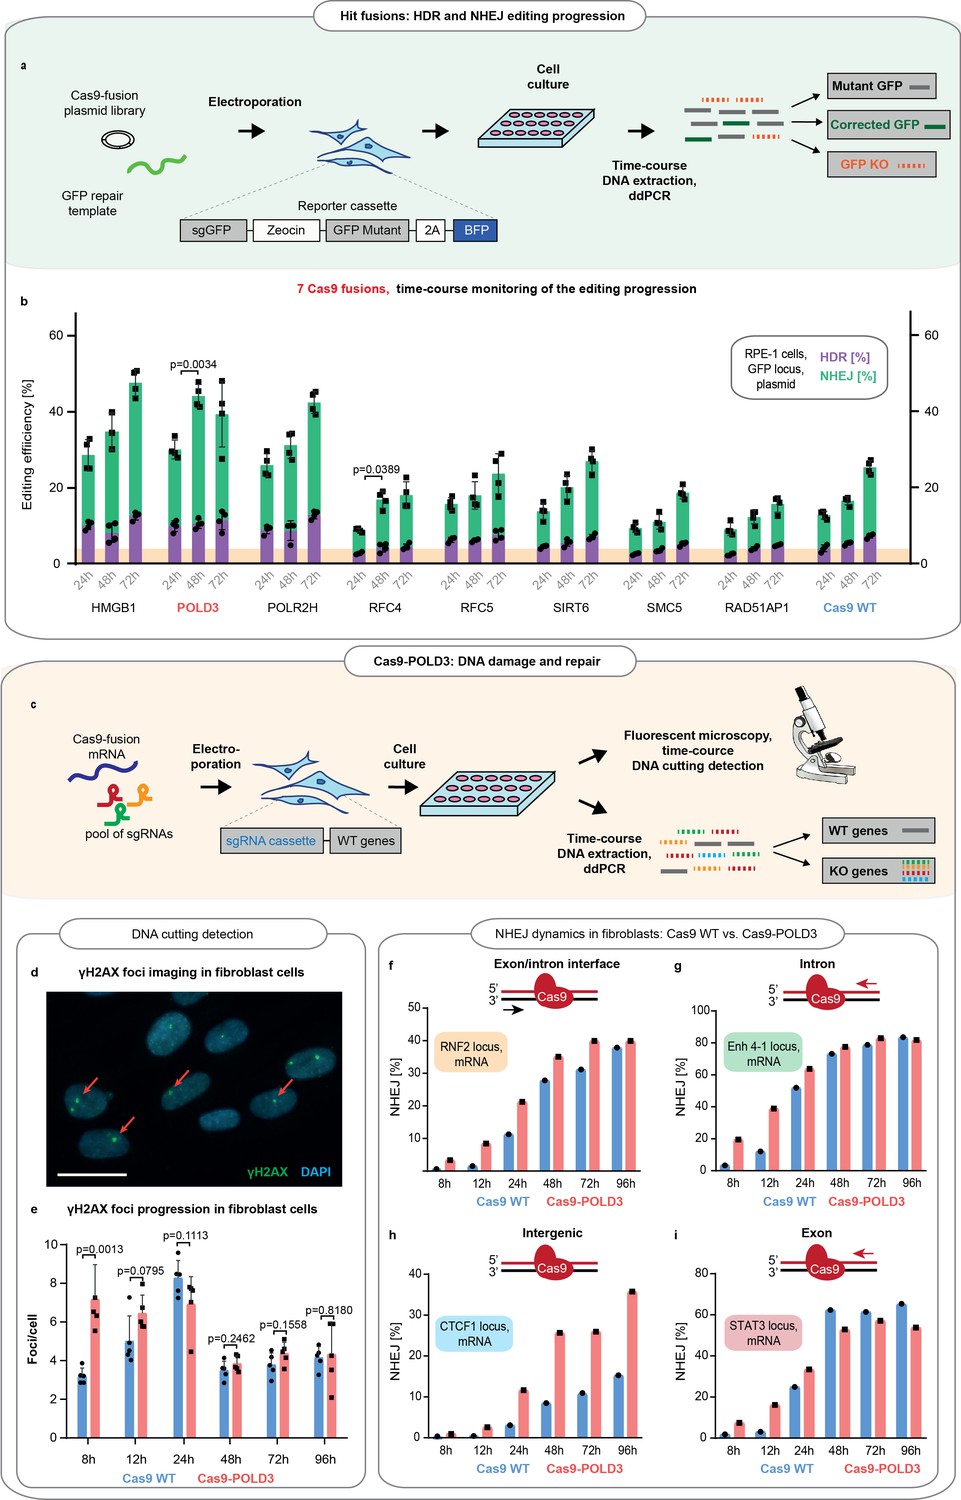
Comparison of the DNA repair dynamics between Cas9 fusions.
(a) Schematic representation of experiment shown in b. (b) The DNA repair progression in the retinal pigment epithelium (RPE-1) reporter locus for eight of the better-performing fusions (selected from screens on Figure 1c-f). Droplet digital PCR (ddPCR) quantification, n = 3, single independent experiment, bar denotes mean value, error bars represent ± SD. Orange highlighting indicates the Cas9WT homology-directed repair (HDR) editing level at 24 hr post-electroporation. p-Values denote significance of the total editing (HDR+ non-homologous end-joining [NHEJ]) increment between the Cas9WT and other fusions (for 24–48 hr period). Statistical values derived using one-way ANOVA test. Cas9 was delivered as plasmid, the repair template as single-stranded oligonucleotide, and the guide was expressed from the genome. (c) Schematic representation of experiment shown in d–i. (d) Representative immunofluorescence image used for DNA breakpoint quantification. Cell nuclei are depicted in blue, γH2AX foci in green, and red arrows indicate individual foci. Scale bar 50 µm. (e) Time course for γH2AX foci emergence in human immortalized fibroblasts (BJ-5ta). The cells were electroporated with Cas9WT or Cas9 fusion to DNA polymerase delta subunit 3 (Cas9-POLD3) mRNA and a pool of three guides targeting RNF2, Enh 4–1, and STAT3 loci. The CTCF1 gRNA is constitutively expressed. Five confocal images were taken for each condition, n = 5, single independent experiment, bar denotes mean value, error bars represent ± SD. Statistical significance of the difference between Cas9WT and Cas9-POLD3 is calculated using ANOVA test for the equality of the means at a particular time point. (f–i) ddPCR quantification of the NHEJ repair dynamics across time for the experiment described in (e). The red arrow shows the direction of the approaching polymerase. The DNA strand which the CRISPR-Cas9 binds to is colored in red. n = 1, single independent experiment, bar denotes mean value, error bars represent ± SD. Cas9 was delivered as mRNA, the repair template as single-stranded oligonucleotide, one guide was expressed from the genome and three guides transfected as synthesized oligonucleotides.
Figure 4 with 1 supplement
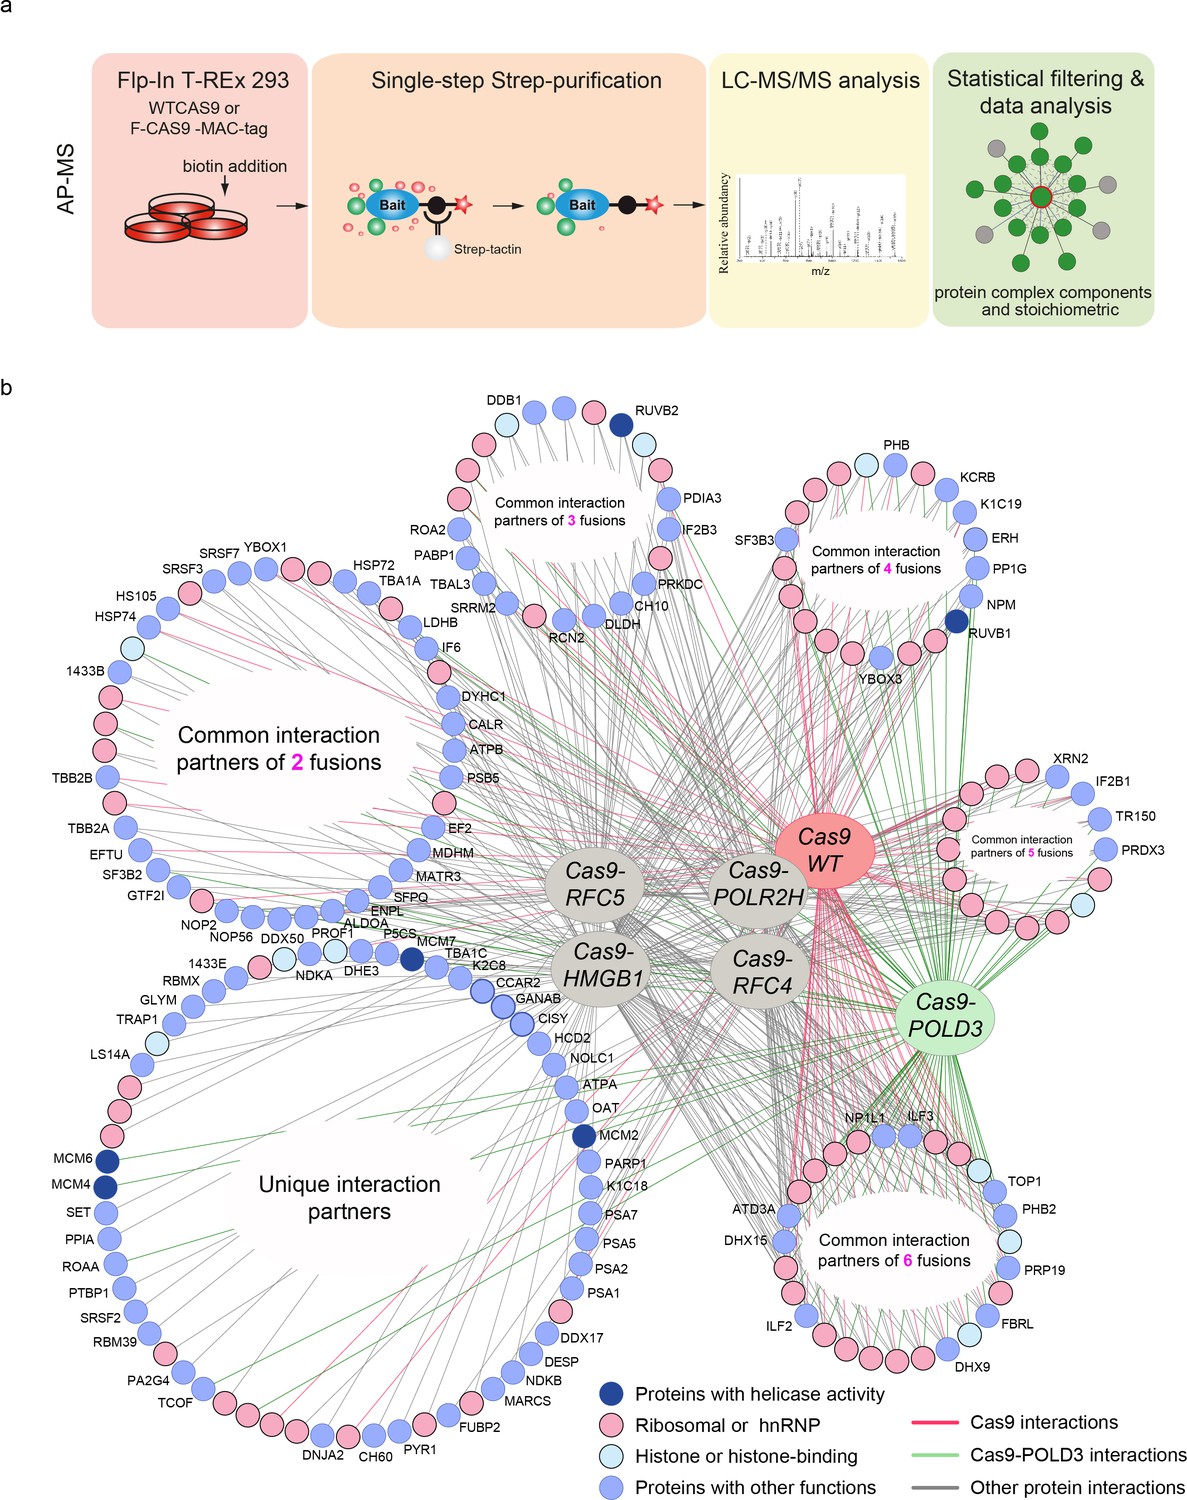
Protein-protein interactions of editing-enhancing Cas9 fusions.
(a) Schematic representation of the affinity purification mass spectrometry (AP-MS) experimental workflow. (b) Protein interaction map of the Cas9 fusions and Cas9WT. The interacting endogenous proteins are clustered into circles based on how many Cas9 proteins they interact with. The endogenous proteins in the bottom left circle interact with only one fusion or Cas9WT, and the proteins in the bottom right circle interact with all the fusions or Cas9WT. Pink coloring represents RNA-binding proteins, light-blue represents histone proteins, dark blue indicates interaction partners with helicase activity, and light blue circles denote proteins with other functions. Each AP-MS experiment was conducted in three biological replicates (n = 3). The Cas9 and gRNA were expressed from the genome.
Figure 4—figure supplement 1
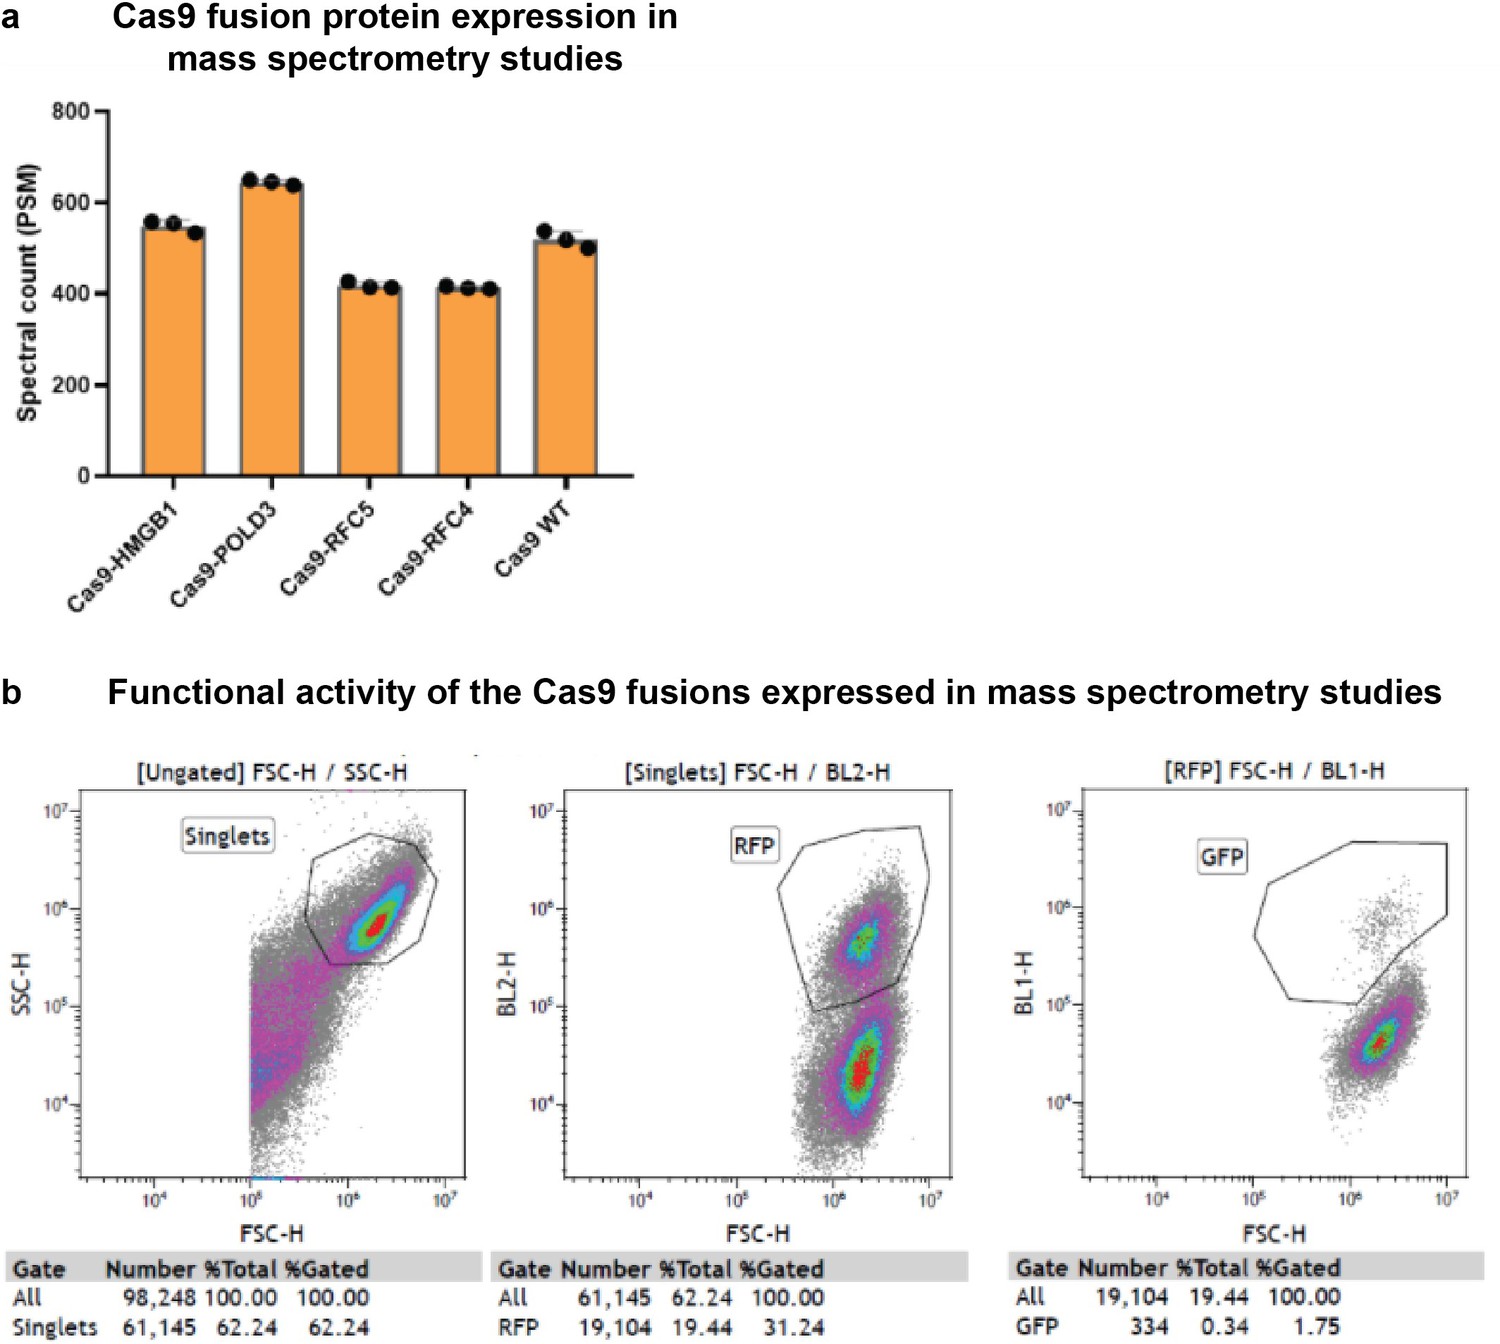
Protein expression quality control for mass spectrometry analysis.
(a) Peptide-spectrum match (PSM) counts of the Cas9 fusion proteins Flip-in human embryonic kidney (HEK293T) cell lines after 30 hr tetracycline induction. The samples were subsequently used in affinity purification mass spectrometry (Figure 4). (b) Functional activity of the CRISPR-Cas9 fusions used in the mass spectrometry assays. Expression of the fusion construct was induced with tetracycline 24 hr prior to the transfection with ribonucleoprotein (RNP) complex targeting GFP locus and corresponding repair template. GFP recovery evaluated by fluorescence-activated cell sorting (FACS) after 5 days.
Figure 5 with 1 supplement
Off-target and indel profiles of wild-type (WT) and Cas9 fusion to DNA polymerase delta subunit 3 (Cas9-POLD3) nucleases.
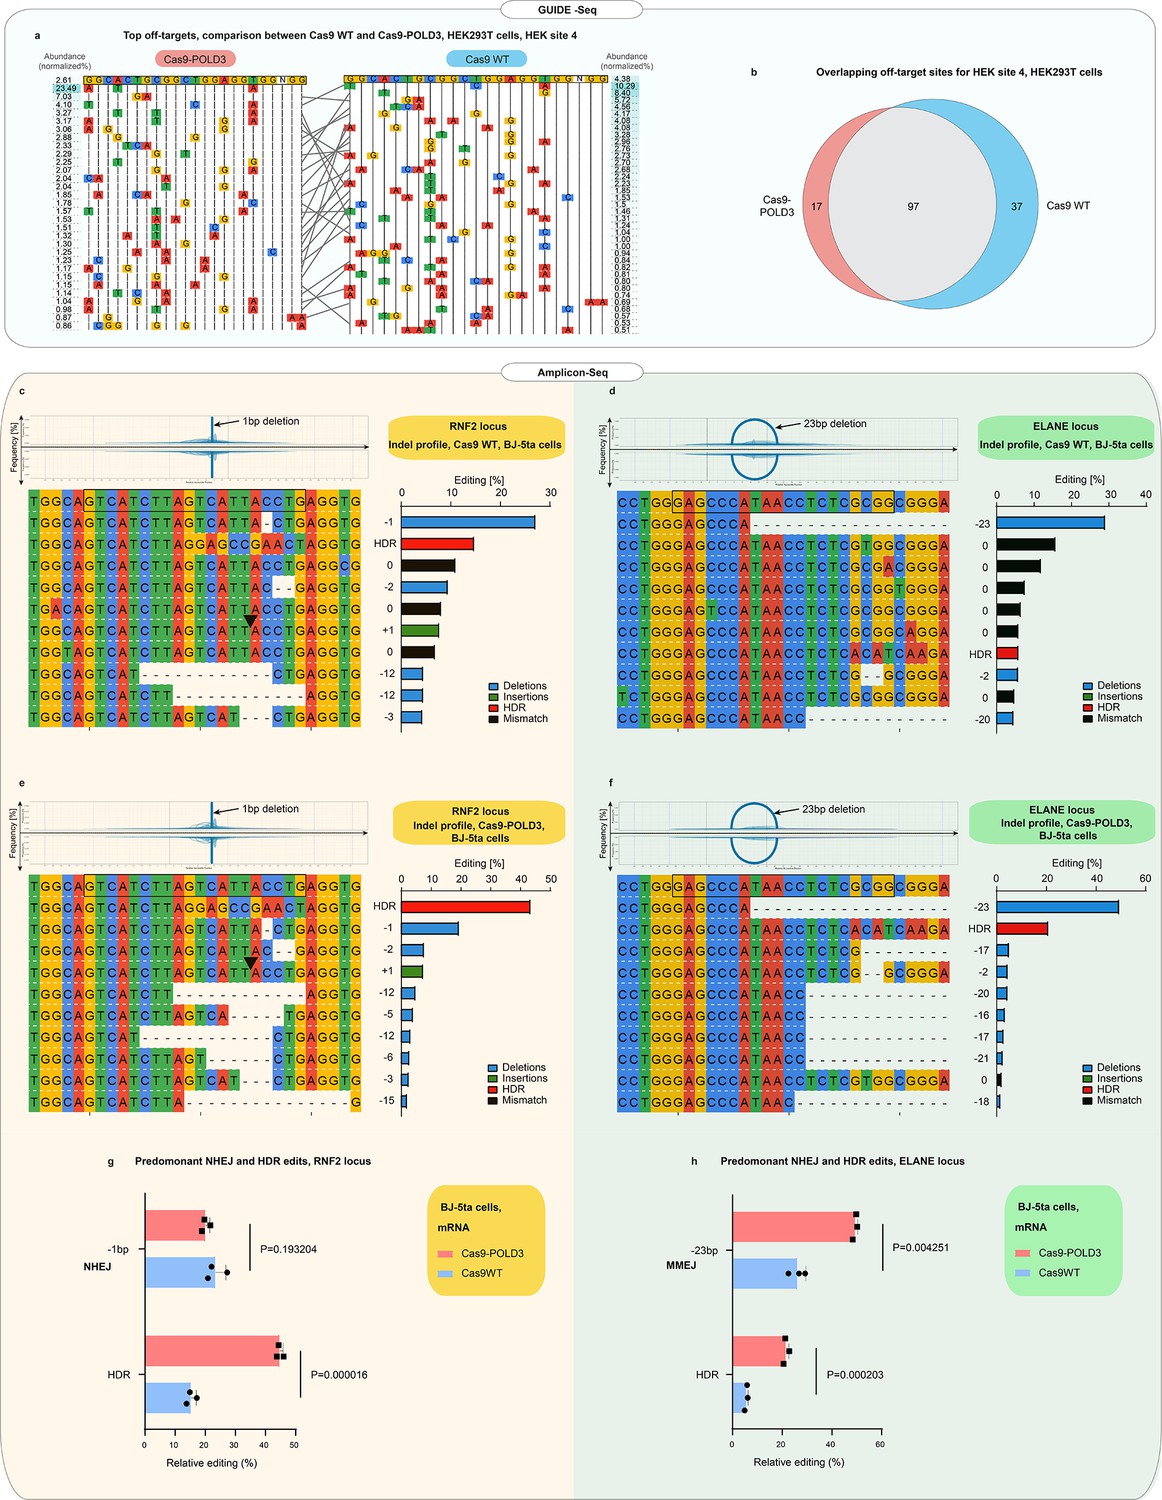
(a) Mismatch plot of the GUIDE-Seq (Tsai et al., 2015) results for Cas9WT and Cas9-POLD3, using a published guide (Tsai et al., 2015) against the endogenous human embryonic kidney (HEK) site 4. Cas9 and the guide were co-transfected as plasmids. The on-target sequence is depicted at the first line of the table. The most abundant off-targets are listed underneath the intended edit and sorted by frequency, which is determined by dividing the number of reads that contain the off-target edit with the total read count. Gray lines connect the shared off-target sites. (b) Venn diagram of the common and unique off-target sites between Cas9WT and Cas9-POLD3. (c–f) Mismatch plots of the indel profiles of Cas9WT and Cas9-POLD3 in BJ-5ta fibroblasts, obtained by deep amplicon sequencing. Cas9 was delivered as mRNA, the repair template as single-stranded oligonucleotide, and the guide was expressed from the genome. The on-target gRNA-binding site is on the top row, highlighted with a black box. The most frequent indels are below, sorted according to their frequency. The indel frequency is calculated by dividing the indel read count by the sum of the top 10 indel read counts. The edits matching the homology-directed repair (HDR) template are marked in red in the summary plots. Plots depict: (c) On-target editing signature of Cas9WT, RNF2 locus. (d) On-target editing signature of Cas9WT, ELANE locus. (e) On-target editing signature of Cas9-POLD3, RNF2 locus. (f) On-target editing signature of Cas9-POLD3, ELANE locus. (g–h) The most common non-homologous end-joining (NHEJ) and HDR editing outcomes depicted in bar graphs. n = 3, bar denotes mean value, error bars represent ± SD. Statistical significance is calculated with unpaired, two-sided Student’s t-test.
Figure 5—figure supplement 1
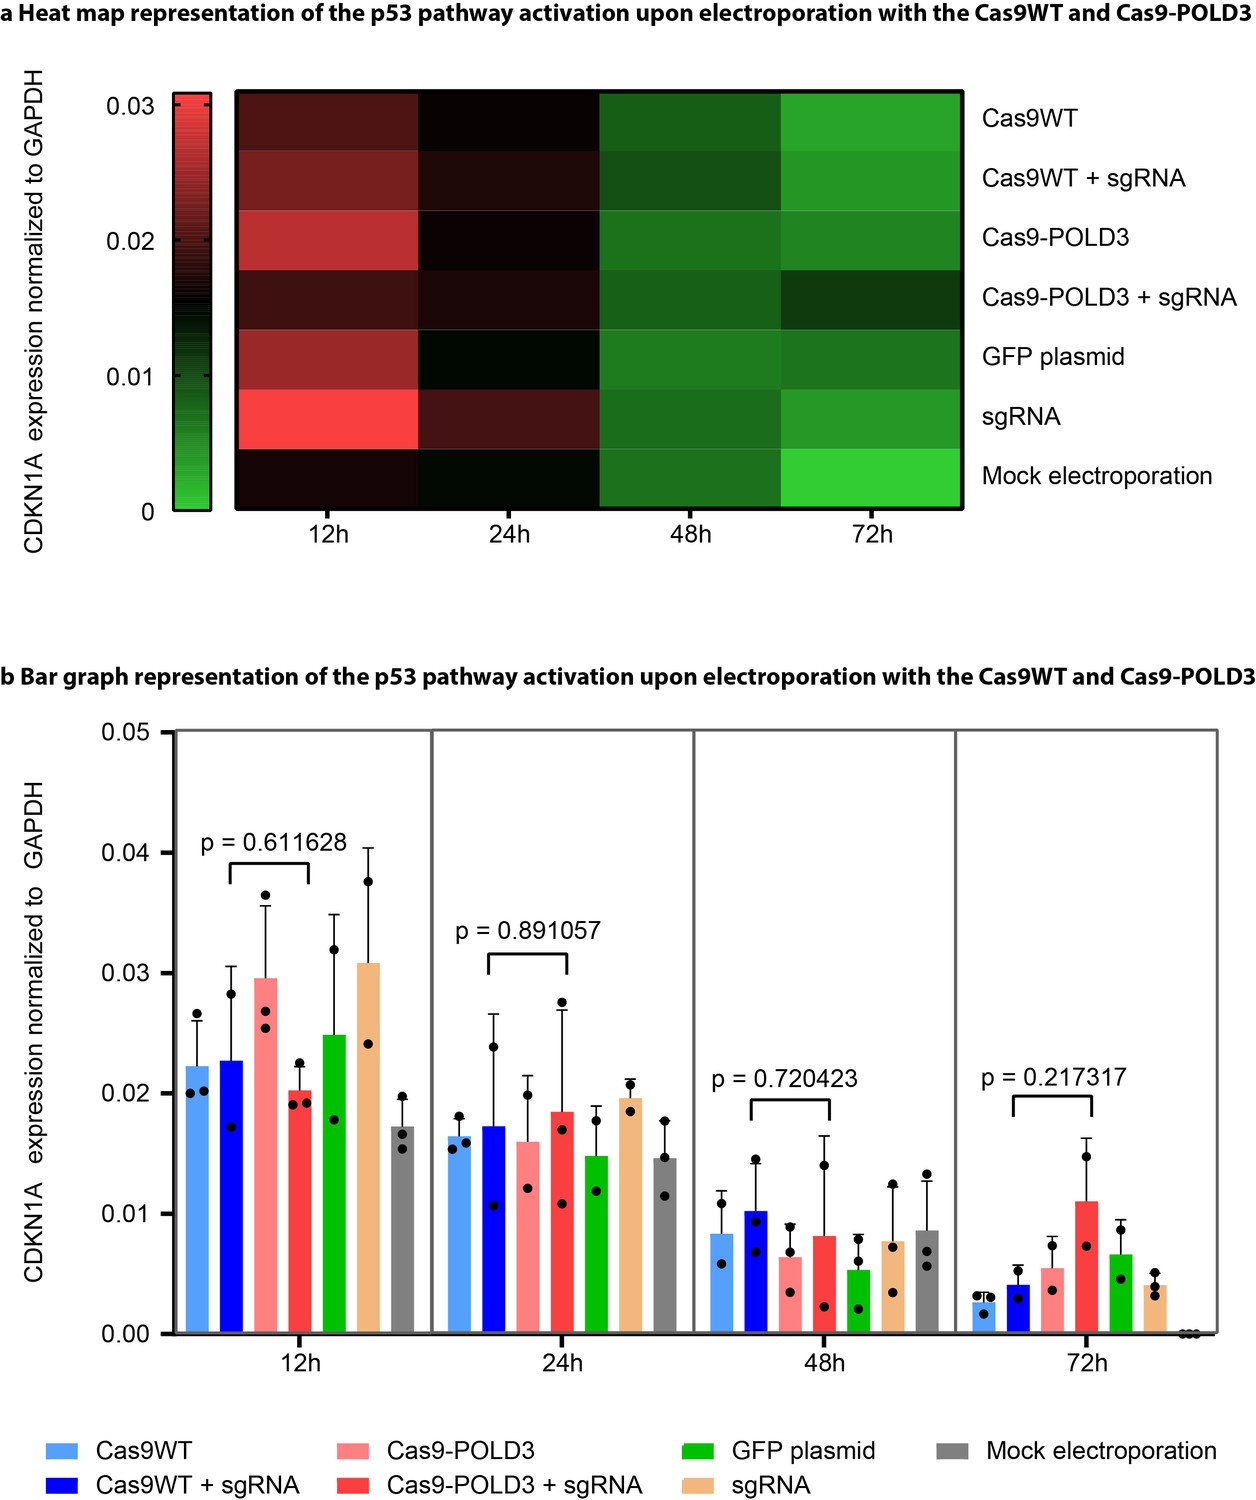
P21 expression upon CRISPR-Cas9-POLD3 editing.
Retinal pigment epithelium (RPE-1) cells were electroporated with Cas9WT and Cas9-POLD3 plasmids along with an sgRNA targeting RNF2 locus. The RNA was extracted at the indicated time points (12, 24, 48, 72 hr) and CDKN1A expression level quantified by droplet digital PCR (ddPCR), with GAPDH as the normalization control. Heat map (a) values represent average of three replicates (n = 3, biological triplicates from one independent experiment). Bar graphs (b) show individual values from (a), bar denotes mean value, error bars represent ± SD. Statistical significance is calculated with unpaired, two-sided Student’s t-test (p-values on plot) and ANOVA (Supplementary file 4).
Figure 6 with 2 supplements

Editing efficiency of Cas9 fusion to DNA polymerase delta subunit 3 (Cas9-POLD3) and a panel of various homology-directed repair (HDR) improving fusions reported in the literature.
(a) Editing of GFP in reporter human embryonic kidney (HEK293T) cells, n = 4, one of two independent experiments, bar denotes mean value, error bars represent ± SD. Statistical significance is calculated with unpaired, two-sided Student’s t-test. Cas9 was delivered as plasmid, the repair template as single-stranded oligonucleotide, and the guide was expressed from the genome. (b) Normalized to Cas9WT HDR efficiency of the fusions in four endogenous loci (CTCF1, ELANE, Enh 4–1, RNF2) in HEK293T, hTERT immortalized fibroblasts (BJ-5ta) and RPE-1 cells quantified by droplet digital PCR (ddPCR). Cas9 was delivered as plasmid (HEK293T and RPE-1) or mRNA (BJ-5ta), the repair template as single-stranded oligonucleotide, and the guide was added in electroporation reaction (HEK293T and RPE-1) or expressed from the genome (BJ-5ta). Heat maps represent HDR values normalized to experimental average for each gene locus. Each cell type was tested in a single biological experiment (n = 3 HEK293T [top dataset] and BJ-5ta; n = 4 HEK293T [bottom dataset] and RPE-1). (c) GFP reporter locus editing efficiency of recombinant Cas9 fusion proteins in RPE-1 and HEK293T cells. n = 5, one of two independent experiments, bar denotes mean value, error bars represent ± SD. Statistical significance is calculated with ANOVA that is adjusted for multiple comparisons.
Figure 6—figure supplement 1
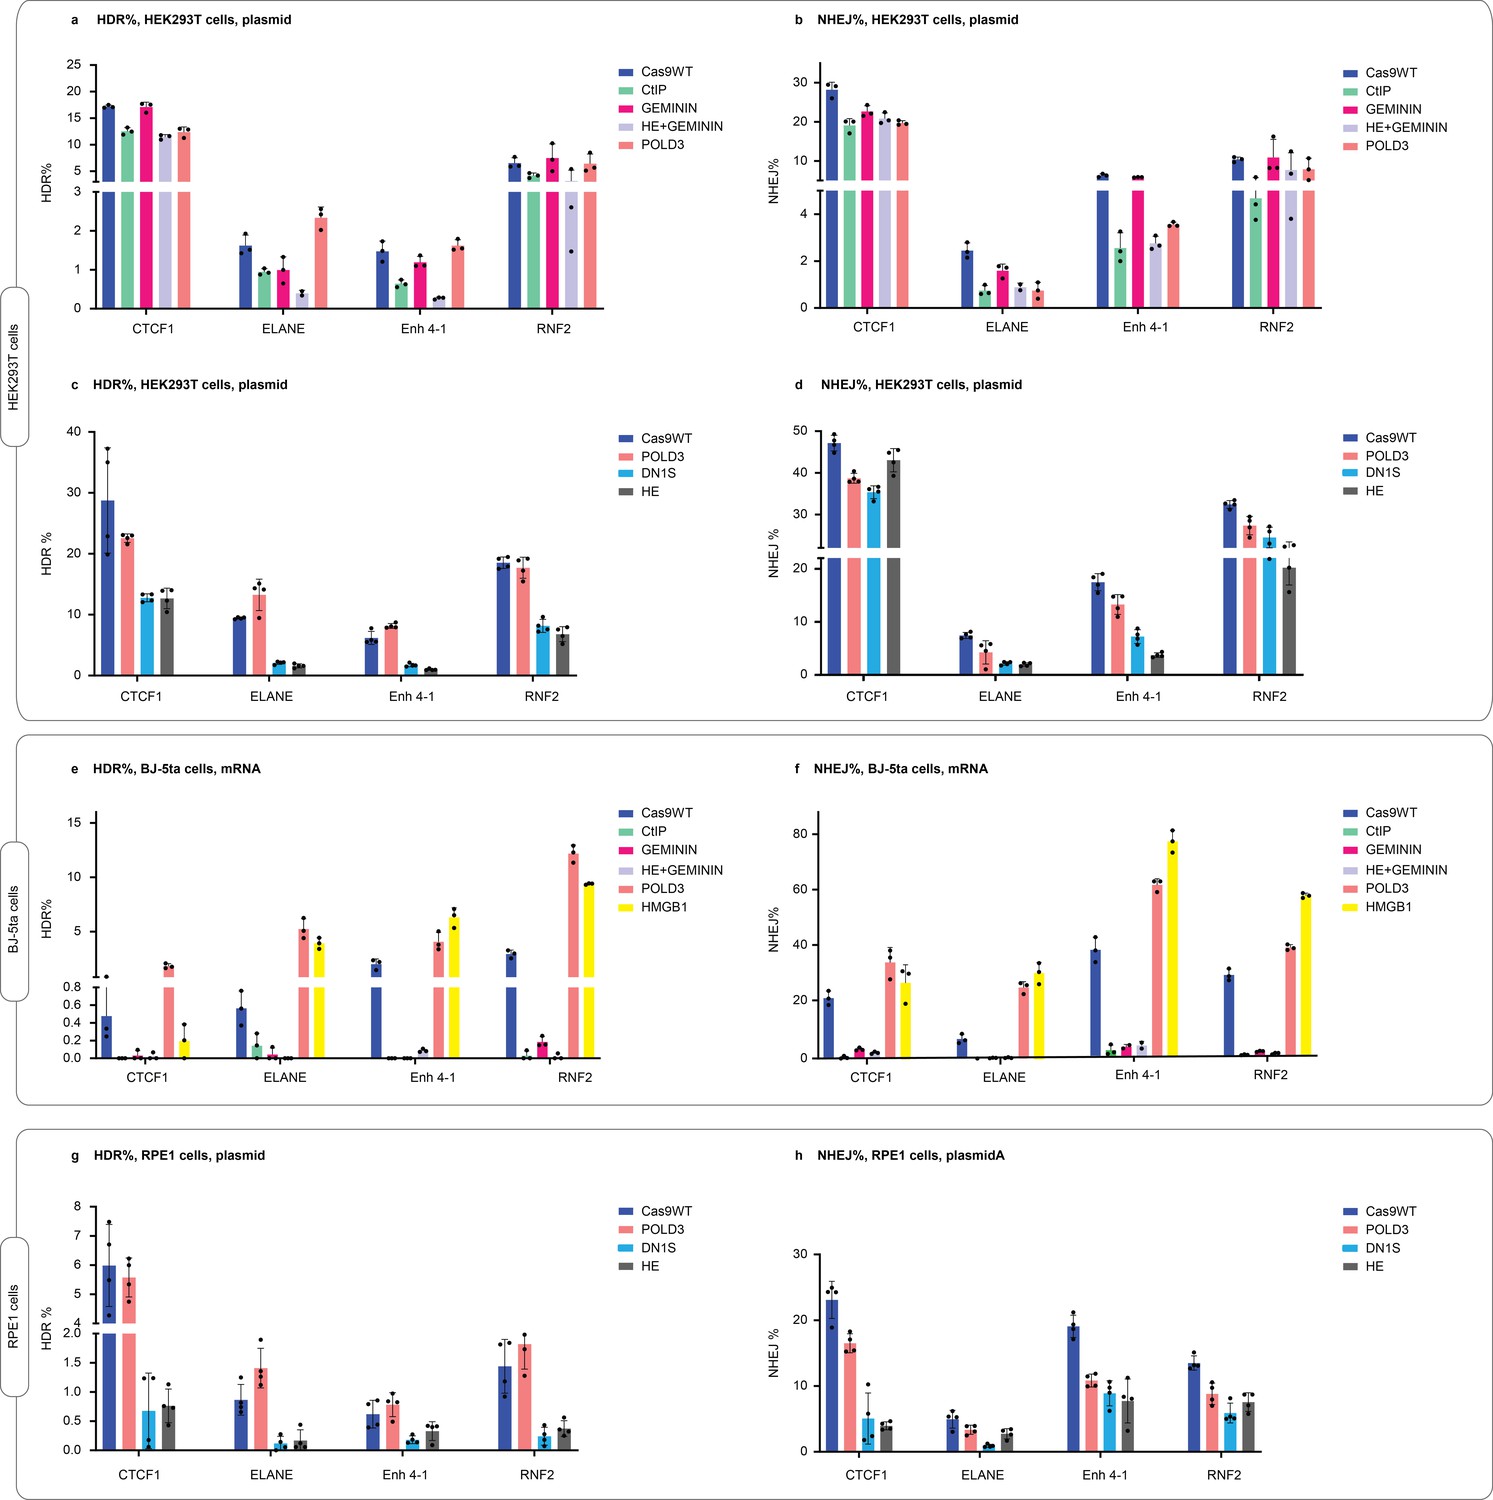
Comparison of Cas9-POLD3 fusions to previously published fusions in human embryonic kidney (HEK293T) cells, immortalized fibroblasts (BJ-5ta), and retinal pigment epithelium (RPE-1) cells.
HEK293T cells were electroporated with plasmids, sgRNA, and repair DNA. BJ-5ta cells were electroporated with mRNA and repair DNA, targeting sgRNA was stably expressed from the genome. RPE-1 cells were electroporated with plasmids, sgRNA, and repair DNA. Homology-directed repair (HDR) and non-homologous end-joining (NHEJ) editing were measured with droplet digital PCR (ddPCR). n = 3 (a,b,e,f) and n = 4 (c,d,g,h), one independent experiment, bar denotes mean value, error bars represent ± SD. The dataset is also presented in Figure 6b.
Figure 6—figure supplement 2
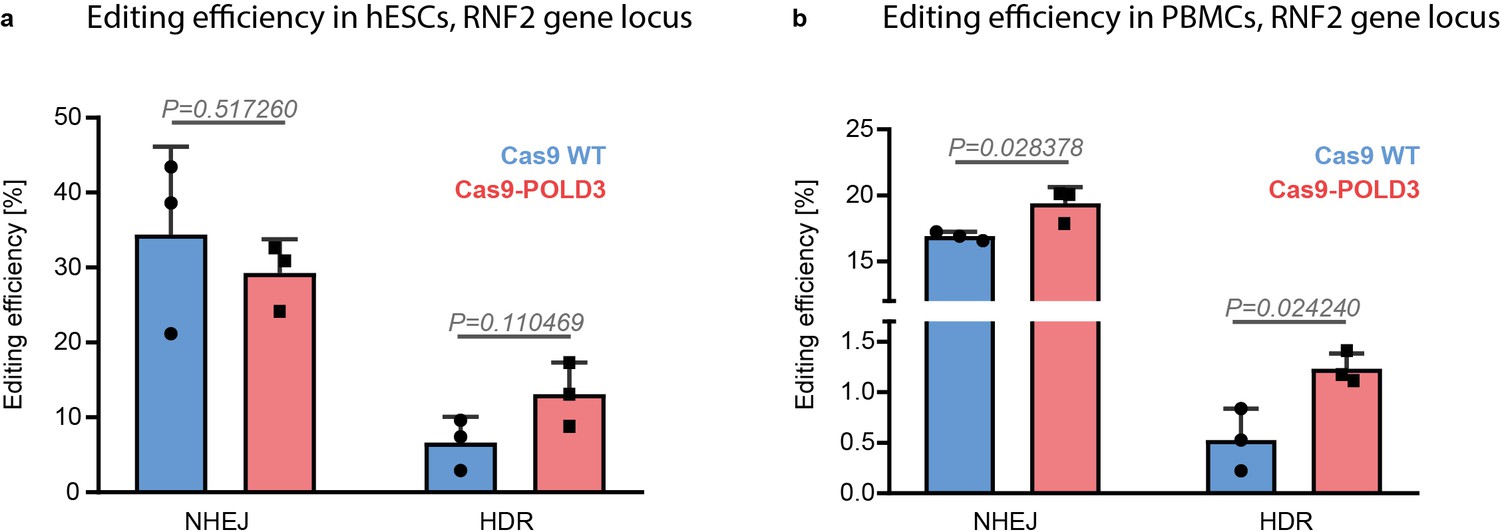
Cas9 fusion to DNA polymerase delta subunit 3 (Cas9-POLD3) editing performance in human embryonic stem cells (hESCs) and peripheral blood mononuclear cells (PBMCs).
(a) hESCs and (b) PBMCs were electroporated with Cas9WT and Cas9-POLD3 mRNA, sgRNA targeting the RNF2 locus, and repair DNA. Homology-directed repair (HDR) and non-homologous end-joining (NHEJ) editing were measured with droplet digital PCR (ddPCR). n = 3, one independent experiment, bar denotes mean value, error bars represent ± SD. Statistical significance is calculated with unpaired, two-sided Student’s t-test.
Additional files
-
Transparent reporting form
- https://cdn.elifesciences.org/articles/75415/elife-75415-transrepform1-v3.docx
-
Supplementary file 1
DNA repair domain library.
- https://cdn.elifesciences.org/articles/75415/elife-75415-supp1-v3.xlsx
-
Supplementary file 2
Mass spectrometry data.
- https://cdn.elifesciences.org/articles/75415/elife-75415-supp2-v3.xlsx
-
Supplementary file 3
Cas9 fusions - clustering of interactions.
- https://cdn.elifesciences.org/articles/75415/elife-75415-supp3-v3.docx
-
Supplementary file 4
Statistics.
- https://cdn.elifesciences.org/articles/75415/elife-75415-supp4-v3.xlsx
-
Supplementary file 5
CRISPR gRNA sequences.
- https://cdn.elifesciences.org/articles/75415/elife-75415-supp5-v3.docx
-
Supplementary file 6
FACS gating strategy.
- https://cdn.elifesciences.org/articles/75415/elife-75415-supp6-v3.docx
-
Supplementary file 7
ddPCR gating strategy and oligos.
- https://cdn.elifesciences.org/articles/75415/elife-75415-supp7-v3.docx
-
Supplementary file 8
Cas9 nuclease and GFP-BFP reporter cassette sequence.
- https://cdn.elifesciences.org/articles/75415/elife-75415-supp8-v3.docx
Download links
A two-part list of links to download the article, or parts of the article, in various formats.
Downloads (link to download the article as PDF)
Open citations (links to open the citations from this article in various online reference manager services)
Cite this article (links to download the citations from this article in formats compatible with various reference manager tools)
Rapid genome editing by CRISPR-Cas9-POLD3 fusion
eLife 10:e75415.
https://doi.org/10.7554/eLife.75415


