Modelling the response to vaccine in non-human primates to define SARS-CoV-2 mechanistic correlates of protection
- University of Bordeaux, Department of Public Health, Inserm Bordeaux Population Health Research Centre, Inria SISTM, France
- Center for Immunology of Viral, Auto-immune, Hematological and Bacterial Diseases (IMVA-HB/IDMIT), Université Paris-Saclay, Inserm, CEA, France
- Vaccine Research Institute, France
- Inserm U955, France
- Baylor Scott and White Research Institute, United States
- Virus & Immunity Unit, Department of Virology, Institut Pasteur, France
- CNRS UMR 3569, France
- Department of Medical Microbiology, Amsterdam UMC, University of Amsterdam Amsterdam Infection & Immunity Institute, Netherlands
- AP-HP, Hôpital Henri-Mondor Albert-Chenevier, Service d'Immunologie Clinique et Maladies Infectieuses, France
- CHU Bordeaux, Department of Medical information, France
Figures
Figure 1 with 5 supplements
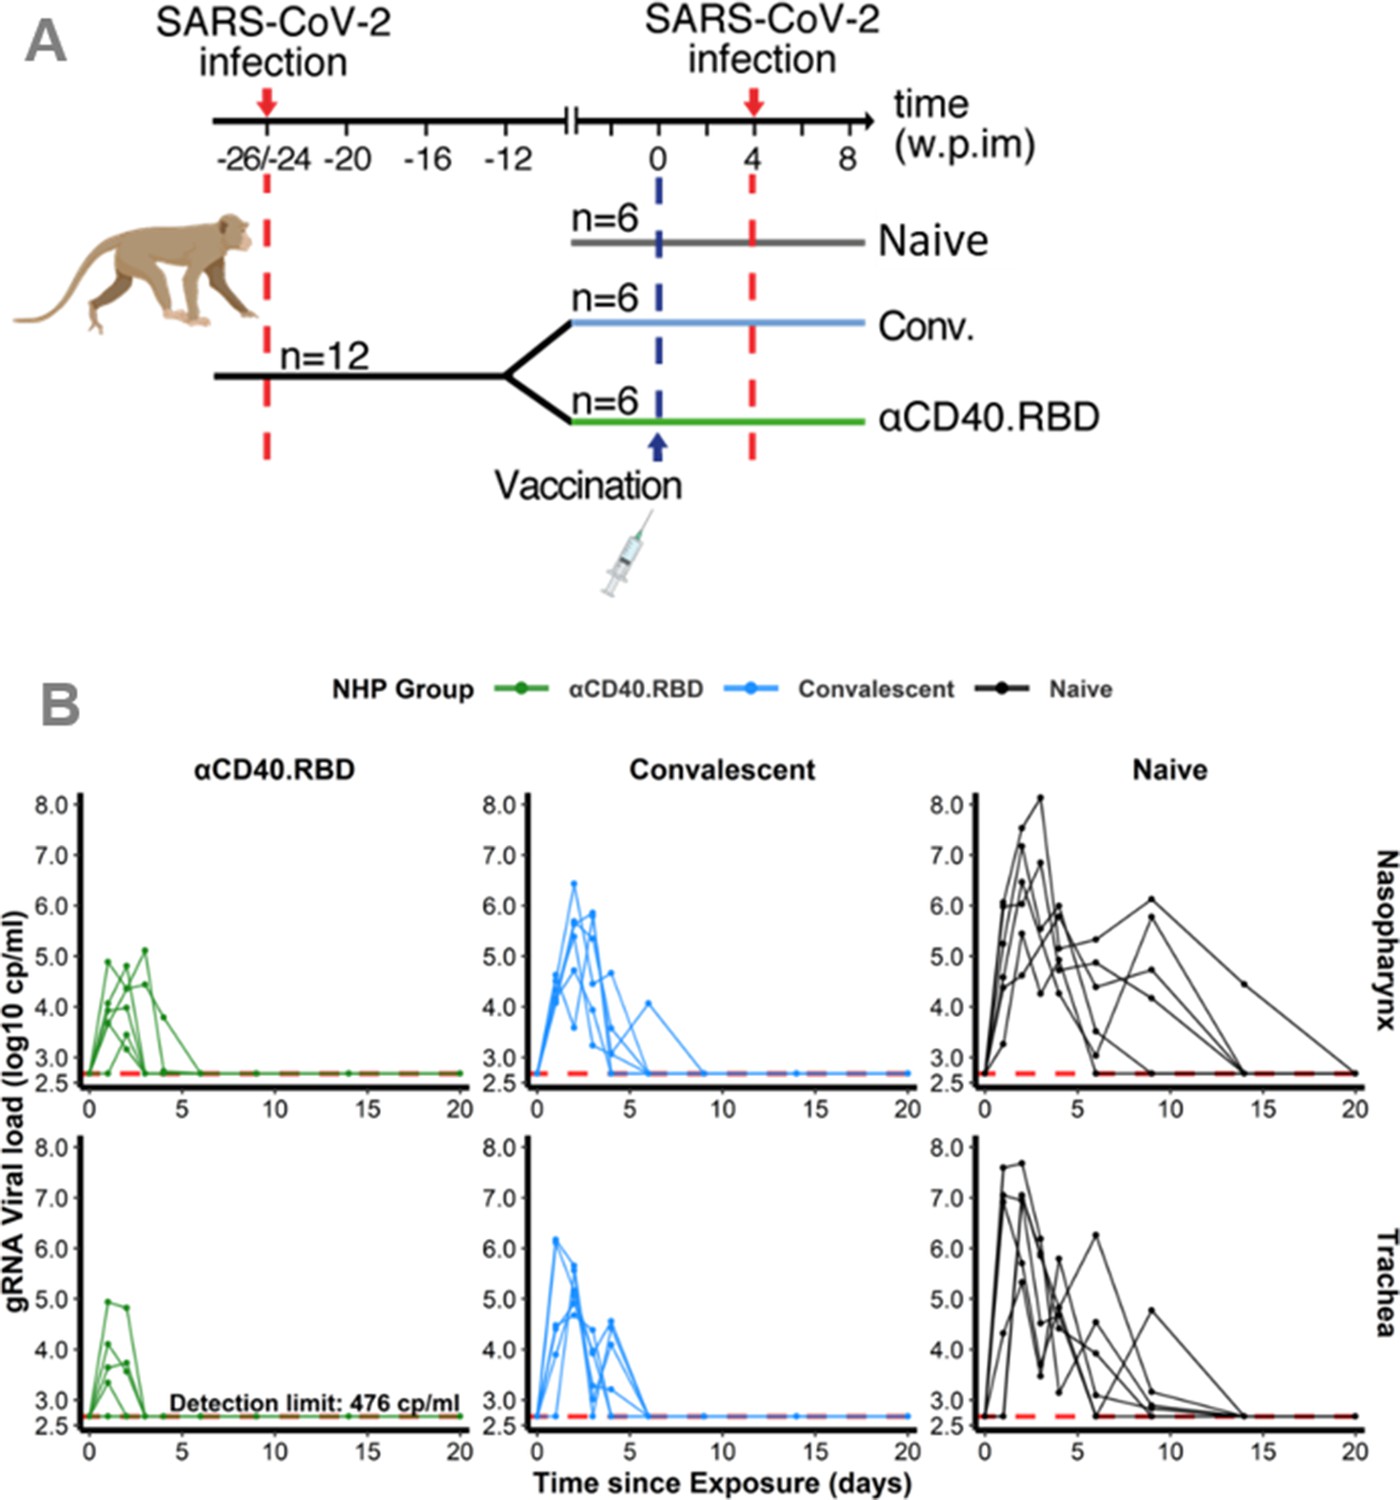
Design of the study 1 and viral dynamics.
(A) Study design. Cynomolgus macaques (Macaca fascicularis), aged 37–58 months (8 females and 13 males). 24–26 weeks post-infection with SARS-CoV-2, 12 of these animals were randomly assigned in two experimental groups. The convalescent-vaccinated group (n=6) received 200 µg of αCD40.RBD vaccine. The other six convalescent animals were used as controls. Additional six age matched (43.7 months±6.76) cynomolgus macaques from same origin were included in the study as controls naïve from any exposure to SARS-CoV-2. Four weeks after immunization, all animals were exposed to a total dose of 106 pfu of SARS-CoV-2 virus via the combination of intra-nasal and intra-tracheal routes. In this work, only data collected from the second exposure were considered. (B) Individual log10 transformed genomic RNA (gRNA) viral load dynamics in nasopharyngeal swabs (top) and tracheal swabs (bottom) after the initial exposure to SARS-CoV-2 in naïve macaques (black, right) and after the second exposure in convalescent (blue, middle) and αCD40.RBD-vaccinated convalescent (green, left) groups. Horizontal red dashed lines indicate the limit of quantification.
-
Figure 1—source data 1
Genomic RNA (gRNA) viral load longitudinally measured in the trachea and nasopharynx after the second exposure in the study 1.
- https://cdn.elifesciences.org/articles/75427/elife-75427-fig1-data1-v2.xlsx
-
Figure 1—source data 2
Genomic RNA (gRNA) viral load longitudinally measured in the trachea and nasopharynx after the first exposure for convalescent non-human primates (NHPs) in the study 1.
- https://cdn.elifesciences.org/articles/75427/elife-75427-fig1-data2-v2.xlsx
-
Figure 1—source data 3
Anti-spike IgG longitudinally measured post-immunization and quantified by Luminex in the study 1.
- https://cdn.elifesciences.org/articles/75427/elife-75427-fig1-data3-v2.xlsx
-
Figure 1—source data 4
Quantification of the spike/ACE2-binding inhibition longitudinally measured post-immunization and quantified by Mesoscale Discovery (MSD) assay (in 1/ECL) in the study 1.
- https://cdn.elifesciences.org/articles/75427/elife-75427-fig1-data4-v2.xlsx
-
Figure 1—source data 5
Anti-N and anti-RBD binding antibodies longitudinally measured post-immunization and quantified by Mesoscale Discovery (MSD) assay (in AU mL–1) in the study 1.
- https://cdn.elifesciences.org/articles/75427/elife-75427-fig1-data5-v2.xlsx
-
Figure 1—source data 6
Subgenomic RNA (sgRNA) viral load longitudinally measured in the trachea and nasopharynx after the second exposure in the study 1.
- https://cdn.elifesciences.org/articles/75427/elife-75427-fig1-data6-v2.xlsx
-
Figure 1—source data 7
Antigen-specific T-cell response longitudinally measured post-exposure in % of CD4+ T cells measured by ICS in the study 1.
- https://cdn.elifesciences.org/articles/75427/elife-75427-fig1-data7-v2.xlsx
-
Figure 1—source data 8
Antigen-specific T-cell response longitudinally measured post-exposure in % of CD8+ T cells measured by ICS in the study 1.
- https://cdn.elifesciences.org/articles/75427/elife-75427-fig1-data8-v2.xlsx
-
Figure 1—source data 9
T-cell response expressing IFN-γ longitudinally measured post-exposure by ELISpot in the study 1.
- https://cdn.elifesciences.org/articles/75427/elife-75427-fig1-data9-v2.xlsx
-
Figure 1—source data 10
Cytokine concentrations measured post-exposure in the study 1.
- https://cdn.elifesciences.org/articles/75427/elife-75427-fig1-data10-v2.xlsx
-
Figure 1—source data 11
Quantification of the neutralization function of antibodies against three variants (B117, B1351, and D614G) longitudinally measured post-exposition (in ED50) in the study 1.
- https://cdn.elifesciences.org/articles/75427/elife-75427-fig1-data11-v2.xlsx
Figure 1—figure supplement 1
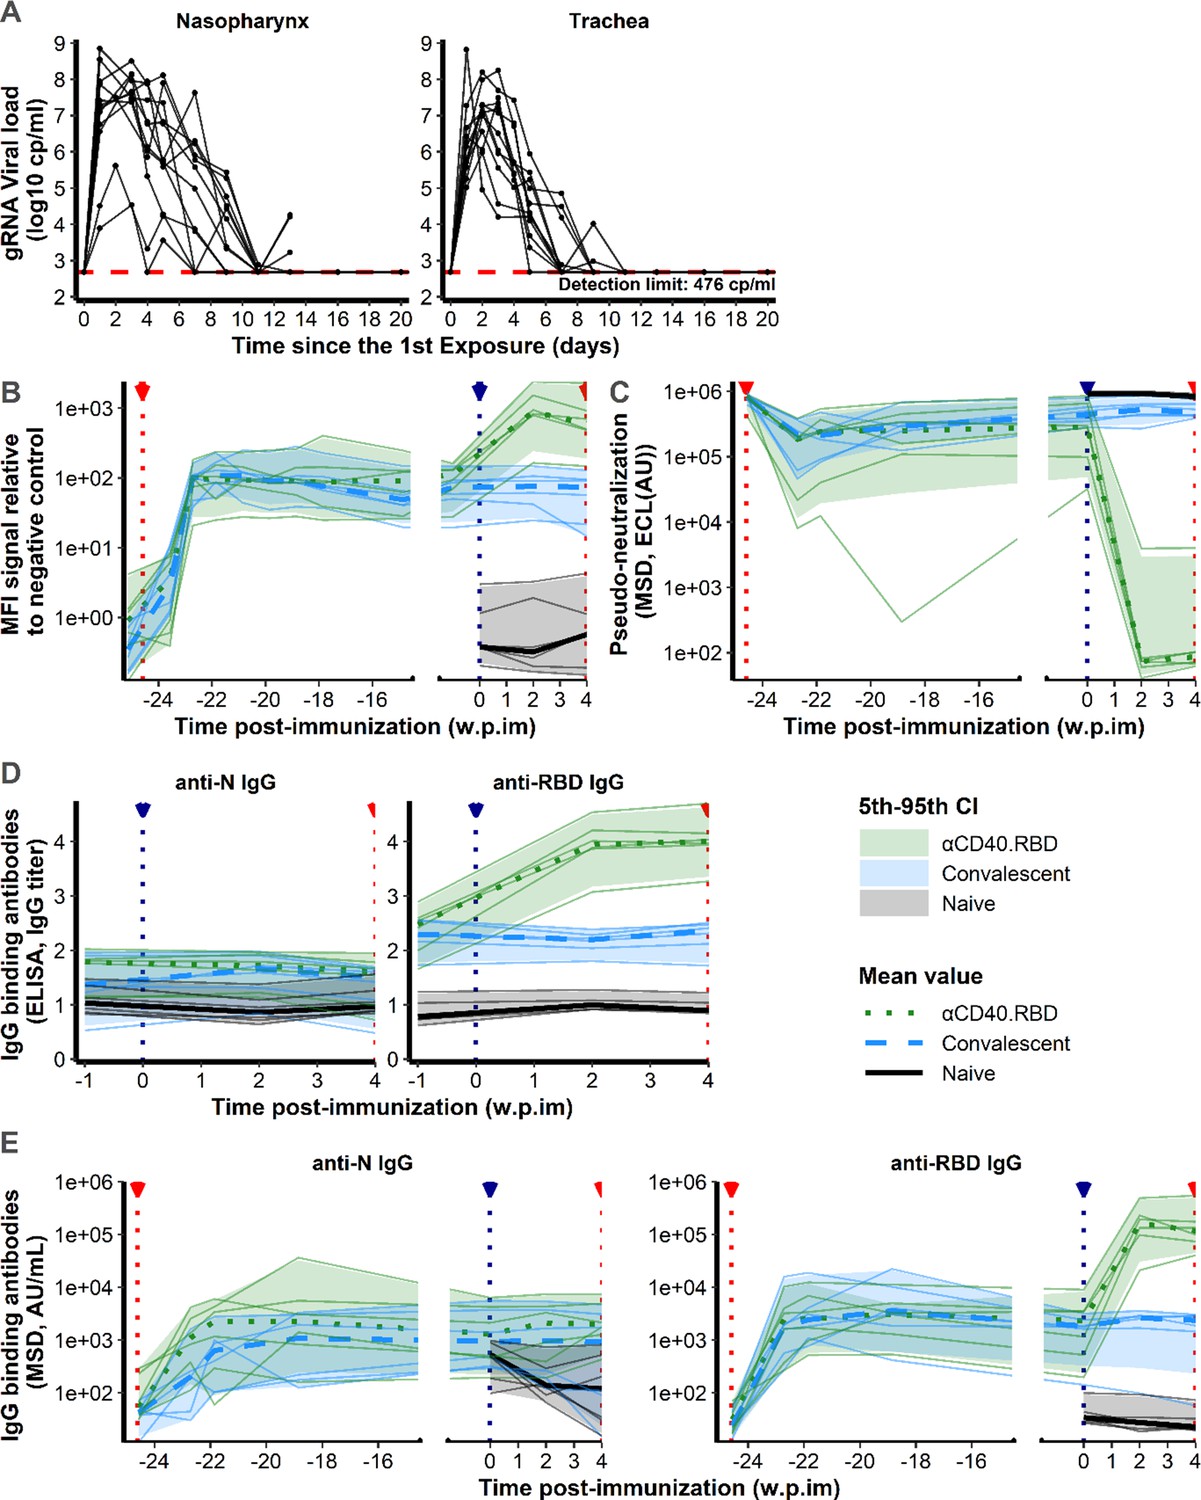
Viral dynamics after the first exposure to SARS-CoV-2 and biomarker measurements from the first to the second exposure to SARS-CoV-2.
(A) Individual log10 transformed genomic RNA (gRNA) viral load dynamics in nasopharyngeal (left) and tracheal (right) swabs after the initial exposure to SARS-CoV-2 in naïve macaques (n=12). Solid lines represent individual values. Horizontal red dashed lines indicate the limit of quantification. (B) Relative MFI of IgG binding to SARS-CoV-2 spike protein, measured using a Luminex-based serology assay, in serum samples, after the initial exposure to SARS-CoV-2. (C) Quantification of antibodies inhibiting the attachment of spike protein to ACE2 receptor in non-human primate (NHP) serum, measured by the Mesoscale Discovery (MSD, Rockville, MD) pseudo-neutralization assay. Results are expressed as ECL (electro-chemiluminescence) in AU. (D) Quantification of SARS-CoV-2 IgG-binding N or RBD measured in the serum of NHPs titrated by ELISA assay. Results are expressed in IgG titer. (E) Quantification of SARS-CoV-2 IgG-binding N and RBD domain measured in the serum of non-human primates (NHPs) using a multiplexed solid-phase chemiluminescence assay. Results are expressed in AU mL–1. (B–E) Results are obtained after the initial exposure to SARS-CoV-2 at –24.9 weeks post-immunization (w.p.im) in convalescent (n=6, blue, dashed line) and αCD40.RBD-vaccinated convalescent (n=6, green, dotted line) animals and at 4 w.p.im in naïve (n=6, black, solid line) animals. Thin lines represent individual values. Thick lines indicate medians within each group and shaded areas indicate 5th–95th confidence intervals. The red (–24.6 and 4.0 w.p.im) and blue (0 w.p.im) lines highlight viral exposure and vaccination, respectively.
Figure 1—figure supplement 2
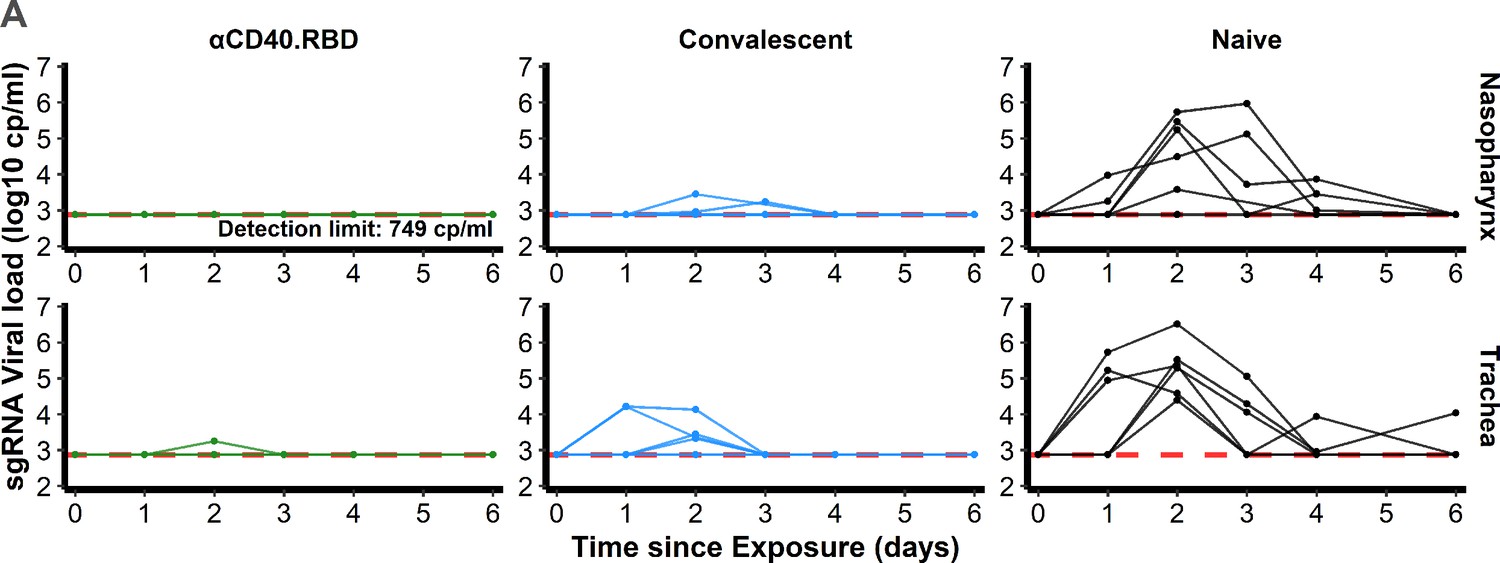
Subgenomic viral dynamics after the second exposure to SARS-CoV-2.
Individual log10 transformed subgenomic (gRNA) viral load dynamics in nasopharyngeal (top) and tracheal (bottom) swabs after the initial exposure to SARS-CoV-2 in naïve macaques (n=6, black, right) and after the second exposure in convalescent (n=6, blue, middle) and αCD40.RBD-vaccinated convalescent (n=6, green, left) groups. Horizontal red dashed lines indicate the limit of quantification.
Figure 1—figure supplement 3
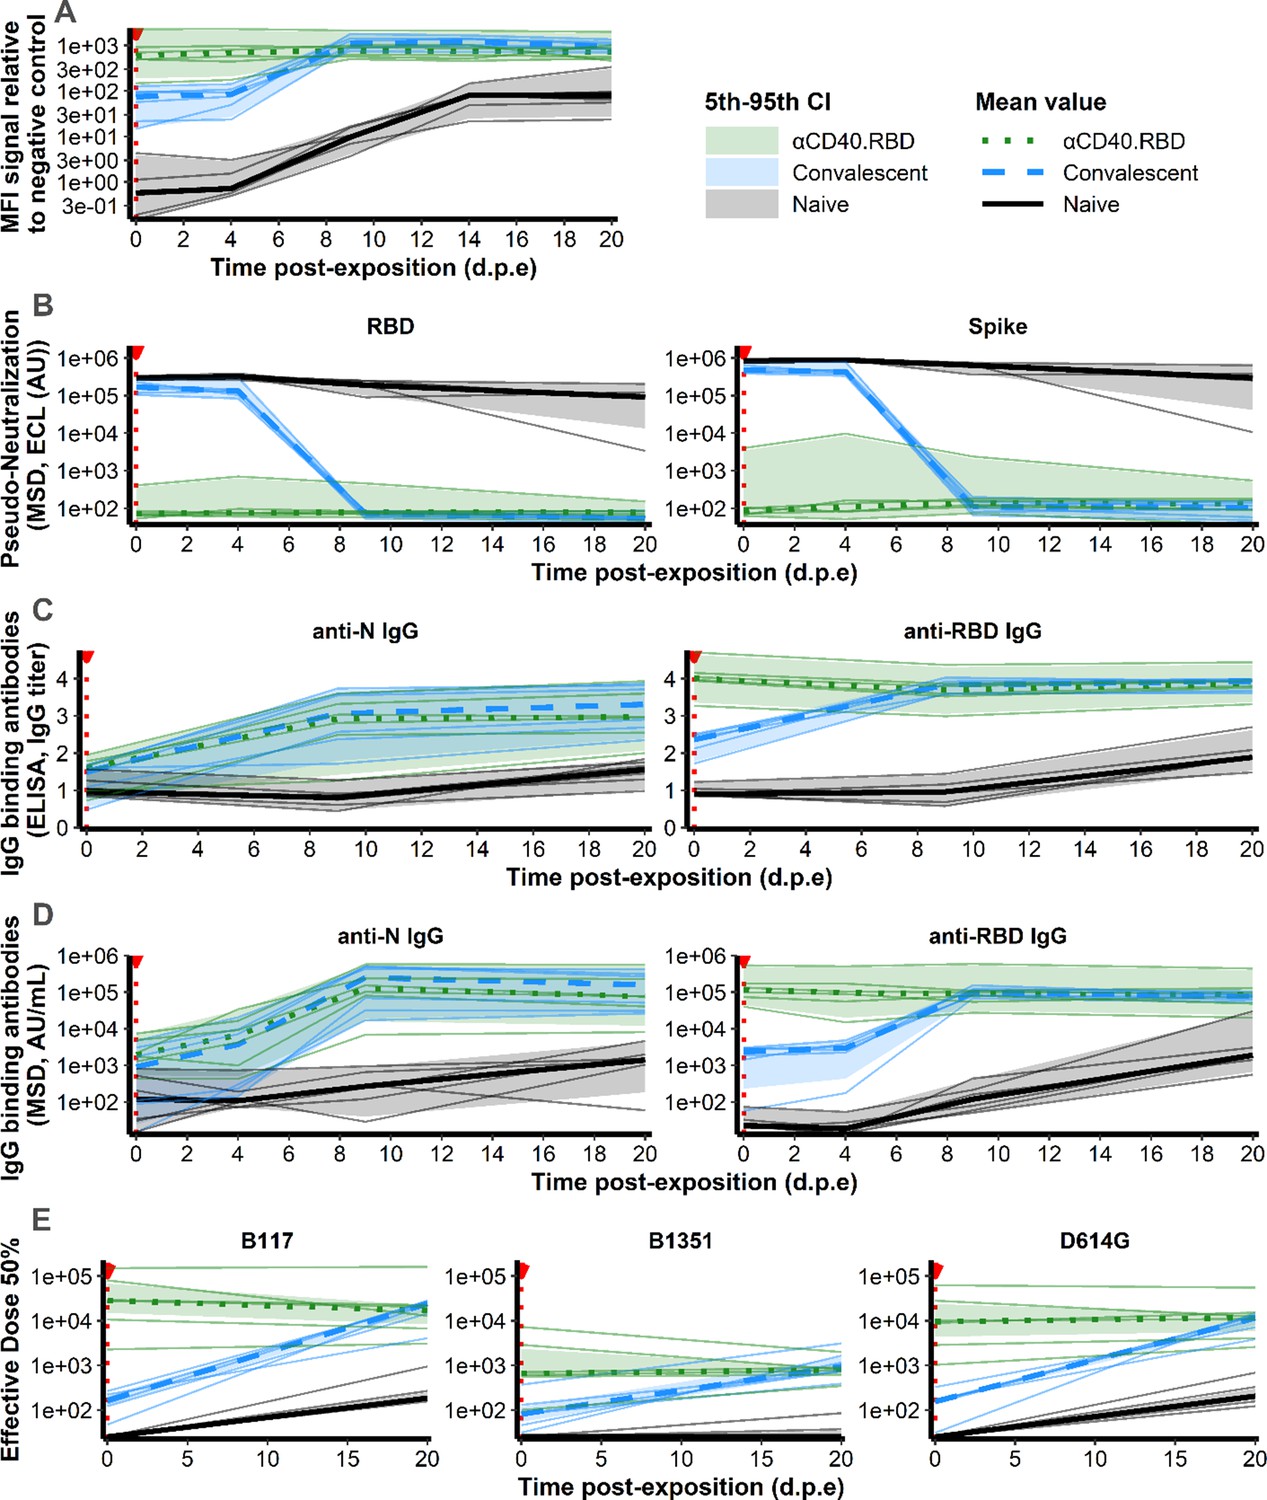
Antibody measurements after the second exposure to SARS-CoV-2.
(A) Relative MFI of IgG binding to SARS-CoV-2 spike protein, measured using a Luminex-based serology assay, in serum samples, after the second exposure to SARS-CoV-2. (B) Quantification of antibodies inhibiting that attachment of receptor-binding domain (RBD) or spike protein to ACE2 receptor in non-human primate (NHP) serum, measured by the Mesoscale Discovery (MSD, Rockville, MD) pseudo-neutralization assay, after the second exposure to SARS-CoV-2. Results are expressed as electro-chemiluminescence (ECL), in arbitrary unit (AU). (C) Quantification of SARS-CoV-2 IgG-binding N or RBD domain measured in the serum of NHPs titrated by ELISA assay, after the second exposure to SARS-CoV-2. Results are expressed in Ig titer. (D) Quantification of SARS-CoV-2 IgG-binding N or RBD domain measured in the serum of NHPs using a multiplexed solid-phase chemiluminescence assay, after the second exposure to SARS-CoV-2. Results are expressed in AU mL–1. (E) Quantification of neutralizing antibodies against B.1.1.7, B.1.351, and D614G SARS-CoV-2 strains measured in the serum of NHPs using S-Fuse neutralization assay, after the second exposure to SARS-CoV-2 (measured only at the exposure and 20 days post-exposure [d.p.e.]). Results are expressed as ED50 (effective dose 50%). (A–E) Results are obtained after the initial exposure to SARS-CoV-2 in naïve macaques (n=6, black, solid line) and after the second exposure in convalescent (n=6, blue, dashed line) and αCD40.RBD-vaccinated convalescent (n=6, green, dotted line) animals. Thin lines represent individual values. Thick lines indicate medians within each group and shaded areas indicate 5th–95th confidence intervals. Red dotted vertical lines highlight the viral exposure.
Figure 1—figure supplement 4
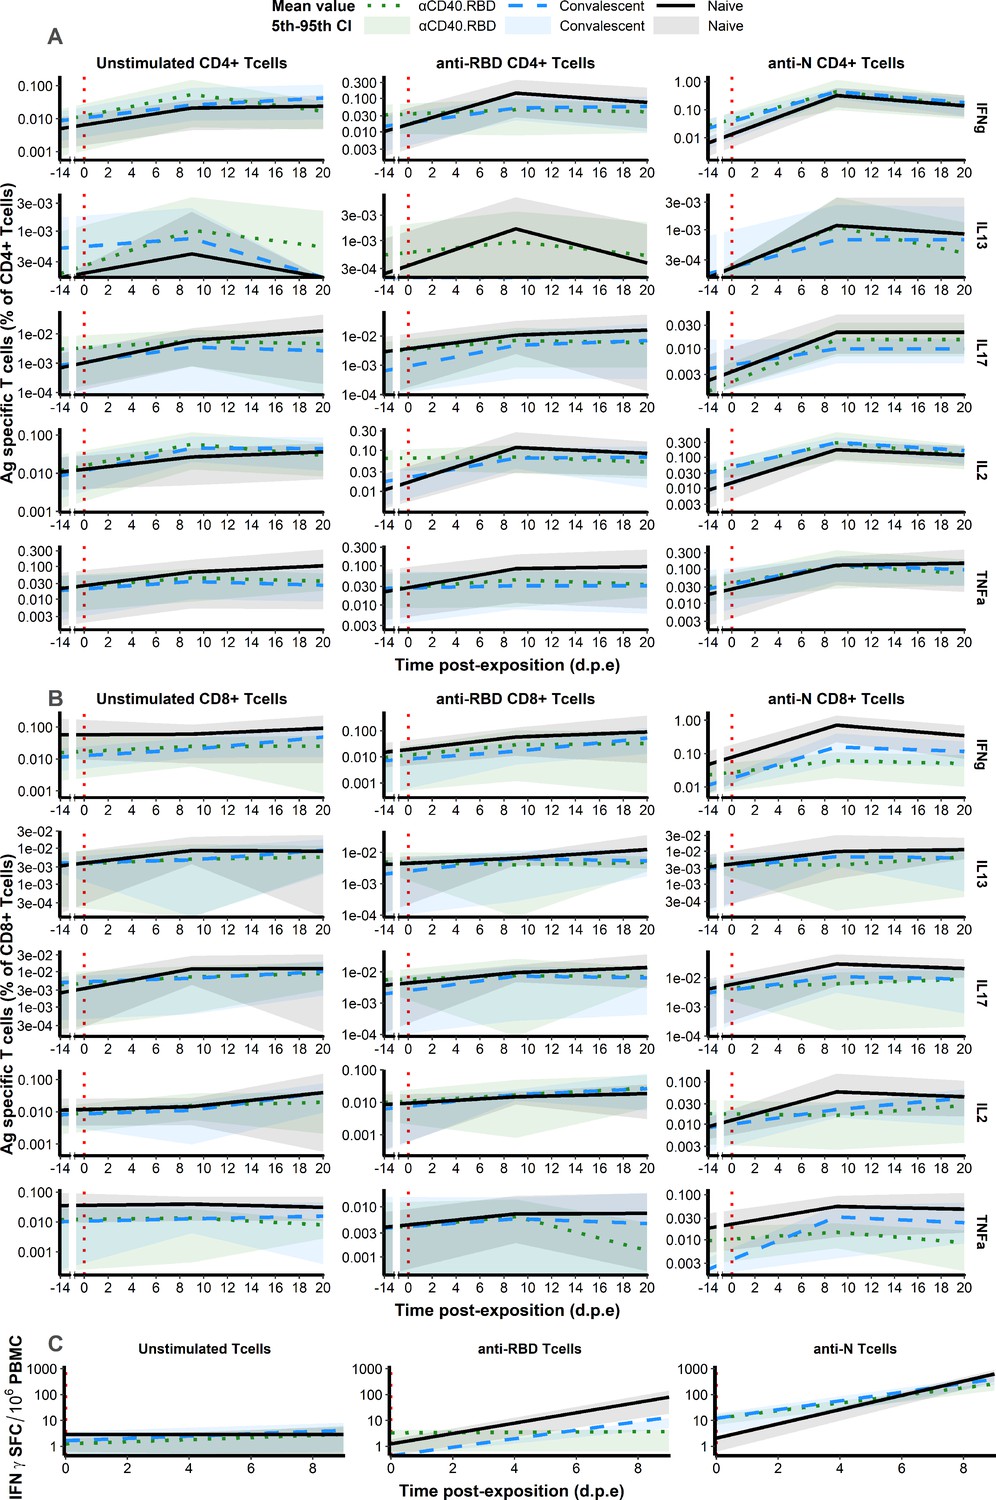
Antigen-specific T-cell responses in non-human primates (NHPs) after the second exposure to SARS-CoV-2.
(A–B) Frequency of IFN-γ+ (fist line), IL-13+ (second line), IL-17+ (third line), IL-2+ (fourth line), or TNF-α+ (fifth line) antigen-specific CD4+ T cells (CD154+) and CD8+ T cells (CD137+) in the total CD4+ T cell (A) or CD8+ T cell (B) population in NHP serum. PBMCs were stimulated ex vivo overnight with medium (left), SARS-CoV-2 RBD (middle), or N (right) overlapping peptide pools. T-cell responses being not measures at the challenge, measured obtained 14 days pre-exposure were added. (C) Antigen-specific T-cell responses in NHPs. T-cells were analyzed by ELISpot after ex vivo stimulation with SARS-CoV-2 RBD or N overlapping peptide pools and plotted as spot-forming cells (SFC) per 1.0 × 10⁶ PBMCSs. (A–C) Results are obtained after the initial exposure to SARS-CoV-2 in naïve macaques (n=6, black, solid line) and after the second exposure in convalescent (n=6, blue, dashed line) and αCD40.RBD-vaccinated convalescent (n=6, green, dotted line) animals. Thin lines represent individual values. Thick lines indicate medians within each group and shaded areas indicate 5th–95th confidence intervals. Red dotted vertical lines highlight the viral exposure.
Figure 1—figure supplement 5
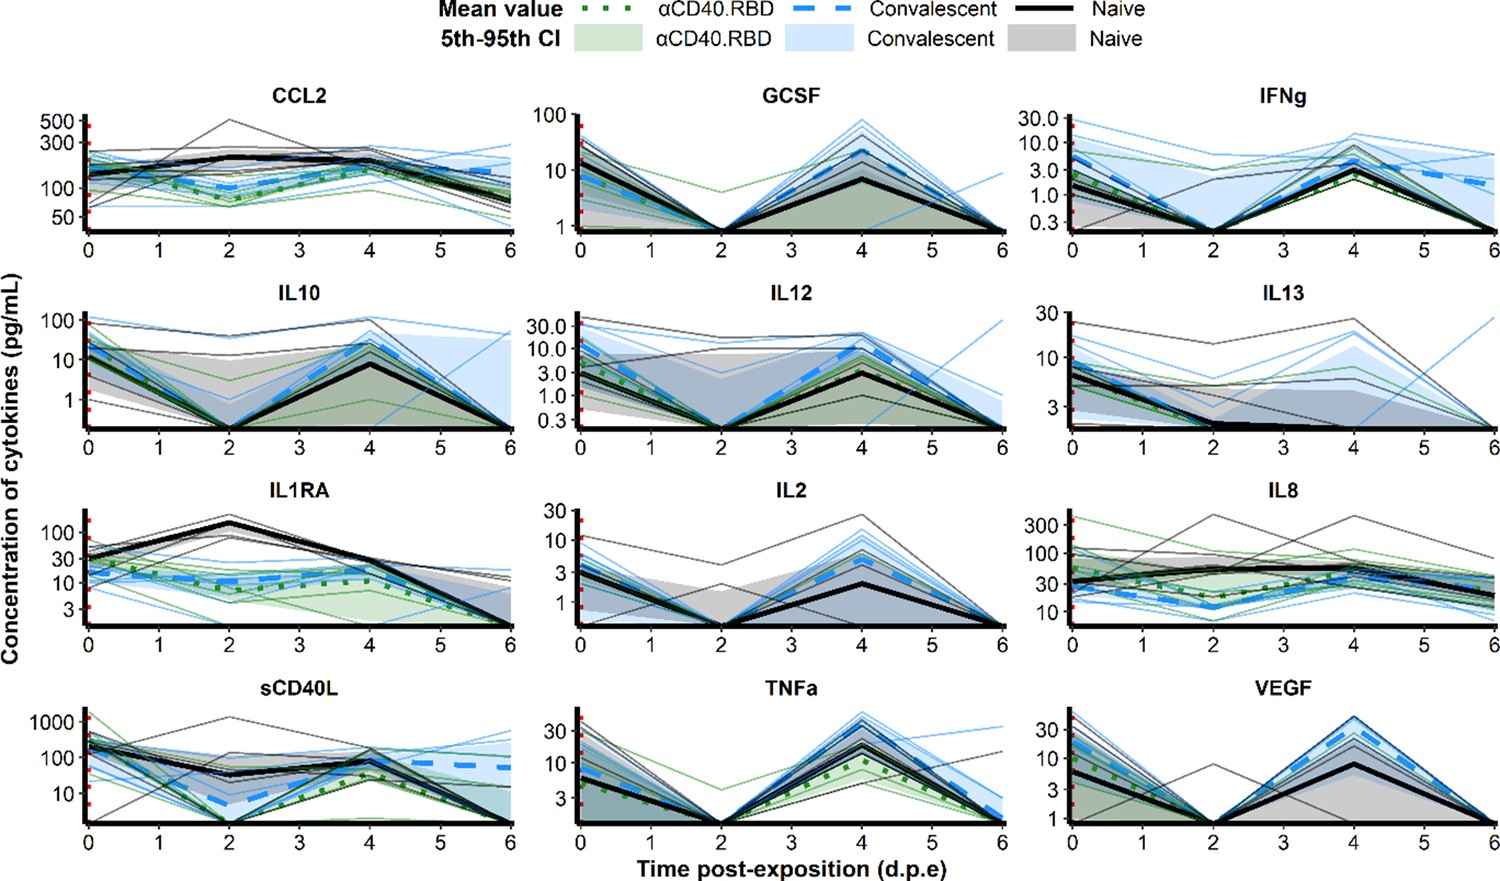
Cytokines and chemokines in the plasma in non-human primates (NHPs) after the second exposure to SARS-CoV-2.
Plasma concentration of 12 cytokines and chemokines in pg mL–1. Results are obtained after the initial exposure to SARS-CoV-2 in naïve macaques (n=6, black, solid line) and after the second exposure in convalescent (n=6, blue, dashed line) and αCD40.RBD-vaccinated convalescent (n=6, green, dotted line) animals. Thin lines represent individual values. Thick lines indicate medians within each group and shaded areas indicate 5th–95th confidence intervals. Red dotted vertical lines highlight the viral exposure.
Figure 2 with 2 supplements
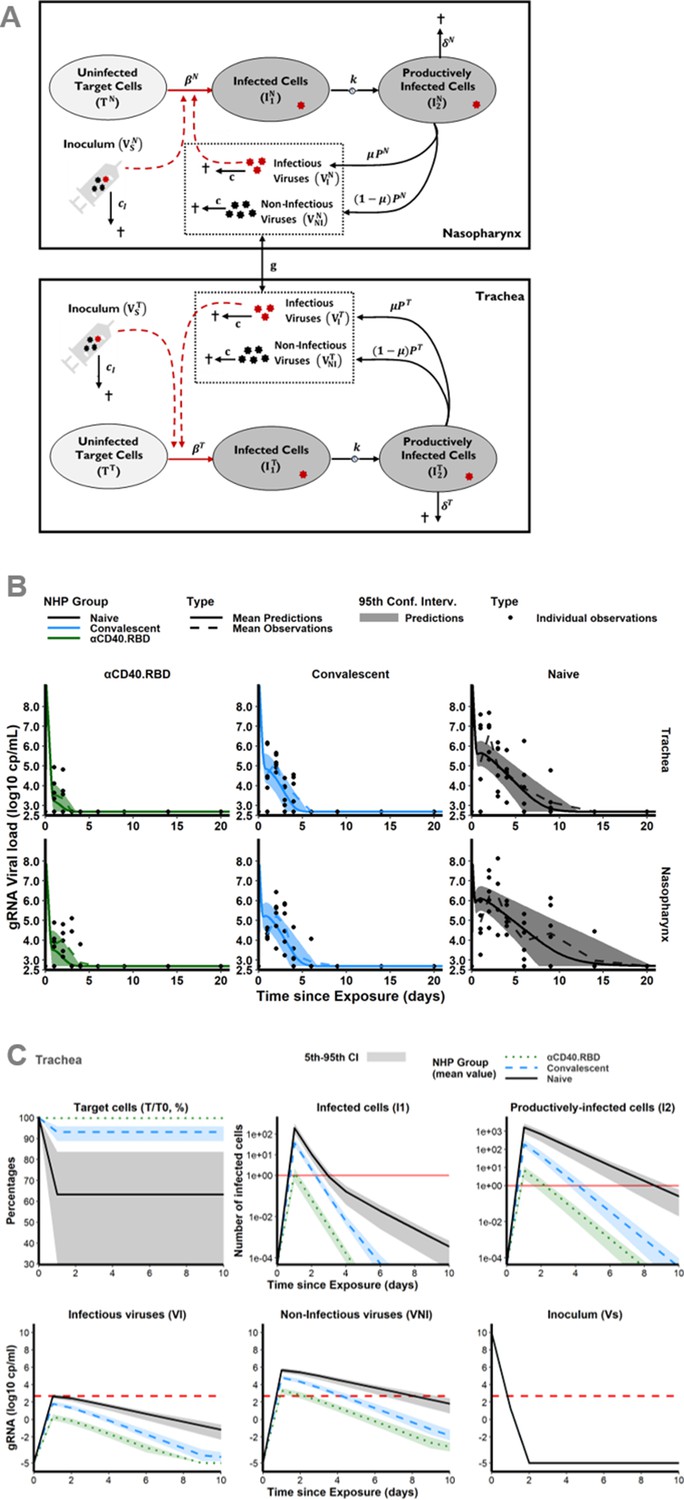
Mechanistic modelling.
(A) Description of the model in the two compartments: the nasopharynx and the trachea. (B) Model fit to the log10 transformed observed genomic RNA (gRNA) viral loads in tracheal (top) and nasopharyngeal (bottom) compartments after the initial exposure to SARS-CoV-2 in naïve macaques (black, right) and after the second exposure in convalescent (blue, middle) and vaccinated (green, left) animals. Thick solid and dashed lines indicate mean viral load dynamics predicted and observed, respectively. Shaded areas indicate the 95% confidence intervals of the predictions. Dots represents observations. (C) Model predictions of unobserved quantities in the tracheal compartment for naïve (black, solid lines), convalescent (blue, dashed lines) and vaccinated (green, dotted lines) animals: target cells as percentage of the value at the challenge (top, left), infected cells (top, middle), productively infected cells (top, right), inoculum (bottom, right), infectious (bottom, left) and non-infectious virus (bottom, middle). Thick lines indicate mean values over time within each group. Shaded areas indicate the 95% confidence interval. Horizontal dashed red lines indicate the limit of quantification and horizontal solid red lines highlight the threshold of one infected cell.
-
Figure 2—source data 1
Volumes of the trachea and nasopharynx, and weights measured at the time of exposure in four non-human primates (NHPs) in the study 1.
- https://cdn.elifesciences.org/articles/75427/elife-75427-fig2-data1-v2.xlsx
-
Figure 2—source data 2
Weights of the 18 non-human primates (NHPs) in the study 1.
- https://cdn.elifesciences.org/articles/75427/elife-75427-fig2-data2-v2.xlsx
-
Figure 2—source data 3
Genomic RNA (gRNA) viral load measured in the trachea and nasopharynx in the two additional non-human primates (NHPs) receiving inoculum via intra-gastric and intra-nasal routes.
- https://cdn.elifesciences.org/articles/75427/elife-75427-fig2-data3-v2.xlsx
Figure 2—figure supplement 1
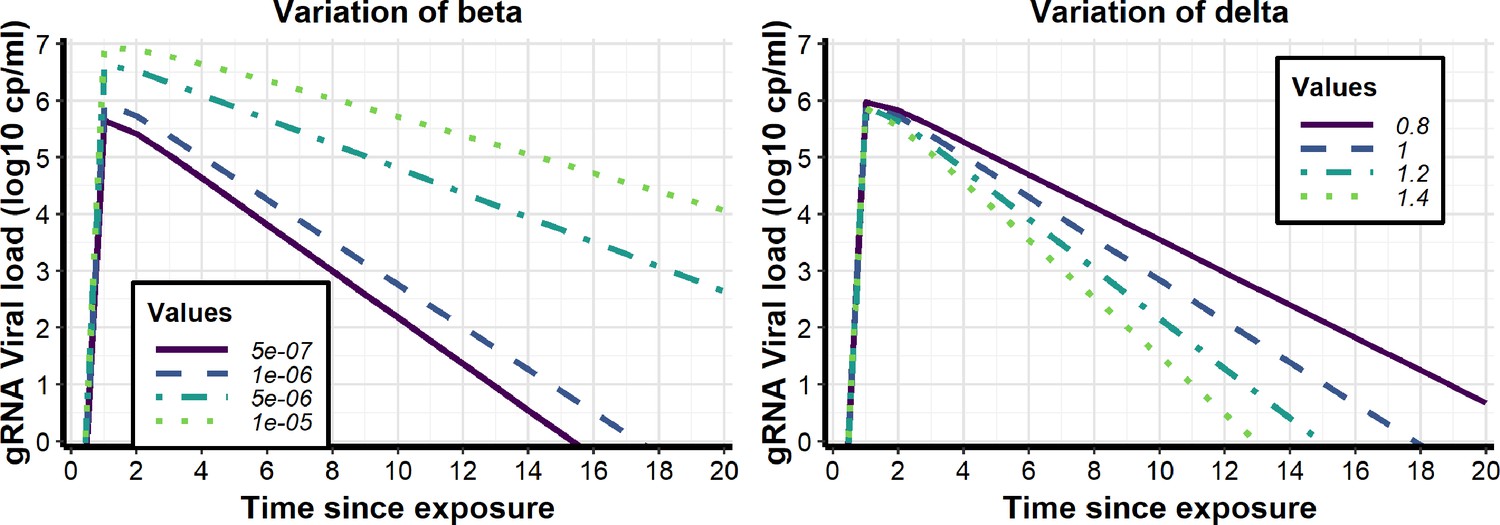
Modelling of the viral dynamics using mechanistic model.
Examples simulated genomic viral load dynamics for different values of viral infectivity (β, left) or loss rate of infected cells (δ, right) showing the effect of either blocking de novo infection or promoting the destruction of infected cells on viral dynamics profile. Except for β or δ, all other parameters were fixed at a given value.
Figure 2—figure supplement 2
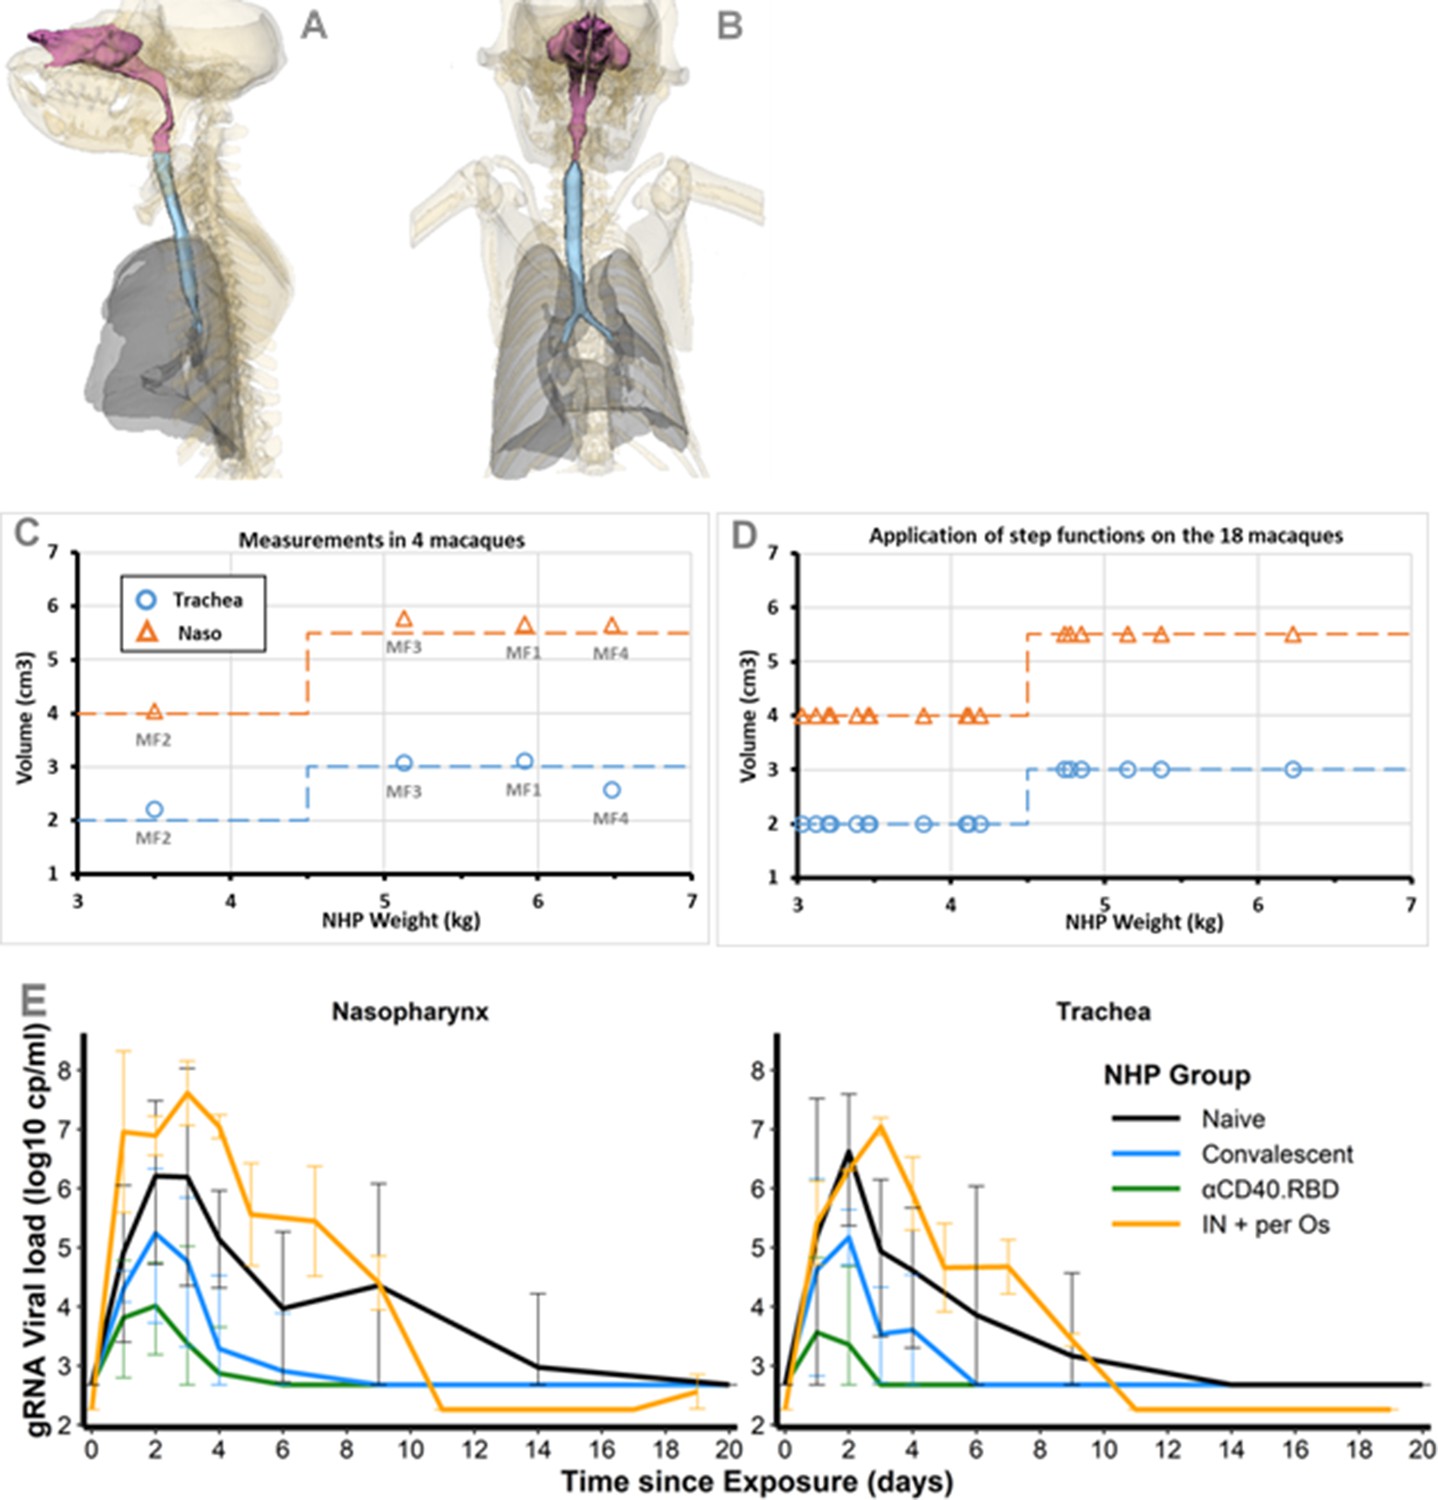
Modelling of the dynamics of viral replication.
(A) Sagittal view of the 3D representation of the non-human primate (NHP) respiratory system. (B) Coronal view of the 3D representation of the NHP respiratory system. (A–B) Lungs are colored in gray, Trachea and nasal regions in blue and purple, respectively. (C) Relationship between the weights (in kg) measured in four NHPs and the estimation of the volume of their tracheal (blue circles) and nasal (orange triangles) regions (in cm3). Measurements were obtained on NHPs similar to the 18 macaques of our study. Orange and blue dashed lines represent the step function used to describe this relationship with a breakpoint at 4.5 kg. (D) Volumes of the tracheal (blue circles) and nasal (orange triangles) regions estimated for the 18 macaques using the step function defined in the subfigure C and their weights. (E) Mean genomic RNA (gRNA) load dynamics in nasopharyngeal (left) and tracheal (right) swabs after the initial exposure to SARS-CoV-2 in naïve macaques (n=6, black) and after the second exposure in convalescent (n=6, blue) and αCD40.RBD-vaccinated convalescent (n=6, green) macaques. Two additional macaques (IN + per Os, orange) were initially exposed to SARS-CoV-2 via intra-nasal (0.5 mL of inoculum) and intra-gastric (4.5 mL) routes instead of intra-nasal (0.5 mL of inoculum) and intra-tracheal (4.5 mL) routes as defined in the study. Solid lines represent mean values and error bars indicate the 5th–95th confidence intervals.
Figure 3
Harvest times and measurements.
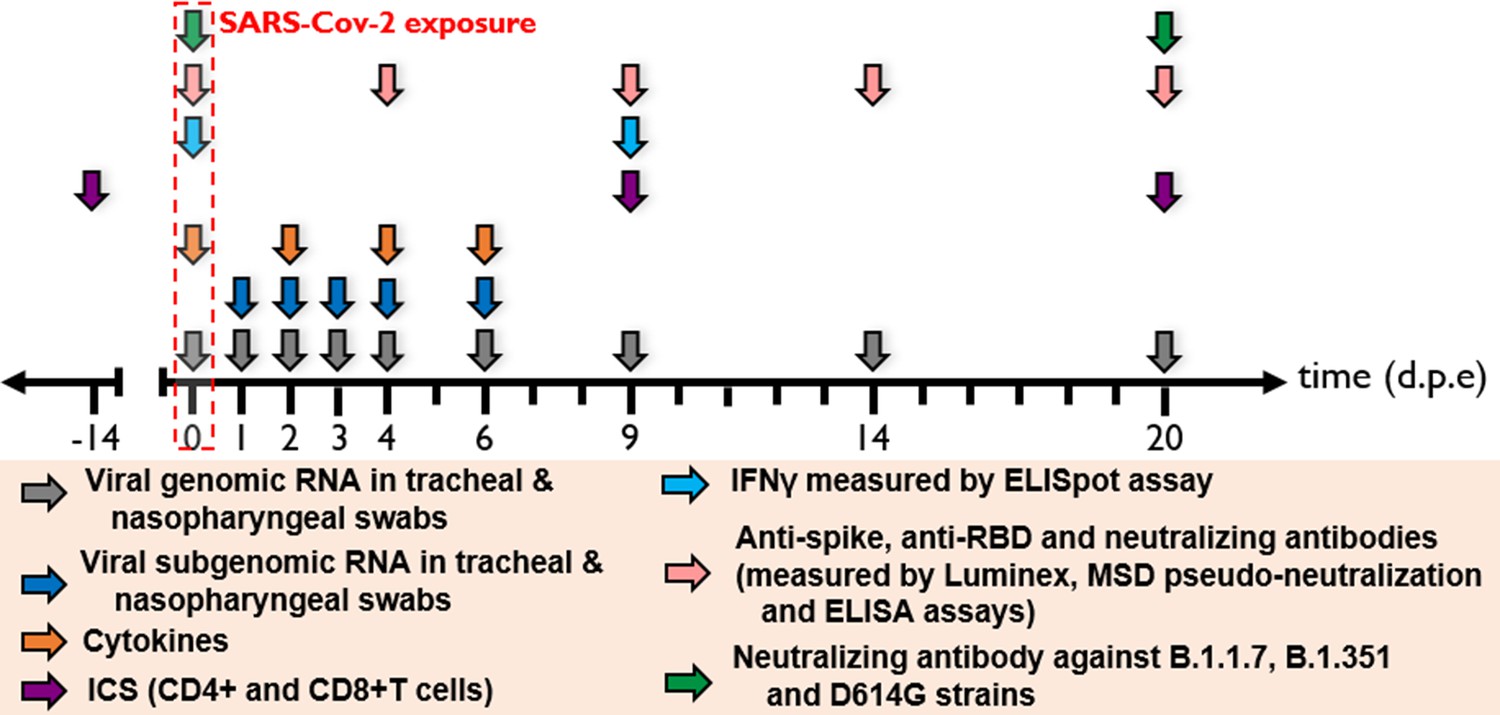
Nasopharyngeal and tracheal fluids were collected at 0, 1, 2, 3, 4, 6, 9, 14, and 20 days post-exposure (d.p.e) while blood was taken at 0, 2, 4, 6, 9, 14, and 20 d.p.e. Genomic and subgenomic viral loads were measured by RT-qPCR. Anti-spike IgG sera were titrated by multiplex bead assay, anti-RBD, and anti-nucleocapside (N) IgG were titrated using a commercially available multiplexed immunoassay developed by Mesoscale Discovery (MSD, Rockville, MD). The MSD pseudo-neutralization assay was used to measure antibodies neutralizing the binding of the spike protein and receptor-binding domain (RBD) to the ACE2 receptor. Neutralizing antibodies against B.1.1.7, B.1.351, and D614G strains were measured by S-Fuse neutralization assay and expressed as ED50 (effective dose 50%). T-cell responses were characterized as the frequency of PBMC expressing cytokines (IL-2, IL-17a, IFN-γ, TNF-α, IL-13, CD137, and CD154) after stimulation with S or N sequence overlapping peptide pools. IFN-γ ELISpot assay of PBMCs were performed on PBMC stimulated with RBD or N sequence overlapping peptide pools and expressed as spot-forming cell (SFC) per 1.0 × 10⁶ PBMC.
Figure 4 with 2 supplements
Immune markers.
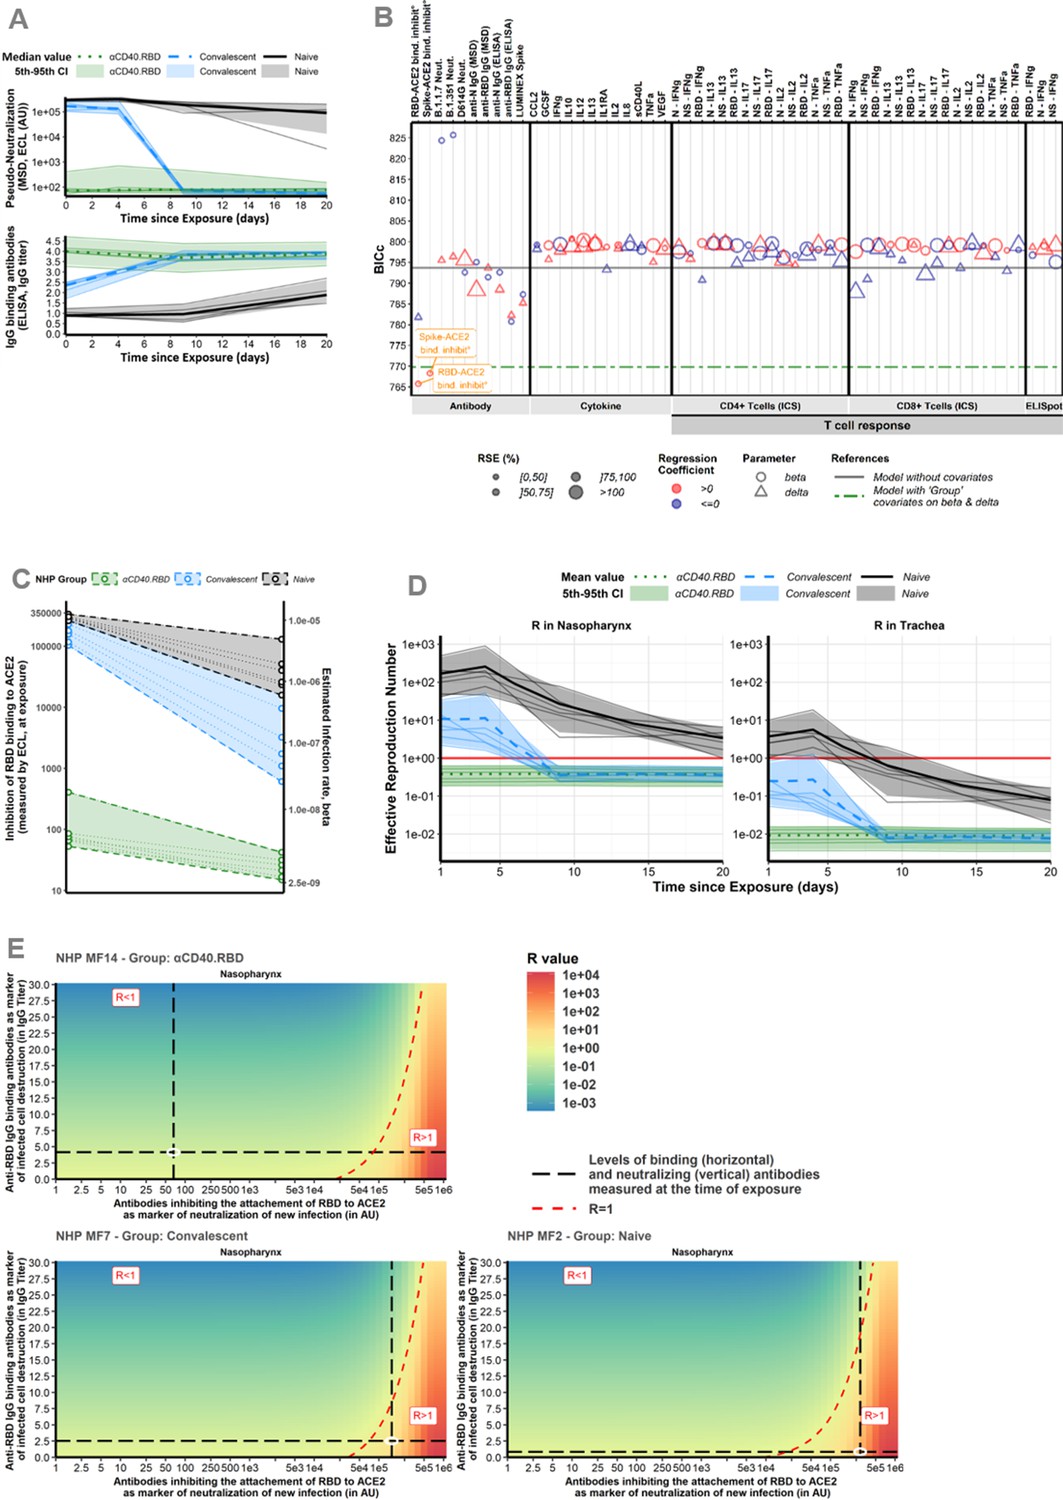
(A) Dynamics of biomarker selected as mechanistic correlate of protection (mCoP). Quantification of antibodies inhibiting RBD-ACE2 binding, measured by the Mesoscale Discovery (MSD) pseudo-neutralization assay (electro-chemiluminescence [ECL], in arbitrary unit [AU]) (top) and anti-RBD IgG titrated by ELISA assay (in IgG titer) (bottom). Thin lines represent individual values. Thick lines indicate medians of observations within naïve (black, solid line), convalescent (blue, dashed line), and αCD40.RBD-vaccinated convalescent (green, dotted line) animals. Shaded areas indicate 5th–95th confidence intervals of observations. (B) Systematic screening of effect of the markers. For every single marker, a model has been fitted to explore whether it explains the variation of the parameter of interest better or as well than the group indicator. Parameters of interest were β, the infection rate of ACE2+ target cells, and δ, the loss rate of infected cells. Models were compared according to the Bayesian information criterion (BIC), the lower being the better. The green line represents the reference model that includes the group effect (naïve/convalescent/vaccinated) without any adjustment for immunological marker (see Figure 3 for more details about measurement of immunological markers). (C) Thresholds of inhibition of RBD-ACE2 binding. Estimated infection rate (in (copies/mL)–1 day–1) of target cells according to the quantification of antibodies inhibiting RBD-ACE2 (in ECL) at exposure. Thin dotted lines and circles represent individual values of infection rates (right axis) and neutralizing antibodies (left axis). Shaded areas delimit the pseudo-neutralization/viral infectivity relationships within each group. (D) Reproduction number over time. Model predictions of the reproduction number over time in the trachea (right) and nasopharynx (left). The reproduction number is representing the number of infected cells from one infected cell if target cells are unlimited. Below one, the effective reproduction number indicates that the infection is going to be cured. Horizontal solid red lines highlight the threshold of one. Same legend than (A). (E) Conditions for controlling the infection. Basic reproduction number (R0) at the time of the challenge according to the levels of antibodies inhibiting RBD-ACE2 binding (the lower the better) and of anti-RBD IgG-binding antibodies (the higher the better) assuming they are mechanistic correlates of blocking new cell infection and promoting infected cell death, respectively. The red area with R>1 describes a situation where the infection is spreading. The green area with R<1 describes a situation where the infection is controlled. The dotted red line delimitates the two areas. Black long dashed lines represent the values of neutralizing and binding antibodies measured at exposure. Observed values for three different animals belonging to the naïve (bottom, right), convalescent (bottom, left), and vaccinated (top, left) groups are represented. For each animal, individual values of R0 were estimated considering their individual values of the model parameters (β and δ).
-
Figure 4—source data 1
Anti-N and anti-receptor-binding domain (RBD)-binding antibodies longitudinally measured post-immunization and quantified by ELISA in the study 1.
- https://cdn.elifesciences.org/articles/75427/elife-75427-fig4-data1-v2.xlsx
-
Figure 4—source data 2
Anti-receptor-binding domain (RBD) and anti-spike neutralizing antibodies longitudinally measured post-exposition and quantified by Mesoscale Discovery (MSD) assay (in electro-chemiluminescence [ECL]) in the study 1.
- https://cdn.elifesciences.org/articles/75427/elife-75427-fig4-data2-v2.xlsx
Figure 4—figure supplement 1
Immune markers selection and Basic reproduction number.
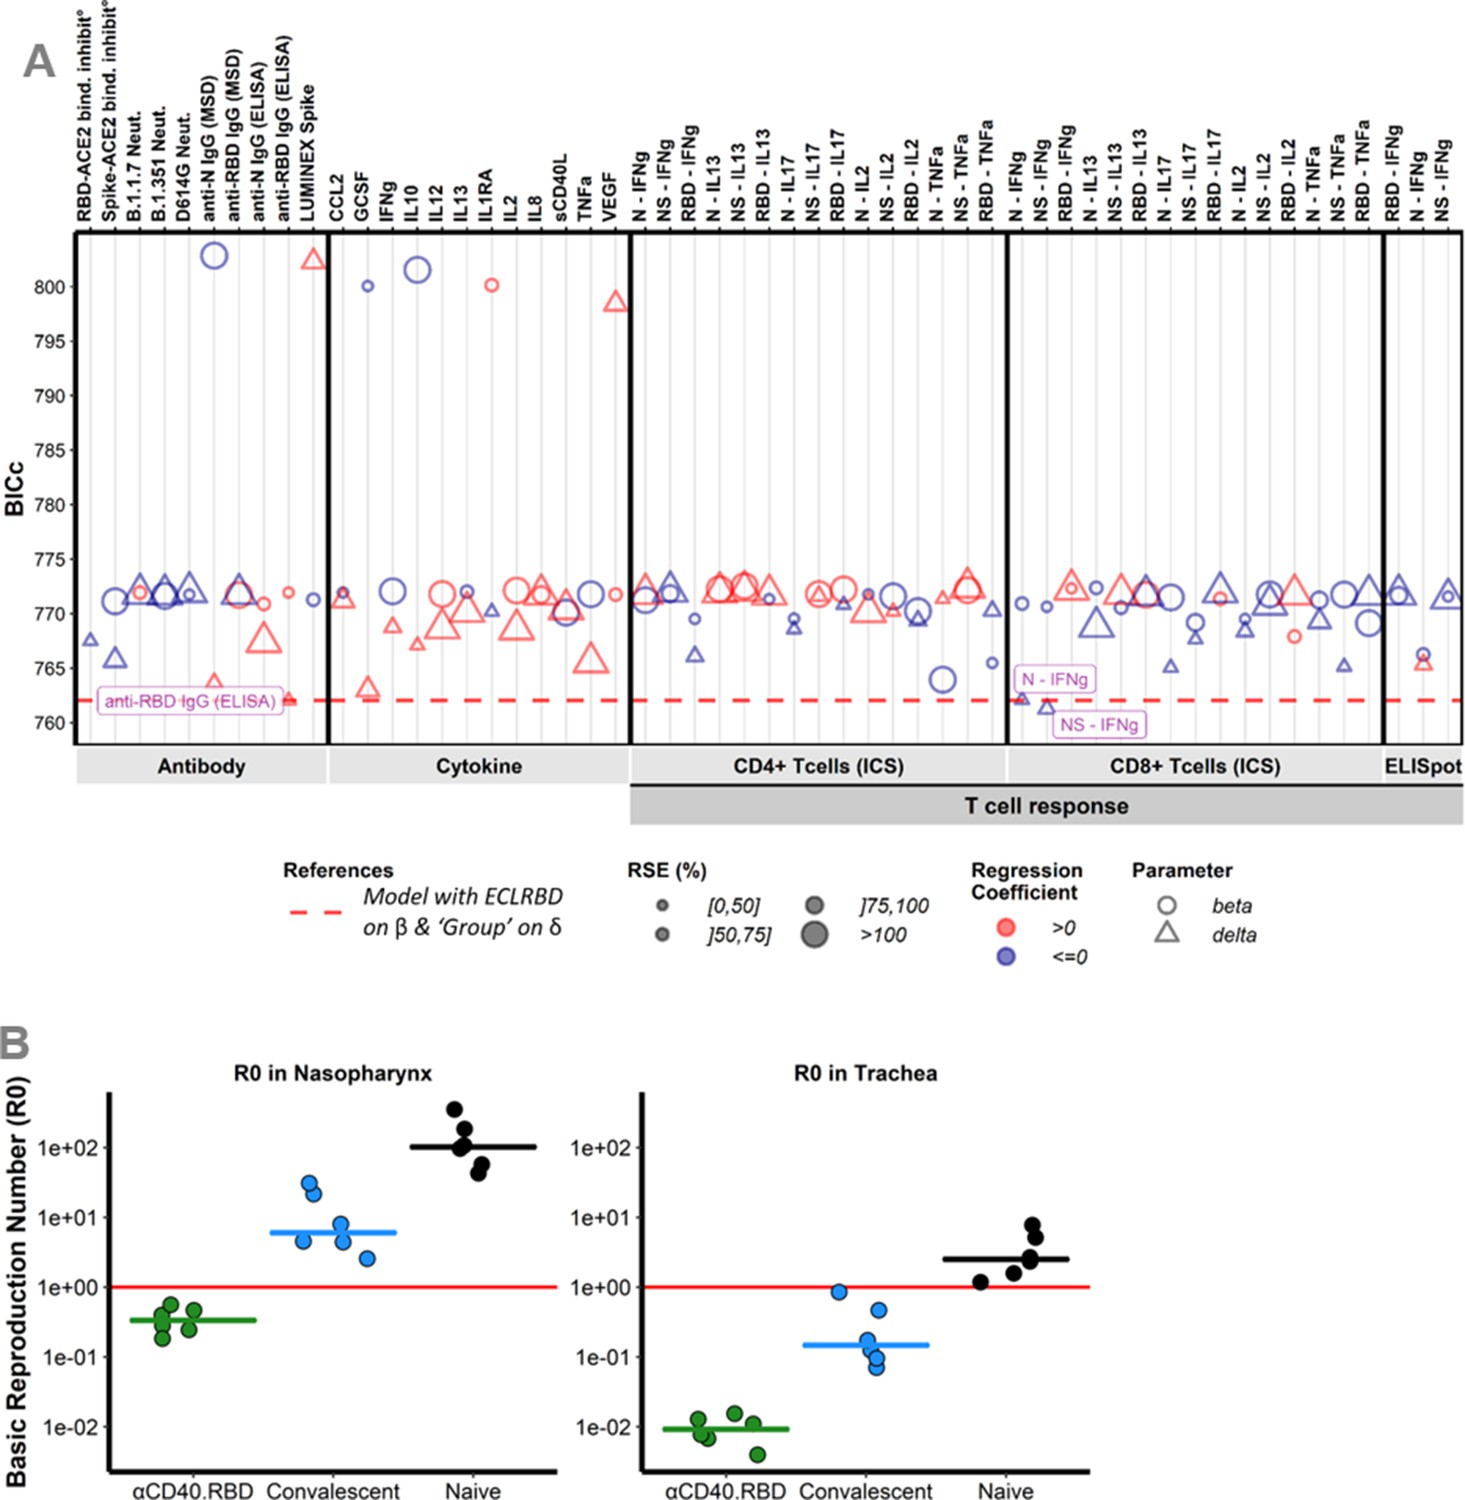
(A) Systematic screening of effect of the markers (Step 2). For every single marker, a model, already adjusted on viral infectivity with antibodies inhibiting the attachment of receptor-binding domain (RBD) to ACE2 receptor, has been fitted to explore whether it explains the variation of the parameter of interest better or as well than the model of reference. Parameters of interest were β, the infection rate of ACE2+ target cells and δ, the loss rate of infected cells. Models were compared according to the Bayesian information criterion (BIC), the lower being the better. The red dashed line represents the reference model that includes the group effect (naïve/convalescent/vaccinated) on the parameter δ and with adjustment of pseudo-neutralization on β. (B) Reproduction number at the time of exposure. Model predictions of the reproduction number at the time of exposure (R0) in the tracheal (right) and nasopharyngeal (left) compartments for naïve (black), convalescent (blue), and αCD40.RBD-vaccinated convalescent (green) animals. The reproduction number is representing the number of infected cells from one infected cell if target cells are unlimited. When this effective reproduction number is below 1, it means that the infection is going to be cured. The values of R0 were estimated by the model with viral infectivity (β) and loss rate of infected cells (δ) adjusted on pseudo-neutralization and anti-RBD IgG-binding antibodies titrated by ELISA respectively measured only at the time of challenge. Horizontal solid red lines highlight the threshold of the reproduction number equals to one.
Figure 4—figure supplement 2
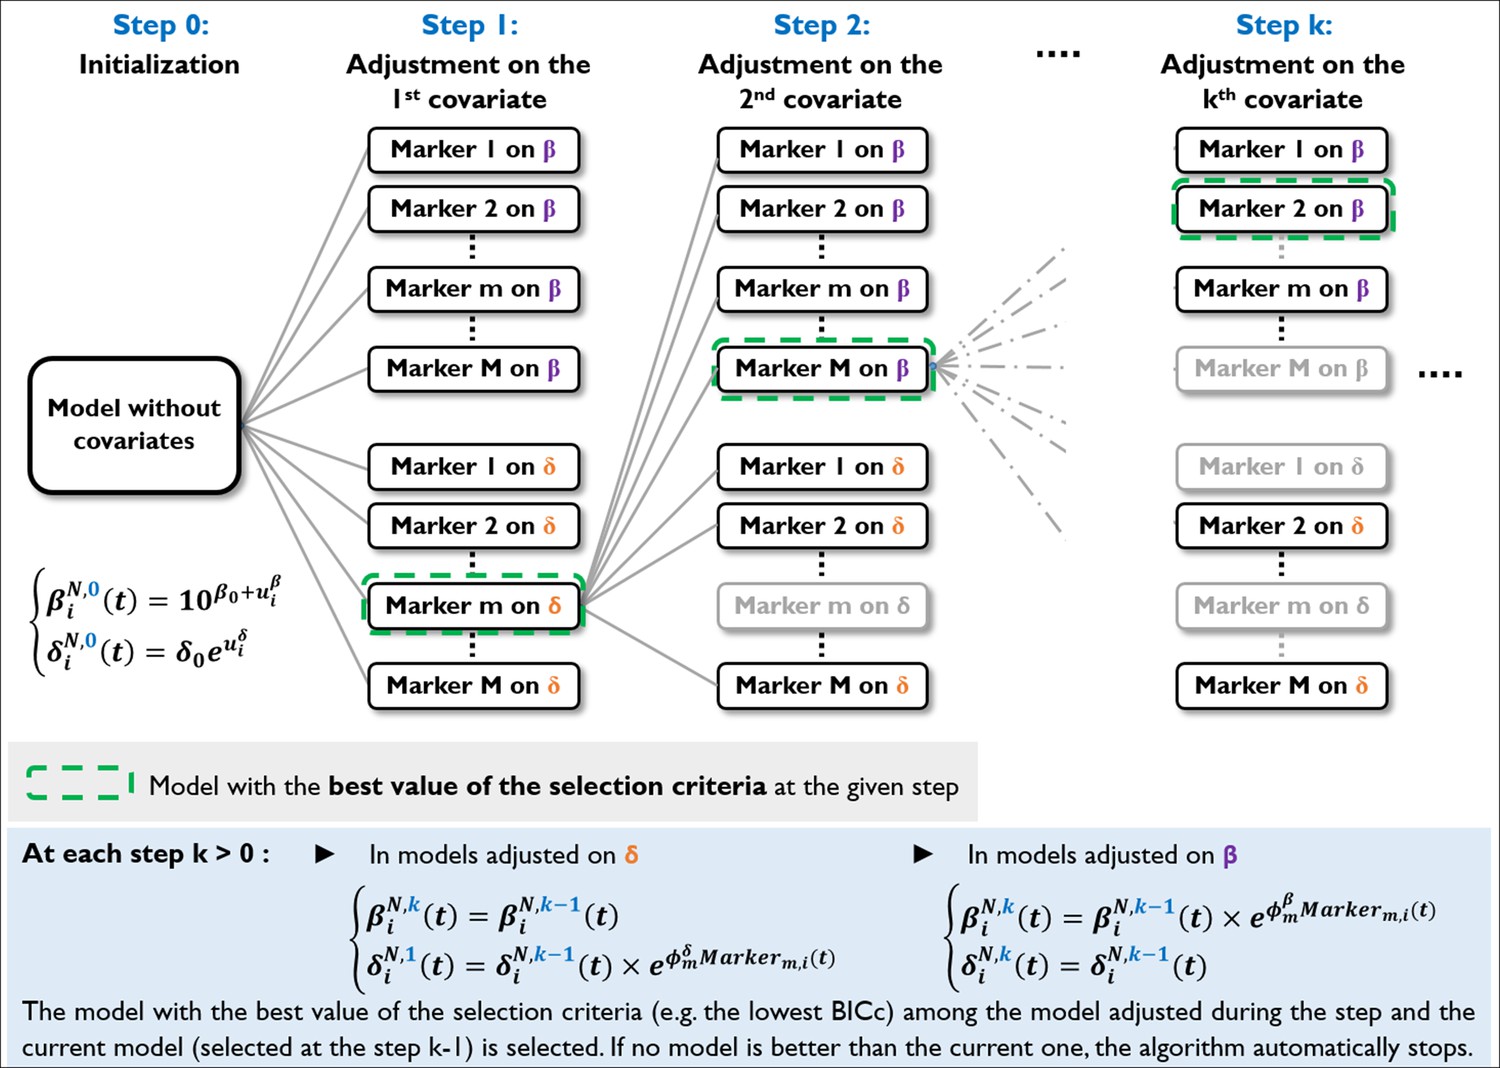
Flowchart of the algorithm for automatic selection of covariate.
At the initialization step of our study, the model without covariates is considered as initial the model, all immunological markers are seen as potential covariates (marker) and {β, δ} is defined as the set of parameters on which covariates can be added. At each, all the marker-parameter relationships that have not already been added to the current model are added in an univariate manner to this model and ran. Among all the tested models, the one with the optimal value of selection criteria (e.g., lowest corrected Bayesian information criteria [BICc]) is selected (green dashed rectangle) and compared to the current model. If this one is better, it becomes the new current model and the algorithm moves to the step k+1. Otherwise, the algorithm stops.
Figure 5

Study design and modeling results for the second study testing two-component spike nanoparticle vaccine.
(A) Study design. Cynomolgus macaques were randomly assigned in two experimental groups. Twelve, eight, and two weeks post-infection with SARS-CoV-2 virus, six of them were successively immunized with 50 µg of SARS-CoV-2 S-I53-50NP vaccine. The four other animals received no vaccination. Two weeks after the final immunization, all monkeys were exposed to a total dose of 106 pfu of SARS-CoV-2 virus via intra-nasal and intra-tracheal routes. (B) Harvest times and measurements. Nasopharyngeal and tracheal fluids were collected at 0, 1, 2, 3, 4, 5, 6, 10, 14, and 21 days post-exposure (d.p.e.) while blood was taken at 0, 2, 4, 6, 10, 14, and 21 d.p.e. Genomic and subgenomic viral loads were measured by RT-qPCR. Anti-spike, anti-RBD, and anti-nucleocapside (N) IgG were titrated using a multiplexed immunoassay developed by Mesoscale Discovery (MSD, Rockville, MD) and expressed in AU mL–1. The MSD pseudo-neutralization assay was used to quantify antibodies neutralizing the binding of the spike protein and RBD to the ACE2 receptor and results were expressed in electro-chemiluminescence (ECL). (C) Genomic viral load dynamics in nasopharyngeal and tracheal swabs after the exposure to SARS-Cov-2 in naïve (black, solid line) and vaccinated (green, dashed line) animals. Thin lines represent individual values. Thick lines indicate medians within each group. (D) Model fit to the log10-transformed observed genomic RNA (gRNA) viral load in nasopharynx and trachea after the exposure to SARS-CoV-2 in naïve and vaccinated macaques. Solid thin lines indicate individual dynamics predicted by the model adjusted for groups. Thick dashed lines indicate mean viral load over time. (E) Thresholds of inhibition of RBD-ACE2 binding. Estimated infection rate of target cells ((copies/mL)–1 day–1) according to the quantification of antibodies inhibiting RBD-ACE2 binding (ECL) at exposure for naïve (black) and vaccinated (green) animals. Thin dotted lines and circles represent individual infection rates (right axis) and neutralizing antibodies (left axis). Thick dashed lines and dashed areas delimit the pseudo-neutralization/viral infectivity relationships within each group. (C,D) Horizontal red dashed lines represent the limit of quantification and shaded areas the 95% confidence intervals.The second study testing two-component spike nanoparticle vaccine.
-
Figure 5—source data 1
Anti-spike, anti-receptor-binding domain (RBD), and anti-N-binding antibodies quantified by Mesoscale Discovery (MSD) assay (AU mL–1), and quantification of the spike/ACE2-binding inhibition by MSD assay (in 1/ECL), at the time of exposure in the study 2.
- https://cdn.elifesciences.org/articles/75427/elife-75427-fig5-data1-v2.xlsx
-
Figure 5—source data 2
Genomic RNA (gRNA) and subgenomic RNA (sgRNA) viral loads longitudinally measured in the trachea and nasopharynx in the study 2.
- https://cdn.elifesciences.org/articles/75427/elife-75427-fig5-data2-v2.xlsx
Appendix 2—figure 1
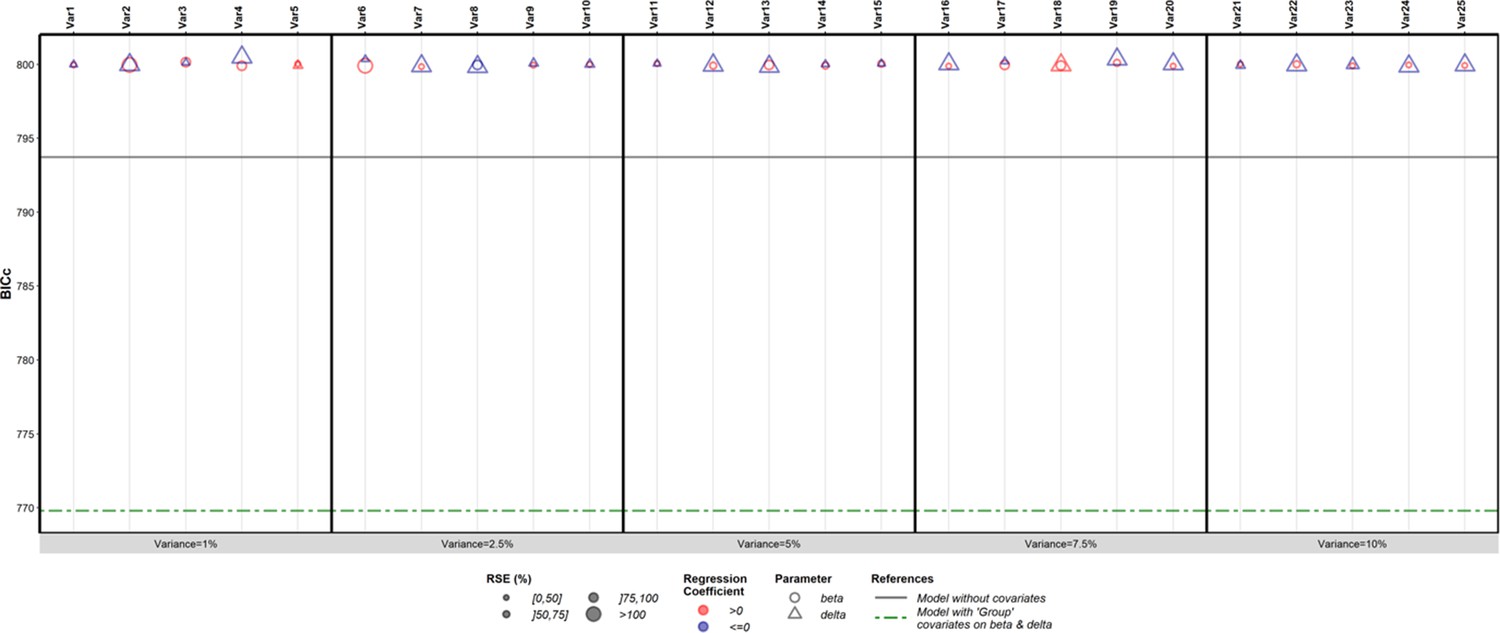
Results of the forward selection approach applied on the 25 simulated white-noise random variables.
The discrete x-axis represents the different variables and the y-axis represents the values of the corrected Bayesian information criteria (BICc). Circles and triangles correspond to the results obtained with the parameters β or δ adjusted for the variables. The horizontal solid black line represents the value of the BICc obtained with the model without covariates while the horizontal dashed green line highlights the value of the criterion obtained with both β and δ adjusted for the groups of treatment.
Author response image 1
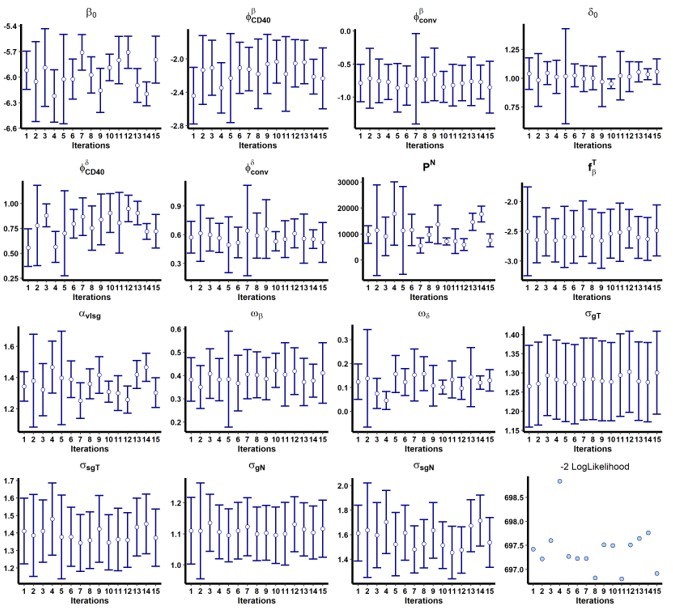
Results of the convergence assessment performed on the model with both and adjusted for the group of treatment.
Fifteen iterations were performed to evaluate the robustness of the estimation according to the initial value of the parameters.
Author response image 2
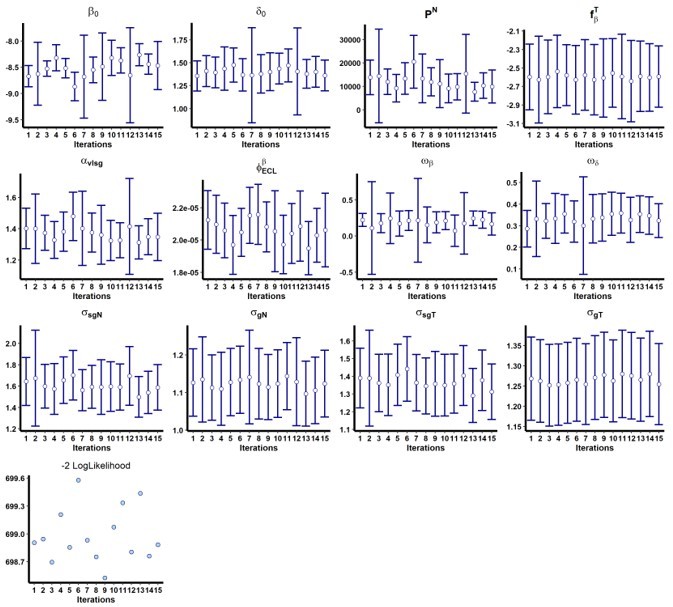
Results of the convergence assessment performed on the model with adjusted for ACE2-RBD binding inhibition (ECL RBD).
Fifteen iterations were performed to evaluate the robustness of the estimation according to the initial value of the parameters.
Tables
Appendix 1—table 1
Comparison of models evaluating the difference of viral infectivity (β), loss of infected cells (δ), and viral production (P) between the nasopharynx and the trachea.
| Model tested | Statistical model | ΔBICc |
|---|---|---|
| Initial model | βT = βN δN = δT PN = PT Variability on β and δ | |
| Model with different β | βT ≠ βN δN = δT PN = PT Variability on β and δ | –17.31 |
| Model with different δ | βT = βN δN ≠ δT PN = PT Variability on β and δ | –14.38 |
| Model with different P | βT = βN δN = δT PN ≠ PT Variability on β and δ | –25.24 |
| Model with different β and δ | βT ≠ βN δN ≠ δT PN = PT Variability on β and δ | –13.00 |
| Model with different β and P | βT ≠ βN δN = δT PN ≠ PT Variability on β and δ | –19.19 |
| Model with different δ and P | βT = βN δN ≠ δT PN ≠ PT Variability on β and δ | –19.47 |
| Model with different β, δ, and P | βT ≠ βN δN ≠ δT PN ≠ PT Variability on β and δ | –13.39 |
Appendix 1—table 2
Comparison of models evaluating the adjustment of the viral infectivity (β), the loss rate of infected cells (δ), the viral production (P), and the viral clearance (c) for the groups of treatment.
The group of naïve animals is assumed as the group of reference.
| Step | Model tested | Statistical model | |
|---|---|---|---|
| 1 | Initial model: Model without group effects | ||
| Model with group effect on | –21.5 | ||
| Model with group effect on | –16.62 | ||
| Model with group effect on | +9.68 | ||
| Model with group effect on c | +9.20 | ||
| 2 | Initial model: Model with group effect on | ||
| Model with group effect on and | –2.48 | ||
| Model with group effect on and | +12.25 | ||
| Model with group effect on and | +11.97 | ||
| 3 | Initial model: Model with group effect on and | ||
| Model with group effect on , , and | +10.88 | ||
| Model with group effect on , and | +11.61 |
Appendix 2—table 1
Model parameters for viral dynamics in both the nasopharynx and the trachea estimated by the model adjusted for groups of intervention.
For the bootstrap procedure, 50 iterations were performed.
| Parameter | Meaning | Value [95% CI] | Unit |
|---|---|---|---|
| β | Viral infectivity in the naive group (×10–6) | 0.91 [0.12; 7.03] | (copies/mL)–1 day–1 |
| Fold change in the convalescent group | 0.15 [0.04; 0.58] | ||
| Fold change in the Conv-CD40 group | 0.006 [0.001; 0.04] | ||
| δ | Loss rate of infected cells in the naive group | 1.09 [0.74; 1.60] | day–1 |
| Fold change in the convalescent group | 1.70 [1.08; 2.66] | ||
| Fold change in the Conv-CD40 group | 2.00 [0.94; 4.27] | ||
| PN | Viral production rate in the naso. (×103) | 10.1 [1.16; 87.7] | virions (cell day)–1 |
| PT | Viral production rate in the trachea (×103) | 0.86 [0.08; 9.19] | virions (cell day)–1 |
| αvlsg | Infected cells and sgRNA viral load ratio | 1.42 [0.99; 2.02] | virions cell–1 |
| k | Eclipse rate | 3 | day–1 |
| c | Clearance of de novo produced viruses | 3 | day–1 |
| cI | Clearance of inoculum | 20 | day–1 |
| µ | Percentage of infectious viruses | 10–3 | |
| Initial number of target cells | 1.25 × 10⁵ (naso.) 2.25 × 10⁴ (trachea) | cells | |
| Inoc0 | Number of virions inoculated | 2.19 × 10¹⁰ | virions |
| ωβ | SD of random effect on log10 β | 0.319 [0.111; 0.527] | |
| ωδ | SD of random effect on δ | 0.122 [-0.039; 0.283] | |
| σVLn | SD of error model gRNA in naso. | 1.24 [0.96; 1.51] | |
| σVLt | SD of error model gRNA in trachea | 1.09 [0.92; 1.26] | |
| σsgVLn | SD of error model sgRNA in naso | 1.35 [1.08; 1.61] | |
| σsgVLt | SD of error model sgRNA in trachea | 1.53 [1.15; 1.92] |
Appendix 2—table 2
Model parameters for viral dynamics in both the nasopharynx and the trachea estimated by the model with the viral infectivity adjusted for ACE2-RBD-binding inhibition and the loss rate of infected cells adjusted for the group of treatment.
For the bootstrap procedure, 50 iterations were performed.
| Parameters | Meaning | Value [95% CI] | Unit |
|---|---|---|---|
| β | Infection rate with ECLRBD = 0 AU (×10–8) | 0.82 [0.13; 5.13] | (copies/mL)–1 day–1 |
| Fold | 1.017 [1.012; 1.022] | ||
| δ | Loss rate of infected cells | 1.02 [0.80; 1.30] | day–1 |
| Fold change in the convalescent group | 1.74 [1.24; 2.46] | ||
| Fold change in the Conv-CD40 group | 2.17 [0.82; 5.74] | ||
| PN | Viral production rate in the naso. (×103) | 8.92 [0.42; 191] | virions (cell day)–1 |
| PT | Viral production rate in the trachea (×103) | 0.62 [0.02; 19.7] | virions (cell day)–1 |
| αvlsg | Infected cells and sgRNA viral load ratio | 1.32 [0.91; 1.90] | virions cell–1 |
| k | Eclipse rate | 3 | day–1 |
| c | Clearance of de novo produced viruses | 3 | day–1 |
| cI | Clearance of inoculum | 20 | day–1 |
| µ | Percentage of infectious viruses | 10–3 | |
| Initial number of target cells | 1.25 × 10⁵ (naso.) 2.25 × 10⁴ (trachea) | cells | |
| Inoc0 | Number of virions inoculated | 2.19 × 10¹⁰ | virions |
| ωβ | SD of random effect on log10 β | 0.205 [0.011; 0.399] | |
| ωδ | SD of random effect on δ | 0.079 [-0.092; 0.250] | |
| σVLn | SD of error model gRNA in naso. | 1.13 [0.90; 1.36] | |
| σVLt | SD of error model gRNA in trachea | 1.27 [1.07; 1.48] | |
| σsgVLn | SD of error model sgRNA in naso | 1.62 [1.30; 1.94] | |
| σsgVLt | SD of error model sgRNA in trachea | 1.36 [1.15; 1.56] |
Additional files
-
Supplementary file 1
Criteria defining neutralization as mechanistic correlate of protection of the effect of the vaccine on new cell infection.
- https://cdn.elifesciences.org/articles/75427/elife-75427-supp1-v2.docx
-
Supplementary file 2
Model parameters estimated by the model adjusted for groups of intervention.
- https://cdn.elifesciences.org/articles/75427/elife-75427-supp2-v2.docx
-
Supplementary file 3
Model parameters estimated by profile likelihood.
- https://cdn.elifesciences.org/articles/75427/elife-75427-supp3-v2.docx
-
Supplementary file 4
Model parameters estimated by the model adjusted for receptor-binding domain (RBD)/ACE2-binding inhibition on beta and for groups on delta.
- https://cdn.elifesciences.org/articles/75427/elife-75427-supp4-v2.docx
-
Transparent reporting form
- https://cdn.elifesciences.org/articles/75427/elife-75427-transrepform1-v2.pdf
Download links
A two-part list of links to download the article, or parts of the article, in various formats.
Downloads (link to download the article as PDF)
Open citations (links to open the citations from this article in various online reference manager services)
Cite this article (links to download the citations from this article in formats compatible with various reference manager tools)
Modelling the response to vaccine in non-human primates to define SARS-CoV-2 mechanistic correlates of protection
eLife 11:e75427.
https://doi.org/10.7554/eLife.75427


