The evolutionary history of human spindle genes includes back-and-forth gene flow with Neandertals
- Department of Evolutionary Genetics, Max Planck Institute for Evolutionary Anthropology, Germany
Figures
Figure 1 with 1 supplement

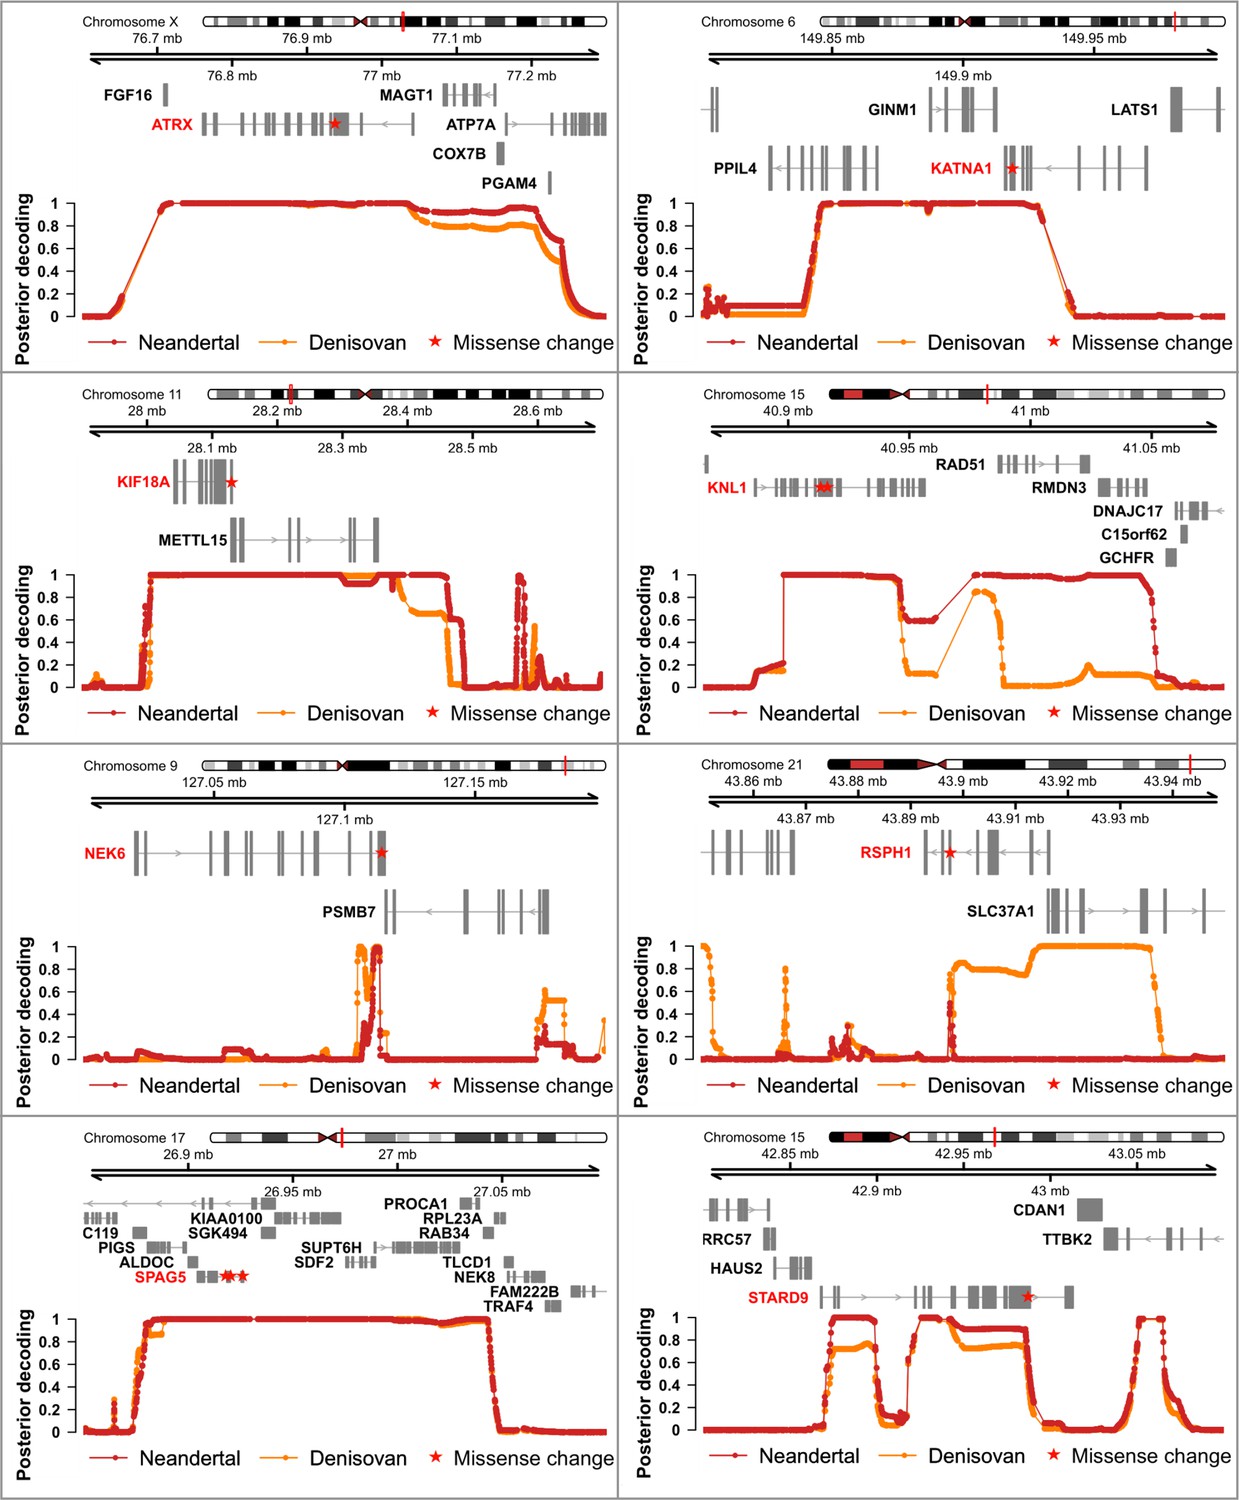
Genomic regions around spindle genes where archaic humans fall outside the modern human variation.
Each panel corresponds to the region around the missense change(s) (red stars) in a spindle gene. The grey boxes correspond to exons. The curves give the posterior probability (computed as in Peyrégne et al., 2017) that an archaic genome (Altai Neandertal in red, Denisova 3 in orange) is an outgroup to present-day African genomes at a particular position (dots on the curves correspond to informative positions, that is polymorphic positions or fixed derived substitutions in Africans from the 1,000 Genomes Project phase III, compared to four ape genomes). Chromosomal locations are given on top.
Figure 1—figure supplement 1
Genomic regions where archaic humans fall outside the modern human variation, identified using the most recent deCODE recombination map (Halldorsson et al., 2019).
Figure 2
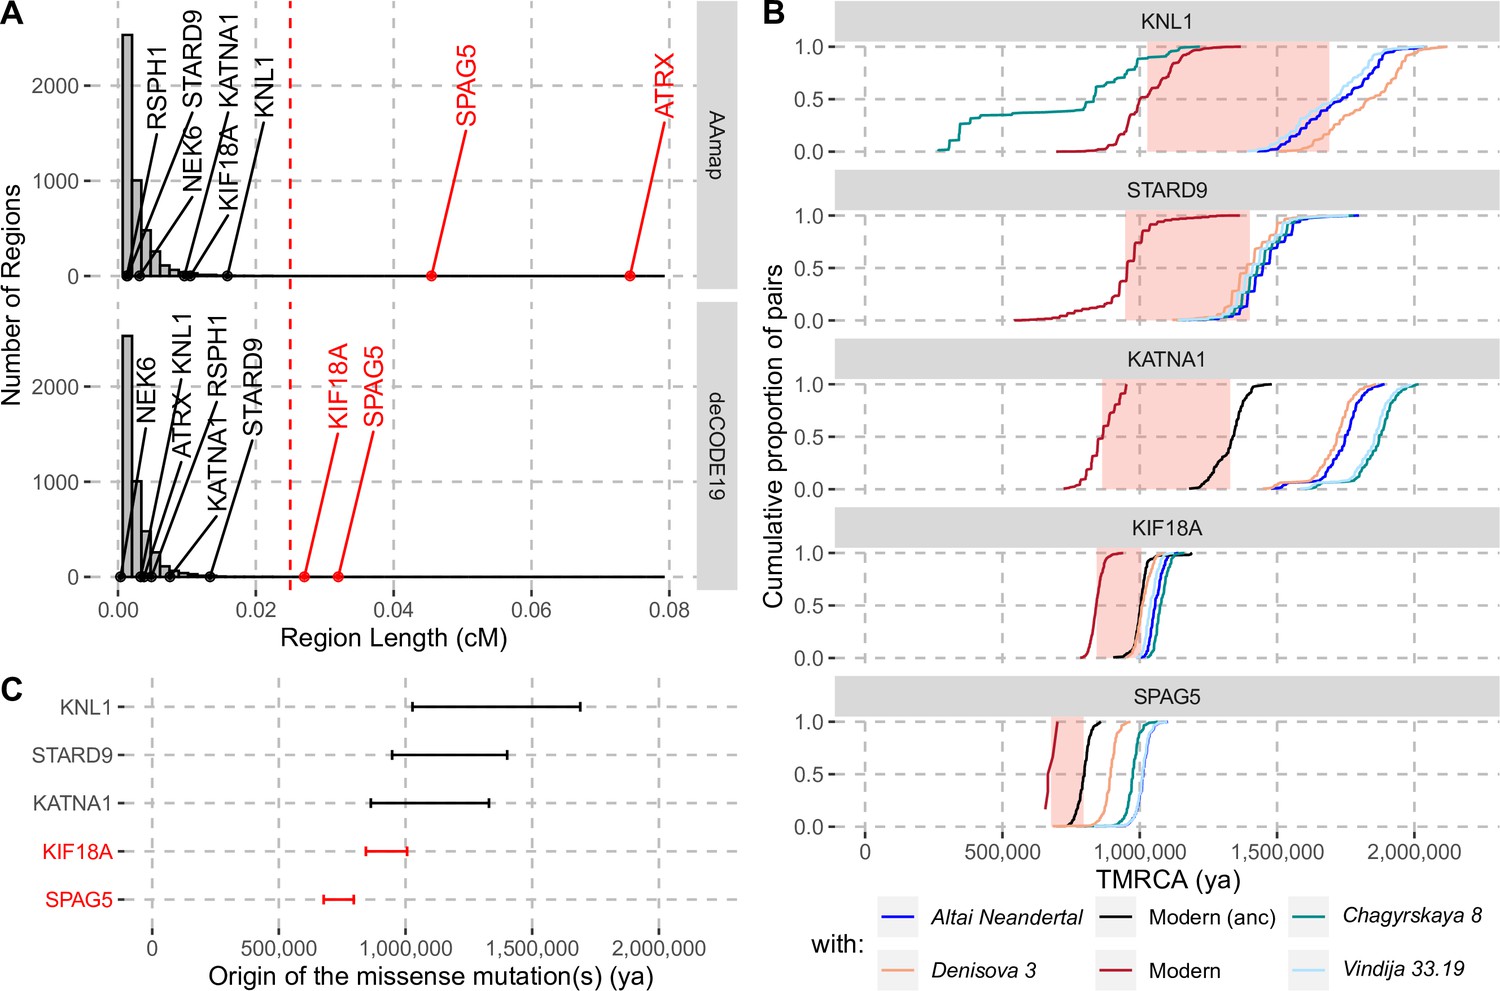
Evidence for selection in the spindle genes with age estimates of these substitutions.
(A) The genetic length of segments around the missense substitutions where the Altai Neandertal and Denisova 3 fall outside the human variation (Figure 1) using the African-American map, AAmap, or the deCODE map, deCODE19. The grey histogram corresponds to the length distribution of such segments in neutral simulations (Peyrégne et al., 2017). Candidate genes for selection (red) are those with segments longer than 0.025cM (Peyrégne et al., 2017) (vertical red dashed line). (B) Cumulative distributions of pairwise times to the most recent common ancestors (TMRCA) among present-day African chromosomes with the most distant relationships (red; see Methods), or between the chromosomes of present-day Africans and either present-day individuals with the ancestral versions of the missense substitutions (‘Modern (anc)’, in black) or archaic humans (other colors). The pink areas correspond to estimated time intervals for the origin of the missense substitutions and their bounds correspond to the average TMRCAs over the red curve and the next one (back in time), respectively. (C) Summary of ages of substitutions as described in panel B. Genes with evidence of positive selection are highlighted in red.
Figure 3
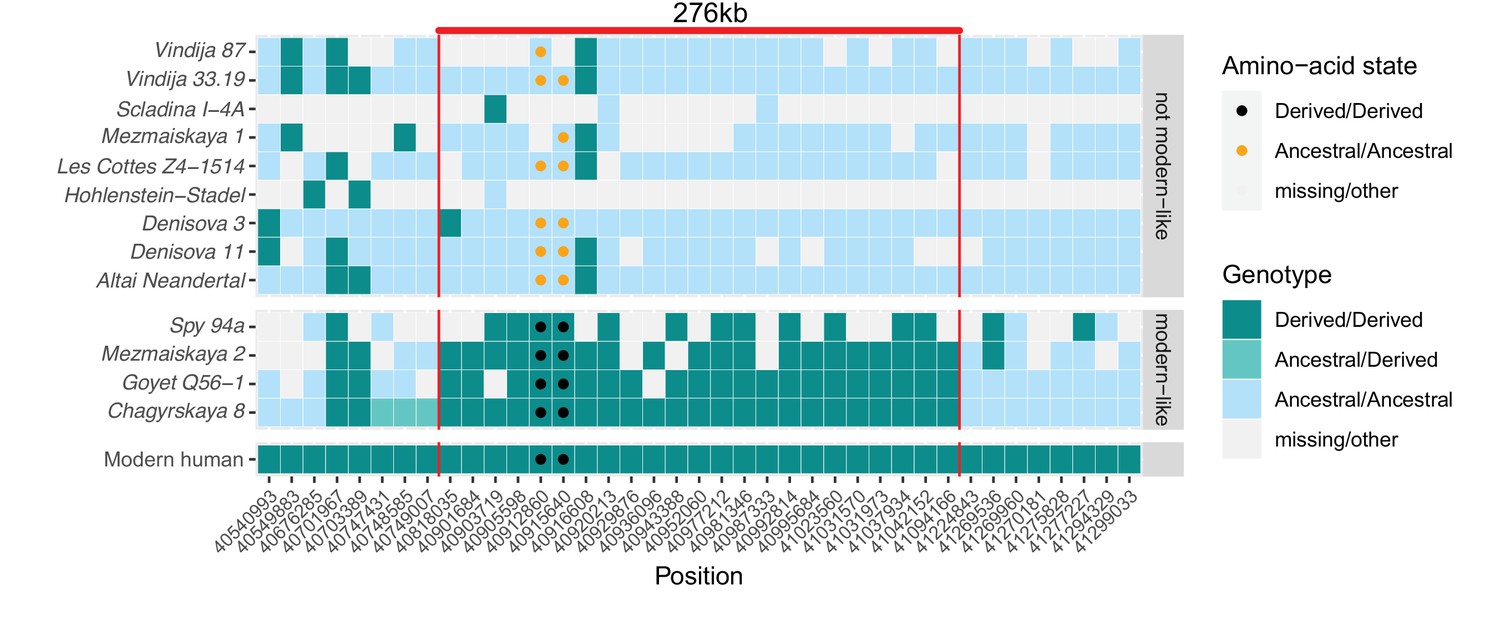
A modern human-like haplotype in some Neandertals.
Genotypes from 13 archaic individuals (y-axis) are shown in a region around the two missense changes (dots) in KNL1. We only show positions (x-axis) that are derived in all Luhya and Yoruba individuals from the 1,000 Genomes Project compared to four great apes (Peyrégne et al., 2017) and at least one high-coverage archaic genome (Chagyrskaya 8, Denisova 3, Vindija 33.19 and Altai Neandertal, i.e., Denisova 5). The colors of the squares and dots represent the genotype, with ancestral and derived alleles. For the low coverage archaic genomes, we randomly sampled a sequence at each position. Red lines indicate the modern human-like haplotype.
Figure 4 with 1 supplement
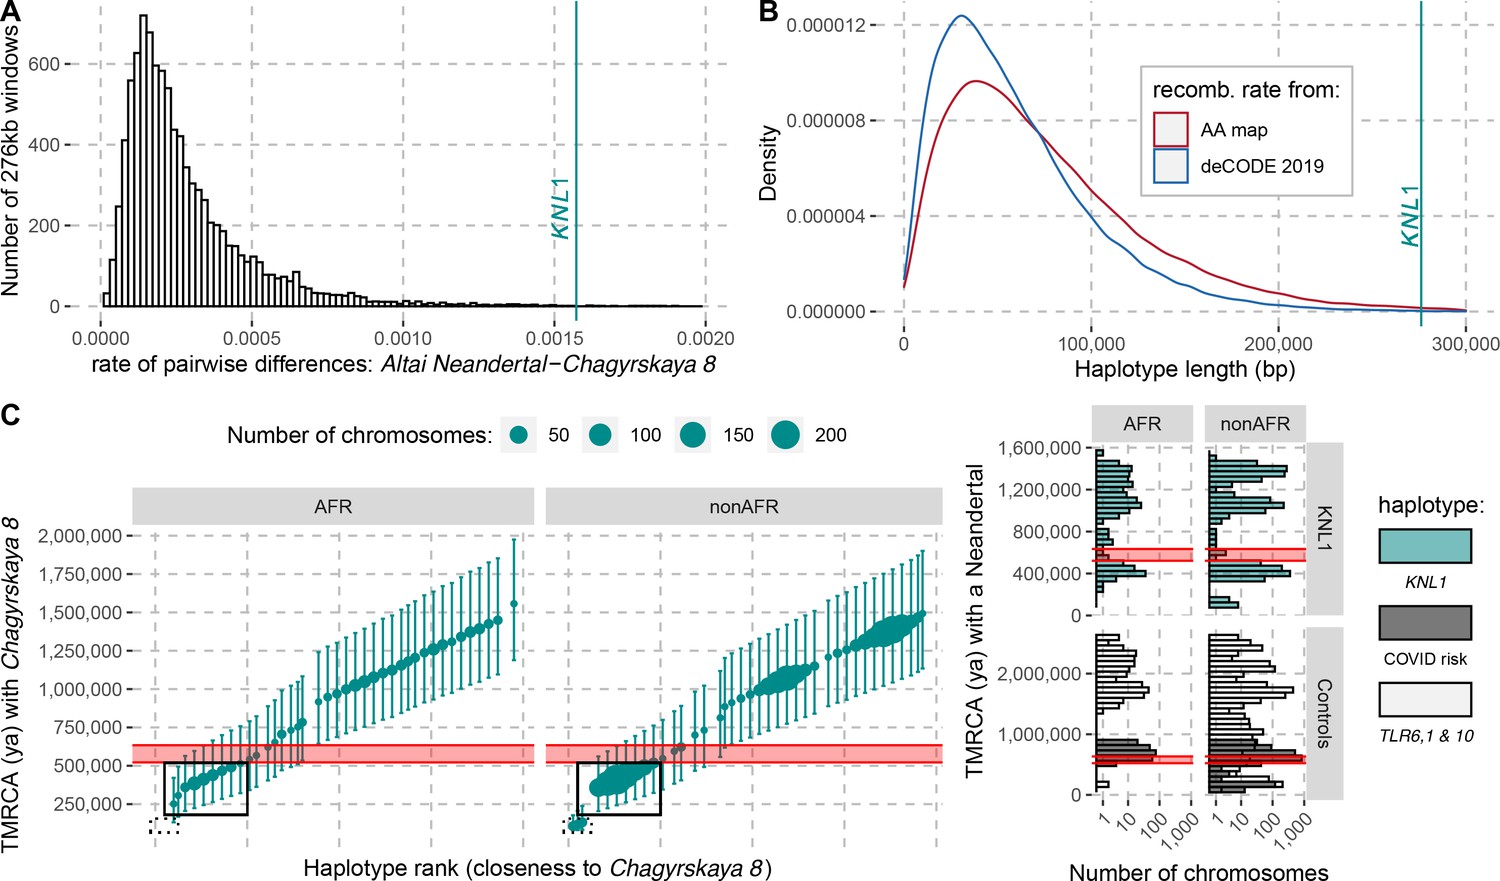
The modern human-like KNL1 haplotype in Neandertals.
(A) Pairwise differences between two high coverage Neandertal genomes (Chagyrskaya 8 and Altai Neandertal (Denisova 5)) in non-overlapping sliding windows of 276 kb (histogram) and in the KNL1 region (vertical cyan line; chr15:40,818,035–41,094,166, hg19). Windows with less than 10,000 genotype calls for both Neandertals were discarded. (B) The expected length distributions under a model of incomplete lineage sorting based on local recombination rate estimates from the African-American (AA) and deCODE recombination maps and the length of the modern human-like KNL1 haplotype in Neandertals (vertical cyan line). (C) Left panel: Time to the most recent common ancestor (TMRCA) between the Chagyrskaya 8 Neandertal (who carries the modern human-like haplotype) and KNL1 haplotypes in present-day humans with their 95% confidence intervals (bars) for chr15:40,885,107–40,963,160 (hg19). The size of the points corresponds to the number of chromosomes carrying this haplotype in the HGDP dataset. The black rectangles highlight subsets of haplotypes with TMRCAs more recent than the modern-archaic population split time (Prüfer et al., 2017) (shaded pink area). Right panel: Distribution of pairwise TMRCAs between the Neandertal and present-day humans from the HGDP dataset in the region of KNL1 and two other regions with archaic haplotypes in present-day humans (Controls, Zeberg and Pääbo, 2020; Dannemann et al., 2016; COVID risk region: chr3:45,859,651–45,909,024; TLR6, 1 & 10: chr4:38,760,338–38,846,385). We used the Vindija 33.19 genome for the COVID risk haplotype and the Chagyrskaya 8 genome otherwise.
Figure 4—figure supplement 1
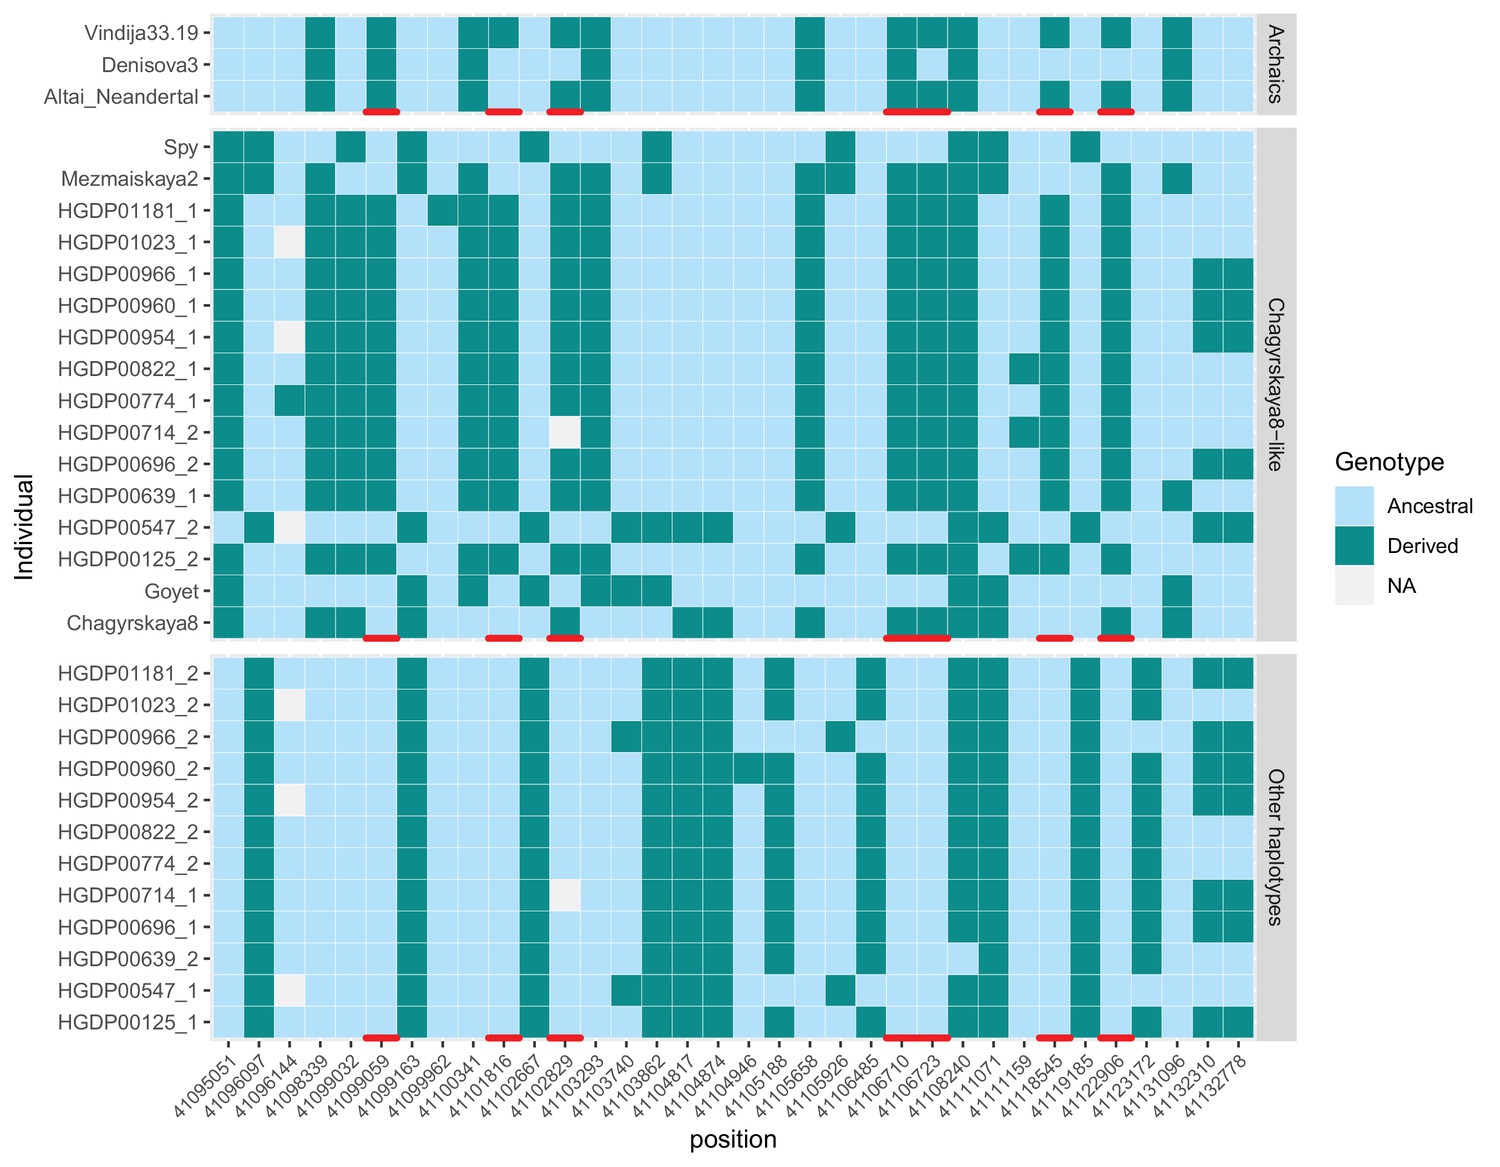
Genotypes of the 12 non-African individuals that inherited one copy of KNL1 from archaic humans.
We show positions within 40kb downstream of the modern-like KNL1 haplotype identified in Chagyrskaya 8 to highlight 7 positions (red marks) where only those 12 individuals (out of 929 individuals across worldwide populations Bergström et al., 2020) carry a derived allele seen in at least one Neandertal genome. We only show positions where at least one of the 12 individuals is heterozygous. The upper panel (‘Archaics’) shows the alleles carried by high-coverage archaic human genomes without the modern-like KNL1 haplotype. The middle panel (‘Chagyrskaya 8-like’) shows the alleles carried by four Neandertal genomes with the modern-human like KNL1 haplotype and the 12 present-day non-African genomes that inherited one copy of KNL1 from archaic humans. The lower panel (‘Other haplotypes’) shows the alleles carried by the other chromosomes (that did not inherit a copy ok KNL1 from archaic humans) of these 12 individuals. For the archaic human genomes, one allele was sampled randomly at heterozygous positions.
Figure 5
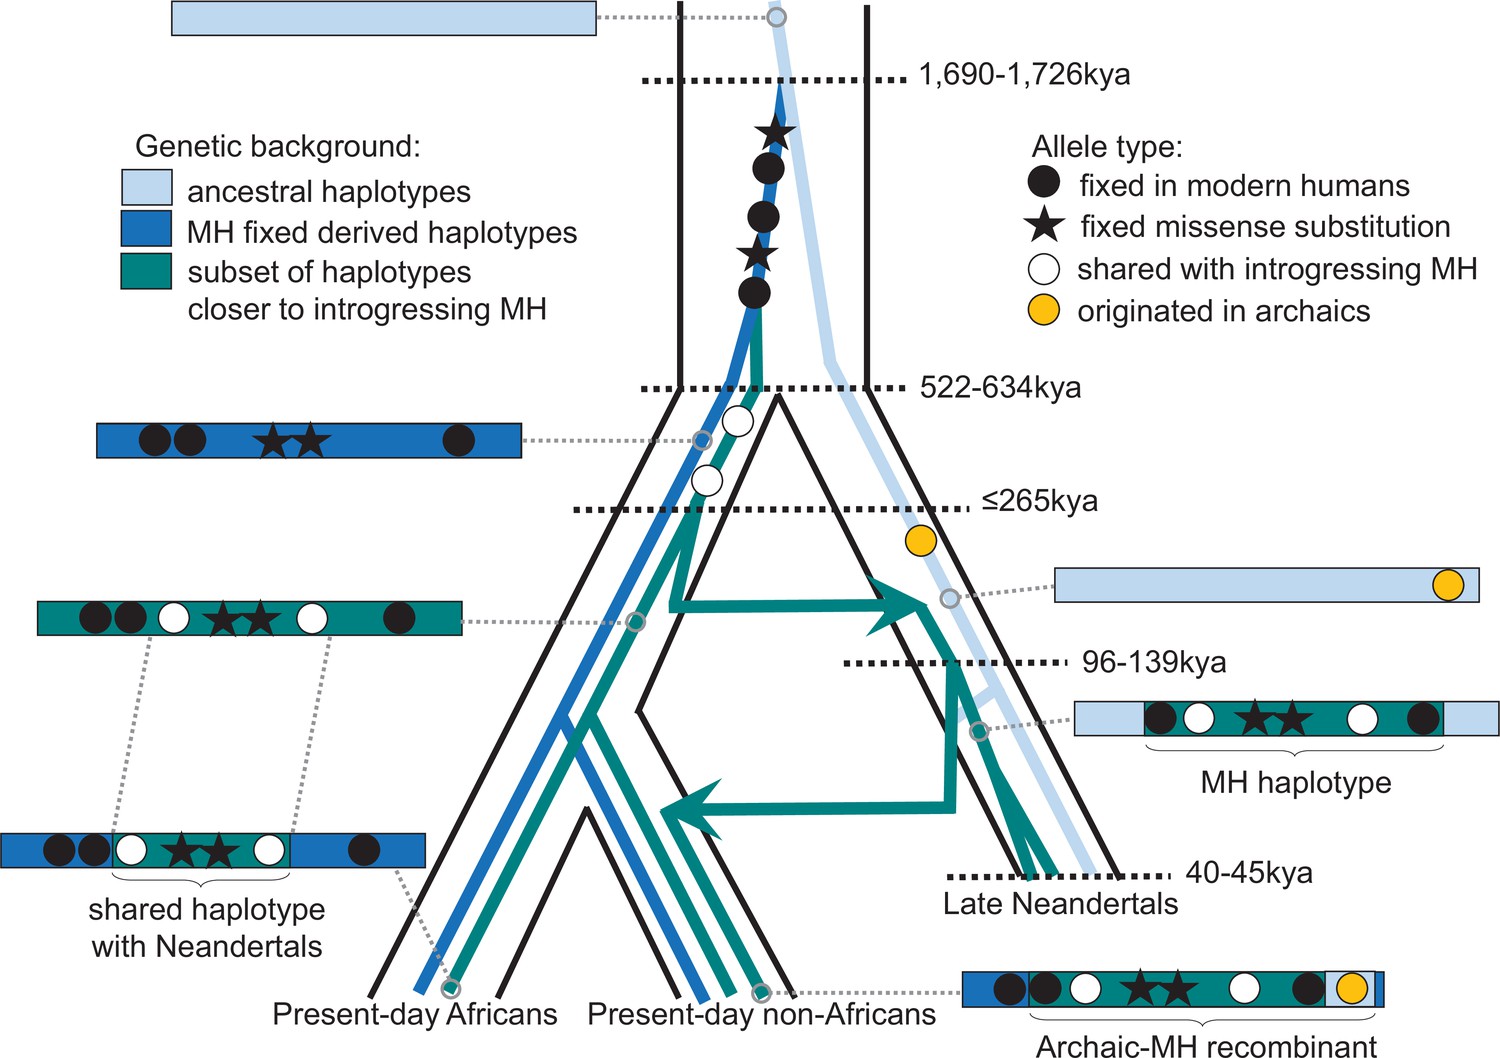
Schematic illustration of the history of KNL1.
The tree delineated in black corresponds to the average relationship between the modern and archaic human populations. The inner colored trees correspond to the relationship of different KNL1 lineages, with arrows highlighting the direction of gene flow between populations. The corresponding haplotypes are illustrated on the sides of the tree and show the recombination history in the region (e.g. the recombinant Neandertal haplotype with variants of putative archaic origin in non-Africans). Dots correspond to informative positions, and the stars illustrate the missense substitutions. The age of relevant ancestors are marked by horizontal dotted lines. MH: Modern human.
Tables
Appendix 1—table 1
Location and predicted effects of the studied amino acid changes in spindle proteins, as reported in dbNSFP version 4.2 (48).
The predictions are for the ancestral variants. We put “damaging” in between quotation marks as the ancestral versions of ATRX and KATNA1 are unlikely to be damaging (as the ancestral amino acid residues are found in the proteins of many species), but that prediction rather supports a function for these amino acid changes.
| protein | position | amino acid change | protein domain (Uniprot) | effect prediction for the ancestral variant (MutPred) | potentially “damaging” ancestral variant according to: |
|---|---|---|---|---|---|
| ATRX | 475 | D ->H | - | - | FATHMM; M-CAP |
| KATNA1 | 343 | A ->T | - | - | FATHMM; PrimateAI |
| KIF18A | 67 | R ->K | kinesin motor (11-355) | Loss of methylation (P=0.0087) | - |
| KNL1 | 159 | H ->R | interaction domain with BUB1 and BUB1B (1-728) | - | - |
| 1,086 | G ->S | 2 × 10⁴ AA approximate repeats (855–1201) | Loss of phosphorylation (P=0.0382) | - | |
| NEK6 | 291 | D ->H | protein kinase domain (45-310) | - | - |
| RSPH1 | 213 | K ->Q | - | - | - |
| SPAG5 | 43 | P ->S | - | Loss of phosphorylation (P=0.0244) Gain of catalytic residue (P=0.0179) | - |
| 162 | E ->G | - | - | - | |
| 410 | D ->H | - | - | - | |
| STARD9 | 3,925 | A ->T | - | - | - |
Appendix 1—table 2
Deleteriousness and conservation scores at the studied positions with missense changes in spindle genes, as reported in dbNSFP version 4.2 (48).
A high CADD score indicates that the ancestral variant is likely to be deleterious (Kircher et al., 2014; Rentzsch et al., 2019; Pollard et al., 2010) and a high conservation score means that the nucleotide position is highly conserved across species (100 vertebrates for phyloP and phastCons (Siepel et al., 2005), and 34 mammals for GERP ++RS, Davydov et al., 2010). In contrast to the other scores that correspond to a single position, phastCons is a measure of the conservation in the region around the position. In dbNSFP, the scores range from –6.458163–18.301497 for CADD, from –12.3–6.17 for GERP ++RS, from –20.0–10.003 for phyloP and from 0 to 1 for phastCons.
| gene | position (hg19) rs ID | corresponding amino acid change | Deleteriousness | Conservation | ||
|---|---|---|---|---|---|---|
| CADD score (hg19) | GERP ++RS score | phyloP 100way vertebrate score | phastCons 100way vertebrate score | |||
| KATNA1 | 6–149,918,766 rs73781249 | A343T | 2.051033 | 5.48 | 4.834 | 1.000 |
| SPAG5 | 17–26,925,570 NA | P43S | –0.425670 | –3.57 | –1.404 | 0.000 |
| 17–26,919,777 NA | E162G | 0.296317 | 3.66 | 0.280 | 0.001 | |
| 17–26,919,034 NA | D410H | 1.062743 | 5.4 | 2.032 | 1.000 | |
| KNL1 | 15–40,912,860 rs755472529 | H159R | 0.475454 | 3.7 | –0.016 | 0.001 |
| 15–40,915,640 NA | G1086S | 0.801787 | 4.12 | 1.026 | 0.054 | |
| KIF18A | 11–28,119,295 rs775297730 | R67K | 1.134589 | 2.62 | 0.525 | 0.845 |
| NEK6 | 9–127,113,155 rs146443565 | D291H | –0.293112 | –1.56 | 3.284 | 1.000 |
| ATRX | X-76,939,325 rs146863015 | D475H | –0.141606 | 3.64 | 0.791 | 0.840 |
| RSPH1 | 21–43,897,491 rs146298259 | K213Q | –0.061053 | 1.81 | 0.672 | 0.079 |
| STARD9 | 15–42,985,549 rs573215252 | A3925T | –0.351117 | –2.51 | 0.047 | 0.000 |
Appendix 2—table 1
Age estimates of the missense substitutions in spindle genes.
The ages were estimated in the regions where the Altai Neandertal and Denisova 3 genomes fall outside the human variation (intersection of the regions identified with the African-American and deCODE recombination maps). The lower age corresponds to the mean age of the ancestor of multiple present-day African chromosome pairs. The upper age corresponds to the mean age of the common ancestor shared between each present-day African chromosome and either the archaic genome with the least number of differences (excluding Chagyrskaya 8 for KNL1) or a present-day human with an ancestral version of the missense variant(s).
| Gene | chromosome | Region (hg19) | Lower age (kya) | Upper age (kya) |
|---|---|---|---|---|
| ATRX | X | 76,703,773–77,246,471 | NA | NA |
| KATNA1 | 6 | 149,840,973–149,930,425 | 863 | 1,329 |
| KIF18A | 11 | 28,018,167–28,304,293 | 843 | 1,006 |
| KNL1 | 15 | 40,898,141–40,948,306 | 1,027 | 1,690 |
| NEK6 | 9 | 127,109,510–127,113,614 | NA | NA |
| RSPH1 | 21 | 43,897,417–43,897,549 | NA | NA |
| SPAG5 | 17 | 26,875,942–27,045,524 | 677 | 796 |
| STARD9 | 15 | 42,941,540–42,989,160 | 947 | 1,401 |
Appendix 3—table 1
Coverage depth in archaic human genomes at positions with modern human-specific missense substitutions in spindle genes.
The numbers of DNA fragments carrying a particular base are reported in parentheses after the corresponding base. Bases in uppercase were sequenced in the forward orientation, whereas those in lowercase were sequenced in the reverse orientation. Bases that are modern human-like (derived) are highlighted with an asterisk and may represent present-day human DNA contamination or an allele shared with modern humans. The bases that are compatible with a damage-induced substitution (from the ancestral allele) are highlighted in bold (i.e., C-to-T and G-to-A in the forward and reverse orientation, respectively).
| Gene | ATRX | KATNA1 | KIF18A | KNL1 | NEK6 | RSPH1 | SPAG5 | STARD9 | |||
|---|---|---|---|---|---|---|---|---|---|---|---|
| Chr-Position | X-76,939,325 | 6–149,918,766 | 11–28,119,295 | 15–40,912,860 | 15–40,915,640 | 9–127,113,155 | 21–43,897,491 | 17–26,919,034 | 17–26,919,777 | 17–26,925,578 | 15–42,985,549 |
| Ancestral | C | C | C | A | G | G | T | C | T | G | G |
| Derived | G | T | T | G | A | C | G | G | C | A | A |
| Altai Neandertal | C (21) c (31) | C (22) c (15) T* (2) | C (19) c (41) T* (1) | A (24) a (28) | G (33) g (16) | G (23) g (23) | T (18) t (26) | C (17) c (17) | T (18) t (20) a (1) | G (28) g (17) | G (13) g (16) A* (1) |
| Chagyrskaya 8 | C (10) c (9) T (1) t (1) | C (13) c (5) | C (15) c (19) T* (3) | A (1) G* (14) g* (11) | A* (19) a* (8) | G (5) g (7) a (1) | T (17) t (13) | C (11) c (7) T (1) | T (16) t (11) | G (7) g (6) a* (1) | G (8) g (13) |
| Denisova 3 | C (19) c (17) | C (15) c (13) T* (2) | C (17) c (24) | A (20) a (30) | G (25) g (17) a* (1) | G (15) g (14) | T (19) t (27) | C (20) c (14) | T (16) t (11) | G (12) g (6) | G (17) g (12) |
| Denisova 11 | C (1) c (2) | NA | C (1) | a (2) | g (1) | G (1) g (1) | T (4) t (2) | c (2) t (1) | NA | NA | G (1) |
| Goyet Q56-1 | C (1) | NA | C (1) c (5) | G* (1) | A* (1) a* (2) | G (1) g (2) | NA | C (1) | T (1) | G (4) g (2) | G (2) |
| Hohlenstein-Stadel | NA | NA | NA | NA | NA | NA | NA | NA | NA | NA | NA |
| Les Cottés Z4-1514 | C (1) c (1) | c (2) T* (1) | C (5) c (4) | A (2) a (4) | G (3) g (2) | NA | T (2) t (1) | NA | T (1) | G (1) | G (1) |
| Mezmaiskaya 1 | c (3) | NA | C (1) c (1) | NA | G (2) | NA | t (2) | C (2) c (1) g* (2) | NA | NA | NA |
| Mezmaiskaya 2 | C (1) | C (1) c (1) T* (1) | C (1) | g* (1) | A* (1) | G (2) g (1) | NA | C (1) | T (1) | G (2) | g (3) |
| Scladina I-4A | NA | NA | NA | NA | NA | NA | NA | NA | NA | NA | NA |
| Spy 94 A | NA | c (1) | C (1) | g* (1) | A* (1) a* (3) | NA | T (1) | C (1) | T (1) | g (1) | NA |
| Vindija 33.19 | C (16) c (18) T (1) | C (8) c (11) | C (17) c (20) T* (1) | A (13) a (19) | G (20) g (16) a* (2) | G (8) g (8) | T (22) t (15) | C (12) c (14) | T (15) t (7) | G (15) g (13) a* (1) | G (14) g (14) |
Appendix 3—table 2
Coverage depth of the Mezmaiskaya 1 genome at positions with modern human-specific substitutions in SPAG5.
Only positions covered by at least one DNA sequence are reported. Bases in uppercase were sequenced in the forward orientation, whereas those in lowercase were sequenced in the reverse orientation. The numbers of DNA fragments carrying a particular base are reported in parentheses after the corresponding base.
| Neandertal | Chr-position (rs ID) | Ancestral | Derived | Allele counts |
|---|---|---|---|---|
| Mezmaiskaya 1 | 17–26,864,608 (rs188710272) | A | G | A (1) |
| 17–26,891,162 (NA) | T | G | T (1) | |
| 17–26,892,376 (NA) | A | T | A (2) | |
| 17–26,913,024 (NA) | A | G | a (a) | |
| 17–26,919,034 (NA) | C | G | C (2) c (1) g (2) | |
| 17–26,948,236 (NA) | G | A | g (1) | |
| 17–26,967,723 (rs558276956) | A | G | A (3) | |
| 17–27,005,275 (NA) | G | A | G (1) | |
| 17–27,010,483 (NA) | G | A | g (1) |
Appendix 4—table 1
Positions defining the closely related haplotype between some modern humans and Neandertals.
At these positions, the Chagyrskaya 8 genome differs from other high-quality archaic genomes without the modern human-like haplotype but some African genomes from the HGDP dataset carry the same allele as Chagyrskaya 8. Note that the modern human-like haplotype in Neandertals is longer and defined by alleles that are shared with all modern humans (Figure 3).
| Chromosome | Position (hg19) rs ID | Reference | Alternative (Chagyrskaya 8-like) | Chagyrskaya 8-like allele frequency in genomes from the HGDP dataset | |
|---|---|---|---|---|---|
| Africans | Non-Africans | ||||
| 15 | 40,885,107 rs16970851 | A | G | 0.32 | 0.41 |
| 40,886,017 rs8034043 | C | T | 0.32 | 0.41 | |
| 40,886,020 rs8034048 | C | G | 0.32 | 0.40 | |
| 40,892,601 rs11855923 | G | A | 0.35 | 0.40 | |
| 40,893,573 rs12905162 | C | A | 0.38 | 0.40 | |
| 40,905,450 rs11856438 | C | T | 0.37 | 0.41 | |
| 40,908,904 rs11852670 | A | G | 0.39 | 0.41 | |
| 40,910,707 rs12914743 | T | C | 0.38 | 0.41 | |
| 40,915,045 rs8041534 | T | G | 0.38 | 0.41 | |
| 40,915,894 rs11070285 | T | C | 0.39 | 0.41 | |
| 40,925,214 rs11856802 | T | A | 0.39 | 0.41 | |
| 40,926,654 rs11854986 | C | G | 0.35 | 0.40 | |
| 40,929,814 rs11070286 | T | C | 0.37 | 0.41 | |
| 40,937,647 rs3092979 | A | G | 0.38 | 0.41 | |
| 40,959,413 rs73396515 | G | A | 0.36 | 0.10 | |
| 40,959,624 rs35047458 | G | A | 0.36 | 0.40 | |
| 40,960,432 rs12902568 | G | A | 0.36 | 0.40 | |
| 40,963,160 rs7182530 | A | G | 0.37 | 0.41 | |
| 40,987,528 rs1801320 | G | C | 0.38 | 0.11 | |
Appendix 5—table 1
Origin of the modern human genomes from the HGDP dataset (Bergström et al., 2020) with a KNL1 copy inherited from Neandertals.
| sample | population | region |
|---|---|---|
| HGDP00125 | Hazara | Central South Asia |
| HGDP00547 | Papuan Sepik | Oceania |
| HGDP00639 | Bedouin | Middle East |
| HGDP00696 | Palestinian | Middle East |
| HGDP00714 | Cambodian | East Asia |
| HGDP00774 | Han | East Asia |
| HGDP00822 | Han | East Asia |
| HGDP00954 | Yakut | East Asia |
| HGDP00960 | Yakut | East Asia |
| HGDP00966 | Yakut | East Asia |
| HGDP01023 | Han | East Asia |
| HGDP01181 | Yi | East Asia |
Appendix 6—table 1
Allele counts at positions with nearly fixed missense variants in the spindle genes of modern humans from the gnomAD database (v2.1.1), (Karczewski et al., 2020).
Columns 7–8 and 9–10 correspond to the allele counts among the 125,748 whole-exome sequences (WES) and the 15,708 whole-genome sequences (WGS), respectively. Anc = Ancestral
| Gene | Chr-Position (rd ID) | Anc | (nearly) fixed | Alleles | VEP Annot. | # Anc (WES) | Total (WES) | # Anc (WGS) | Total (WGS) |
|---|---|---|---|---|---|---|---|---|---|
| ATRX | X-76,939,325 (rs146863015) | C | G | G-C | missense | 66 | 182,745 | 11 | 22,042 |
| KATNA1 | 6–149,918,766 (rs73781249) | C | T | T-C | missense | 259 | 251,190 | 131 | 31,400 |
| KIF18A | 11–28,119,295 (rs775297730) | C | T | T-C | missense | 26 | 249,508 | 1 | 31,396 |
| KNL1 | 15–40,912,860 (rs755472529) | A | G | G-A | missense | NA | NA | 1 | 31,368 |
| G-T | missense | 1 | 227,420 | NA | NA | ||||
| 15–40,915,640 (NA) | G | A | A-G | missense | NA | NA | NA | NA | |
| NEK6 | 9–127,113,155 (rs146443565) | G | C | C-G | missense | 164 | 250,140 | 26 | 31,404 |
| RSPH1 | 21–43,897,491 (rs146298259) | T | G | G-T | missense | 236 | 251,414 | 30 | 31,386 |
| G-A | stop gained | 10 | 251,414 | 1 | 31,386 | ||||
| SPAG5 | 17–26,919,034 (NA) | C | G | G-C | missense | NA | NA | NA | NA |
| 17–26,919,777 (NA) | T | C | C-A | missense | 3 | 251,430 | NA | NA | |
| 17–26,925,578 (NA) | G | A | A-G | missense | NA | NA | NA | NA | |
| A-T | missense | 1 | 251,066 | NA | NA | ||||
| STARD9 | 15–42,985,549 (rs573215252) | G | A | A-G | missense | 5 | 139,342 | 3 | 31,284 |
| A-C | missense | 5 | 139,342 | NA | NA |
Additional files
Download links
A two-part list of links to download the article, or parts of the article, in various formats.
Downloads (link to download the article as PDF)
Open citations (links to open the citations from this article in various online reference manager services)
Cite this article (links to download the citations from this article in formats compatible with various reference manager tools)
The evolutionary history of human spindle genes includes back-and-forth gene flow with Neandertals
eLife 11:e75464.
https://doi.org/10.7554/eLife.75464


