Sleep EEG in young people with 22q11.2 deletion syndrome: A cross-sectional study of slow-waves, spindles and correlations with memory and neurodevelopmental symptoms
- Centre for Academic Mental Health, University of Bristol, United Kingdom
- Avon and Wiltshire Partnership NHS Mental Health Trust, United Kingdom
- School of Physiology, Pharmacology and Neuroscience, University of Bristol, United Kingdom
- Translational Neuroscience, Eli Lilly, United States
- Medical Research Council Centre for Neuropsychiatric Genetics and Genomics, Cardiff University, United Kingdom
- University of Bristol, United Kingdom
Figures
Figure 1 with 1 supplement
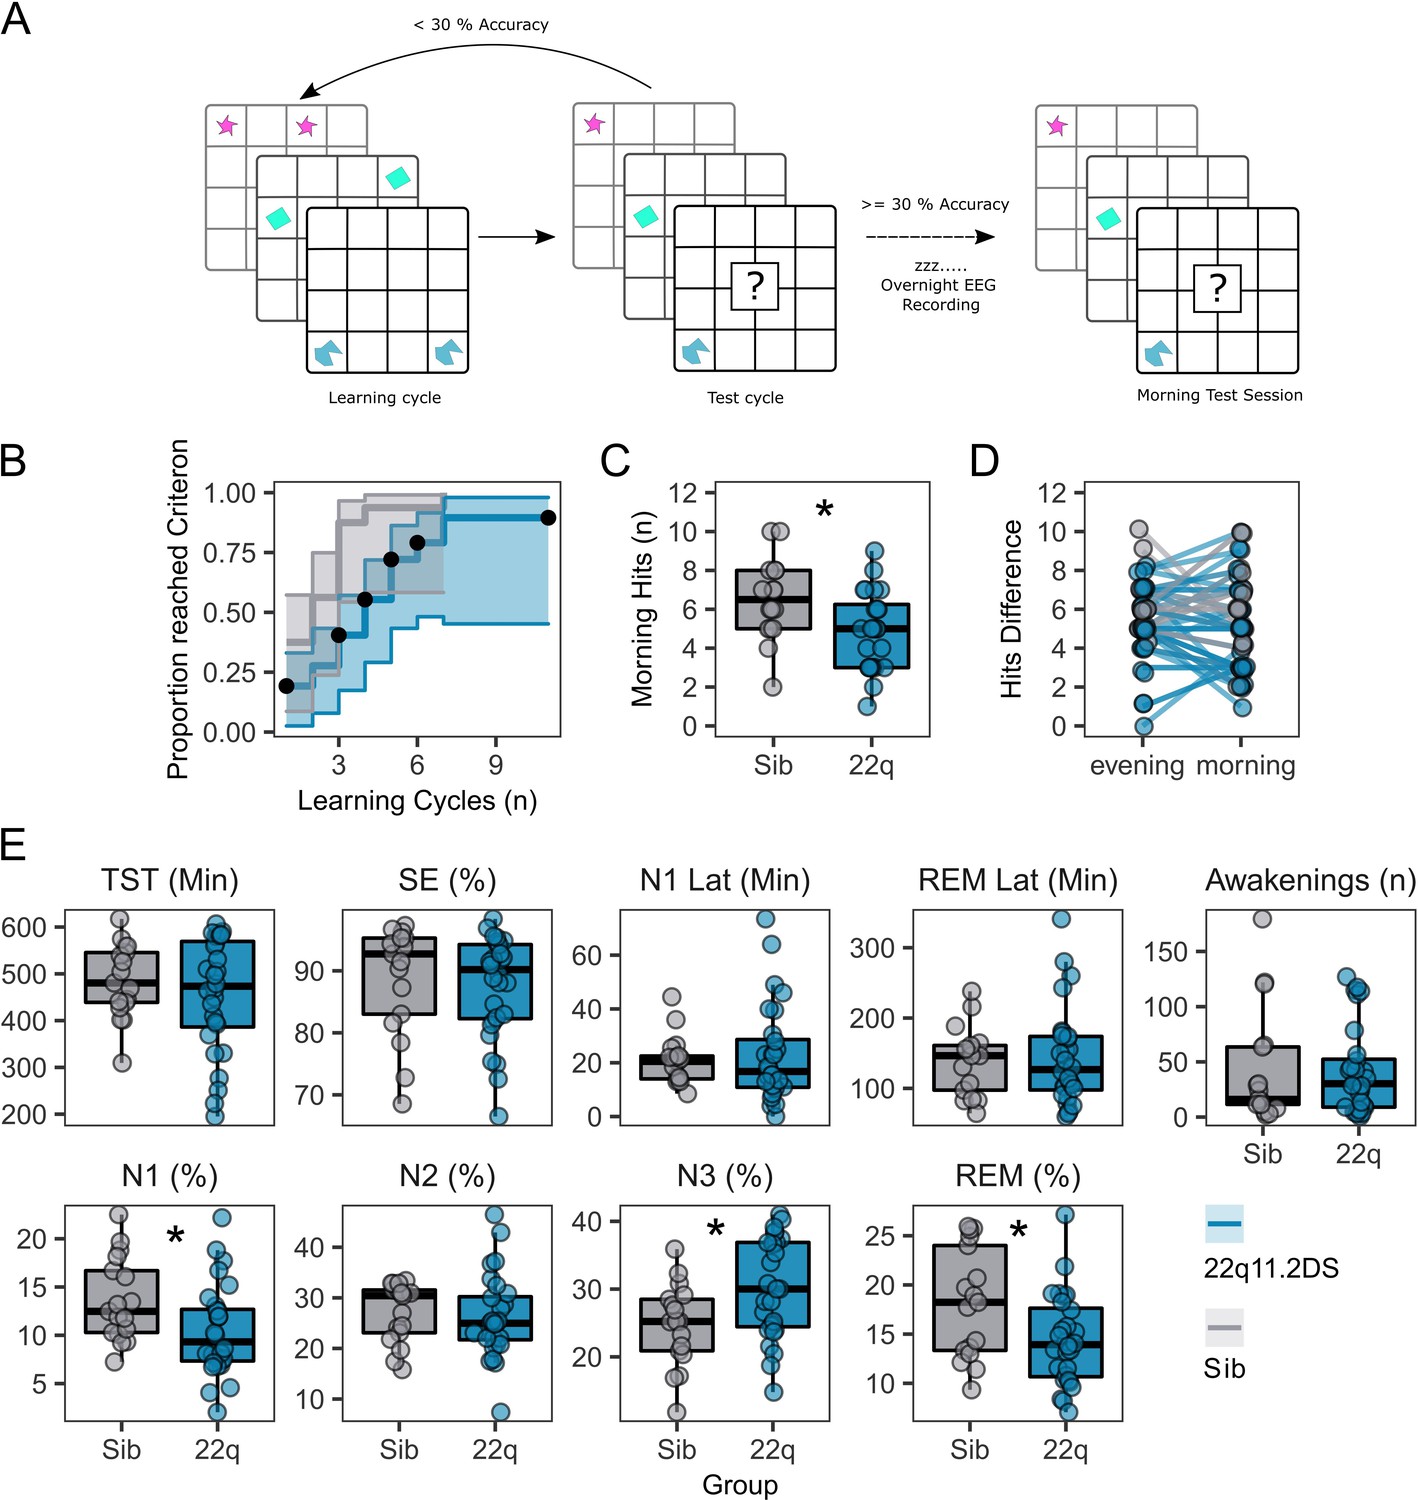
Memory task performance and sleep architecture features of 22q11.2DS.
(A): Schematic of the 2D object location task. The evening before sleep EEG recordings, participants first were sequentially presented with pairs of images on a 5 x 6 grid. In a subsequent test cycle, they were presented with one image of the pair, and were required to select the grid location of the other half of the pair. If the participant did not achieve > 30% accuracy, they would have another learning cycle. In the morning a single test cycle was undertaken.
(B): Plot of performance in acquiring the 2D object location task, showing the proportion of participants in each group reaching the 30% performance criterion after each learning cycle. Shaded areas represent the 95% confidence interval. Black dots show when participants were right-censored due to stopping the task prior to reaching the 30% criterion.
(C): Box plots of performance in the morning test session, where participants had one cycle of the memory task. Number of correct responses is out of a possible 15. Asterix indicate the group difference is statistically significant, generalised linear mixed model, p<0.05 (see Table 2 for full statistics).
(D): Plots of change in performance between the final evening learning session and the morning test session. Each participant is represented as a point, with a line connecting their evening and morning performance. Points have been slightly jittered to illustrate where multiple participants had the same score.
(E): Box and whisker plots showing sleep architecture features: Total sleep time (TST) in minutes, Sleep efficiency (SE) as a percentage, Latency to N1 sleep (minutes), Latency to first REM sleep (minutes), Number of awakenings after sleep onset (n), Percentage of hypnogram in N1 sleep, Percentage of hypnogram in N2 sleep, Percentage of hypnogram in N3 sleep, and Percentage of hypnogram in REM sleep. Asterixes indicate the group difference is statistically significant, linear mixed model, P<0.05 (see Table 1 for full statistics). Boxes represent the median and IQR, with the whiskers representing 1.5 x the IQR. Individual participant data are shown as individual points. Points have been slightly jittered in the x direction only to illustrate where multiple participants had similar results.
Figure 1—figure supplement 1
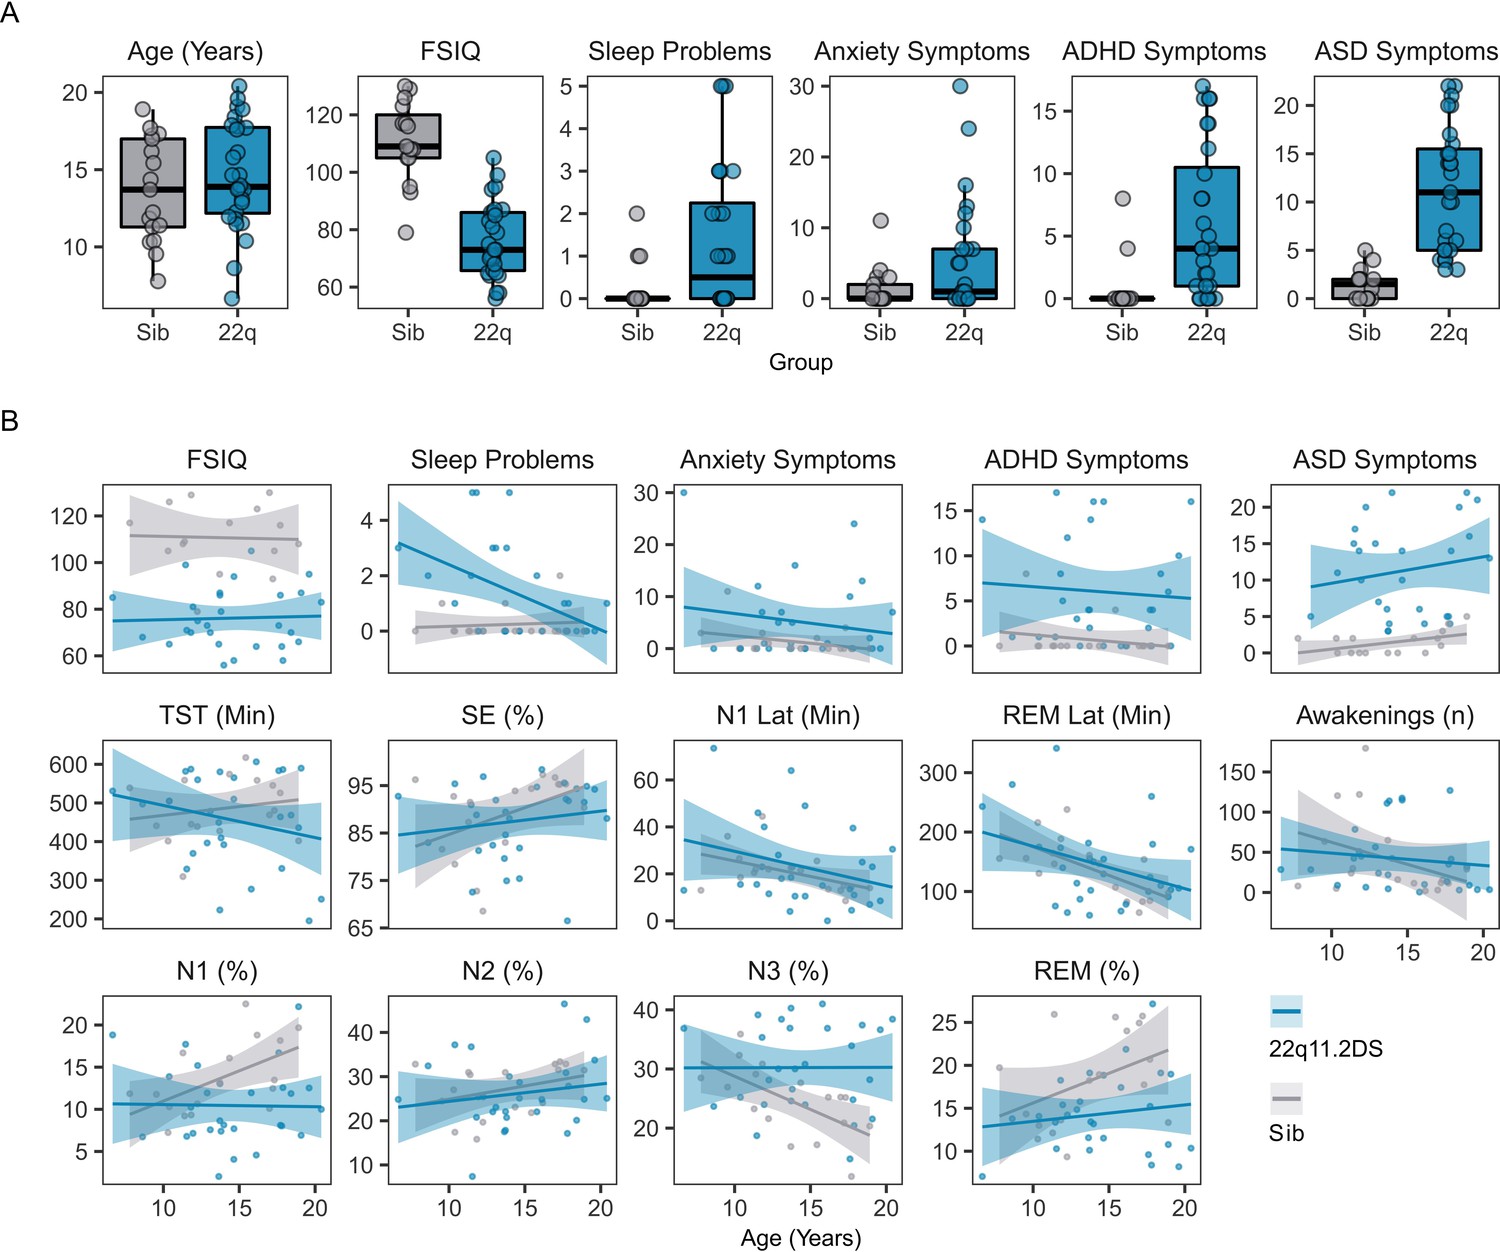
Individual Psych Hypno Data.
(A) Boxplots and overplotted individual data for participant age, Full Spectrum IQ (FSIQ) and psychiatric symptoms. ADHD = Attention Deficit Hyperactivity Disorder symptoms, from the CAPA interview; ASD = Autism Spectrum Disorder symptoms, from the SCQ interview. Boxes represent the median and IQR, with the whiskers representing 1.5 x the IQR. Individual participant data are shown as individual points. Points have been slightly jittered in the x direction only to illustrate where multiple participants had similar results. (B) Line plots and overplotted individual data for FSIQ, psychiatric and hypnographic measures, plotted against participant age at the time of EEG. Lines of best fit and 95% confidence intervals are derived from linear models. Acronyms: TST = Total Sleep Time (in minutes); SE = Sleep Efficiency (%); N1 Lat = Latency to reach first N1 sleep epoch, (in minutes); REM Lat = Latency to reach first REM sleep epoch (in minutes); N1 = Percentage of night in N1 sleep; N2 = Percentage of night in N2 sleep; N3 = Percentage of night in N3 sleep; REM = Percentage of night in REM sleep.
Figure 2 with 2 supplements
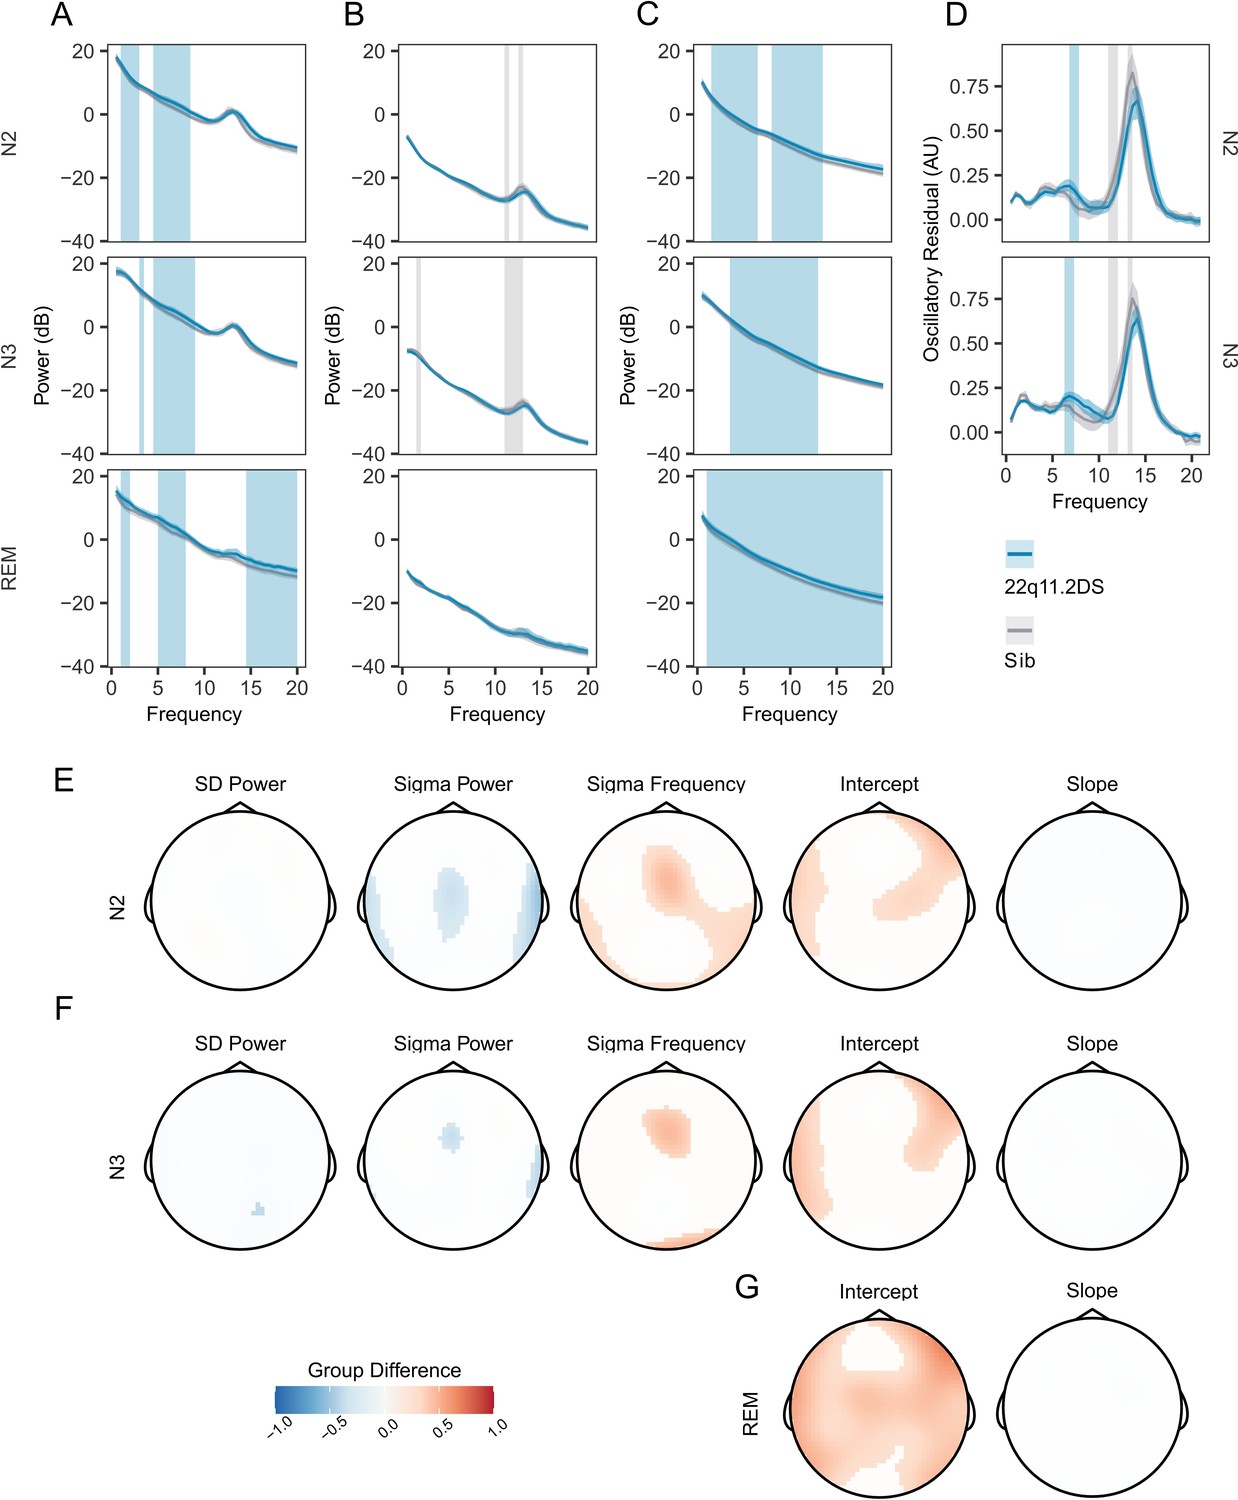
Increased PSD power and Sigma Frequency in 22q11.2DS.
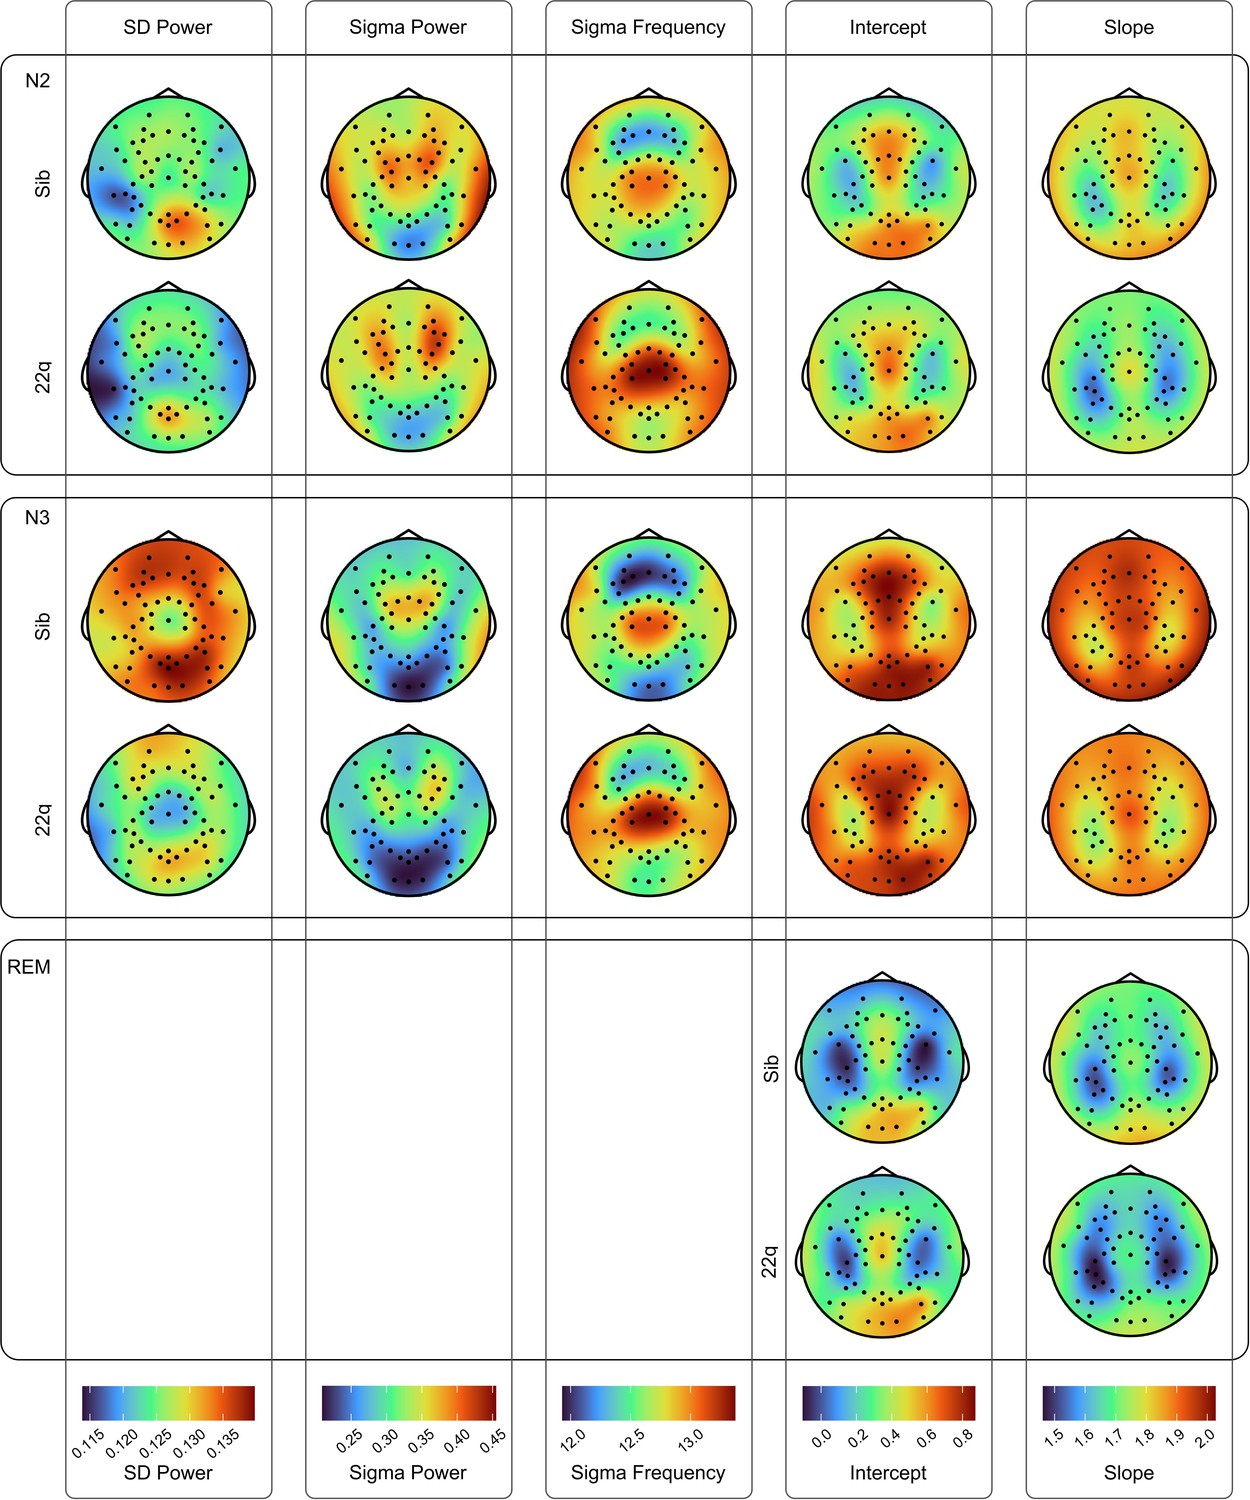
(A) Raw Welch Power Spectral Density (PSD, in decibels, 10 * log10 of the PSD) on electrode Cz across Stage N2, N2, and REM sleep. Lines show group mean power (blue = 22q11.2DS, gray = Sibling), with bootstrapped 95% confidence intervals of the mean. Patches show regions of significant (cluster corrected) difference between groups (blue = 22q11.2DS >Sibling; grey = 22q11.2DS <Sibling), with 22q11.2DS being associated with increased power at lower frequencies. (B) Welch PSD of Z-Scored EEG signals on electrode Cz, as in (A); with 22q11.2DS being associated with lower power in the sigma frequency band (10–16 Hz) (C) Fractal (1 /f) component of EEG signal processed using the IRASA method on electrode Cz, conventions as (A). Higher power across a wide frequency range in 22q11.2DS. (D) Oscillatory component of the EEG signal processed using the IRASA method on electrode Cz, conventions as (A). (E) Topoplots of group difference calculated from multilevel generalized additive models fit to the full 60 channel dataset for the five measures (mean Slow Delta power, mean Sigma power and peak Sigma frequency, 1 /f Intercept and 1 /f Slope) recorded in N2 sleep. Positive differences represent z score group differences indicate 22q11.2DS >Sibling (red colors); negative group differences (blue colors) indicate 22q11.2DS <Sibling. Only regions were where the probability of direction statistic for group difference was >0.995 are colored. (F) As in (E), for N3 sleep. (G) As in (F), for REM sleep. Note as REM sleep lacks prominent oscillatory activity, we have not calculated models for SD or sigma related measures in REM as these would not be meaningful.
Figure 2—figure supplement 1
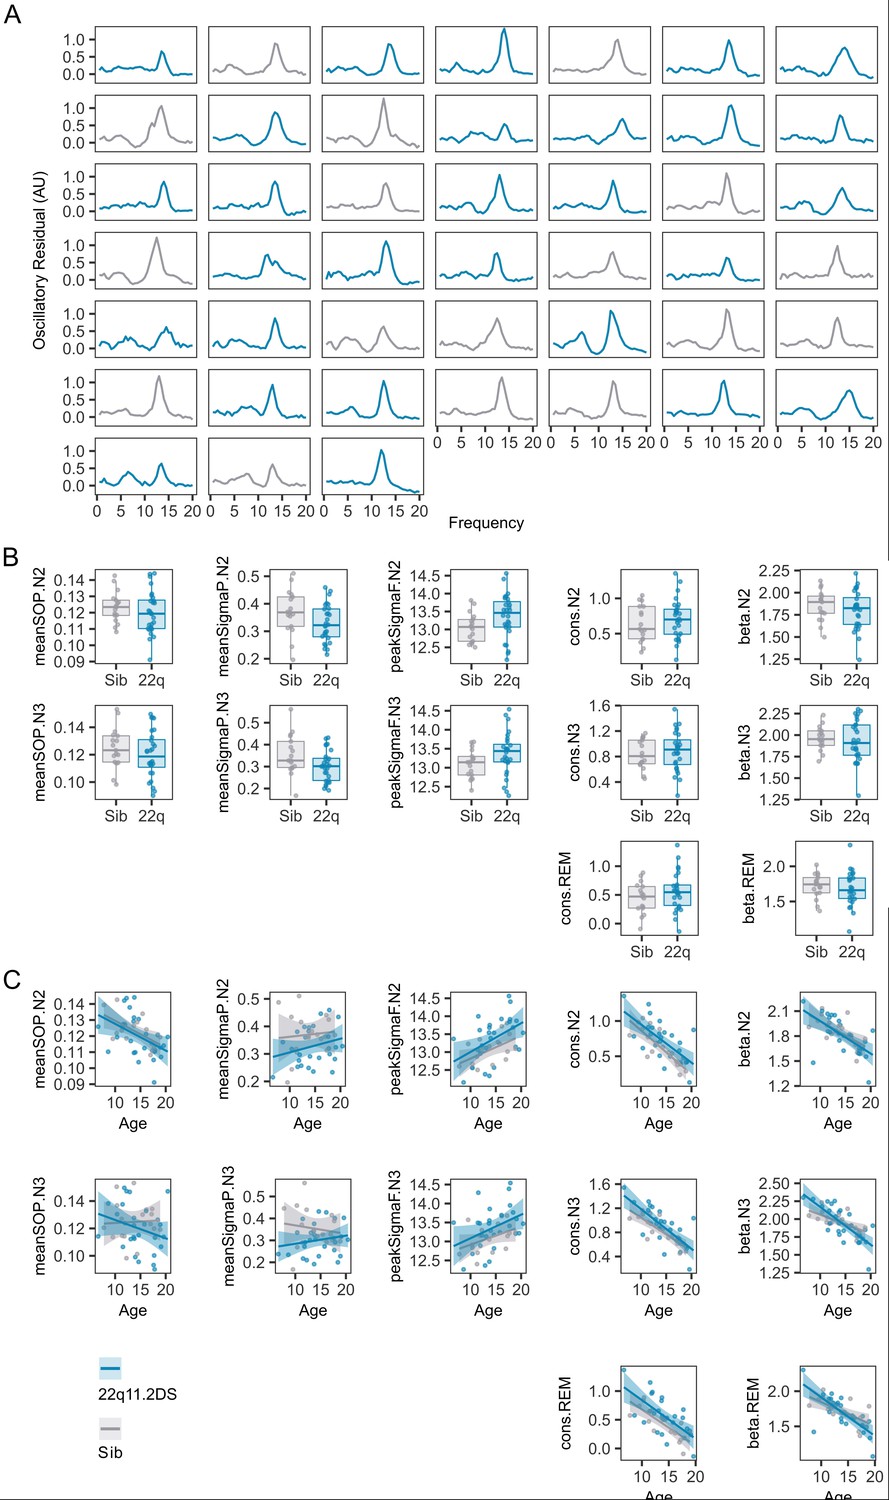
Individual PSDs.
(A)Plots of the oscillatory signal component of the EEG for each individual in stage N2 (each plot is the average PSD for a single participant). Plots are colored by genotype; grey = sibling, blue = 22q11.2DS. (B) Boxplots and overplotted individual data for spectral measures derived from N2, N3 and REM epochs. Boxes represent the median and IQR, with the whiskers representing 1.5 x the IQR. Individual participant data are shown as individual points. Points have been slightly jittered in the x direction only to illustrate where multiple participants had similar results. (C) Line plots and overplotted individual data for spectral measures derived from N2, N3, and REM epochs, plotted against participant age at the time of EEG. Lines of best fit and 95% confidence intervals are derived from linear models.
Figure 2—figure supplement 2
Group PSD Topos.
Topoplots of group average values for spectral EEG measures (slow delta power, sigma power, peak sigma frequency, 1 /f signal component intercept and 1 /f signal component slope), across N2, N3, and REM epochs. Topoplots in the same column are on the same color scale (color scale shown at the bottom of each column).
Figure 3 with 3 supplements
Spindles and slow waves in 22q11.2DS.
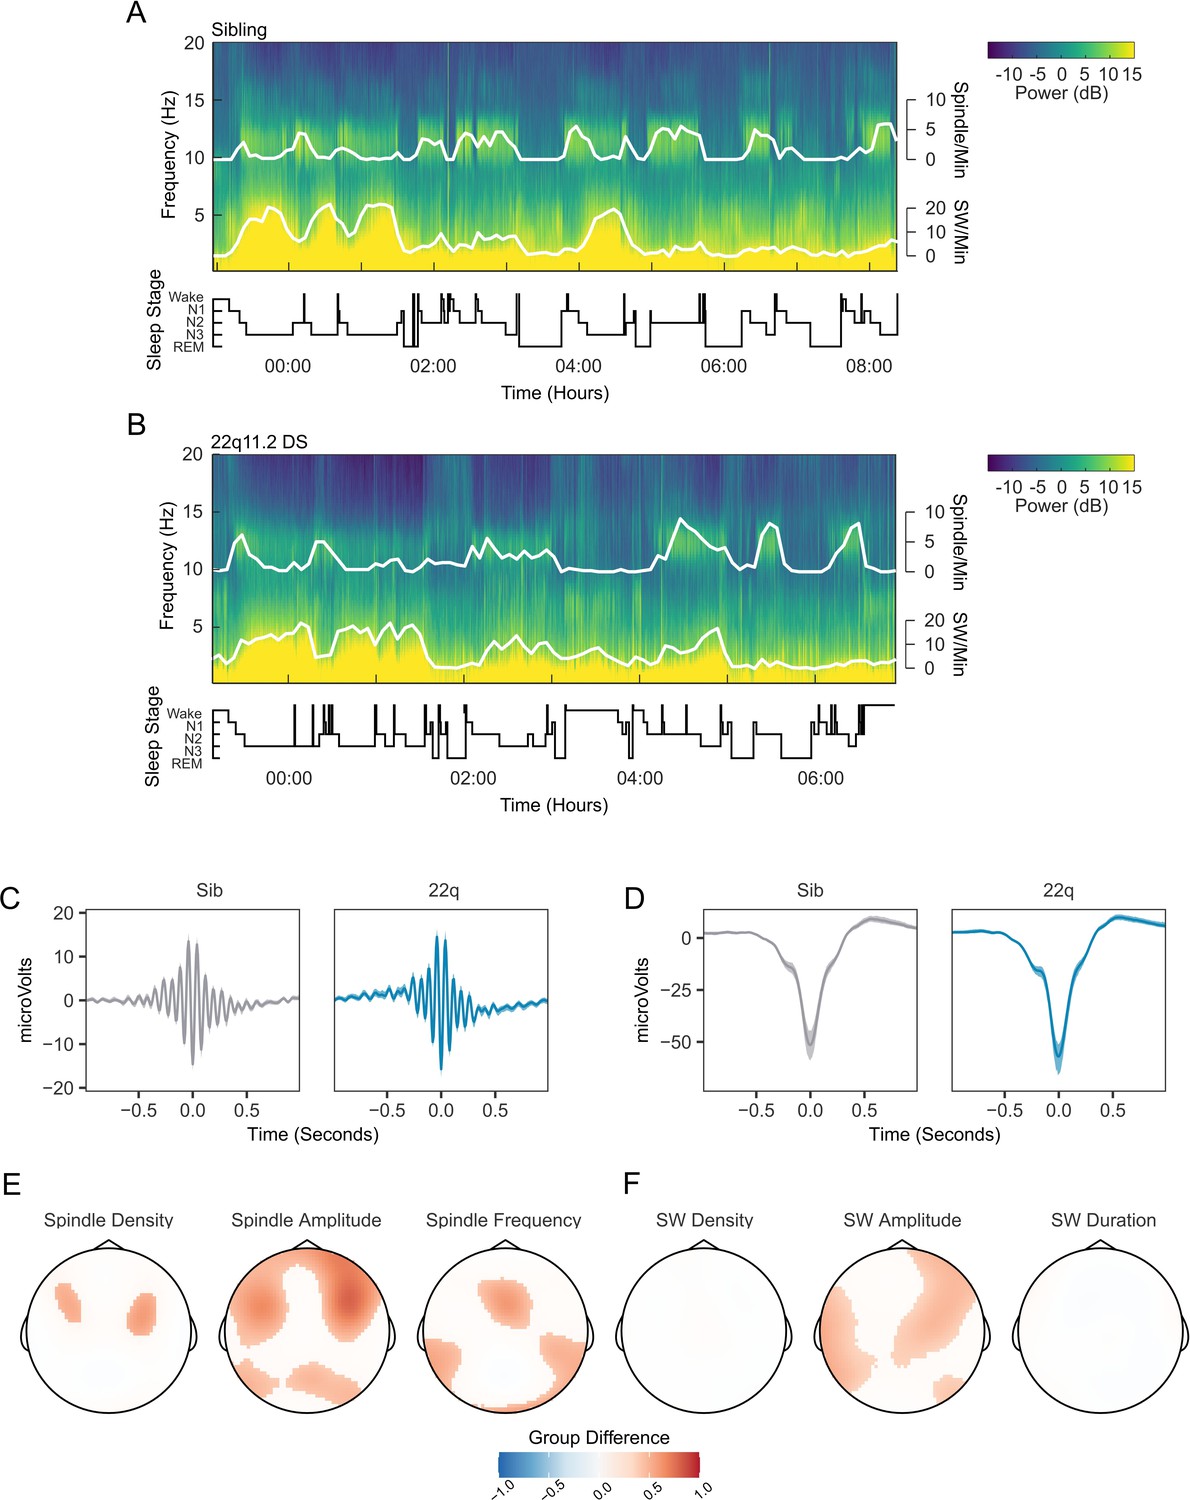
(A) Example spectrogram of a whole night EEG recording from electrode Cz for an example sibling. The associated hypnogram is displayed below the spectrogram in black, detected spindle and slow wave events are overplotted in white. The co-occurrence of spindle events with epochs of N2 sleep, and of SW events and N3 sleep can be observed. (B) Example spectrogram of a whole night EEG recording from electrode Cz for an example participant with 22q11.2DS, sibling of the participant illustrated in A (C) Average spindle waveforms detected on electrode Cz for siblings (left, gray), and 22q11.2DS (right, blue). For each individual the average spindle waveform at Cz was calculated, these averaged waveforms were then calculated for all siblings or all participants with 22q11.2DS. Shaded areas highlight the bootstrapped 95% confidence interval of the mean. (D) Average SW waveforms detected on electrode Cz, same conventions as C (E) Topoplots of group differences in spindle density, amplitude and frequency, Z-transformed, across all 60 electrodes, from GAMM analyses. Only regions with significant group differences are highlighted. Red colors indicate values of the parameter of interest are greated in 22q11.2DS; blue color that the parameter of interest is greater in siblings (F) Topoplots of group differences in SW density, amplitude and duration, conventions as in E.
Figure 3—figure supplement 1
Individual event data.
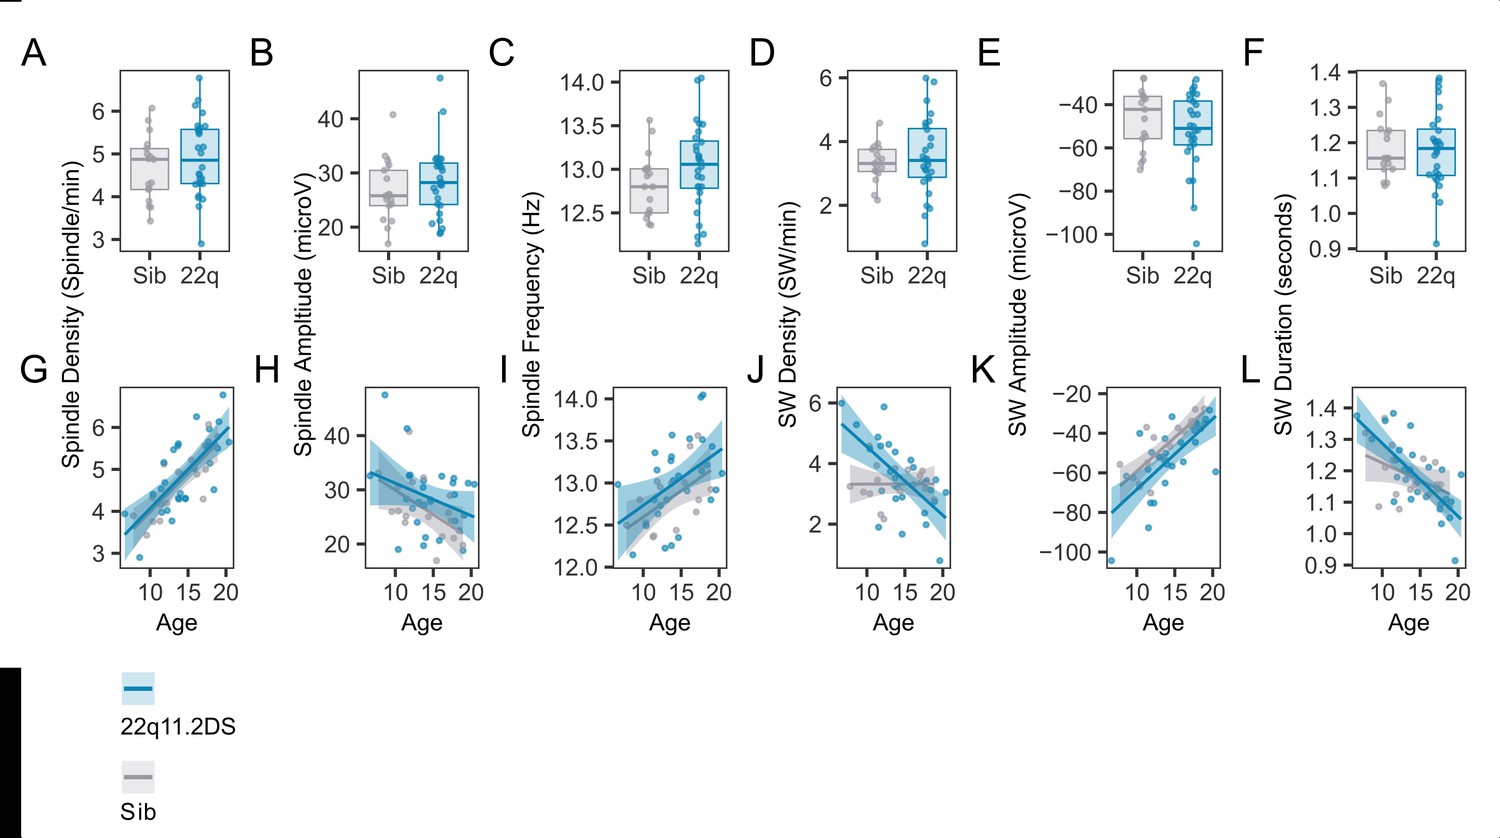
(A)Boxplots and overplotted individual data for spindle and SW measures. Boxes represent the median and IQR, with the whiskers representing 1.5 x the IQR. Individual participant data are shown as individual points. Points have been slightly jittered in the x direction only to illustrate where multiple participants had similar results. (B) Line plots and overplotted individual data for spindle and SW measures, plotted against participant age at the time of EEG. Lines of best fit and 95% confidence intervals are derived from linear models.
Figure 3—figure supplement 2
Group event topoplots.
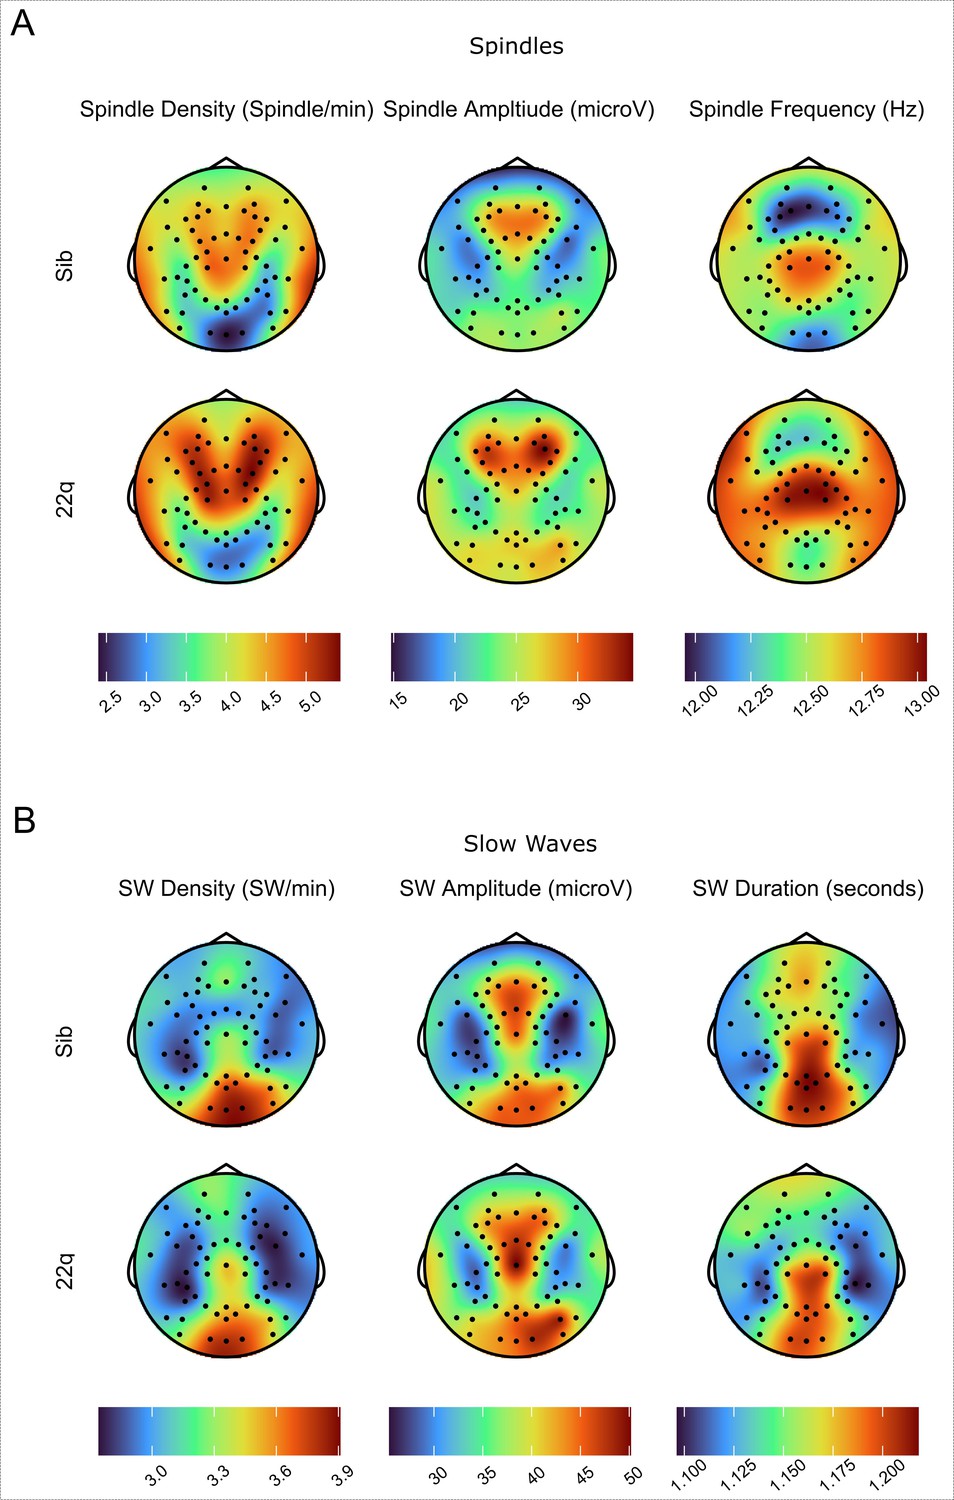
(A)Topoplots of group average values for spindle measures (density, amplitude, and frequency). Topoplots in the same column are on the same color scale (color scale shown at the bottom of each column). (B) Topoplots of group average values for SW measures (density, amplitude, and duration). Topoplots in the same column are on the same color scale (color scale shown at the bottom of each column).
Figure 3—figure supplement 3
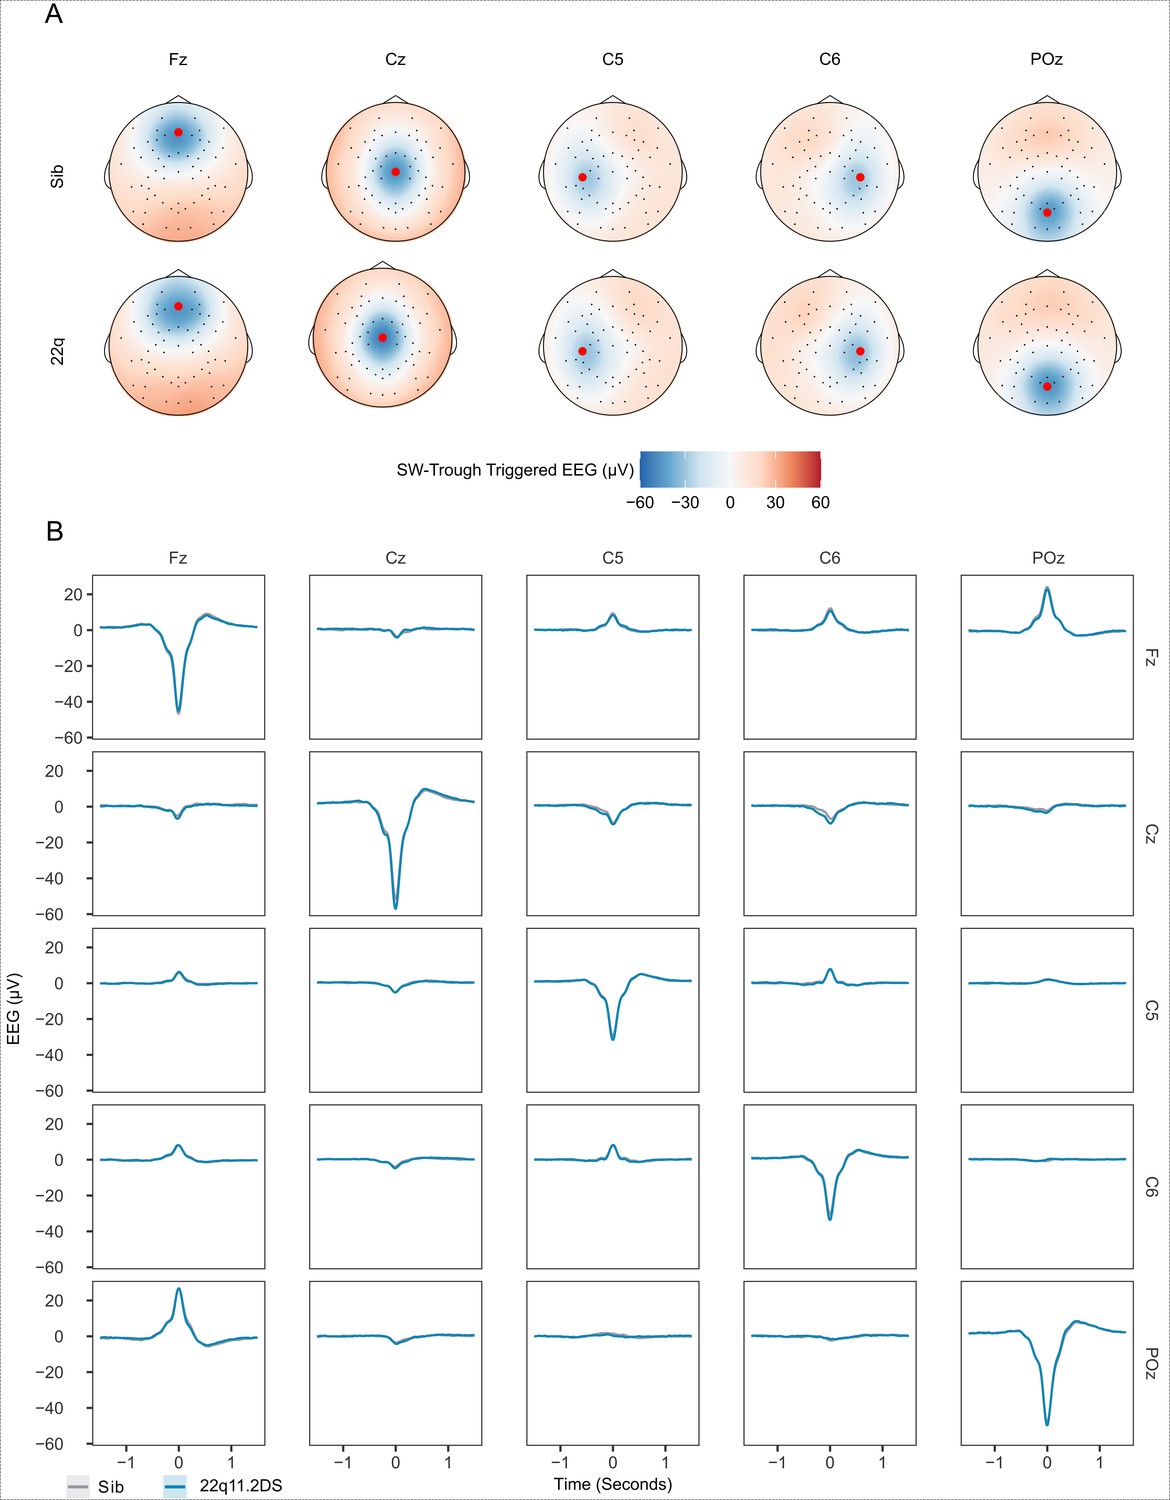
SW-triggered potentials.
(A) The panels show topographical representations of the voltage (in microVolts) recorded at all electrodes at the negative trough of a SW detected at 5 seed electrodes (Fz, Cz, C5, C6 and POz, seed electrode locations are highlighted with red dots.). Each panel shows the average over all SWs detected on that electrode for each group. (B) Average SW waveforms across the same set of seed electrodes as in (A), with the average waveform at the time of the SW trough at the seed electrode (trigger, columns) shown at all other seed electrodes (target, rows) This demonstrates that when negative SW troughs are detected on a given electrode, negative potentials are also recorded on adjacent electrodes, and positive potentials are detected on distant electrodes, reflecting volume conduction and the average reference applied during pre-processing. Note that only negative SWs were detected on each electrode for further analysis, and we performed no cross-electrode analysis (e.g. coherence) in the present study.
Figure 4 with 3 supplements
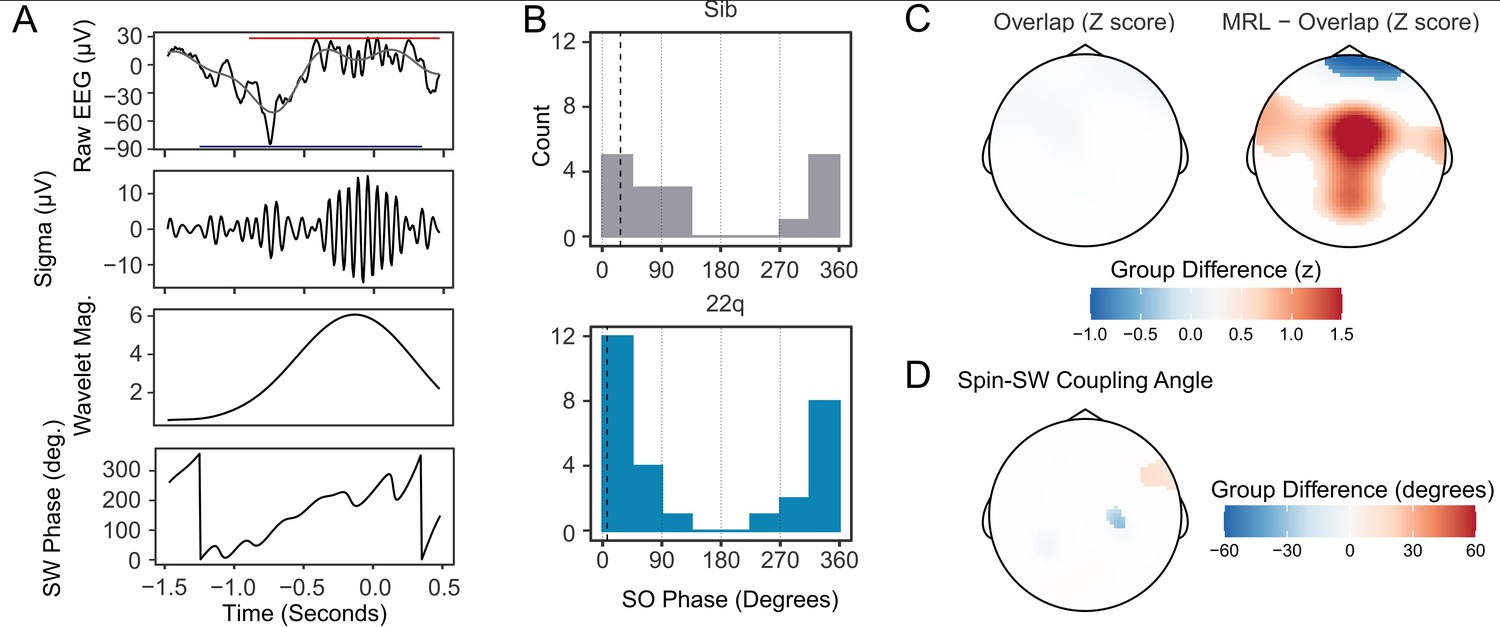
Increased spindle-SW coupling in 22q11.2DS.
(A) Illustrative plot of a single spindle and SW recorded at electrode Cz in a control sibling. From top to bottom, panels show the raw EEG (black) with Slow-Wave frequency (0.25–4 Hz) filtered data superimposed (gray) and with the detected boundaries of the spindle and SW highlighted with a red and blue horizontal bar, the sigma-filtered raw signal (10–16 Hz); the magnitude of the continuous wavelet transform of the signal (center frequency 13 Hz); and the SW phase (in degrees). (B) Histograms of the mean SW phase angle of spindles detected overlapping an SW for all participants at electrode Cz. The SO phase angles are as defined in (A). Black vertical dashed lines indicate the mean coupling phase angle for each group (C) Topoplots of group difference in spindle-SW coupling properties: z-transformed spindle-SW overlap (left), and z-transformed mean resultant length (right). The color represents the difference in z-score between groups where a multilevel generalized additive model fit to each dataset predicts a difference between group. (D) Topoplots of mean Spindle-SW coupling phase angle, where a multilevel generalized additive model fit to each dataset predicts a difference in coupling phase angle between groups.
Figure 4—figure supplement 1
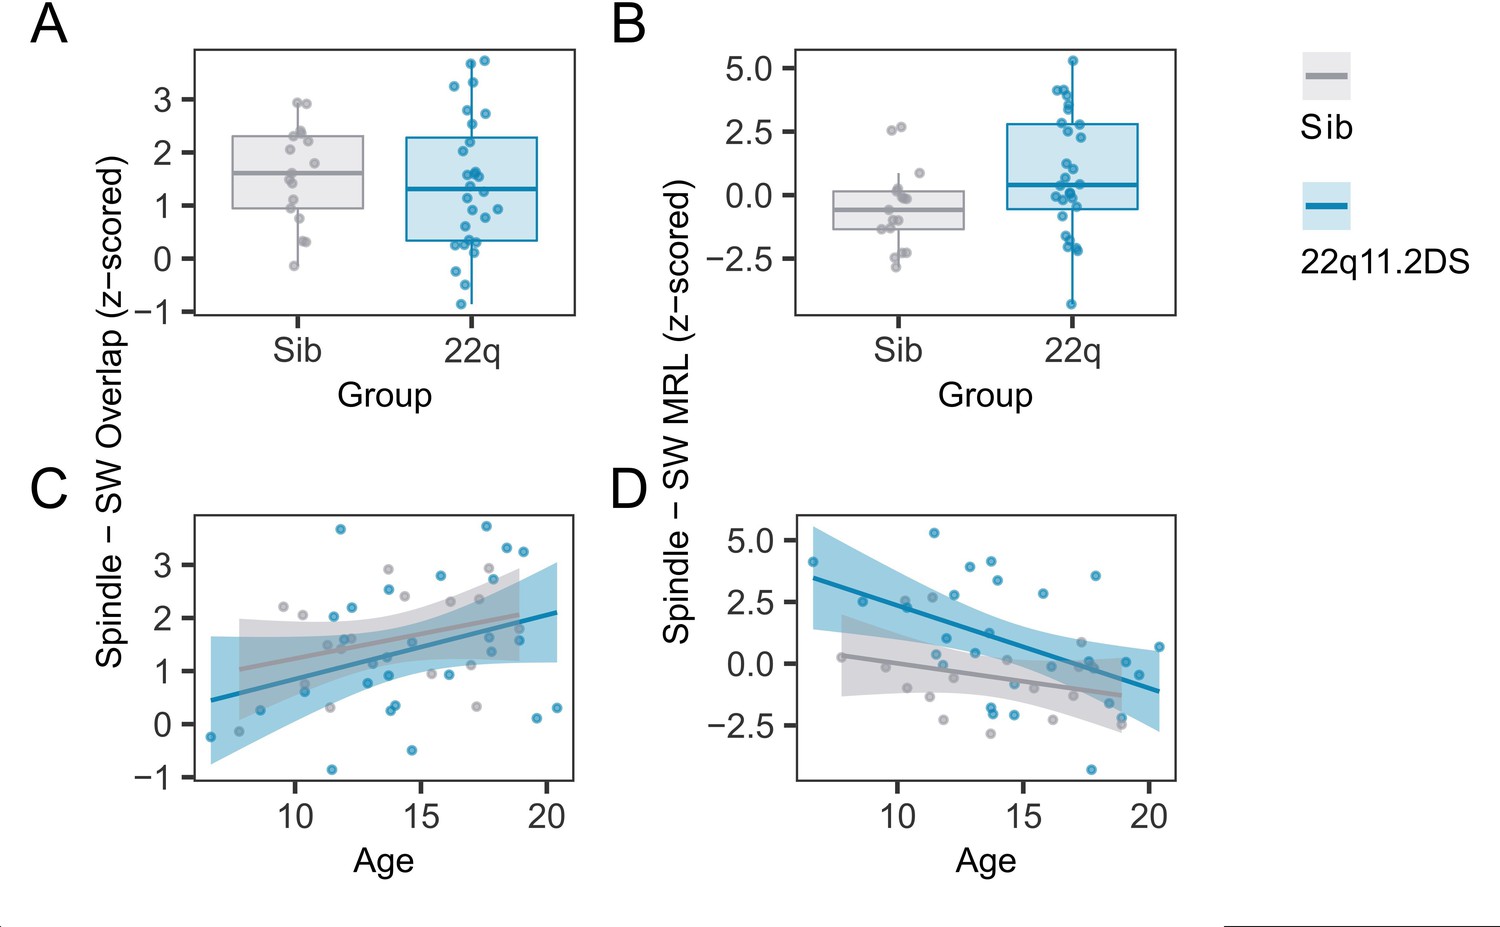
Individual coupling data.
(A) Boxplots and overplotted individual data for spindle - SW overlap. Boxes represent the median and IQR, with the whiskers representing 1.5 x the IQR. Individual participant data are shown as individual points. Points have been slightly jittered in the x direction only to illustrate where multiple participants had similar results. (B) Boxplots and overplotted individual data for spindle - SW MRL, conventions as A. (C) Line plots and overplotted individual data for spindle - SW overlap, plotted against participant age at the time of EEG. Lines of best fit and 95% confidence intervals are derived from linear models. (D) Line plots and overplotted individual data for spindle - SW MRL, conventions as C.
Figure 4—figure supplement 2
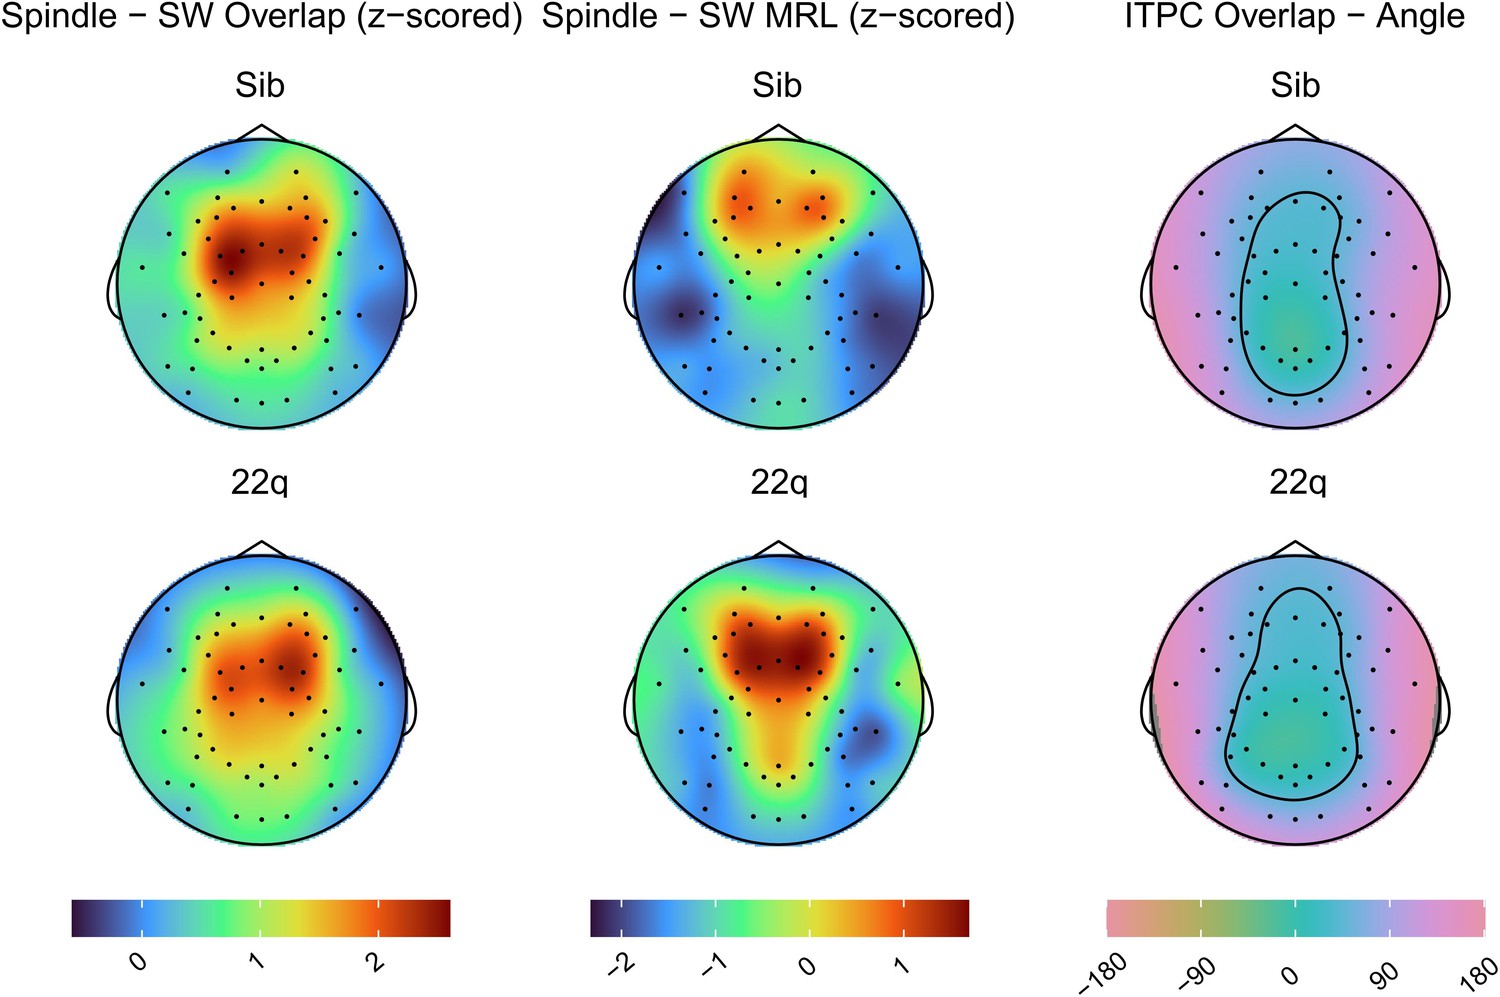
Topoplots of group average values for spindle – SW coupling measures (overlap, MRL and mean angle).
Topoplots in the same column are on the same color scale (color scale shown at the bottom of each column), note the Angle Measure is in degrees.
Figure 4—figure supplement 3
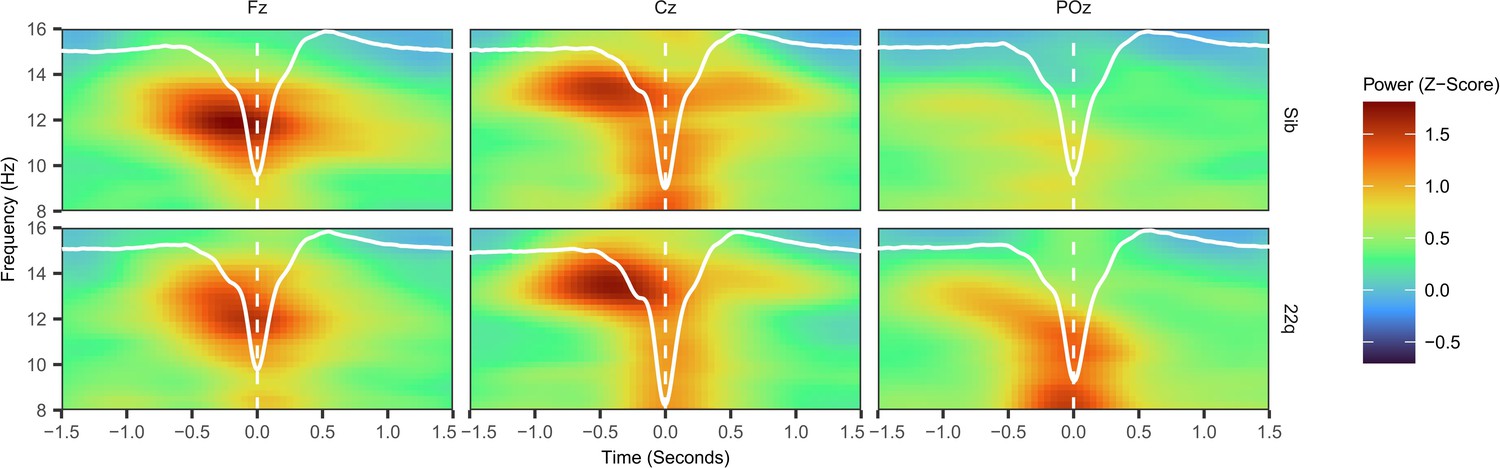
SW-Triggered Scalograms.
This plot shows the average peri-SW scalogram (time-locked to the SW trough) recorded on electrodes Fz, Cz and POz, with average SW waveforms recorded o the same electrodes superimposed in white. This time-frequency representation is normalised to the average scalogram of the 2 – 1.5 seconds prior to the SW trough and therefore is a z-score. Note that power in the spindle frequency range appears to peak prior to the SW trough, particularly on electrode Cz.
Figure 5

EEG signatures of sleep dependent memory consolidation.
(A) Scatter plot of the relationship between EEG measures (recorded on electrode Cz) and hits in the memory task test session, by group. Lines represent predicted mean values, with 95% confidence interval, from linear mixed model.
(B) Topoplots of the value of the group*EEG feature interaction term, for models fit to hits in the morning test session. Electrodes highlighted in white indicate a significant interaction for an EEG measure detected on that channel, after correction for multiple comparisons. Note all topoplots are on the same color scale.
Figure 6
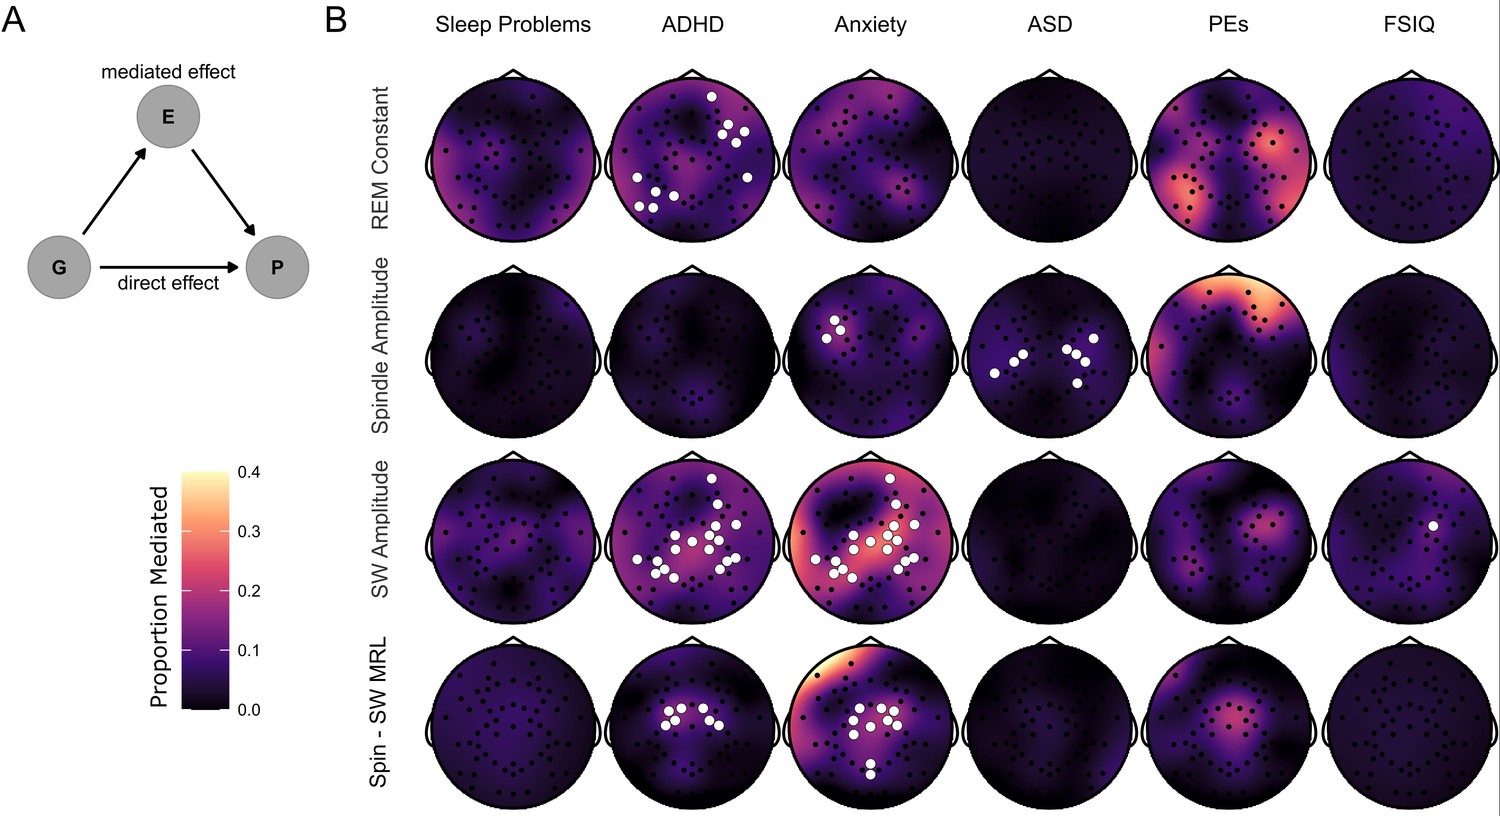
Mediation of psychiatric symptoms and FSIQ by sleep EEG features.
(B) Topoplots of the proportion of the effect of genotype on psychiatric measures and FSIQ mediated by one of four NREM sleep EEG features (REM constant spindle amplitude, SW amplitude and spindle-SW MRL). Fill color represents the Proportion Mediated. Electrodes are highlighted in white where a mediation model fit on data from that electrode had a significant mediated effect and a significant total effect, corrected for multiple comparisons by the cluster method.
(A) Directed acyclic graph describing the mediation model fit to EEG data. The effect of Group (G) on psychiatric measures and FSIQ (P) was hypothesized to be mediated by (E) – sleep EEG features.
Tables
Table 1
Psychiatric characteristics and sleep architecture.
| Variable | Group | Type | Statistic (95% CI) | p-value | |
|---|---|---|---|---|---|
| 22q11.2DS, n=28 a | Sibling Control, n=17 a | ||||
| Age @ EEG | 14.6 (3.4) | 13.7 (3.4) | Group Difference (22q - Sib) b | 0.897 [-1.219, 3.013] | 0.397 |
| Sex | Chi-Squared c | 0 | 1 | ||
| Female | 14 (50%) | 9 (53%) | |||
| Male | 14 (50%) | 8 (47%) | |||
| Sleep Problem | 1.32 (1.70) | 0.24 (0.56) | Odds Ratio d | 6.269 [2.118, 18.556] | 0.001 |
| FSIQ | 76 (13) | 105 (27) | Group Difference (22q - Sib) e | –28.696 [-40.478,–16.915] | <0.001 |
| missing | 0 | 1 | |||
| Anxiety Symptoms | 5.0 (7.8) | 1.4 (2.8) | Odds Ratio d | 3.101 [1.929, 4.986] | <0.001 |
| ADHD Symptoms | 6.0 (6.0) | 0.7 (2.1) | Odds Ratio d | 9.456 [5.117, 17.475] | <0.001 |
| ASD Symptoms | 11 (6) | 1 (2) | Odds Ratio d | 7.463 [4.762, 11.697] | <0.001 |
| missing | 1 | 1 | |||
| Psychotic Experiences | Odds Ratio f | 4.047 [0.698, 43.668] | 0.096 | ||
| No PE | 18 (64%) | 15 (88%) | |||
| PE | 10 (36%) | 2 (12%) | |||
| N1 (%) | 10.4 (4.7) | 13.6 (4.3) | Group Difference (22q - Sib) e | –2.707 [-5.05,–0.363] | 0.044 |
| N2 (%) | 26.2 (8.2) | 27.1 (5.9) | Group Difference (22q - Sib) e | –1.089 [-5.146, 2.967] | 0.620 |
| N3 (%) | 30 (7) | 25 (6) | Group Difference (22q - Sib) e | 5.473 [1.984, 8.962] | 0.009 |
| REM (%) | 14.4 (4.6) | 18.2 (5.6) | Group Difference (22q - Sib) e | –4.198 [-7.1,–1.296] | 0.012 |
| N1 Latency (Minutes) | 23 (18) | 21 (9) | Group Difference (22q - Sib) e | 3.486 [-5.538, 12.509] | 0.470 |
| REM Latency (Minutes) | 143 (69) | 140 (49) | Group Difference (22q - Sib) e | 9.368 [-19.312, 38.048] | 0.549 |
| Sleep Efficiency (%) | 88 (8) | 89 (9) | Group Difference (22q - Sib) e | –1.845 [-5.826, 2.136] | 0.398 |
| Total Sleep Time (Minutes) | 456 (122) | 485 (79) | Group Difference (22q - Sib) e | –27.206 [-88.489, 34.077] | 0.413 |
| Awakenings (n) | 42 (52) | 42 (40) | Group Difference (22q - Sib) e | 3.097 [-19.732, 25.925] | 0.802 |
| a Mean (SD); n (%) | |||||
| b Linear Model | |||||
| c Pearson’s Chi Squared Test | |||||
| d Generalised Linear Mixed Model | |||||
| e Linear Mixed Mode | |||||
| f Fisher’s Exact Test | |||||
Table 2
Psychotic experiences details.
| Frequency of specific psychotic experiences | ||
|---|---|---|
| Type of PE | 22q11.2DS | Sibling |
| Unusual thought content/Delusional ideas | 8 | 1 |
| Suspiciousness/Persecutory ideas | 5 | 0 |
| Grandiose Ideas | 3 | 2 |
| Perceptual Abnormalities/Hallucinations | 8 | 2 |
| Disorganised communication | 4 | 0 |
| Count of total distinct types of psychotic experience | ||
| Number of PE | 22q11.2DS | Sibling |
| 0 | 18 | 15 |
| 1 | 2 | 0 |
| 2 | 2 | 1 |
| 3 | 2 | 1 |
| 4 | 4 | 0 |
-
Details of psychotic experiences reported by participants with 22q11.2DS and unaffected sibling controls in the CAPA interview.
Table 3
CAPA sleep problem adjusted model.
| Term | Odds ratio | p-value | |
|---|---|---|---|
| Genotype | Sibling | Reference | |
| 22q11.2DS | 7.867 [1.71, 36.186] | 0.008 | |
| Gender | Female | Reference | |
| Male | 1.557 [0.486, 4.986] | 0.456 | |
| Age @ EEG | 0.757 [0.622, 0.921] | 0.005 | |
| Family income (£PA) | <19,999 | Reference | |
| 20,000–39,999 | 0.38 [0.068, 2.13] | 0.271 | |
| 40,000–59,999 | 0.227 [0.034, 1.505] | 0.124 | |
| >60,000 | 0.297 [0.043, 2.058] | 0.219 | |
| Anxiety symptomsa | 1.117 [1.031, 1.21] | 0.007 | |
| ADHD symptomsa | 1.025 [0.945, 1.112] | 0.546 | |
| ASD symptomsa | 0.964 [0.869, 1.07] | 0.488 | |
| Psychotic experiences (PEs) | No PEs | Reference | |
| PEs | 1.369 [0.646, 2.9] | 0.413 | |
| aContinuous variables (no reference category) | |||
-
Associations between CAPA sleep problem count and group, demographic, family and psychiatric covariates, modeled with a generalized linear mixed model, with a poisson distribution and family identity as a random (varying) intercept. Data shown are odds ratios and the 95% confidence interval.
Table 4
Memory task acquisition and test session performance.
| Cycles to Criterion Cox Model | |||
|---|---|---|---|
| Term | Hazard ratio | p-value | |
| Group | Control | Reference | |
| 22q11.2DS | 0.328 [0.151, 0.714] | 0.005 | |
| Gender | Female | Reference | |
| Male | 1.389 [0.642, 3.005] | 0.400 | |
| Age @ EEG | 1.029 [0.91, 1.164] | 0.650 | |
| Cycles to Criterion Cox Model – Adjusted for Psychiatric Measures - 22q11.2DS Only | |||
| Term | Hazard Ratio | p-value | |
| Gender | Female | Reference | |
| Male | 2.314 [0.542, 9.882] | 0.257 | |
| Psychotic experiences | No PEs | Reference | |
| PEs | 0.203 [0.041, 1.012] | 0.052 | |
| Age @ EEG | 1.139 [0.933, 1.390] | 0.200 | |
| FSIQ | 1.026 [0.972, 1.082] | 0.355 | |
| Anxiety symptoms | 0.992 [0.879, 1.120] | 0.900 | |
| ADHD symptoms | 0.915 [0.760, 1.102] | 0.349 | |
| ASD symptoms | 1.027 [0.926, 1.139] | 0.616 | |
| Morning Accuracy Binomial Model | |||
| Term | OR | p-value | |
| Group | Control | Reference | |
| 22q11.2DS | 0.631 [0.45, 0.885] | 0.008 | |
| Gender | Female | Reference | |
| Male | 1.083 [0.762, 1.538] | 0.657 | |
| Age @ EEG | 0.997 [0.945, 1.051] | 0.900 | |
| Morning Accuracy Binomial Model - Adjusted for Psychiatric Measures - 22q11.2DS Only | |||
| Term | OR | p-value | |
| Gender | Female | Reference | |
| Male | 1.623 [0.807, 3.268] | 0.174 | |
| Psychotic experiences | No PEs | Reference | |
| PEs | 0.556 [0.296, 1.032] | 0.065 | |
| Age @ EEG | 1.012 [0.924, 1.108] | 0.803 | |
| FSIQ | 1.004 [0.982, 1.027] | 0.716 | |
| Anxiety symptoms | 1.028 [0.969, 1.091] | 0.353 | |
| ADHD symptoms | 0.973 [0.924, 1.023] | 0.288 | |
| ASD symptoms | 1.018 [0.973, 1.066] | 0.441 | |
| Evening – Morning Difference | |||
| Term | Group Difference | p-value | |
| Group | Control | Reference | |
| 22q11.2DS | –0.424 [-1.923, 1.074] | 0.565 | |
| Gender | Female | Reference | |
| Male | –0.5 [-2.036, 1.035] | 0.512 | |
| Age @ EEG | –0.023 [-0.256, 0.21] | 0.839 | |
-
Associations between genotype group, sex, age and psychiatric symptoms and performance in the 2D object location task.
Table 5
Regression of sleep architecture features in 22q11.2DS.
| Measure | Variable | Beta (95% CI) | Adjusted P-value (BH) |
|---|---|---|---|
| N1 (%) | Sex | –0.059 [-5.21, 5.092] | 0.981 |
| Age @ EEG | 0.101 [-0.808, 1.01] | 0.963 | |
| CAPA sleep problems | 0.003 [-1.632, 1.639] | 0.963 | |
| FSIQ | 0.135 [-0.044, 0.313] | 0.963 | |
| Anxiety symptoms | 0.158 [-0.38, 0.696] | 0.963 | |
| ADHD symptoms | –0.288 [-0.682, 0.105] | 0.963 | |
| ASD symptoms | 0.33 [-0.006, 0.666] | 0.963 | |
| Psychotic experiences | –2.758 [-6.921, 1.404] | 0.963 | |
| N2 (%) | Sex | 2.183 [-8.465, 12.831] | 0.963 |
| Age @ EEG | 0.097 [-1.782, 1.976] | 0.915 | |
| CAPA sleep problems | –0.407 [-3.787, 2.974] | 0.915 | |
| FSIQ | 0.195 [-0.174, 0.564] | 0.915 | |
| Anxiety symptoms | 0.254 [-0.859, 1.366] | 0.915 | |
| ADHD symptoms | –0.691 [-1.505, 0.123] | 0.915 | |
| ASD symptoms | 0.28 [-0.414, 0.974] | 0.915 | |
| Psychotic experiences | –3.603 [-12.208, 5.002] | 0.915 | |
| N3 (%) | Sex | –0.849 [-10.545, 8.847] | 0.915 |
| Age @ EEG | 0.675 [-1.037, 2.386] | 0.915 | |
| CAPA sleep problems | 1.399 [-1.68, 4.477] | 0.997 | |
| FSIQ | –0.062 [-0.398, 0.273] | 0.997 | |
| Anxiety symptoms | –0.43 [-1.442, 0.583] | 0.816 | |
| ADHD symptoms | 0.359 [-0.382, 1.1] | 0.816 | |
| ASD symptoms | –0.05 [-0.682, 0.582] | 0.997 | |
| Psychotic experiences | 3.852 [-3.984, 11.688] | 0.816 | |
| REM (%) | Sex | 2.516 [-2.744, 7.775] | 0.816 |
| Age @ EEG | –0.682 [-1.61, 0.246] | 0.816 | |
| CAPA sleep problems | –1.168 [-2.837, 0.502] | 0.816 | |
| FSIQ | 0.138 [-0.044, 0.32] | 0.235 | |
| Anxiety symptoms | 0.732 [0.182, 1.281] | 0.421 | |
| ADHD symptoms | –0.295 [-0.697, 0.107] | 0.788 | |
| ASD symptoms | –0.054 [-0.397, 0.288] | 0.235 | |
| Psychotic experiences | –0.404 [-4.655, 3.847] | 0.719 | |
| N1 Latency (Minutes) | Sex | –8.061 [-32.213, 16.092] | 0.235 |
| Age @ EEG | –1.225 [-5.487, 3.037] | 0.235 | |
| CAPA sleep problems | 0.484 [-7.184, 8.152] | 0.947 | |
| FSIQ | –0.237 [-1.073, 0.6] | 0.235 | |
| Anxiety symptoms | –0.62 [-3.143, 1.902] | 0.638 | |
| ADHD symptoms | 0.143 [-1.703, 1.989] | 0.638 | |
| ASD symptoms | –0.194 [-1.769, 1.38] | 0.638 | |
| Psychotic experiences | 1.894 [-17.625, 21.414] | 0.107 | |
| REM Latency (Minutes) | Sex | –30.174 [-110.781, 50.433] | 0.638 |
| Age @ EEG | 1.517 [-12.707, 15.741] | 0.638 | |
| CAPA sleep problems | 10.761 [-14.83, 36.353] | 0.638 | |
| FSIQ | –2.491 [-5.283, 0.301] | 0.638 | |
| Anxiety symptoms | –2.763 [-11.183, 5.656] | 0.638 | |
| ADHD symptoms | 3.909 [-2.251, 10.069] | 0.254 | |
| ASD symptoms | –2.116 [-7.371, 3.139] | 0.254 | |
| Psychotic experiences | –14.904 [-80.048, 50.24] | 0.363 | |
| Sleep Efficiency (%) | Sex | 1.813 [-8.177, 11.802] | 0.254 |
| Age @ EEG | –0.099 [-1.862, 1.663] | 0.872 | |
| CAPA sleep problems | –0.979 [-4.151, 2.192] | 0.256 | |
| FSIQ | 0.286 [-0.06, 0.632] | 0.254 | |
| Anxiety symptoms | 0.587 [-0.456, 1.63] | 0.254 | |
| ADHD symptoms | –0.671 [-1.435, 0.092] | 0.256 | |
| ASD symptoms | 0.444 [-0.207, 1.096] | 0.483 | |
| Psychotic experiences | –1.347 [-9.42, 6.726] | 0.736 | |
| Total Sleep Time (Minutes) | Sex | 76.874 [-63.554, 217.302] | 0.87 |
| Age @ EEG | –14.689 [-39.469, 10.092] | 0.87 | |
| CAPA sleep problems | –13.13 [-57.714, 31.453] | 0.87 | |
| FSIQ | 0.156 [-4.708, 5.021] | 0.736 | |
| Anxiety symptoms | 9.132 [-5.536, 23.799] | 0.507 | |
| ADHD symptoms | –10.338 [-21.069, 0.394] | 0.87 | |
| ASD symptoms | –0.955 [-10.11, 8.2] | 0.507 | |
| Psychotic experiences | –121.448 [-234.938,–7.958] | 0.772 | |
| Awakenings (n) | Sex | 5.695 [-44.381, 55.77] | 0.772 |
| Age @ EEG | 0.932 [-7.904, 9.769] | 0.772 | |
| CAPA sleep problems | 4.938 [-10.96, 20.836] | 0.844 | |
| FSIQ | –1.403 [-3.138, 0.332] | 0.844 | |
| Anxiety symptoms | –2.383 [-7.613, 2.848] | 0.844 | |
| ADHD symptoms | 2.443 [-1.383, 6.27] | 0.844 | |
| ASD symptoms | –2.331 [-5.596, 0.933] | 0.336 | |
| Psychotic experiences | –15.59 [-56.06, 24.879] | 0.772 |
-
Associations between sleep architecture measures (proportion of N1, N2, N3 and REM sleep, latency to N1 and REM sleep, Sleep Efficiency, Total Sleep Time and total Awakenings), sex, age and psychiatric and cognitive (FSIQ) covariates, in participants with 22q11.2DS. Regression models were fit with linear mixed models, with family identity as a random (varying) intercept. Data presented are regression beta coefficients with 95% confidence intervals.
Table 6
EEG measure summary.
| Measure group | Measure details | Sleep stage |
|---|---|---|
| Spectral | Mean Slow Delta Power | N2 |
| Spectral | Mean Slow Delta Power | N3 |
| Spectral | Mean Sigma Power | N2 |
| Spectral | Mean Sigma Power | N3 |
| Spectral | Peak Sigma Frequency | N2 |
| Spectral | Peak Sigma Frequency | N3 |
| Spectral | Aperiodic Signal Slope | N2 |
| Spectral | Aperiodic Signal Slope | N3 |
| Spectral | Aperiodic Signal Slope | REM |
| Spectral | Aperiodic Signal Intercept | N2 |
| Spectral | Aperiodic Signal Intercept | N3 |
| Spectral | Aperiodic Signal Intercept | REM |
| Spindle | Density | N2 +N3 |
| Spindle | Amplitude | N2 +N3 |
| Spindle | Frequency | N2 +N3 |
| Slow Wave | Density | N2 +N3 |
| Slow Wave | Amplitude | N2 +N3 |
| Slow Wave | Duration | N2 +N3 |
| Spindle – Slow Wave Coupling | Spindle – Slow Wave Overlap (z-scored against shuffled data) | N2 +N3 |
| Spindle – Slow Wave Coupling | Spindle – Slow Wave Mean Resultant Length (z-scored against shuffled data) | N2 +N3 |
| Spindle – Slow Wave Coupling | Spindle – Slow Wave Mean Coupling Angle | N2 +N3 |
-
All derived EEG measures, grouped by signal type spectral, derived from the PSD; spindle, derived from individual detected spindle events; slow wave, derived from individual detected slow wave events and measures derived from spindle – slow wave coupling.
Table 7
Average proportions of genotype effects on psychiatric measures and IQ mediated by sleep EEG measures.
| Measure | Mediator | Proportion mediated |
|---|---|---|
| ADHD symptoms | REM constant | 0.11 (0.02) |
| ADHD symptoms | SW amplitude | 0.14 (0.03) |
| ADHD symptoms | Spin - SW MRL | 0.16 (0.03) |
| Anxiety symptoms | Spindle amplitude | 0.17 (0) |
| Anxiety symptoms | SW amplitude | 0.21 (0.05) |
| Anxiety symptoms | Spin - SW MRL | 0.19 (0.07) |
| ASD symptoms | Spindle amplitude | 0.08 (0.02) |
| FSIQ | SW amplitude | 0.18 |
-
Proportions of genotype effect on psychiatric measures and FSIQ mediated (Measure) by select sleep EEG features (Mediator) of for all electrodes in significant clusters. Data shown are mean (SD). Note FSIQ does not have an SD as there was only one electrode in a significant cluster.
Additional files
-
Transparent reporting form
- https://cdn.elifesciences.org/articles/75482/elife-75482-transrepform1-v2.docx
-
Source data 1
The zip file “eLife Submission Data.zip” contains data files which are used to produce the analysis and figures presented in the manuscript.
Note that data files are in the .rds file format, which can be opened using the free open source R statistic programming language.
Source data 1: eLife Submission Data.zip
sleep_study_beh_psych_demographic_data.rds: Contains data for participant performance on the memory task, psychiatric and cognitive assessments and demographic data
sleep_study_eeg_coupling_example.rds: Contains EEG data of an example spindle-SW interaction event, used to construct Figure 4A
sleep_study_eeg_locations.rds: Contains the standardized locations of the EEG electrodes used throughout the study
sleep_study_eeg_neighbours.rds: Contains the neighboring electrode for all 60 electrodes in the recording system used in our study, used in the cluster correction statistics utilized in Figure 5B and Figure 6B
sleep_study_eeg_spectrogram_example.rds: Contains example whole night spectrograms for a sibling pair, with hypnogram and spindle and SW detection counts over the night, used in Figure 3A-B
sleep_study_eeg_summary_data.rds: Contains summary EEG measures (one value per measure per electrode per participant) for the measures in Table 7. Data are in their own standard units.
sleep_study_eeg_summary_data_z.rds: Contains summary EEG measures (one value per measure per electrode per participant) for the measures in Table 7. Data are z scored.
sleep_study_epoch_removal.rds: Contains data on the number of epochs removed by our artefact removal process (See Methods and Materials/EEG data analysis/Pre-processing)
sleep_study_example_so_waveforms_bootci.rds: Contains example slow wave waveforms and bootstrapped 95% confidence intervals, used in Figure 3D
sleep_study_example_spindle_waveforms_bootci.rds: Contains example spindle waveforms and bootstrapped 95% confidence intervals, used in Figure 3C
sleep_study_interaction_clusters.rds: Contains the electrode locations and statistics for clusters of significant group*EEG measure interactions, used in Figure 5B
sleep_study_interaction_models.rds: Contains fitted mixed models for group*EEG measure interactions, used in Figure 5B
sleep_study_mediation_plot.rds: Contains cluster-corrected mediation models, used in Figure 6B
sleep_study_psd_bootci.rds: Contains power spectral density plot data, with bootstrapped 95% confidence intervals, used in Figure 2A-D
sleep_study_psd_clusters.rds: Contains the location of clusters of frequencies with significant group differences, used in Figure 2A-D
sleep_study_psd_data.rds: Contains PSD data used to calculate group differences and for cluster correction, to derive the data in sleep_study_psd_bootci.rds and sleep_study_psd_clusters.rds
sleep_study_topoplot_angle_data.rds: Contains posterior samples from the GAMM model fit to the coupling angle data. Used to construct the topoplot found in Figure 4D
sleep_study_topoplot_posterior_data.rds: Contains posterior samples from the GAMM models used to construct group difference topoplots for the EEG measures in Table 7 (except angular data, which is found in) sleep_study_topoplot_angle_data.rds. Used to construct the topoplots found in Figure 2E-G, Figure 3E-F and Figure 4C
- https://cdn.elifesciences.org/articles/75482/elife-75482-data1-v2.zip
-
Source code 1
The .zip file “eLife Submission Scripts.zip” contains R scripts that produce the main figures and analysis.
Scripts beginning with the prefix “Analysis” run computations which produce data used in tables and figures (and may run slowly); scripts beginning with the prefix “Figure” produce the figures themselves. The following files are included:
Analysis-Artefact-Removal.R: Code to analyze the effect of artefact removal (See Methods and Materials/EEG data analysis/Pre-processing)
Analysis-Common-Utilities.R: Code that contains common variables and functions used in the paper
Analysis-fitGAMMs.R: Code that fits the Bayesian GAMMs and extracts posterior samples which produce the topoplots of group differences in Figure 2E-G, Figure 3E-F and Figure 4C
Analysis-fitMediationModels.R: Code that fits the mediation models and performs cluster-based correction for multiple comparisons, producing data used to plot Figure 6B
Analysis-Interaction-Clusters.R: Code that fits the EEG*genotype interaction models and performs cluster-based correction for multiple comparisons, producing data used to plot Figure 5B
Analysis-PSD-Clusters.R: Code that fits models to the PSD data across multiple frequencies, and performs cluster-based correction for multiple comparisons, producing the data used to plot Figure 2A-D
Analysis-Tables-1-5.R: Code that produces Tables 1-5, including the statistical tests presented in those tables
Figure-1-Revised.R: Code to produce the elements of Figure 1 and associated figure supplements
Figure-2-Revised.R: Code to produce the elements of Figure 2 and associated figure supplements
Figure-3-Revised.R: Code to produce the elements of Figure 3 and associated figure supplements
Figure-4-Revised.R: Code to produce the elements of Figure 4 and associated figure supplements
Figure-5-Revised.R R: Code to produce the elements of Figure 5
Figure-6-Revised.R R: Code to produce the elements of Figure 6 and Table 7
- https://cdn.elifesciences.org/articles/75482/elife-75482-code1-v2.zip
Download links
A two-part list of links to download the article, or parts of the article, in various formats.
Downloads (link to download the article as PDF)
Open citations (links to open the citations from this article in various online reference manager services)
Cite this article (links to download the citations from this article in formats compatible with various reference manager tools)
Sleep EEG in young people with 22q11.2 deletion syndrome: A cross-sectional study of slow-waves, spindles and correlations with memory and neurodevelopmental symptoms
eLife 11:e75482.
https://doi.org/10.7554/eLife.75482


