Ndc1 drives nuclear pore complex assembly independent of membrane biogenesis to promote nuclear formation and growth
- Department of Molecular, Cellular and Developmental Biology, Yale University, United States
- Center for Membrane and Cell Physiology, University of Virginia, United States
- Department of Molecular Physiology and Biological Physics, University of Virginia, School of Medicine, United States
- Center for Cellular and Molecular Imaging: Electron Microscopy, Department of Cell Biology, Yale School of Medicine, United States
- Department of Cell Biology, University of Virginia, United States
Figures
Figure 1 with 2 supplements
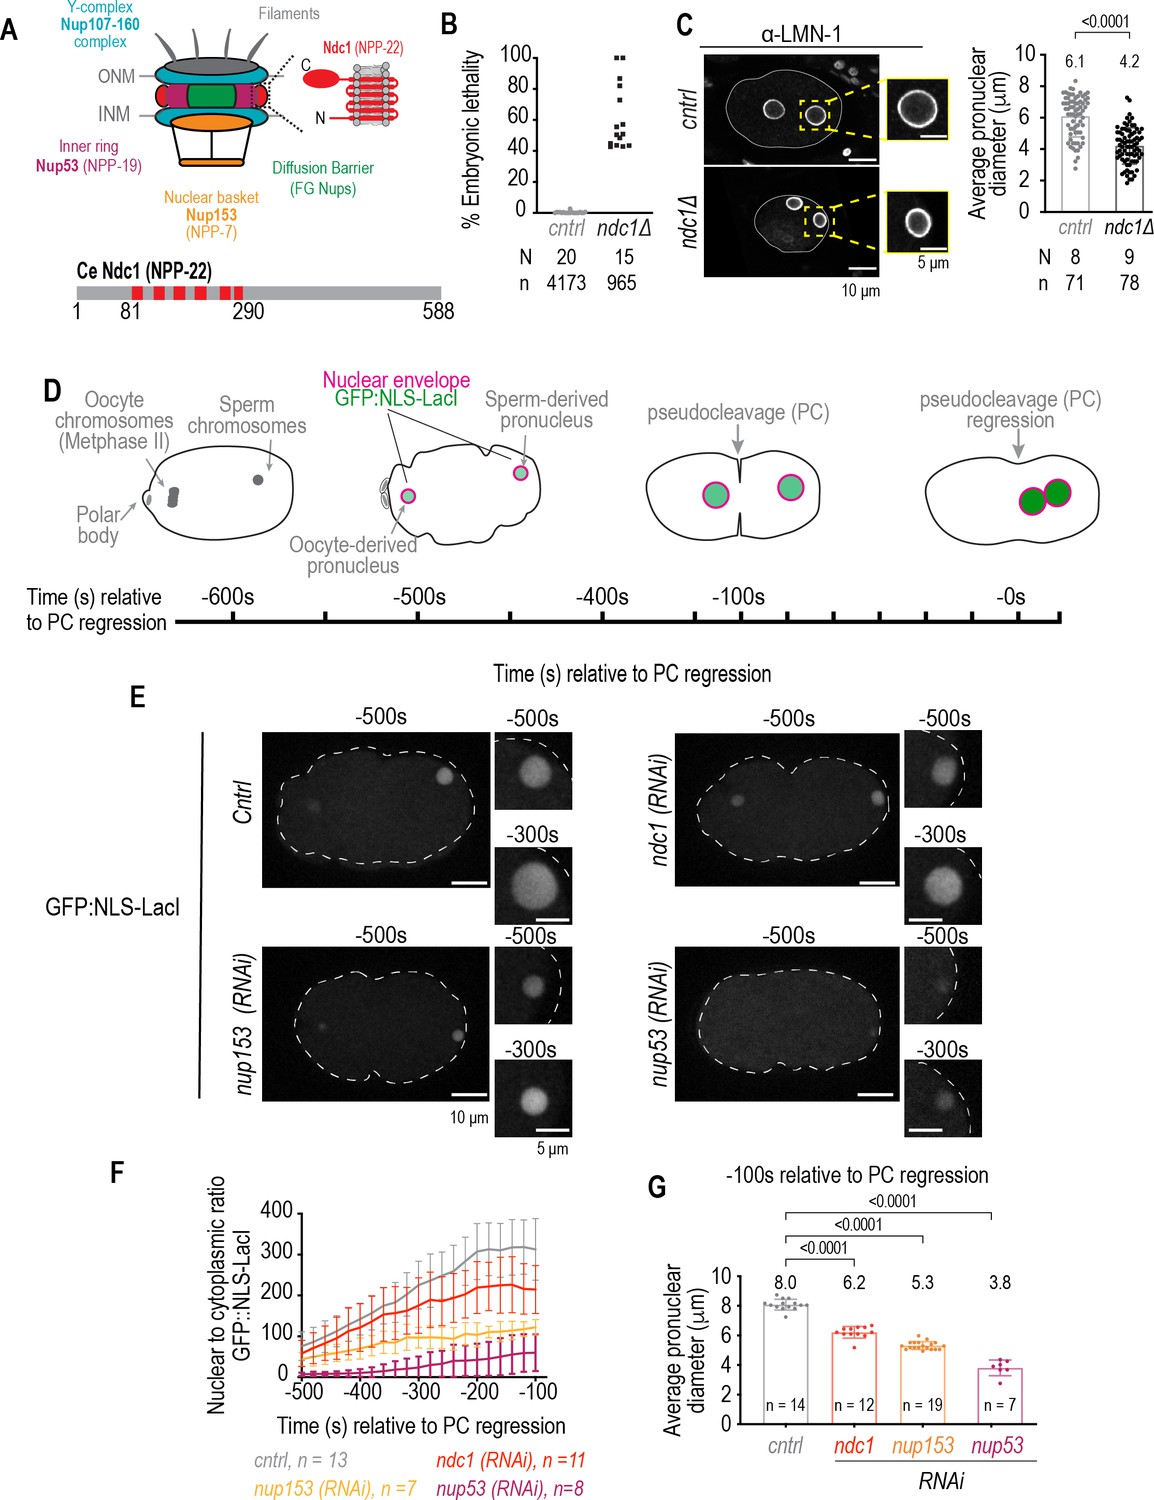
Smaller pronuclear size resulting from loss of Ndc1 corresponds to reduced nuclear import.
(A) Schematic of a nuclear pore complex (left). Schematic and domain organization of Ce Ndc1 (right, bottom). (B) Plot of percentage embryonic lethality for indicated conditions. N = # of worms. n = # of embryos. (C) Left: fixed overview and magnified images of C. elegans embryos immunostained for lamin for indicated conditions. Scale bars, 10 μm and 5 μm for magnified images. Right: plot of nuclear size for indicated conditions. Mean ± S.D. N = # of slides, n = # of nuclei. (D) Schematic of stereotypical nuclear events relative to nuclear import in the C. elegans zygote, with pseudocleavage (PC) regression used as a reference time point. Time is in seconds. (E) Confocal overview and magnified images of embryo from a time lapse series of GFP:NLS-LacI in indicated conditions. Scale bars, 10 μm for overview image and 5 μm for magnified images. (F) Plot of nuclear to cytoplasmic ratio of GFP:NLS-LacI for indicated conditions. n = # of embryos. Average ± S.D. is shown. (G) Pronuclear diameter for indicated conditions at indicated time point. Average ± S.D. is shown. n = # of embryos. A two-way ANOVA was used to determine statistical significance between control and each RNAi condition. p-Values all <0.0001.
-
Figure 1—source data 1
Excel file containing individual data points related to Figure 1.
- https://cdn.elifesciences.org/articles/75513/elife-75513-fig1-data1-v1.xlsx
Figure 1—figure supplement 1
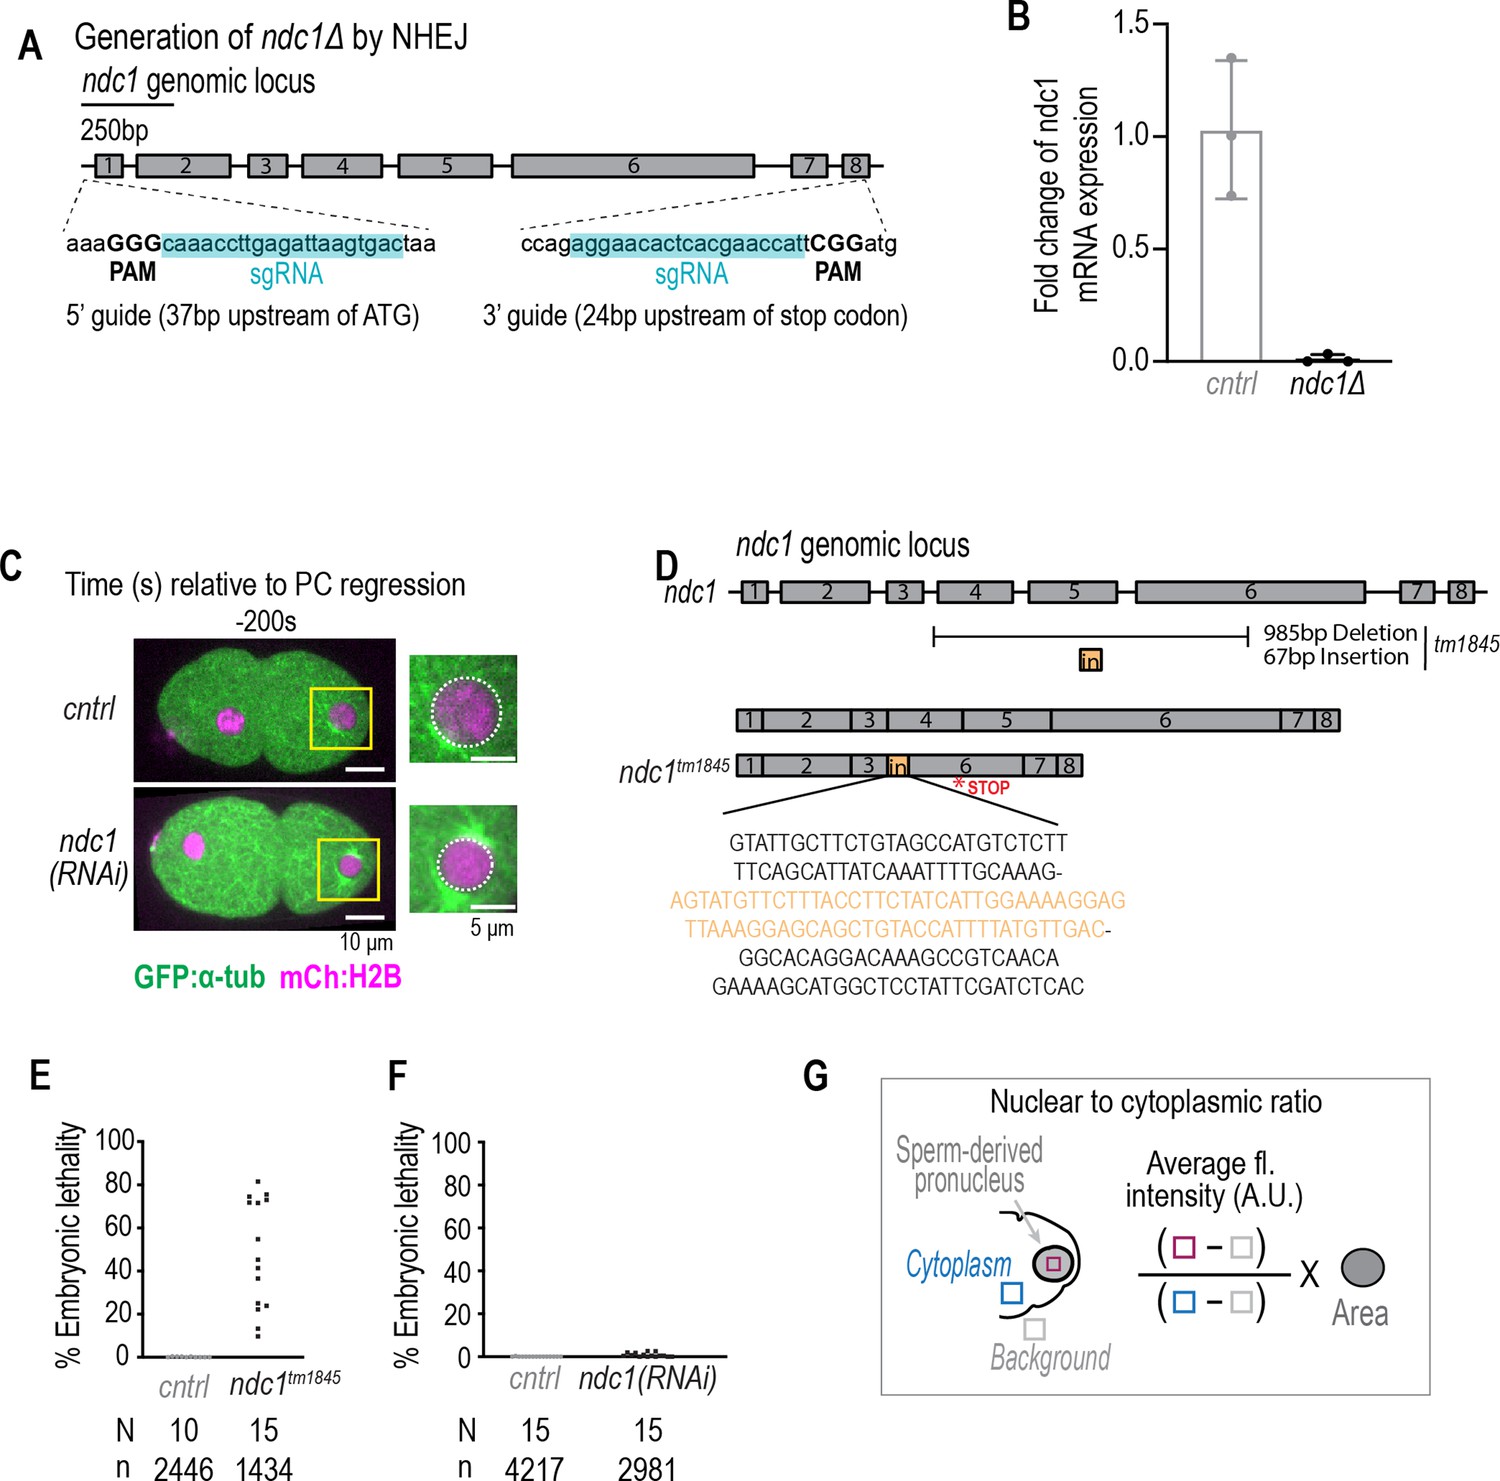
Generation and characterization of mutant ndc1 alleles and RNAi depletion of ndc1.
Related to Figure 1. (A) Schematic of CRISPR guides to generate ndc1 null allele. (B) Plot of ndc1 mRNA fold change for control and ndc1Δ worms. Mean ± S.D. (C) Confocal overview and magnified images of one-cell stage embryo from a time lapse series of indicated markers for indicated conditions. Scale bars, 10 μm for overview image and 5 μm for magnified images. (D) Schematic of ndc1 genomic locus (top) and tm1845 allele (below). (E–F) Plots of percentage embryonic lethality for indicated conditions. N = # of worms. n = # of embryos. (G) Schematic for equation to calculate nuclear to cytoplasmic ratio of GFP:NLS-LacI.
-
Figure 1—figure supplement 1—source data 1
Excel file containing individual data points.
- https://cdn.elifesciences.org/articles/75513/elife-75513-fig1-figsupp1-data1-v1.xlsx
Figure 1—video 1
Nuclear import scales with nuclear size in one-cell stage C. elegans embryos.
C. elegans one-cell stage embryos expressing NLS-LacI:GFP (NLS:GFP) for indicated conditions. The video starts at –500 s relative to pseudocleavage (PC) regression and ends –100 s relative to PC regression. Images were acquired every 20 s, playback rate is four frames per second. Scale bar, 10 µm.
Figure 2 with 4 supplements
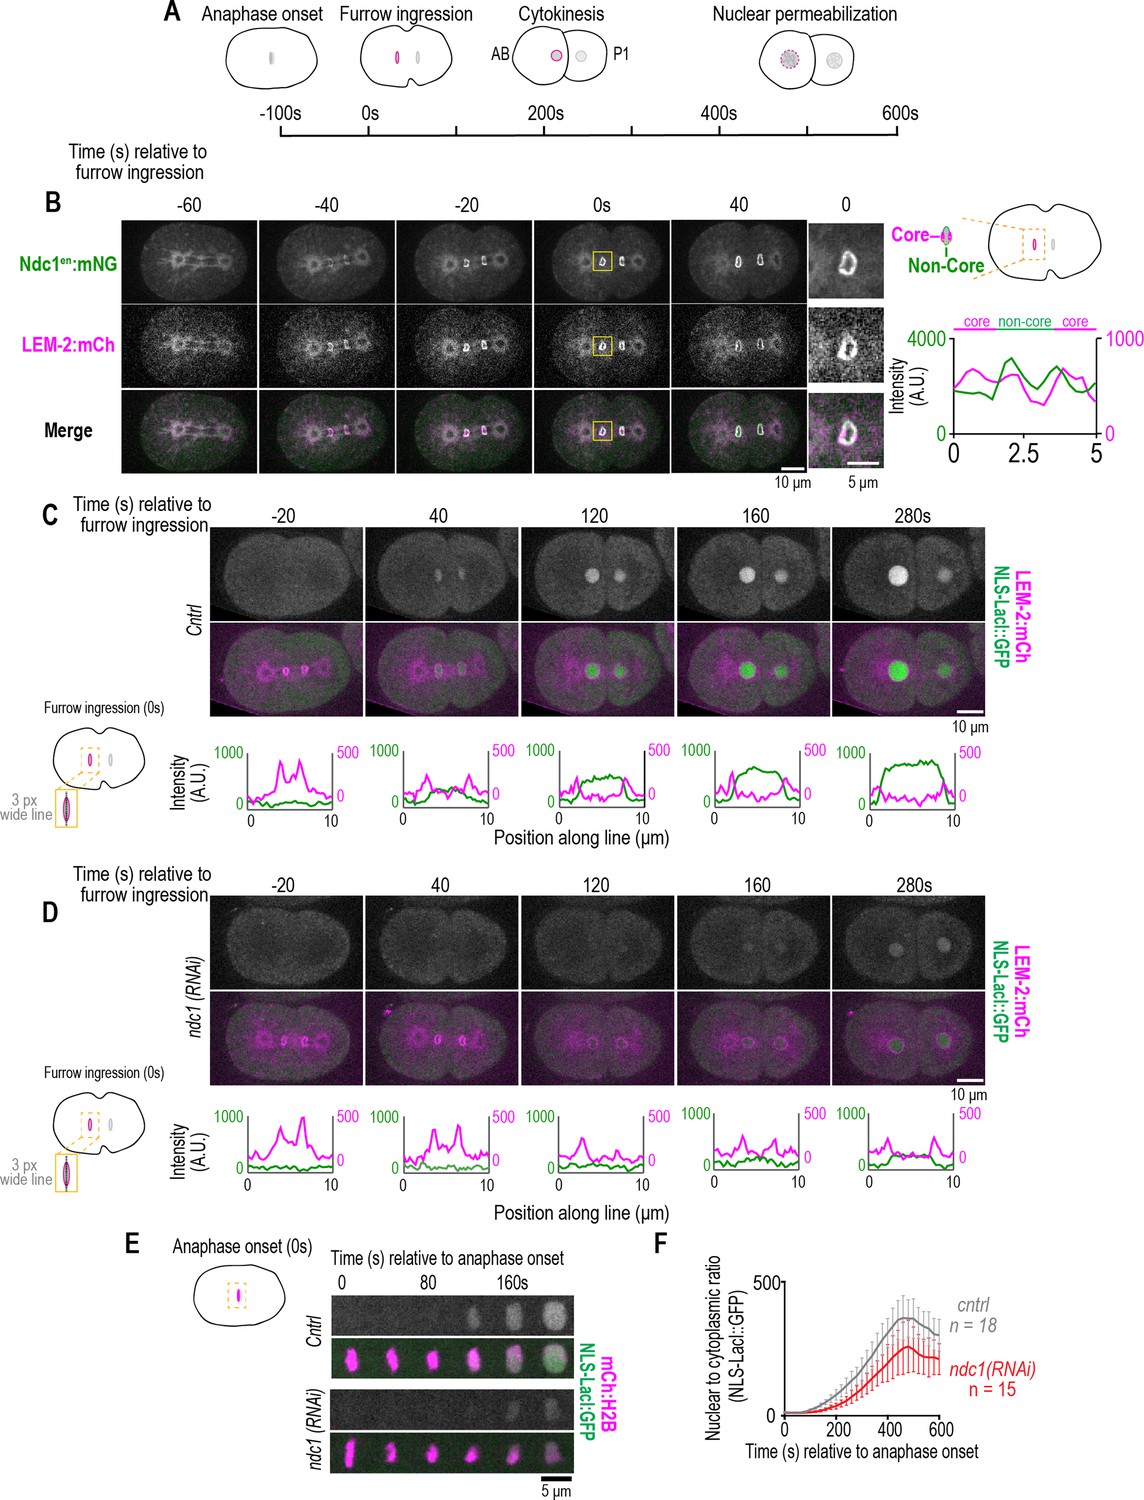
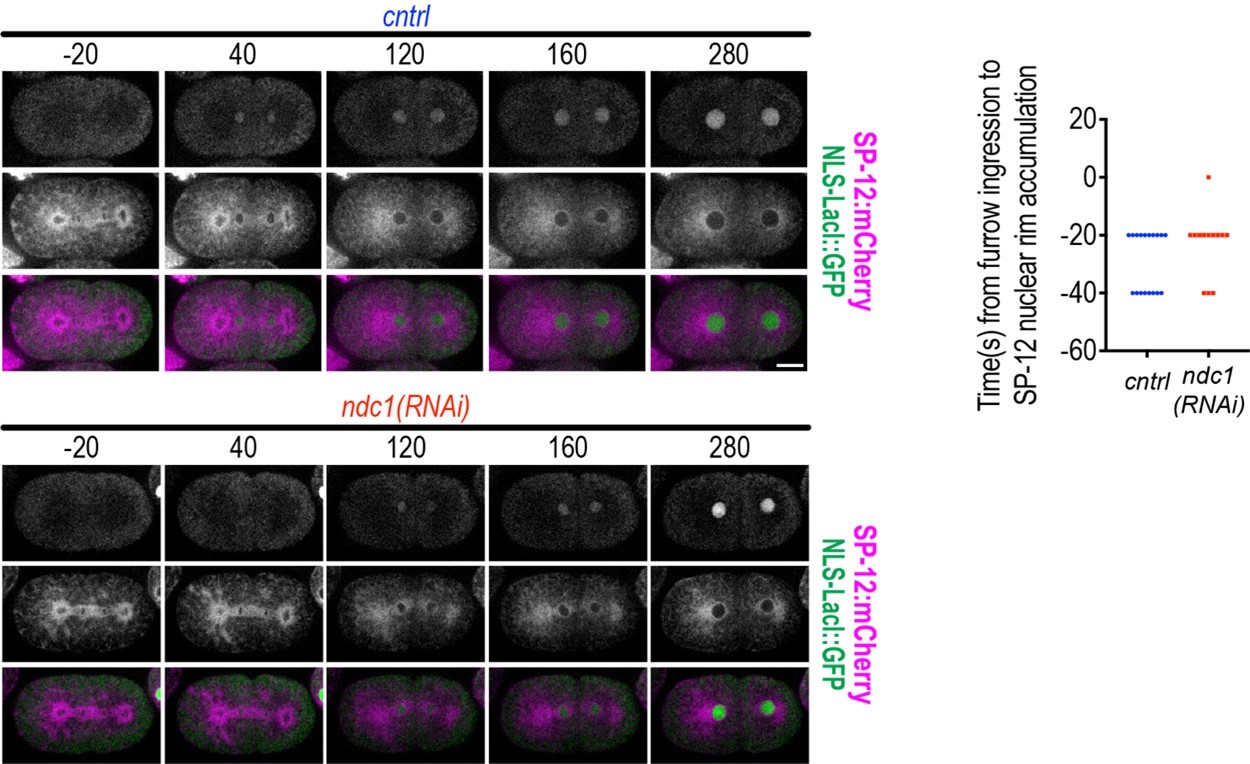
Ndc1 is necessary for timely formation of a transport competent nucleus after mitosis.
(A) Schematic of the first mitotic division in C. elegans embryos relative to anaphase onset and initiation of furrow ingression. All measurements of one- to two-cell stage embryos are done on the AB cell/nucleus (nuclear envelope [NE] of the AB nucleus is highlighted in magenta). (B) (Left) Confocal images from time series of mitotic nuclear formation relative to furrow ingression with indicated markers. (Right) Three-pixel wide line scan for the ‘core’ and ‘non-core’ region of the NE. Scale bars, 10 μm for overview image and 5 μm for magnified images. (C–D) (Above) Confocal images from time series mitotic nuclear formation with indicated markers for indicated conditions. (Below) Line scans measuring background-corrected fluorescence intensities as indicated in schematic for each time point and fluorescent marker (LEM-2:mCH is magenta and NLS-LacI:GFP is green). Scale bars, 10 μm and 5 μm for magnified images. (E) Confocal images of chromosome region from time series relative to anaphase onset with indicated markers and in indicated conditions. Scale bar, 5 μm. (F) Plot of nuclear to cytoplasmic ratio of GFP:NLS-LacI for indicated conditions. n = # of embryos. Average ± S.D. is shown.
-
Figure 2—source data 1
Excel file containing individual data points related to Figure 2.
- https://cdn.elifesciences.org/articles/75513/elife-75513-fig2-data1-v1.xlsx
Figure 2—figure supplement 1
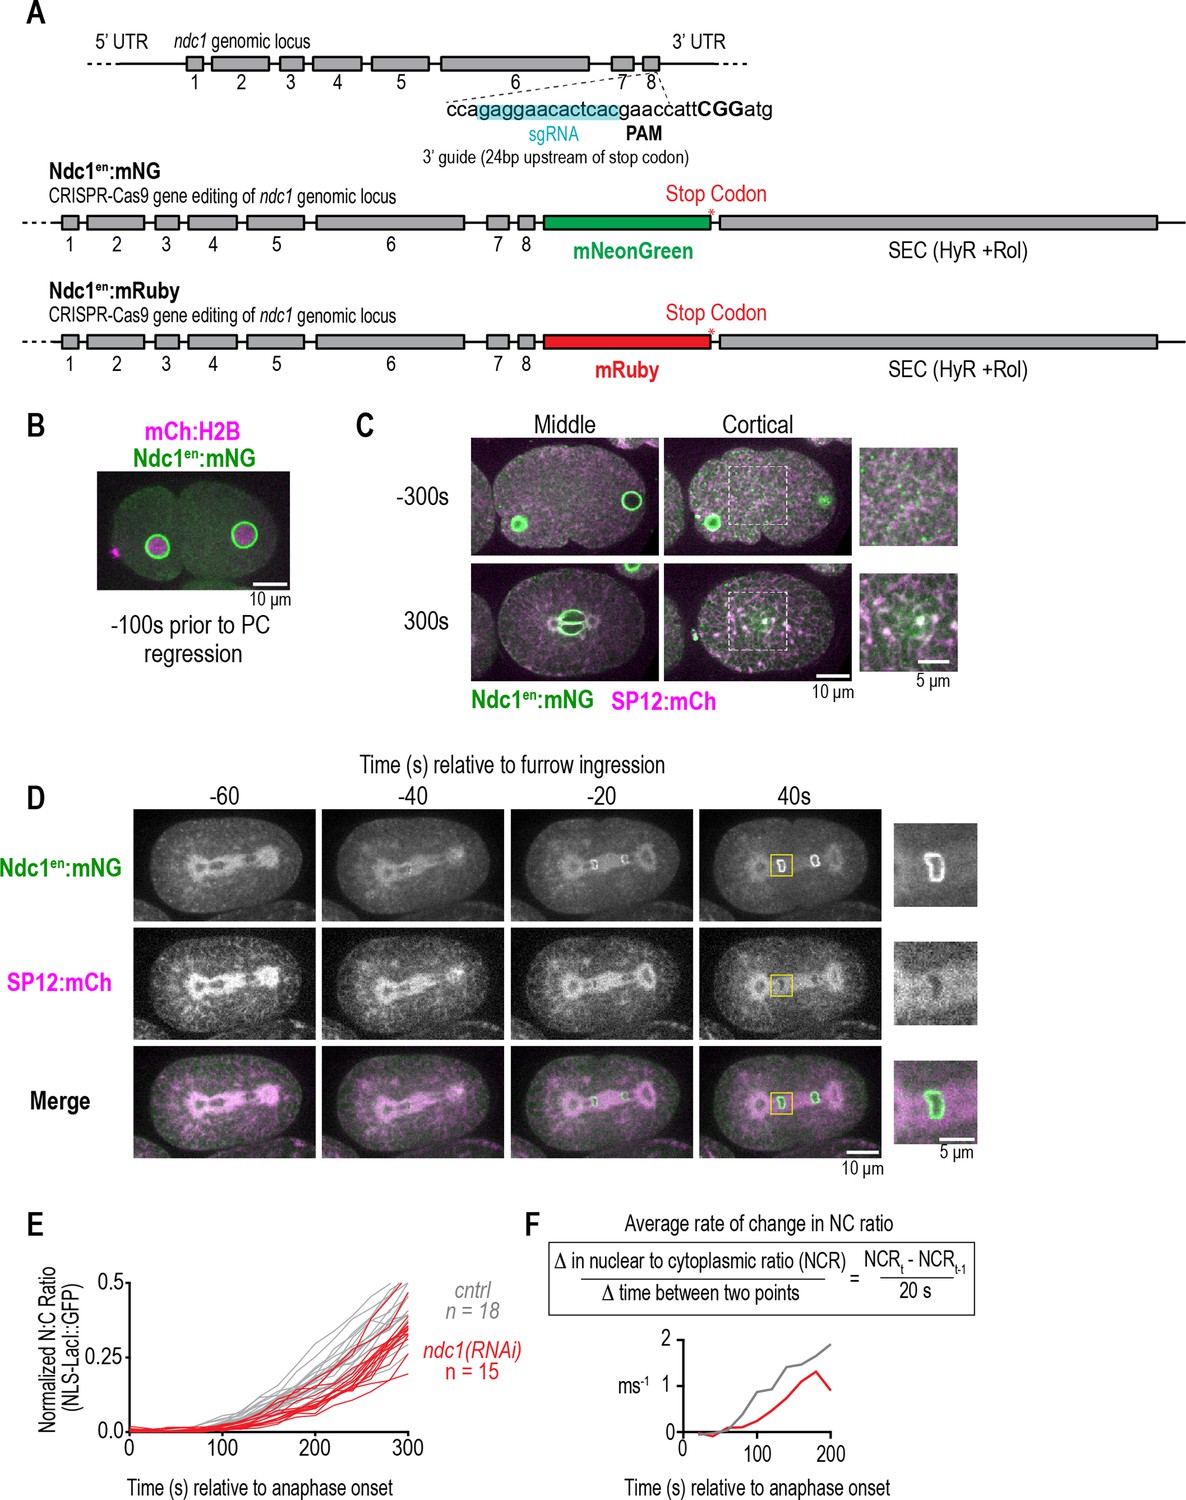
Ndc1en:mNG is recruited early to the nuclear rim and localizes to the endoplasmic reticulum (ER) and cytoplasmic puncta, and nuclear import is delayed in post-mitotic nuclei without Ndc1.
Related to Figure 2. (A) Schematic of ndc1 genomic locus and CRISPR guide to generate ndc1en:mNG and ndc1en:mRuby at its endogenous locus. (B) Confocal images from time series of one-cell stage embryo expressing Ndc1en:mNG and mCh:H2B. Scale bar, 10 μm. (C) Confocal images from time series of one-cell stage embryo expressing Ndc1en:mNG and SP12:mCh to mark the ER. Scale bars, 10 μm and 5 μm for magnified images. (D) Confocal images from time series of two-cell stage embryo expressing Ndc1en:mNG and SP12:mCh during mitotic nuclear formation. Scale bars, 10 μm for overview image and 5 μm for magnified images. (E) Plot of normalized nuclear to cytoplasmic ratio of GFP:NLS-LacI for indicated conditions. n = # of embryos. (F) Equation and plot of rate of change in the nuclear to cytoplasmic ratio of GFP:NLS-LacI between each time point in the first 200 s after anaphase for the indicated conditions. Average is shown.
-
Figure 2—figure supplement 1—source data 1
Excel file containing individual data points.
- https://cdn.elifesciences.org/articles/75513/elife-75513-fig2-figsupp1-data1-v1.xlsx
Figure 2—video 1
Endogenously tagged Ndc1:mNG is enriched at the nuclear rim and produces embryos that progress normally through the one-cell stage.
C. elegans one-cell stage embryo expressing Ndc1en:mNG (left), mCh:H2B (middle), and merge (right). Images were acquired every 20 s, playback rate is four frames per second. Scale bar, 10 µm.
Figure 2—video 2
Recruitment of endogenously tagged Ndc1:mNG relative to the inner nuclear envelope (NE) marker LEM-2:mCherry.
C. elegans one-cell stage embryo expressing Ndc1en:mNG (left), LEM-2:mCh (middle), and merge (right). Images were acquired every 20 s, playback rate is six frames per second. Scale bar, 10 µm.
Figure 2—video 3
Loss of Ndc1 delays the initiation of nuclear transport after mitosis.
C. elegans one-cell stage embryo expressing NLS-LacI:GFP (Top), mCH:H2B (middle), and merge (bottom) for indicated conditions. Images were acquired every 20 s, and playback rate is four frames per second. Scale bar, 10 µm.
Figure 3 with 10 supplements
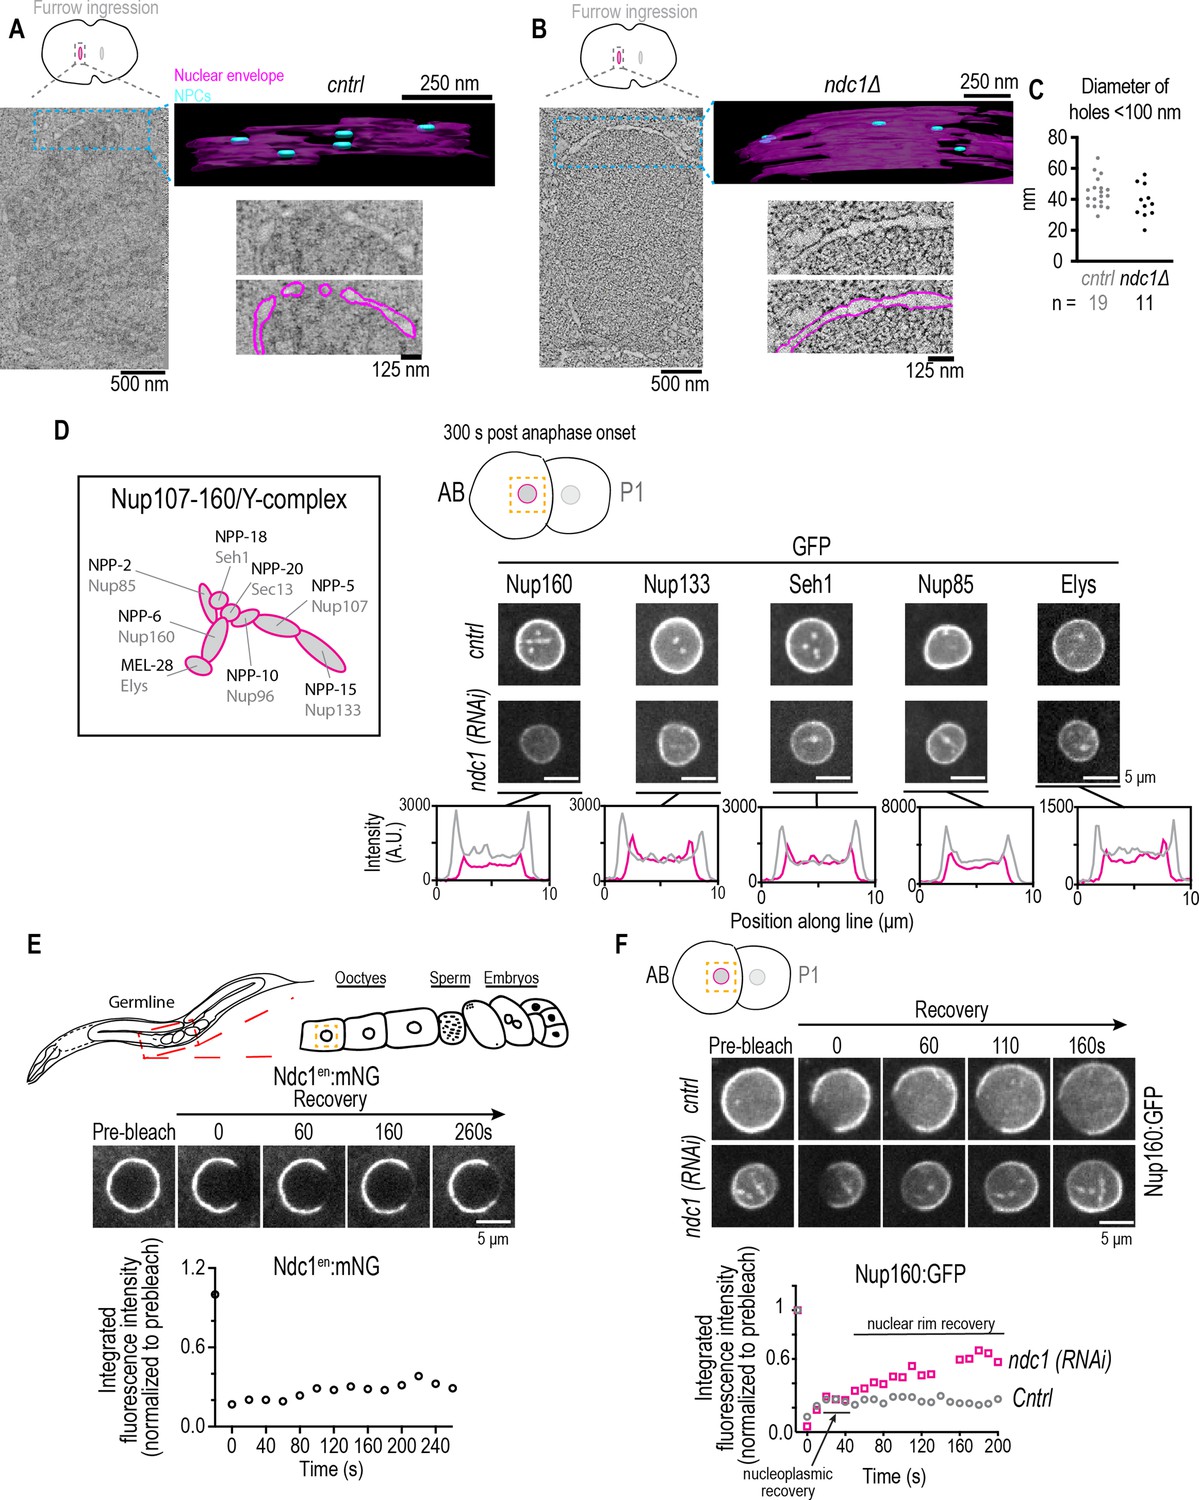
Fewer nuclear pore complexes (NPCs) assembled on nascent nuclear envelopes (NEs) and a higher mobile pool of Nup160:GFP result from loss of ndc1.
(A, B) Overview images: z-slice from electron tomogram of nuclear formation timed relative to initiation of furrow ingression. 3D model: traced membranes (magenta) and NE holes <100 nm (blue) for region shown as single z-slice in overview image. Magnified representative z-slice traced and untraced from electron tomogram is shown. To calculate the density of ‘NPC’ holes during NE reformation, we segmented and quantified four areas from a single control embryo (0.14 μm2, 0.08 μm2, 0.05 μm2, and 0.04 μm2) and four areas from a single ndc1Δ embryo (0.22 μm2, 0.19 μm2, 0.18 μm2, and 0.17 μm2). Scale bars indicated in figure. (C) Plot of diameters of NE holes <100 nm. n = # of ‘NPC’ holes analyzed. (D) Schematic of Y-complex (also known as Nup107/160 complex) with vertebrate (gray) and C. elegans (black) names shown, adapted from Figure 1B in Hattersley et al., 2016 (note that NPP-23/Nup43 not included). Representative magnified images of AB nucleus from confocal series for each indicated marker (above) and line scans measuring background-corrected fluorescence intensities (below) for each condition. Scale bars, 5 μm. (E) (Top) Schematic of C. elegans gonad and oocytes. (Middle) Confocal images from time lapse series of fluorescence recovery after photobleaching (FRAP) of Ndc1en:mNG the NE of an oocyte is shown. (Bottom) Representative plot of fluorescence intensities of bleached region over time normalized to the prebleach intensity for each condition is shown. Scale bars, 5 μm. (F) Confocal images from time lapse series of FRAP of Nup160:GFP at the NE of an embryo for indicated conditions are shown (above). Representative plot of fluorescence intensity of bleached region over time normalized to the prebleach intensity for each condition is shown (below). Scale bars, 5 μm.
-
Figure 3—source data 1
Excel file containing individual data points related to Figure 3.
- https://cdn.elifesciences.org/articles/75513/elife-75513-fig3-data1-v1.xlsx
Figure 3—figure supplement 1
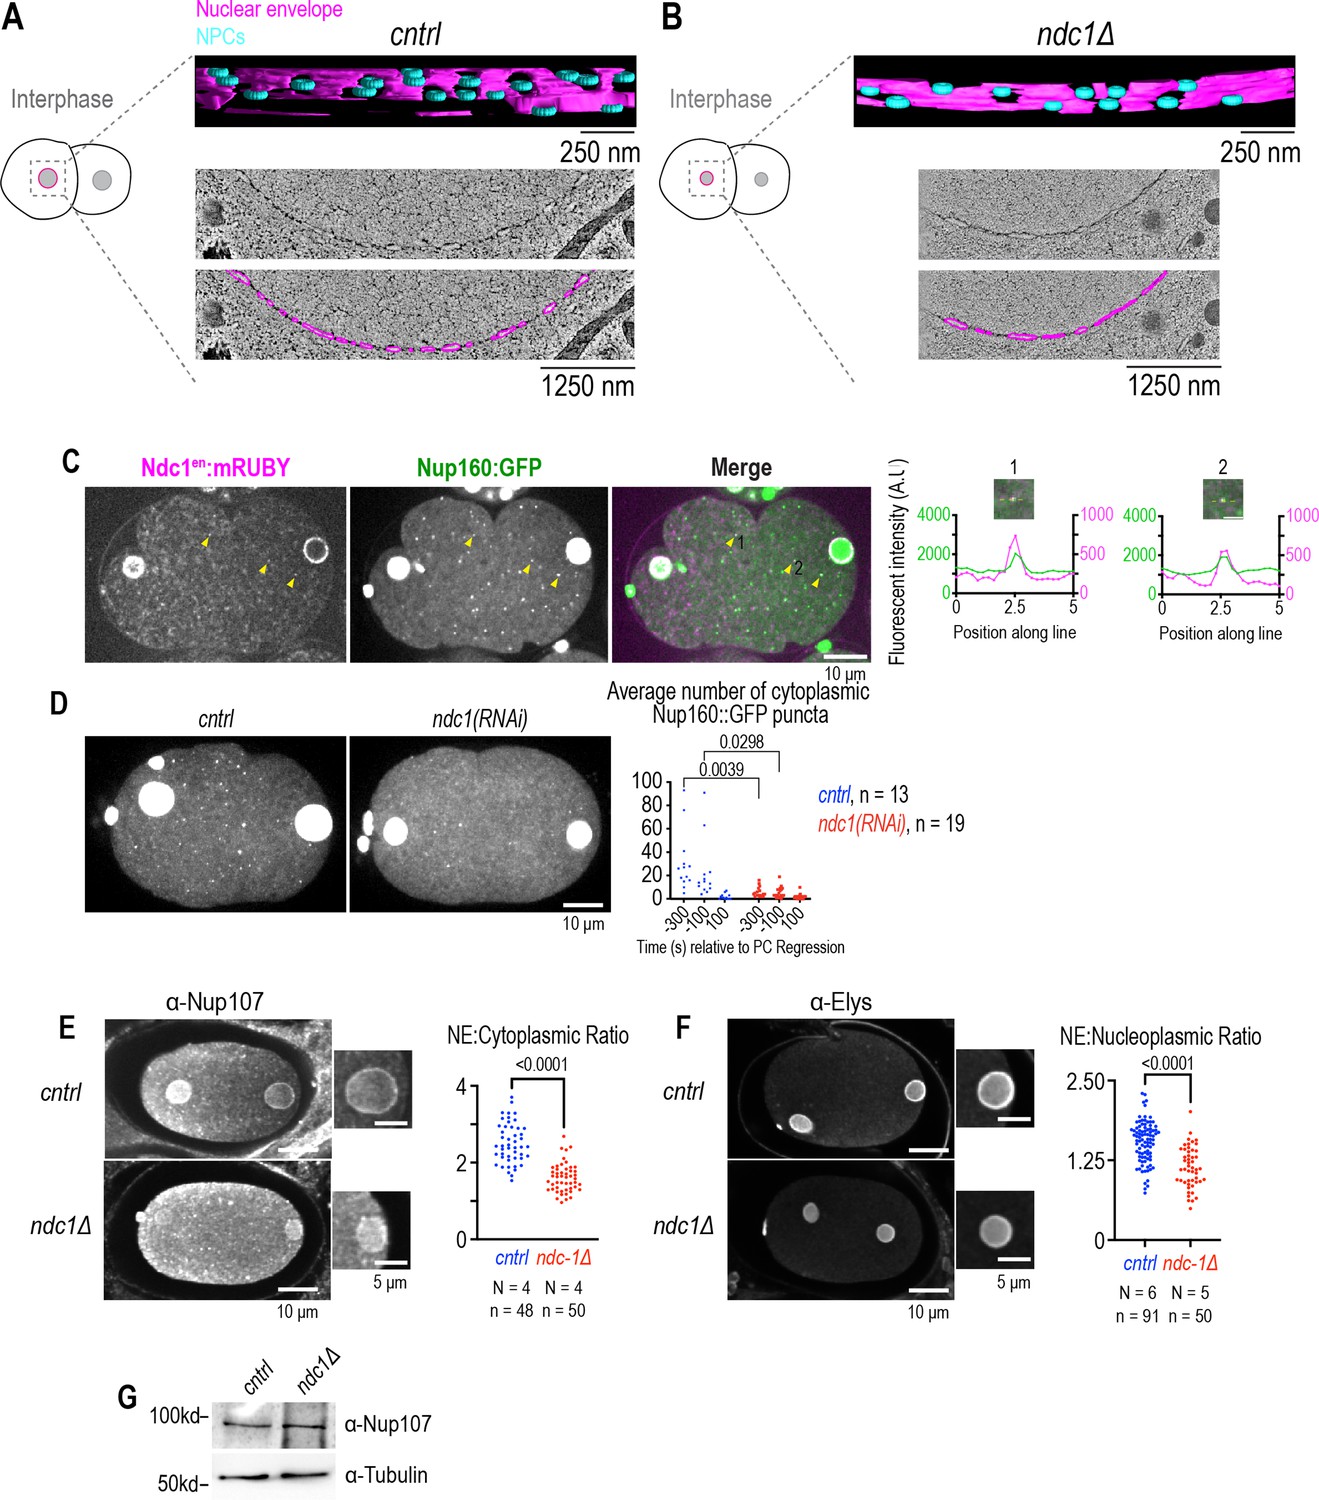
Reduced nuclear pore complex density in expanded nuclei, levels of outer ring scaffold nucleoporins at the nuclear rim and cytoplasmic puncta resulti from loss of Ndc1.
Related to Figure 3. (A, B) 3D model of tomograms of expanded nuclei showing membranes (magenta) and NE holes ~100 nm (blue) for indicated conditions. To calculate the density of ‘nuclear pore complex’ holes during interphase, we segmented and quantified six regions (1.52 μm2,1.20 μm2, 0.99 μm2, 0.95 μm2, 0.31 μm2, and 0.19 μm2) from two different control nuclei and nine regions (1.03 μm2, 1.02 μm2, 0.87 μm2, 0.65 μm2, 0.58 μm2, 0.55 μm2, 0.52 μm2, 0.41 μm2, and 0.23 μm2) from ndc1Δ nuclei. Scale bars indicated in figure. (C) Confocal overview and magnified images of embryo from a time lapse series of Nup160:GFP and Ndc1en:mRuby (left). Yellow arrows indicate example puncta. The 5 μm line scans measuring background-corrected fluorescence intensities for each marker drawn across two representative cytoplasmic puncta with co-localized Ndc1 and Nup160 signal (right). Scale bars, 10 μm for overview image and 2.5 μm for magnified images. (D) Max projection confocal images of Nup160:GFP for indicated conditions (left). Plot of average number of cytoplasmic Nup160:GFP structures under indicated conditions at time points relative to pseudocleavage (PC) regression (right). Scale bar, 10 μm. Student’s T-test was used to determine statistical significance. (E) Fixed overview and magnified images of C. elegans embryos immunostained with antibodies that recognize Nup107 for indicated conditions (left). Plot of NE to cytoplasmic ratio for normalized Nup107 fluorescence intensity (right). Scale bars, 10 μm for overview image and 5 μm for magnified images. (F) Fixed overview and magnified images of C. elegans embryos immunostained for antibodies against ElysMel-28 for indicated conditions (right). Plot of NE to nucleoplasmic ratio for normalized ElysMel-28 fluorescence intensity (right). Scale bars, 10 μm and 5 μm for magnified images. (G) Immunoblot of whole worm lysates probed for antibodies that recognize Nup107 and α-tubulin for indicated conditions.
-
Figure 3—figure supplement 1—source data 1
Excel file containing individual data points.
- https://cdn.elifesciences.org/articles/75513/elife-75513-fig3-figsupp1-data1-v1.xlsx
-
Figure 3—figure supplement 1—source data 2
Source image for the immunoblot in Figure 3—figure supplement 1G (Nup107 levels).
- https://cdn.elifesciences.org/articles/75513/elife-75513-fig3-figsupp1-data2-v1.pdf
Figure 3—figure supplement 2
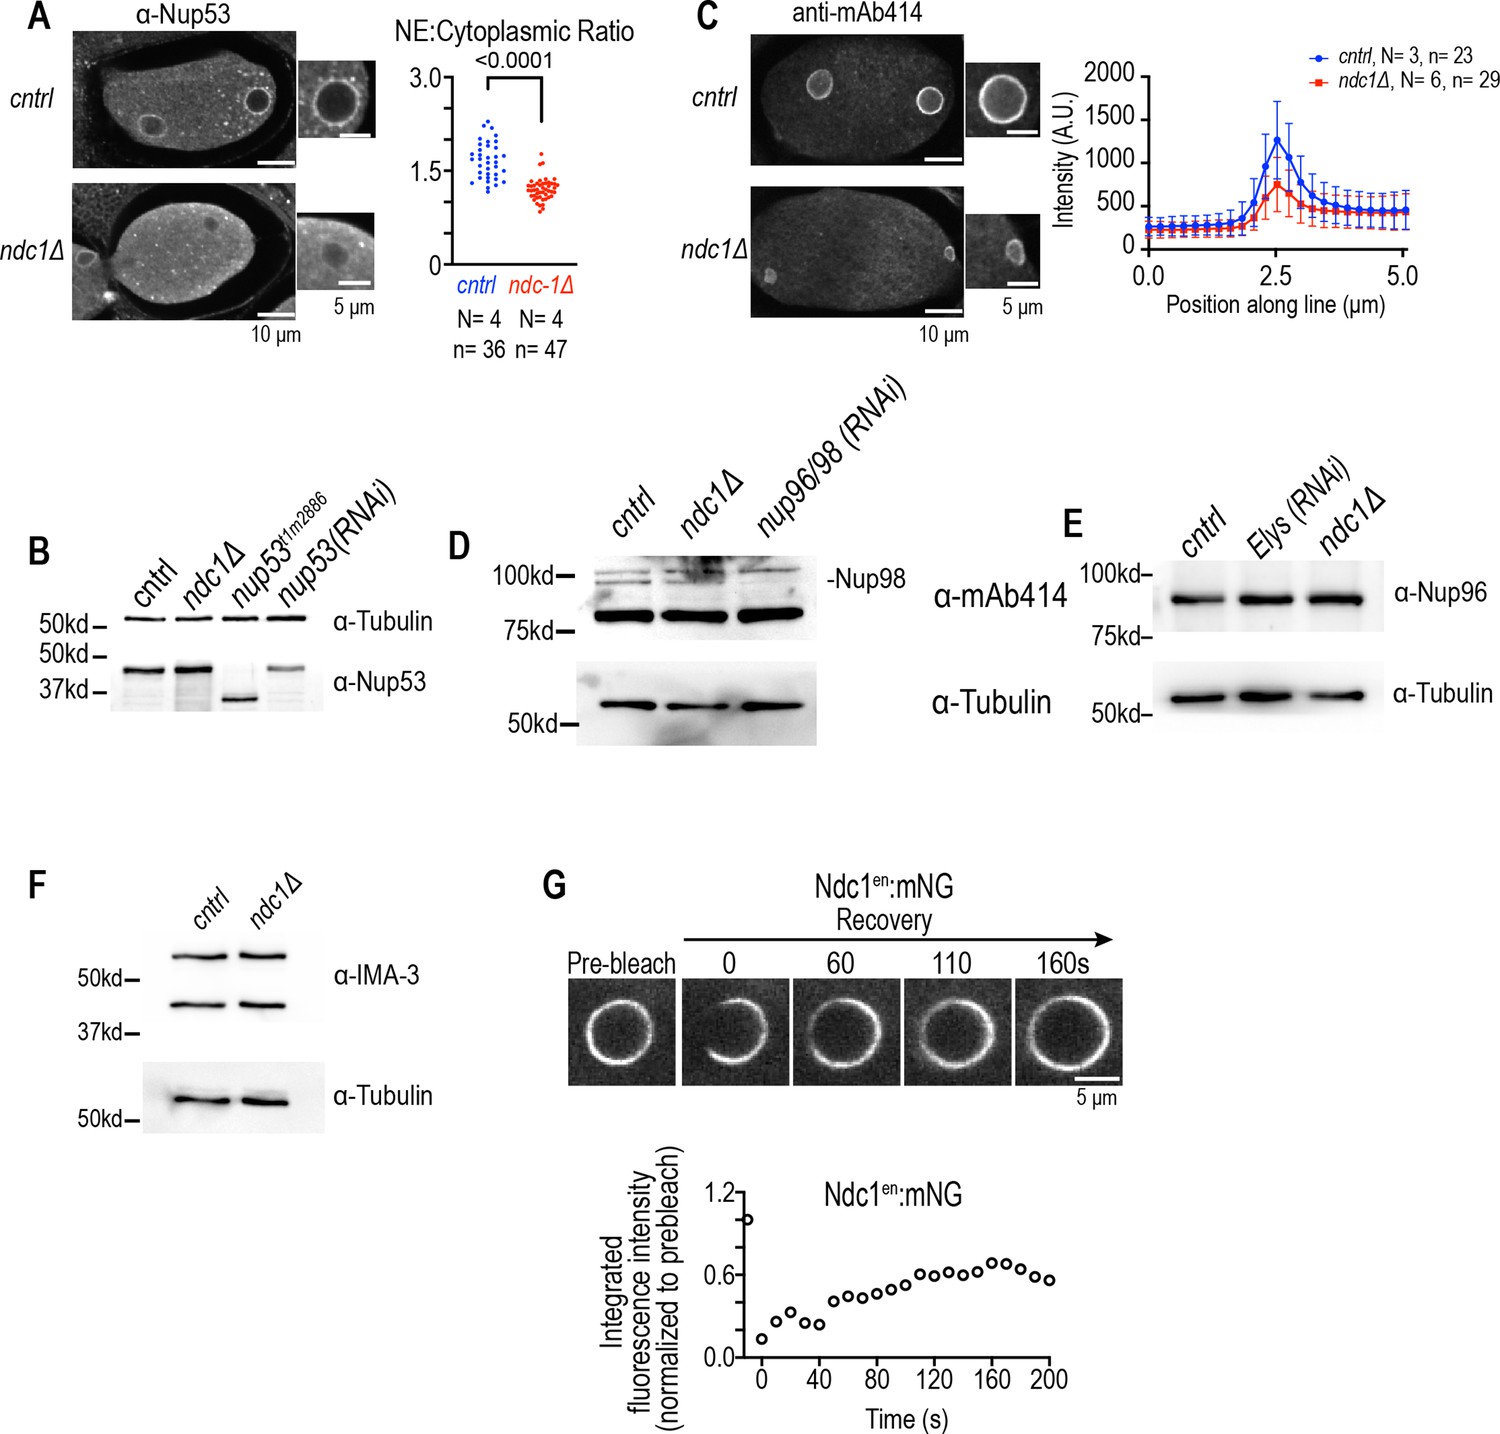
Characterization of protein levels and localization of nucleoporins in ndc1 deletion mutant and fluorescence recovery after photobleaching (FRAP) analysis of Ndc1en:mNG in nuclear envelope (NE) of embryos.
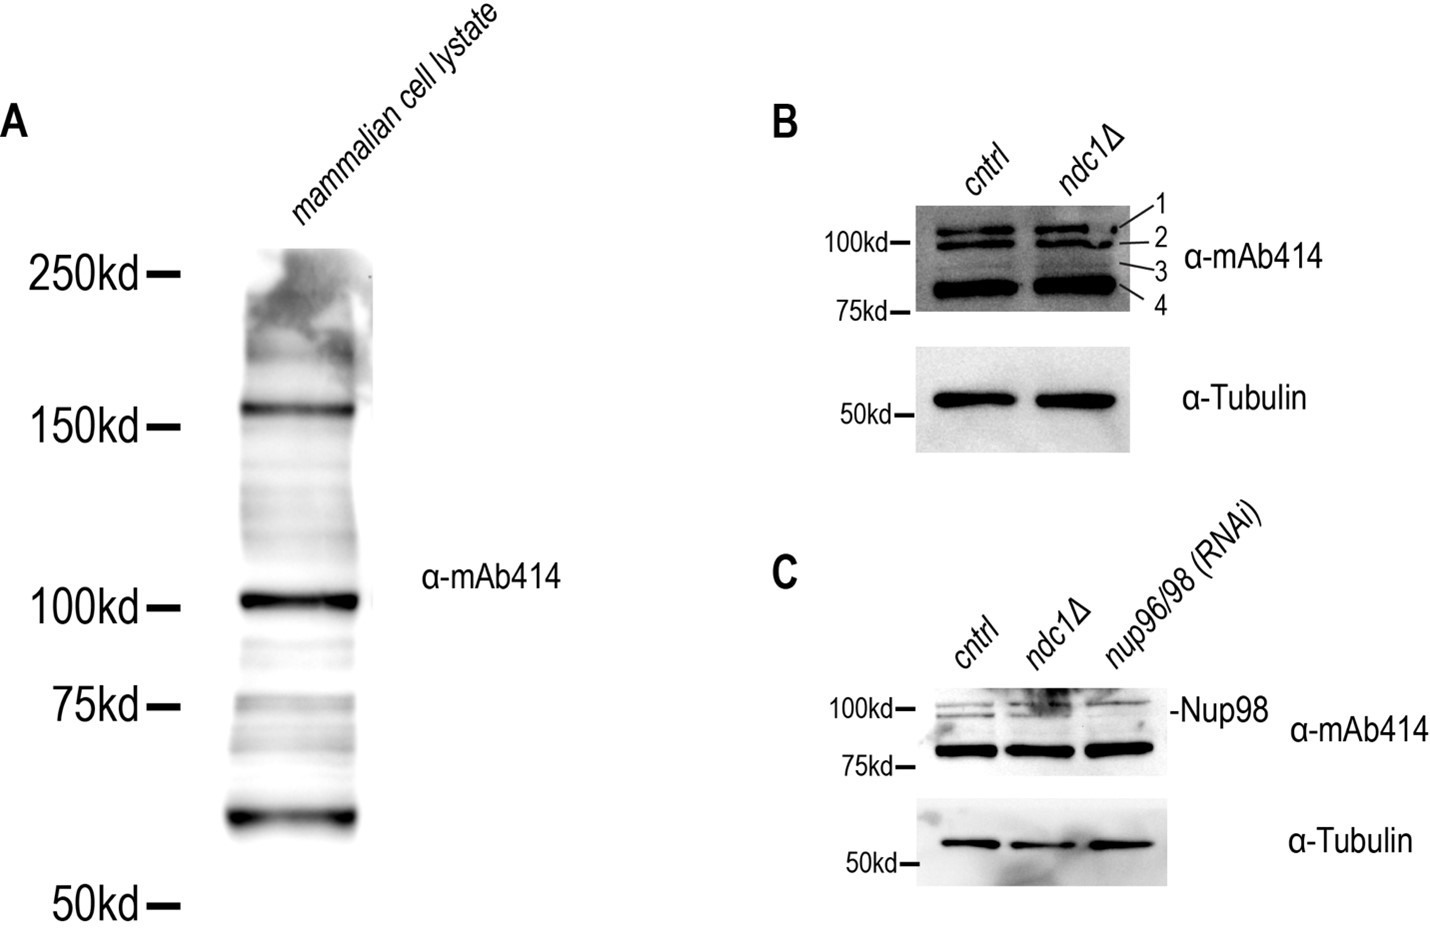
Related to Figure 3. (A) Fixed overview and magnified images of C. elegans embryos immunostained for antibodies that recognize Nup53 for indicated conditions (left). Scale bars, 10 μm for overview image and 5 μm for magnified images. Plot of NE to cytoplasmic ratio for normalized Nup53 fluorescence intensity (right). (B) Immunoblot of whole worm lysates probed for antibodies that recognize Nup53 and α-tubulin for indicated conditions. (C) (Left) Fixed overview images of C. elegans oocytes immunostained for mAb414 for indicated conditions. Scale bars, 10 μm for overview image and 5 μm for magnified images. Scale bars, 10 μm. (Right) Average line scan quantification for mAb414 signal under indicated conditions. (D) Immunoblot of whole worm lysates probed for mAb414 and α-tubulin for indicated conditions. (E) Immunoblot of whole worm lysates probed for Nup96 and α-tubulin for indicated conditions. (F) Immunoblot of whole worm lysates probed for IMA-3 and α-tubulin for indicated conditions. (G) Confocal images from time lapse series of fluorescence recovery after photobleaching (FRAP) of Ndc1en:mNG are shown (above). Scale bars, 5 μm. Representative plot of average fluorescence intensities of bleached region over time normalized to the prebleach intensity for each condition is shown (below).
-
Figure 3—figure supplement 2—source data 1
Excel file containing individual data points.
- https://cdn.elifesciences.org/articles/75513/elife-75513-fig3-figsupp2-data1-v1.xlsx
-
Figure 3—figure supplement 2—source data 2
Source image for the immunoblots (Figure 3—figure supplement 2A-D).
(A) Source image for blot in B (Nup53 levels). (B) Source image for blot in D (mAb414 levels). (C) Source image for blot in E (Nup96 levels). (D) Source image for blot in F (IMA-3 levels).
- https://cdn.elifesciences.org/articles/75513/elife-75513-fig3-figsupp2-data2-v1.pdf
Figure 3—video 1
Electron tomogram of control nucleus from embryo frozen at onset of furrow ingression, z sections 315–386 (165 nm total).
Region of electron tomogram of C. elegans wild-type two-cell stage nuclei during nuclear envelope reformation. Playback rate is four z-slices per second. Scale bar, 500 nm.
Figure 3—video 2
Electron tomogram of control nucleus from embryo frozen at onset of furrow ingression z sections 524–595 (165 nm total).
Region of electron tomogram of C. elegans wild-type two-cell stage nuclei during nuclear envelope reformation. Playback rate is four z-slices per second. Scale bar, 500 nm.
Figure 3—video 3
Electron tomogram of ndc1Δ nucleus from embryo frozen at onset of furrow ingression z sections 8–309 (495 nm total).
Region of electron tomogram of C. elegans ndc1Δ two-cell stage nuclei during nuclear envelope reformation. Playback rate is four z-slices per second. Scale bar, 500 nm.
Figure 3—video 4
3D model of region of tomogram in Figure 3—videos 1; 2.
The nuclear envelope (NE; magenta) of a wild-type nucleus was traced in the non-core regions of the reforming NE. Nuclear pore complexes (NPCs; blue) were also traced. The model is rotated 360° around the Y-axis, then the X-axis twice, once with the NPCs marked and once without. Scale bar, 250 nm.
Figure 3—video 5
3D model of region of tomogram in Figure 3—video 3.
The nuclear envelope (NE; magenta) of an ndc1Δ nucleus was traced in the non-core regions of the reforming NE. Holes in the NE <100 nm are marked in blue to indicate potential nuclear pore complexes (NPCs). The model is rotated 360° around the Y-axis, then the X-axis twice, once with the NPCs in blue marked and once without. Scale bar, 250 nm.
Figure 3—video 6
Electron tomogram of control and ndc1Δ nucleus from interphase embryo; z sections 150–250 (212 nm total) for control and z sections 30–130 (212 nm total) for ndc1Δ, related to Figure 3—figure supplement 1.
Region of electron tomogram of C. elegans two-cell stage nuclei in interphase (control left, ndc1Δ right). Playback rate is four z-slices per second. Scale bar, 2500 nm.
Figure 3—video 7
Ndc1 is required for stable incorporation of Nup160:GFP.
C. elegans two-cell stage AB nucleus expressing Nup160:GFP, cntrl (left), and ndc1(RNAi) (right). Images were acquired every 10 s, playback rate is four frames per second. Three images were acquired before a rectangular ROI was used to photobleach a region of the nuclear envelope. Scale bar, 5 µm.
Figure 3—video 8
Fluorescence recovery after photobleaching of Ndc1:mNG at the nuclear envelope (NE) of expanding one- to two-cell stage nucleus.
C. elegans two-cell stage AB nuclei expressing Ndc1en:mNG. Images were acquired every 10 s, playback rate is four frames per second. Three images were acquired before a rectangular ROI was used to photobleach a region of the NE. Scale bar, 5 µm.
Figure 4 with 2 supplements
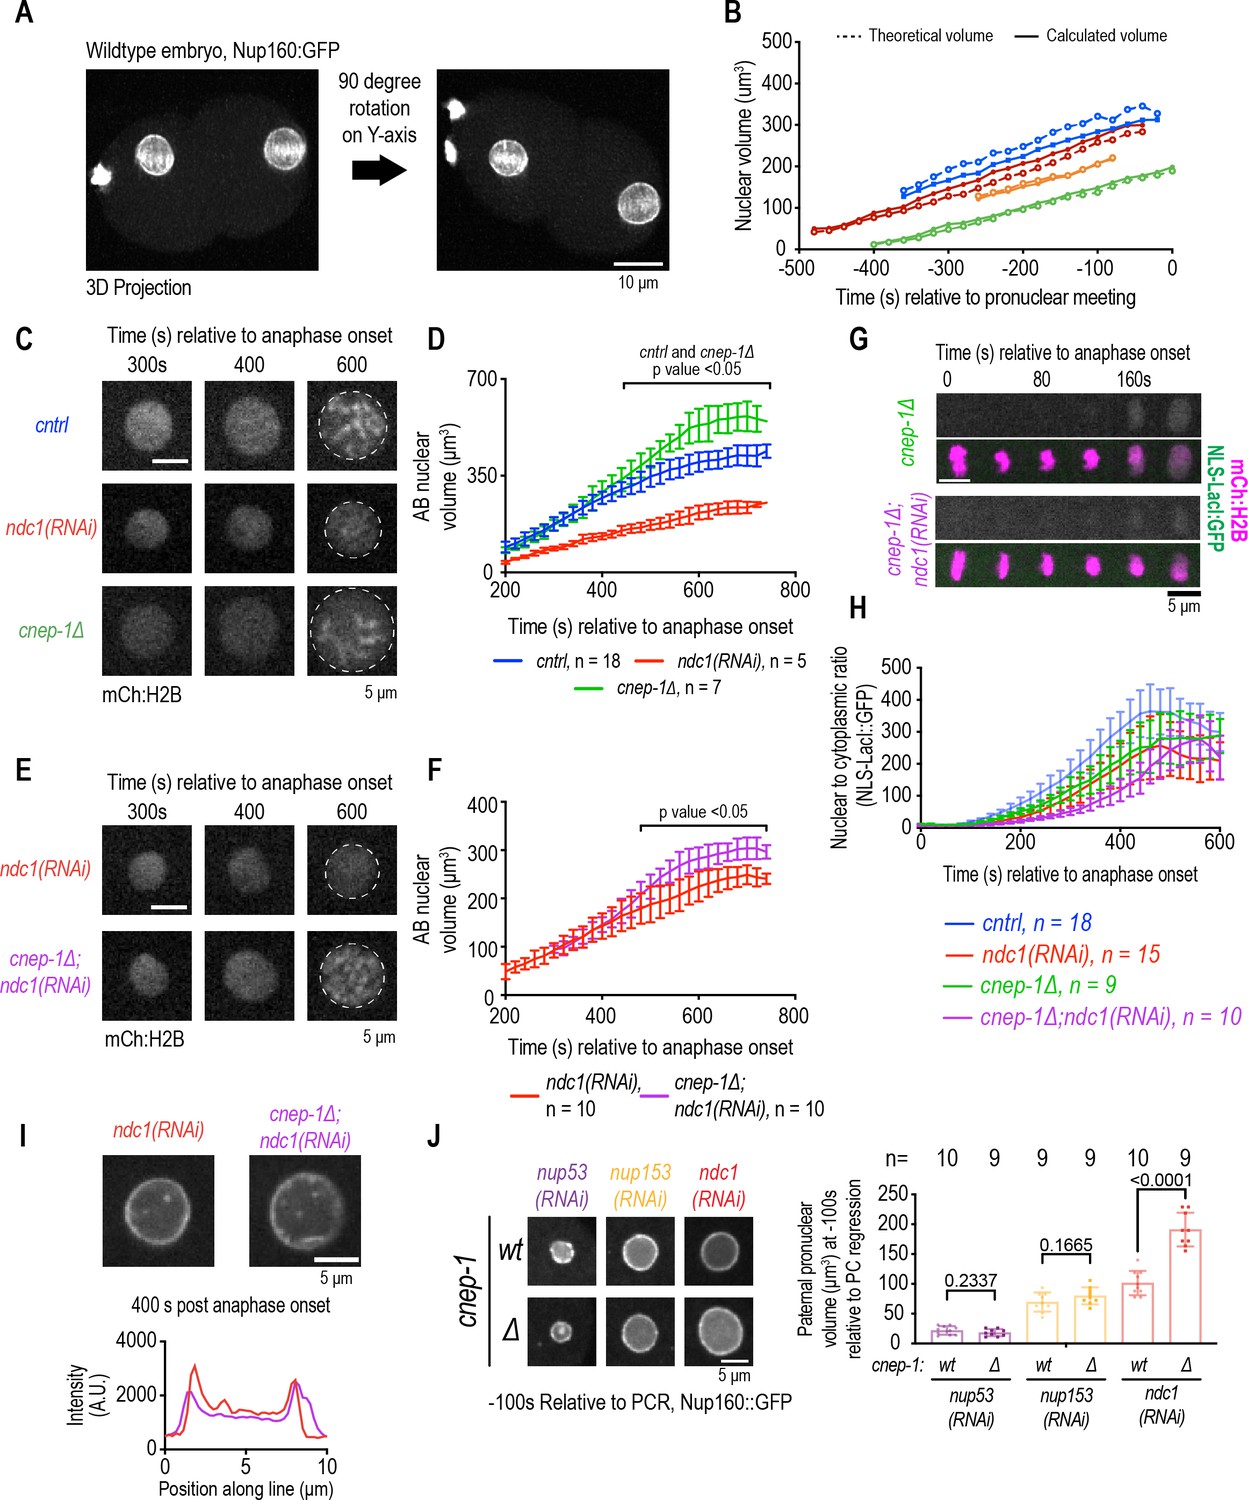
Increasing membrane biogenesis restores the slow rate of nuclear expansion and small nuclear size resulting from loss of ndc1.
(A) Dual-view inverted light sheet microscopy 3D projection of wild-type one-cell stage embryo. Scale bar, 10 μm. (B) Theoretical and calculated pronuclear volume for indicated time points. Each color represents a distinct embryo. (C) Magnified images of AB nucleus from confocal series for mCh:H2B for indicated conditions. Scale bar, 5 μm. (D) AB nuclear volume for indicated conditions at indicated time points. Average ± S.D. is shown. (E) Magnified images of AB nucleus from confocal series for mCh:H2B for indicated conditions. Scale bar, 5 μm. (F) AB nuclear volume for indicated conditions at indicated time points. Average ± S.D. is shown. (G) Confocal images of chromosome region from time series relative to anaphase onset with indicated markers and in indicated conditions. Scale bar, 5 μm. (H) Plot of nuclear to cytoplasmic ratio of GFP:NLS-LacI for indicated conditions. n = # of embryos. Average ± S.D. is shown. (I) Magnified images of AB nucleus from confocal series for Nup160:GFP (above) and line scans measuring background-corrected fluorescence intensities (below) for each condition. Scale bar, 5 μm. (J) (Left) Magnified images of paternal pronucleus at –100 s relative to pseudocleavage (PC) regression expressing Nup160:GFP under indicated conditions. Scale bar, 5 μm. (Right) Plot of average pronuclear volume for indicated conditions at –100 s relative to PC regression. n = # of embryos.
-
Figure 4—source data 1
Excel file containing individual data points related to Figure 4.
- https://cdn.elifesciences.org/articles/75513/elife-75513-fig4-data1-v1.xlsx
Figure 4—figure supplement 1
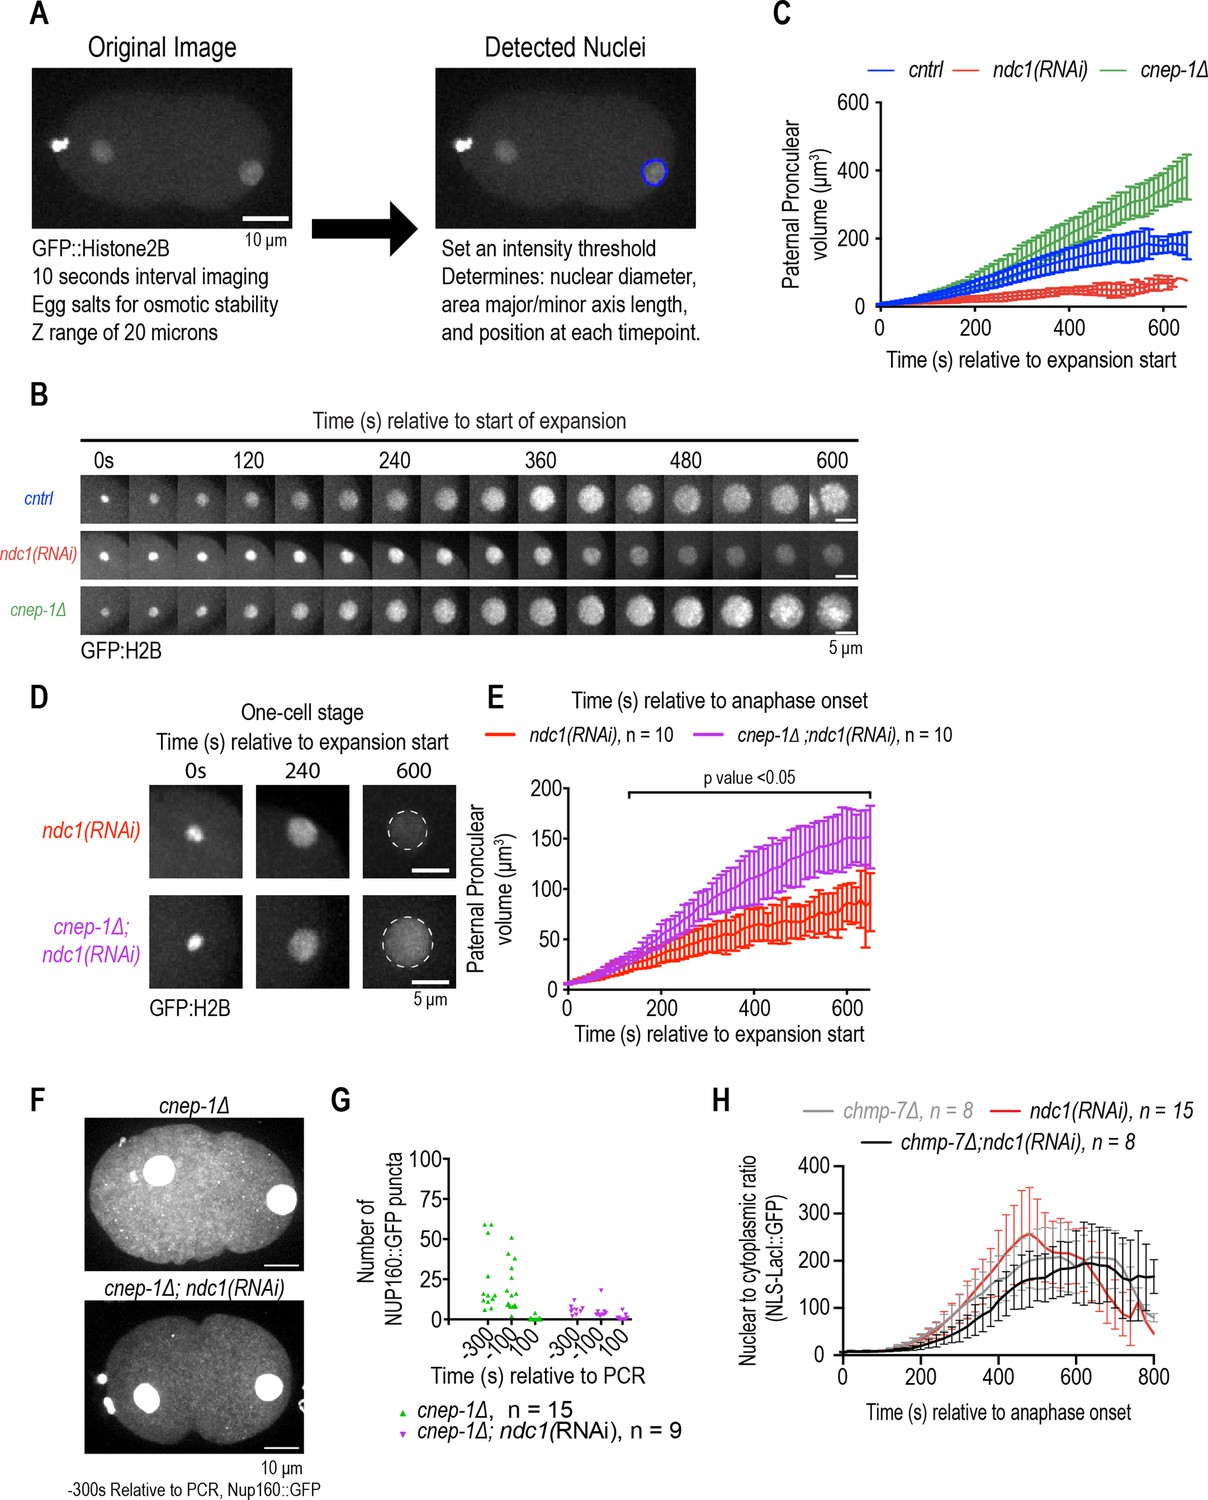
Characterization of nuclear size in embryos lacking ndc1 and cnep-1.
Related to Figure 4. (A) (Left) Confocal overview images of embryo from a time lapse series of indicated markers for indicated time points. Scale bar, 10 μm. (Right) Same images as in left, but with nuclear perimeter traced based off MATLAB nuclear tracking script. (B) Confocal images from time lapse series of nuclear expansion for indicated conditions relative to expansion start. Scale bar, 5 μm. (C) Plot of pronuclear volume for indicated conditions at indicated time points. Average ± S.D. is shown. (D) Magnified images of paternal pronucleus from confocal series for GFP:H2B for indicated conditions. Scale bar, 5 μm. (E) Plot of pronuclear volume for indicated conditions at indicated time points. Average ± S.D. is shown. (F) Max projection confocal images of Nup160:GFP for indicated conditions. Scale bar, 10 μm. (G) Plot of average number of cytoplasmic Nup160:GFP structures under indicated conditions at time points relative to pseudocleavage regression. (H) Plot of nuclear to cytoplasmic ratio of GFP:NLS-LacI for indicated conditions. The ndc1(RNAi) data is duplicated from Figure 2F. n = # of embryos. Average ± S.D. is shown.
-
Figure 4—figure supplement 1—source data 1
Excel file containing individual data points.
- https://cdn.elifesciences.org/articles/75513/elife-75513-fig4-figsupp1-data1-v1.xlsx
Figure 4—video 1
Dual-view inverted light sheet microscopy 3D reconstructions of wild-type and cnep-1Δ embryos, related to Figure 4 and Figure 4—figure supplement 1.
3D projection of C. elegans one-cell stage embryo expressing Nup160:GFP. Embryo rotates around the Y-axis 10° per frame. Cntrl (left) and cnep-1Δ (right).
Figure 5 with 1 supplement
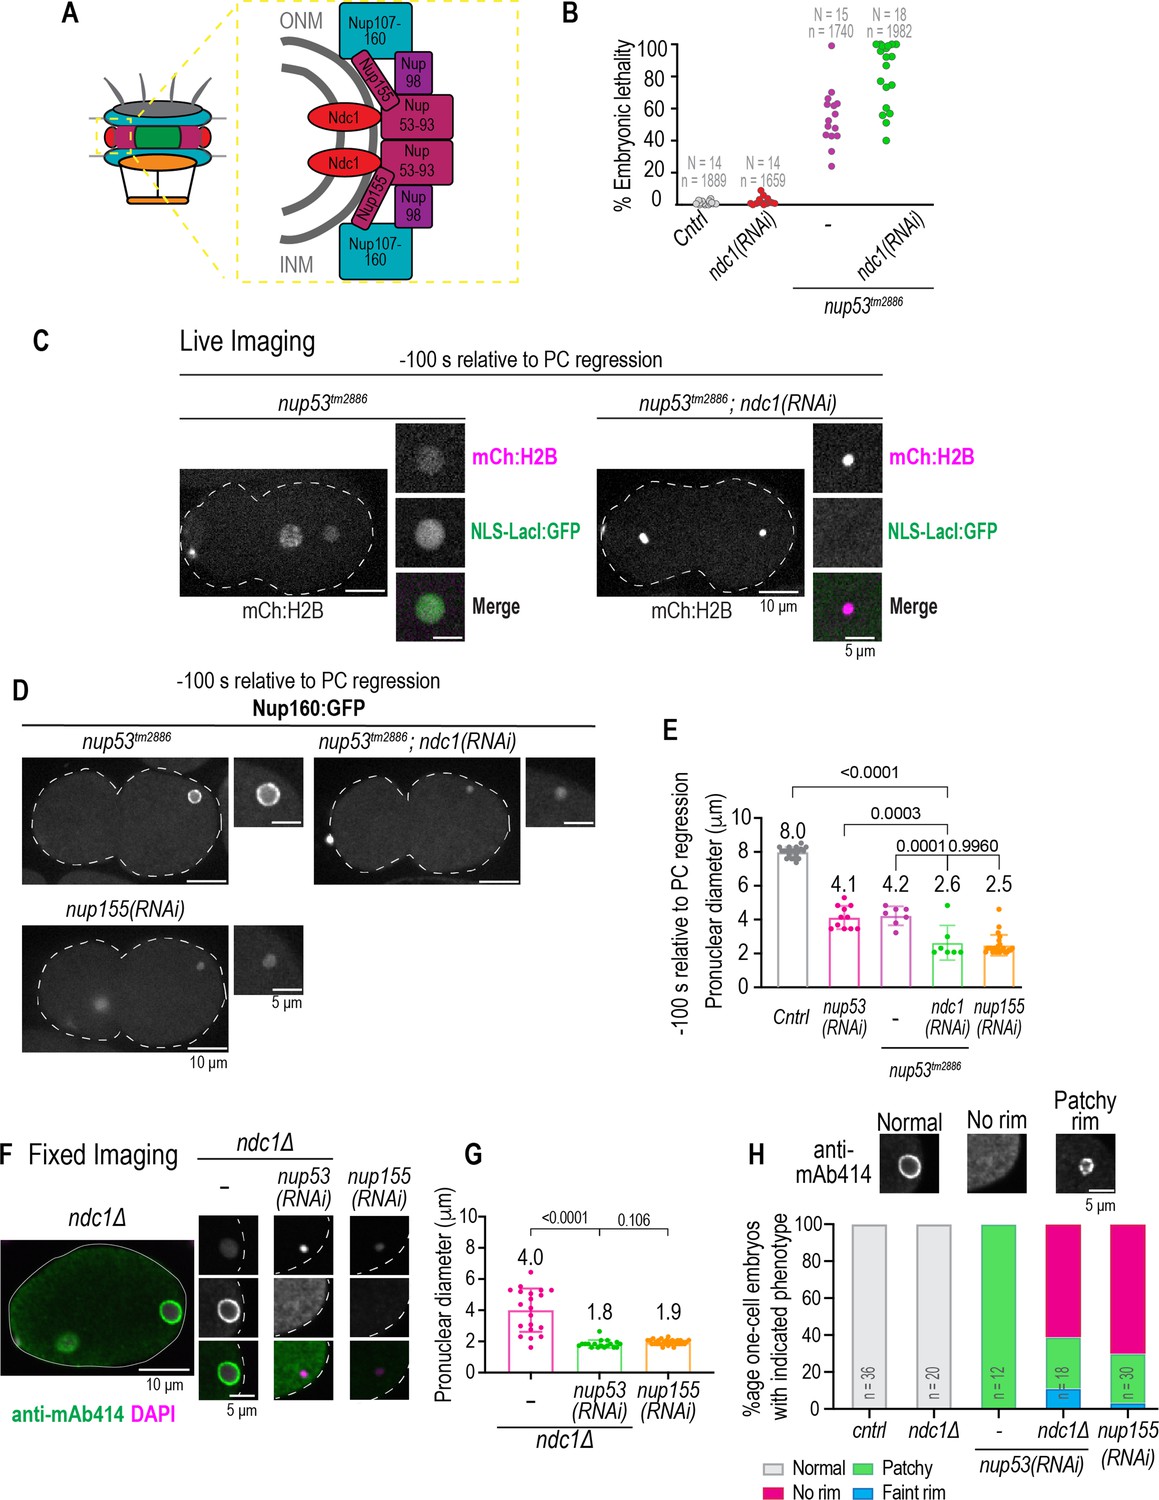
Parallel functions for Ndc1 and Nup53 in nuclear assembly.
(A) Schematic of nuclear pore complex (NPC) (left) and NPC subcomplex organization (right) is shown. (B) Plot of percentage embryonic lethality for indicated conditions. N = # of worms. n = # of embryos. (C) Confocal overview and magnified images of embryo from a time lapse series of indicated markers for indicated conditions. Scale bars, 10 μm for overview image and 5 μm for magnified images. (D) Confocal overview and magnified images of embryo from a time lapse series of Nup160:GFP for indicated conditions. Scale bars, 10 μm for overview image and 5 μm for magnified images. (E) Plot of pronuclear diameter for indicated conditions at indicated time point. Average ± S.D. is shown. n = # of embryos. cntrl n=9, nup53(RNAi) n=11, nup53tm2886 n=7, and nup53tm2886;ndc1(RNAi) n=7. (F) Fixed overview and magnified images of C. elegans embryos immunostained for mAb414 and DAPI in indicated conditions. Scale bars, 10 μm for overview image and 5 μm for magnified images. (G) Plot of pronuclear diameter for indicated conditions at indicated time point. Average ± S.D. is shown. n = # of embryos. ndc1Δ n=20, ndc1Δ;nup53(RNAi) n=18, and nup155(RNAi) n=30. (H) Magnified images of paternal pronucleus from fixed one-cell stage embryos immunostained with mAb414 for indicated conditions (top). Scale bar, 5 μm. Plot of mAb414 appearance surrounding chromatin under indicated conditions (bottom). A two-way ANOVA was used to determine statistical significance between indicated conditions. n = # of embryos. Scale bars, 10 μm for overview image and 5 μm for magnified images.
-
Figure 5—source data 1
Excel file containing individual data points related to Figure 5.
- https://cdn.elifesciences.org/articles/75513/elife-75513-fig5-data1-v1.xlsx
Figure 5—figure supplement 1
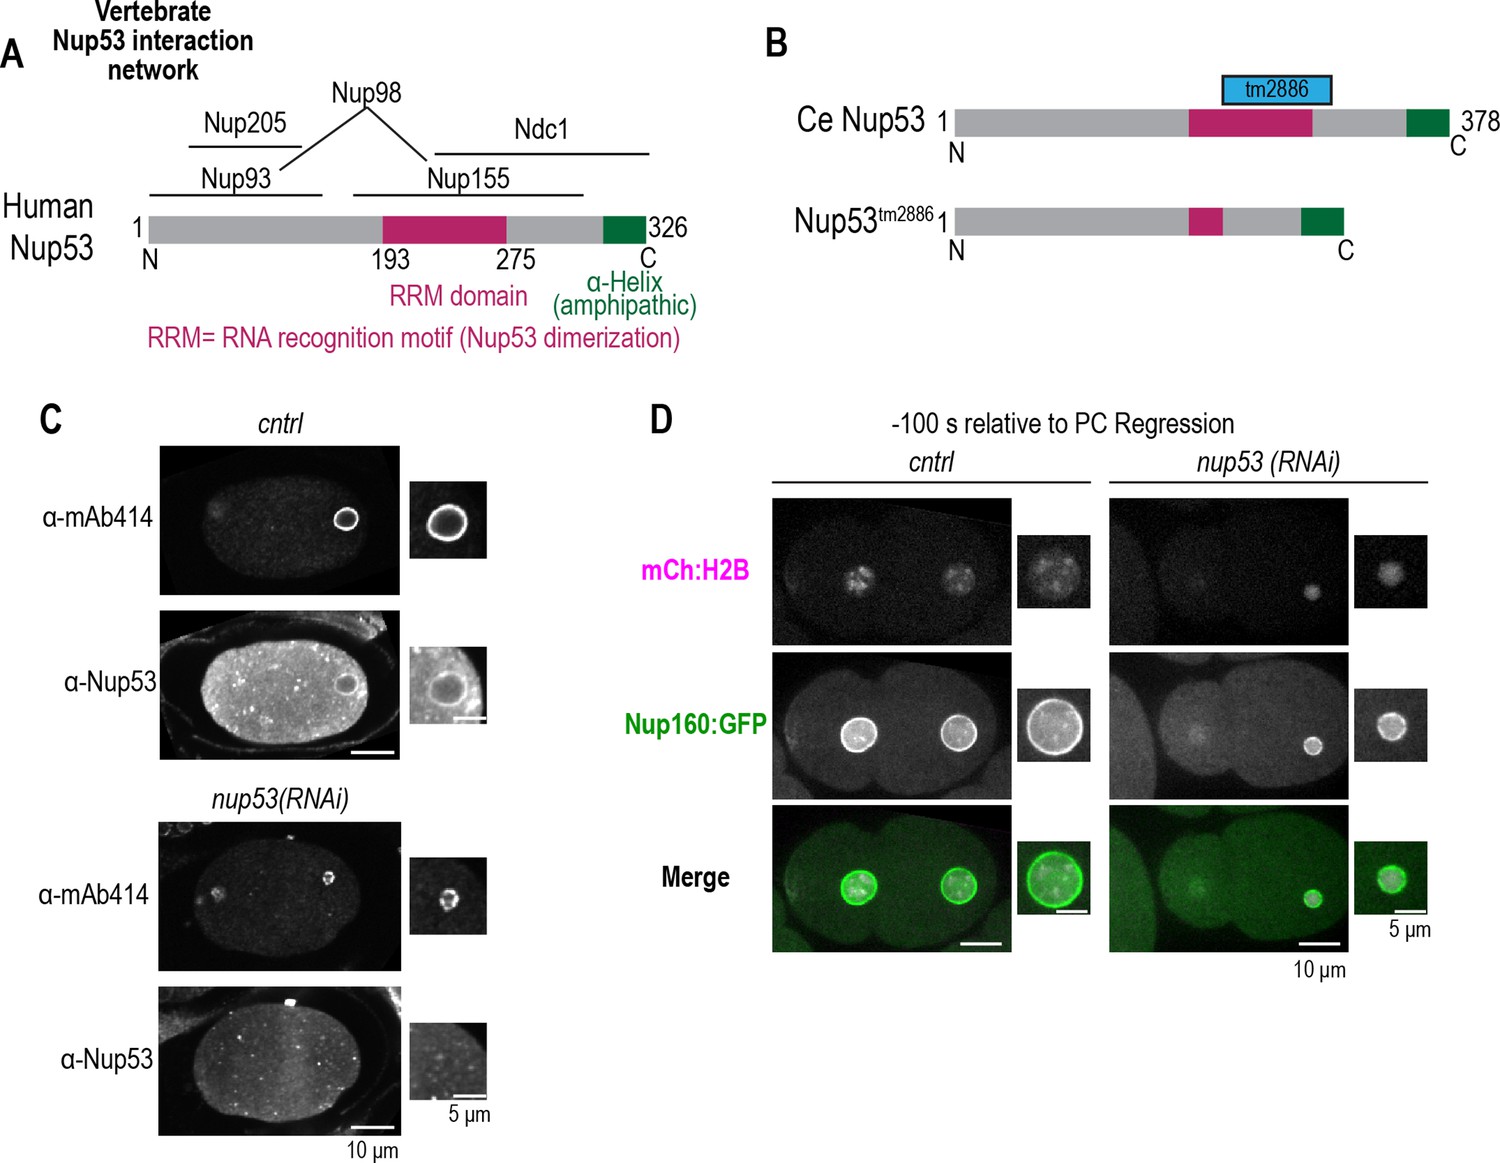
Characterization of nup53 RNAi depletion and a nup53 mutant allele.
Related to Figure 5. (A) Schematic of Nup53 domain architecture and binding interactions based on human Nup53 binding sites. (B) Schematic of C. elegans Nup53 domain architecture and the resulting mutant protein resulting from the nup53tm2886 allele. (C) Fixed overview and magnified images of C. elegans embryos immunostained for mAb414 and Nup53 for indicated conditions. Scale bars, 10 μm for overview image and 5 μm for magnified images. (D) Confocal overview and magnified images of one-cell stage embryo from a time lapse series expressing Nup160:GFP and mCh:H2B for indicated conditions. Scale bars, 10 μm for overview image and 5 μm for magnified images.
Figure 6

Independent requirements for Ndc1 and lipid synthesis in nuclear formation and expansion.
(A) In the absence of Ndc1, the nuclear envelope (NE) is more continuous, and outer ring scaffold components in the NE are highly dynamic. Some NPCs still assemble and so nuclear transport is eventually established. Ndc1 functions at least in part redundantly to Nup53 in post-mitotic NPC assembly. Both Ndc1 and Nup53 may function through the shared factor Nup155. Loss of Ndc1 in combination with either cnep-1 or chmp-7 leads to additional sealing defects (represented by holes in the NE) that further delay nuclear formation. (B) Endoplasmic reticulum (ER) membranes feed surface area expansion and nuclear import accumulates macromolecules inside the nucleus to increase nuclear volume. (C) Independent requirements for Ndc1 and membrane biogenesis promote nuclear growth.
Author response image 1
Author response image 2
Tables
Key resources table
| Reagent type (species) or resource | Designation | Source or reference | Identifiers | Additional information |
|---|---|---|---|---|
| Antibody | mouse monoclonal α-alpha-tubulin | Millipore Sigma | Cat#05–829; RRID: AB_310035 | 1 μg/mL |
| Antibody | mouse monoclonal mAb414 | Biolegend | Cat# 902907; RRID: AB_2734672 | WB: 1 μg/mL IF:2.5 μg/mL |
| Antibody | mouse monoclonal mAb414 | Millipore-Sigma | MABS1267 | WB: 1 μg/mL IF: 2.5 μg/mL |
| Antibody | rabbit polyclonal α-NPP-5/Nup107 | Ródenas et al., 2009 | N/A | WB: 1:300 IF: 1:300 |
| Antibody | rabbit polyclonal α-NPP-10N/Nup98 | Ródenas et al., 2009 | N/A | WB: 1:500 |
| Antibody | rabbit polyclonal α-NPP-10C/Nup96 | Ródenas et al., 2009 | N/A | WB: 1:500 |
| Antibody | rabbit polyclonal α-NPP-19/Nup53 | Ródenas et al., 2009 | N/A | WB: 1:1,000 IF: 1:300 |
| Antibody | rabbit polyclonal α-MEL-28/Elys | Ródenas et al., 2009 | N/A | IF: 1:500 |
| Antibody | rabbit polyclonal α-IMA-3 | Geles and Adam, 2001 | N/A | WB: 1:400 |
| Antibody | rabbit polyclonal α-LMN1 | Penfield et al., 2018 | N/A | IF: 1 μg/mL |
| Antibody | Rhodamine RedX donkey polyclonal α rabbit IgG | Jackson Immuno | Cat#711-295-152; RRID: AB_2340613 | IF: 1:200 |
| Antibody | FITC goat polyclonal α mouse IgG | Jackson Immuno | Cat#115-095-146; RRID: AB_2338599 | IF: 1:200 |
| Antibody | goat polyclonal α mouse IgG-HRP | Thermo Fisher | Cat#31430; RRID: AB_228307 | WB: 1:7,000 |
| Antibody | goat polyclonal α rabbit IgG-HRP | Thermo Fisher | Cat#31460; RRID: AB_228341 | WB: 1:5,000 |
| Commercial assay or kit | Clarity Max Western ECL Substrate | BIO-Rad | 1705060 S | |
| Commercial assay or kit | MEGAscript T3 Transcription Kit | Invitrogen | Cat# AM1338 | |
| Commercial assay or kit | MEGAscript T7 Transcription Kit | Invitrogen | Cat# AM1334 | |
| Strain and strain background (Caenorhabditis elegans) | C. elegans: Strain N2: wildtype (ancestral) | Caenorhabditis Genetics Center | N2 | |
| Strain and strain background (C. elegans) | C. elegans: Strain OD997: unc-119(ed3)III; ltSi231[pNH16; Pmel-28∷GFP-mel-28; cb-unc- 119(+)]II;; ltIs37[pAA64; pie-1/mCherry::his-58; unc-119 (+)] IV | Hattersley et al., 2016 | OD997 | |
| Strain and strain background (C. elegans) | C. elegans: Strain OD999: unc-119(ed3)III; ltSi245[pNH42; Pnpp-18::GFP-npp-18; cb-unc- 119(+)]II; ltIs37[pAA64; pie-1/mCherry::his-58; unc-119 (+)] IV | Hattersley et al., 2016 | OD999 | |
| Strain and strain background (C. elegans) | C. elegans: Strain OD1496: unc-119(ed3)III; ltSi464[pNH103; Pmex-5::npp-6::GFP::tbb-2:3'UTR; cbunc-119(+)]I; ltIs37[pAA64; pie-1/mCherry::his-58; unc- 119 (+)] IV | Hattersley et al., 2016 | OD1496 | |
| Strain and strain background (C. elegans) | C. elegans: Strain OD1498: unc-119(ed3)III; ltSi465[pNH104; Pmex-5::npp-15::GFP::tbb-2:3'UTR; cb-unc-119(+)]I; ltIs37[pAA64; pie-1/mCherry::his-58; unc-119 (+)] IV | Hattersley et al., 2016 | OD1498 | |
| Strain and strain background (C. elegans) | C. elegans: Strain OD1499: unc-119(ed3)III; ltSi463[pNH102; Pmex-5::npp2::GFP::tbb-2:3'UTR; cb- unc-119(+)]I; ltIs37[pAA64; pie-1/mCherry::his-58; unc-119 (+)] IV | Hattersley et al., 2016 | OD1499 | |
| Strain and strain background (C. elegans) | C. elegans: Strain OD2400: ltSi896[pNH152; Pgsp-2::GSP-2::GFP; cb-unc-119(+)]I; ltIs37[pAA64; pie-1/mCherry::his-58; unc-119 (+)] IV | Hattersley et al., 2016 | OD2400 | |
| Strain and strain background (C. elegans) | C. elegans: Strain SBW32: unc-119(ed3) III; ltIs24 [pAZ132; pie-1/GFP::tba-2; unc-119 (+)]; ltIs37 [(pAA64) pie-1p::mCherry::his-58+unc-119(+)] IV | Penfield et al., 2018 | SBW32 | |
| Strain and strain background (C. elegans) | C. elegans: Strain SBW47:unc-119(ed3) III; ltIs37 [pie-1/mCherry::his-58; unc-119 (+)] IV; ltIs75 [Ppie-1/GFP::TEV-Stag::LacI +unc-119(+)]. | Penfield et al., 2020 | SBW47 | |
| Strain and strain background (C. elegans) | C. elegans: Strain SBW56: npp-22(ndc1) (tm1845/nT1) V 7 x outcrossed | This study | SBW56 | Related to Figure 1—figure supplement 1D and E |
| Strain and strain background (C. elegans) | C. elegans: Strain SBW65: scpl-2(tm4369)II;unc-119(ed3) III; ltIs37 [pAA64; pie-1/mCHERRY::his-58; unc-119 (+)] IV;ltIs75 [(pSK5) pie-1::GFP::TEV-STag::LacI +unc-119(+)]. | Penfield et al., 2020 | SBW65 | |
| Strain and strain background (C. elegans) | C. elegans: Strain SBW79: chmp-7 (T24B8.2) deletion II; unc-119(ed3) III; ltIs37 [pAA64; pie-1/mCHERRY::his-58; unc-119 (+)] IV;ltIs75 [(pSK5) pie-1::GFP::TEV-STag::LacI +unc-119(+)]. | Penfield et al., 2020 | SBW79 | |
| Strain and strain background (C. elegans) | C. elegans: Strain SBW83: npp-22(ndc1) (sbw4) V, 4 x outcrossed | This study | SBW83 | Related to Figure 1B and C, Figure 1—figure supplement 1A-B |
| Strain and strain background (C. elegans) | C. elegans: Strain SBW84: unc-119(ed3) III; bqSi242 [lem-2p::lem-2::mCherry +unc-119(+)] IV; ltIs75 [(pSK5) pie-1::GFP::TEV-STag::LacI +unc-119(+)]. | This study | SBW84 | Related to Figure 2C and D |
| Strain and strain background (C. elegans) | C. elegans: Strain SBW191: npp-19(tm2886) 6× outcrossed | This study | SBW191 | Related to Figure 5B, Figure 5—figure supplement 1B |
| Strain and strain background (C. elegans) | C. elegans: Strain SBW244: ndc1::mNeonGreen (sbw8)–4× outcrossed | This study | SBW244 | Related to Figure 3E and Figure 3—figure supplement 1G |
| Strain and strain background (C. elegans) | C. elegans: Strain SBW245: unc-119(ed3) III; ltIs37 [pAA64; pie-1/mCHERRY::his-58; unc-119 (+)] IV; ndc1::mNEON (sbw8)–4× outcrossed | This study | SBW245 | Related to Figure 2—figure supplement 1B |
| Strain and strain background (C. elegans) | C. elegans: Strain SBW252: unc-119(ed3) III; ltIs 76 [pAA178; pie-1/mCherry:SP-12; unc-119 (+)]; ndc1::mNEON (sbw8)–4× outcrossed | This study | SBW252 | Related to Figure 2—figure supplement 1C |
| Strain and strain background (C. elegans) | C. elegans: Strain SBW254:bqSi242 [lem-2p::lem-2::mCherry +unc-119(+)] IV.; ndc1::mNeonGreen (sbw8)–4× outcrossed | This study | SBW254 | Related to Figure 2B |
| Strain and strain background (C. elegans) | C. elegans: Strain SBW260: npp-19(tm2886) outcross 6 x; (unc-119(ed3)III; ltSi464[pNH103; Pmex-5::npp6::GFP::tbb-2:3'UTR; cb-unc-119(+)]I) | This Study | SBW260 | Related to Figure 5D |
| Strain and strain background (C. elegans) | C. elegans: Strain SBW266: npp-19(tm2886) outcross 6 x; unc-119(ed3) III; ltIs37 [pAA64; pie-1/mCHERRY::his-58; unc-119 (+)] IV; ltIs75 [(pSK5) pie-1::GFP::TEV-STag::LacI +unc-119(+)]. | This Study | SBW266 | Related to Figure 5C |
| Strain and strain background (C. elegans) | C. elegans: Strain SBW293: (unc-119(ed3)III; ltSi464[pNH103; Pmex-5::npp6::GFP::tbb-2 3'UTR; cb-unc-119(+)]I) V; ndc1::mRuby (sbw14)–4 x outcrossed | This study | SBW293 | Related to Figure 3—figure supplement 1C |
| Sequence-based reagent | T3 primer for dsRNA targeting npp-22(ndc1) Forward: AATTAACCCTCACTAAAGGCCCGCCTCCATATACAGTTC | This Study | N/A | Used to generate dsRNA for RNAi knock down of ndc1 |
| Sequence-based reagent | T7 primer for dsRNA targeting npp-22(ndc1) Reverse: TAATACGACTCACTATAGGTGTCAATGGCTGCAATGAGT | This Study | N/A | Used to generate dsRNA for RNAi knock down of ndc1 |
| Sequence-based reagent | T3 primer for dsRNA targeting npp-7 (nup153) Forward: AATTAACCCTCACTAAAGGGTTCCTGCCACAATTCCAGT | This Study | N/A | Used to generate dsRNA for RNAi knock down of npp-7/nup153 |
| Sequence-based reagent | T7 primer for dsRNA targeting npp-7 (nup153) Reverse: TAATACGACTCACTATAGGCTTGTAGACGATGCAGCACC | This Study | N/A | Used to generate dsRNA for RNAi knock down of npp-7/nup153 |
| Sequence-based reagent | T3 primer for dsRNA targeting npp-19 (nup53) Forward: AATTAACCCTCACTAAAGGCACCACCTCTTCGATCTCTTC | This Study | N/A | Used to generate dsRNA for RNAi knock down of npp-19/nup53 |
| Sequence-based reagent | T7 primer for dsRNA targeting npp-19 (nup53) Reverse: TAATACGACTCACTATAGGTTTGTGCACTGAACGACTCC | This Study | N/A | Used to generate dsRNA for RNAi knock down of npp-19/nup53 |
| Sequence-based reagent | T7 primer for dsRNA targeting npp-8 (nup155) Forward: TAATACGACTCACTATAGGGATTTGGCGTTTTTCGACTC | This Study | N/A | Used to generate dsRNA for RNAi knock down of npp-8/nup155 |
| Sequence-based reagent | T7 primer for dsRNA targeting npp-8 (nup155) Reverse: TAATACGACTCACTATAGGCACGAAATCAAAGACCGGAT | This Study | N/A | Used to generate dsRNA for RNAi knock down of npp-8/nup155 |
| Sequence-based reagent | T7 primer for dsRNA targeting npp-10 (nup96/98) Forward: TAATACGACTCACTATAGGAGTTCATTGTTCGGTGGAGG | This Study | N/A | Used to generate dsRNA for RNAi knock down of npp-10/nup96/98 |
| Sequence-based reagent | T7 primer for dsRNA targeting npp-10 (nup96/98) Reverse: TAATACGACTCACTATAGGATTGGAACCAAAAATGCTGC | This Study | N/A | Used to generate dsRNA for RNAi knock down of npp-10/nup96/98 |
| Sequence-based reagent | npp-22/ndc1 (B0240.4) start of gene CRISPR guide: AGTGAATTAGAGTTCCAAAC | This Study | N/A | Related to Figure 1—figure supplement 1A |
| Sequence-based reagent | npp-22/ndc1 (B0240.4) end of gene CRISPR guide: AGGAACACTCACGAACCATT | This Study | N/A | Related to Figure 1—figure supplement 1A |
| Sequence-based reagent | npp-22/ndc1 quantitative PCR (qPCR) primer forward: AGCTGTTTCCTTGCCTTGTG | This Study | N/A | Related to Figure 1—figure supplement 1B |
| Sequence-based reagent | npp-22/ndc1 qPCR primer reverse: TCTTGGCATCAGGAGAGCAT | This Study | N/A | Related to Figure 1—figure supplement 1B |
| Sequence-based reagent | pmp-3 (house-keeping gene) qPCR primer forward: GGTCATCGGTATTCGCTGAA | Chauve et al., 2021 | N/A | |
| Sequence-based reagent | pmp-3 (house-keeping gene) qPCR primer reverse: GAGGCTGTGTCAATGTCGTG | Chauve et al., 2021 | N/A | |
| Recombinant DNA reagent | Plasmid: PDD122, CRISPR-Cas9 | Hastie et al., 2019 | N/A | |
| Recombinant DNA reagent | Plasmid: pSB446; CRISPR npp-22/ndc1 guide inserted using gibson-assembly | This Study | N/A | Related to Figure 2—figure supplement 1A |
| Recombinant DNA reagent | Plasmid: pBS-LL-mNG | Hastie et al., 2019 | N/A | |
| Recombinant DNA reagent | Plasmid: pSB448; 1 kb homology arms of npp-22/ndc1 C-term inserted into pBS-LL-mNG using gibson-assembly | This Study | N/A | Related to Figure 2—figure supplement 1A |
| Recombinant DNA reagent | Plasmid: LL-mRuby | This Study | N/A | Related to Figure 2—figure supplement 1A |
| Recombinant DNA reagent | Plasmid: pSB603; 1 kb homology arms of npp-22/ndc1 C-term inserted into LL-mRuby using gibson-assembly | This Study | N/A | Related to Figure 2—figure supplement 1A |
| Software and algorithm | FIJI (ImageJ) | NIH | https://imagej.net/Fiji RRID: SCR_002285 | |
| Software and algorithm | IMOD Version 4.11 | University of Colorado | https://bio3d.colorado.edu/imod/ | |
| Software and algorithm | GraphPad Prism 8/9 | GraphPad | N/A | |
| Software and algorithm | R Studio Version 1.2.5033 | R Studio, INC | https://www.rstudio.com | |
| Software and algorithm | MATLAB | MathWorks, INC | https://www.mathworks.com/products/matlab.html | |
| Software and algorithm | CytoShow | CytoShow | http://www.cytoshow.org/ |
Additional files
-
Transparent reporting form
- https://cdn.elifesciences.org/articles/75513/elife-75513-transrepform1-v1.pdf
-
Source code 1
Pronuclear tracker script.
- https://cdn.elifesciences.org/articles/75513/elife-75513-code1-v1.zip
-
Source code 2
Volume calculator script.
- https://cdn.elifesciences.org/articles/75513/elife-75513-code2-v1.zip
-
Source code 3
FRAP processing script.
- https://cdn.elifesciences.org/articles/75513/elife-75513-code3-v1.zip
Download links
A two-part list of links to download the article, or parts of the article, in various formats.
Downloads (link to download the article as PDF)
Open citations (links to open the citations from this article in various online reference manager services)
Cite this article (links to download the citations from this article in formats compatible with various reference manager tools)
Ndc1 drives nuclear pore complex assembly independent of membrane biogenesis to promote nuclear formation and growth
eLife 11:e75513.
https://doi.org/10.7554/eLife.75513


