A dynamic clamp protocol to artificially modify cell capacitance
- Institute for Theoretical Biology, Humboldt-Universität zu Berlin, Germany
- Bernstein Center for Computational Neuroscience, Humboldt-Universität zu Berlin, Germany
- Institute for Integrative Neuroanatomy, Charité - Universitätsmedizin Berlin, Corporate Member of Freie Universität Berlin, Humboldt-Universität zu Berlin, and Berlin Institute of Health, Germany
- Einstein Center for Neurosciences Berlin, Charité - Universitätsmedizin Berlin, Corporate Member of Freie Universität Berlin, Humboldt-Universität zu Berlin, and Berlin Institute of Health, Germany
Figures
Figure 1 with 1 supplement
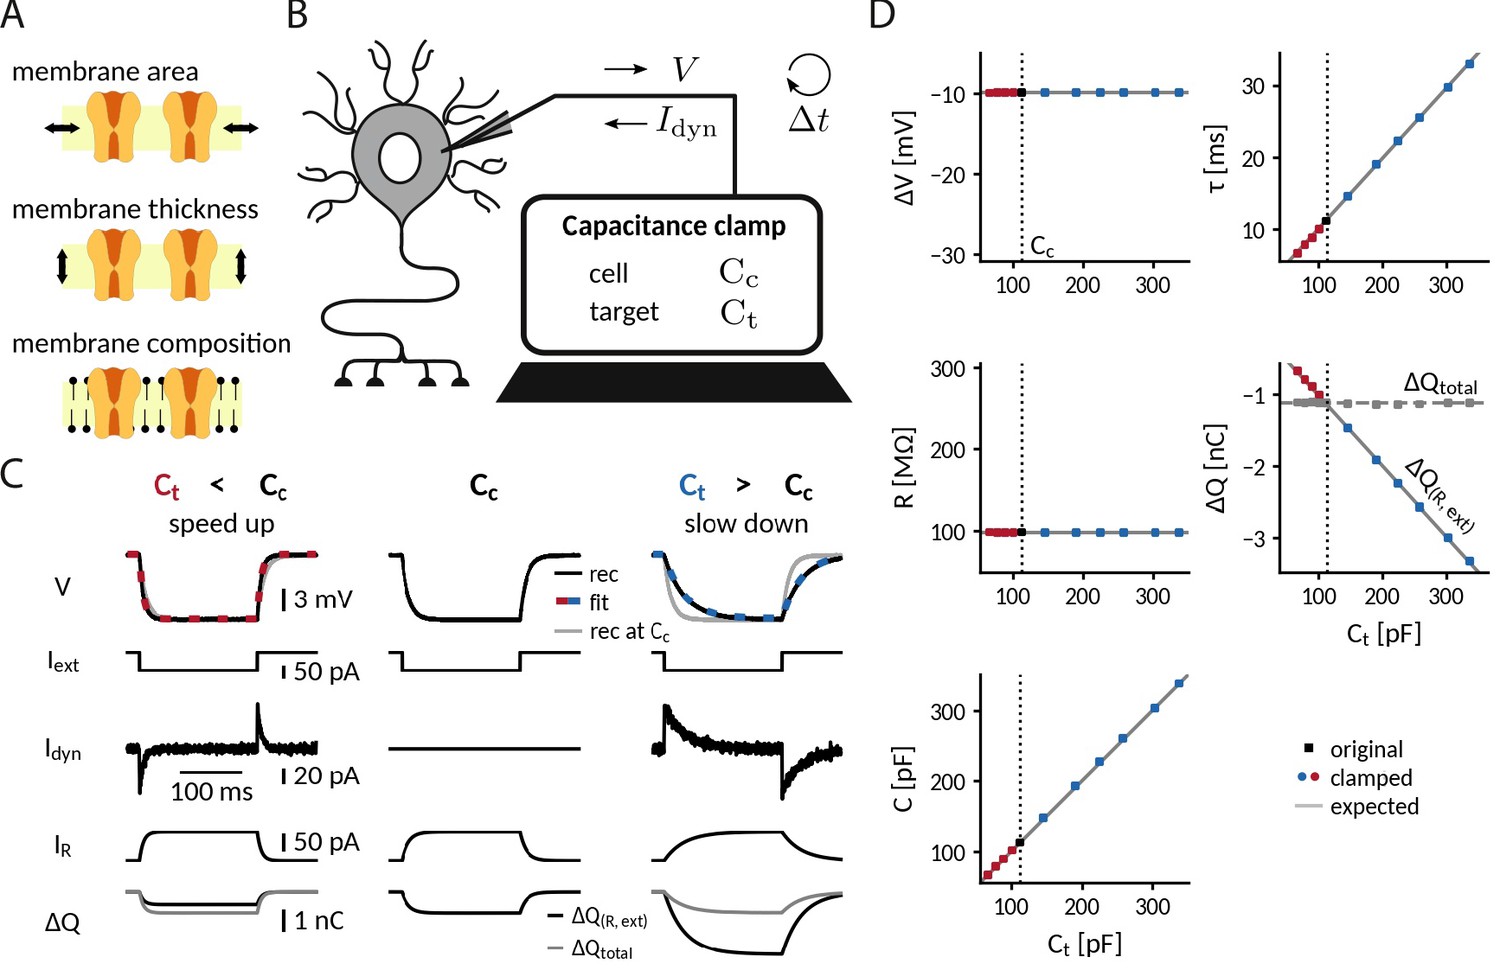
Adding or removing artificial capacitance via the CapClamp.
(A) Physically, membrane capacitance varies with surface area, thickness and lipid composition (B) Virtual capacitance modification via the CapClamp is a form of dynamic clamp, a fast feedback loop between intracellular voltage sampling and computer-controlled current injection: given the measured cell capacitance , the target capacitance , recorded membrane potentials and the sampling interval , the computer calculates clamping currents required to mimic the desired change of capacitance (see Equation 1). (C) Clamping a hardware-implemented model cell (RC circuit) at a decreased (left) or increased (right) capacitance leads to faster respectively slower charging of the ‘membrane potential’ to the same steady-state voltage response (top row, black: recordings, dashed red and blue: exponential fits , gray: recording at original ) in response to a step current (2nd row) due to the clamping currents (3rd row). As a result, the current through the resistance (4th row) has a different profile and the apparently deposited charge (bottom row, black) by the ‘cellular’ transmembrane currents decreases, respectively, increases as expected for a capacitance change. The real deposited charge (bottom row, gray), taking into account the clamping currents, has the same steady-state amplitude in all three cases, because the physical capacitance did not change. (D) Measured time constant , voltage responses , resistance , deposited charge (apparent and total) and capacitance versus target capacitances.
Figure 1—figure supplement 1
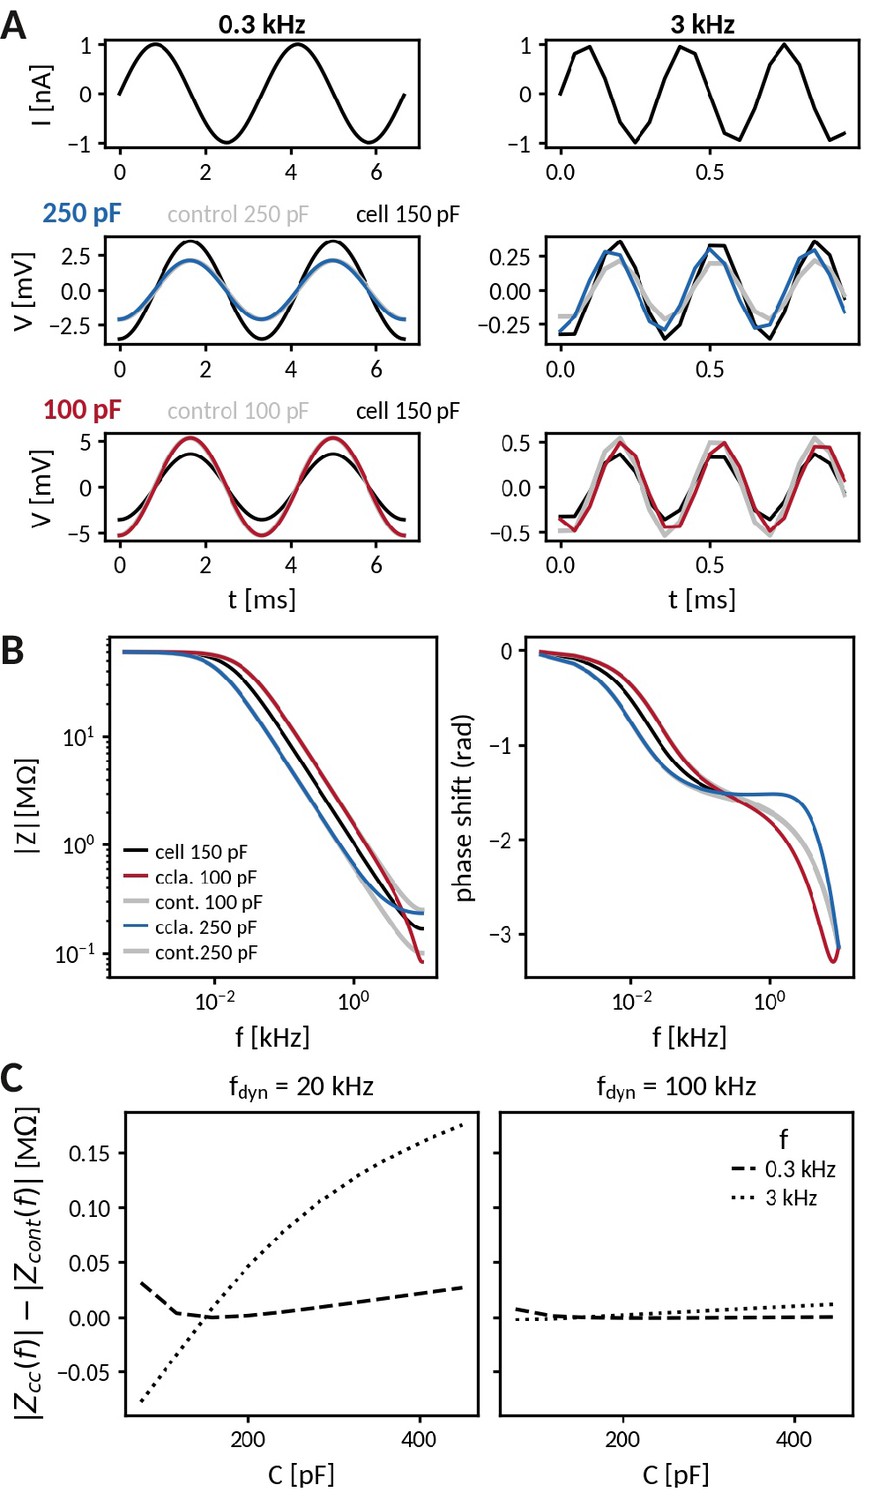
Impedance analysis of an RC circuit coupled to the capacitance clamp.
(A) Injection of an oscillating current at 300 Hz (left) and at 3 kHz (right) to a passive cell (RC-circuit) with voltage responses clamped at an increased (middle) and a decreased capacitance (bottom). Black lines indicate the response of the cell at the original capacitance and gray lines those of the corresponding control cells. (B) Comparison of frequency-dependent impedance and phase shift of a cell at the above capacitances (black: cell capacitance, blues: clamped, gray: control). (C) Difference of impedances at 300 Hz (dotted) and 3 kHz (dashed) for clamped and control cell across different capacitances and for dynamic clamp frequencies of 20 kHz (left) and 100 kHz (right).
Figure 2
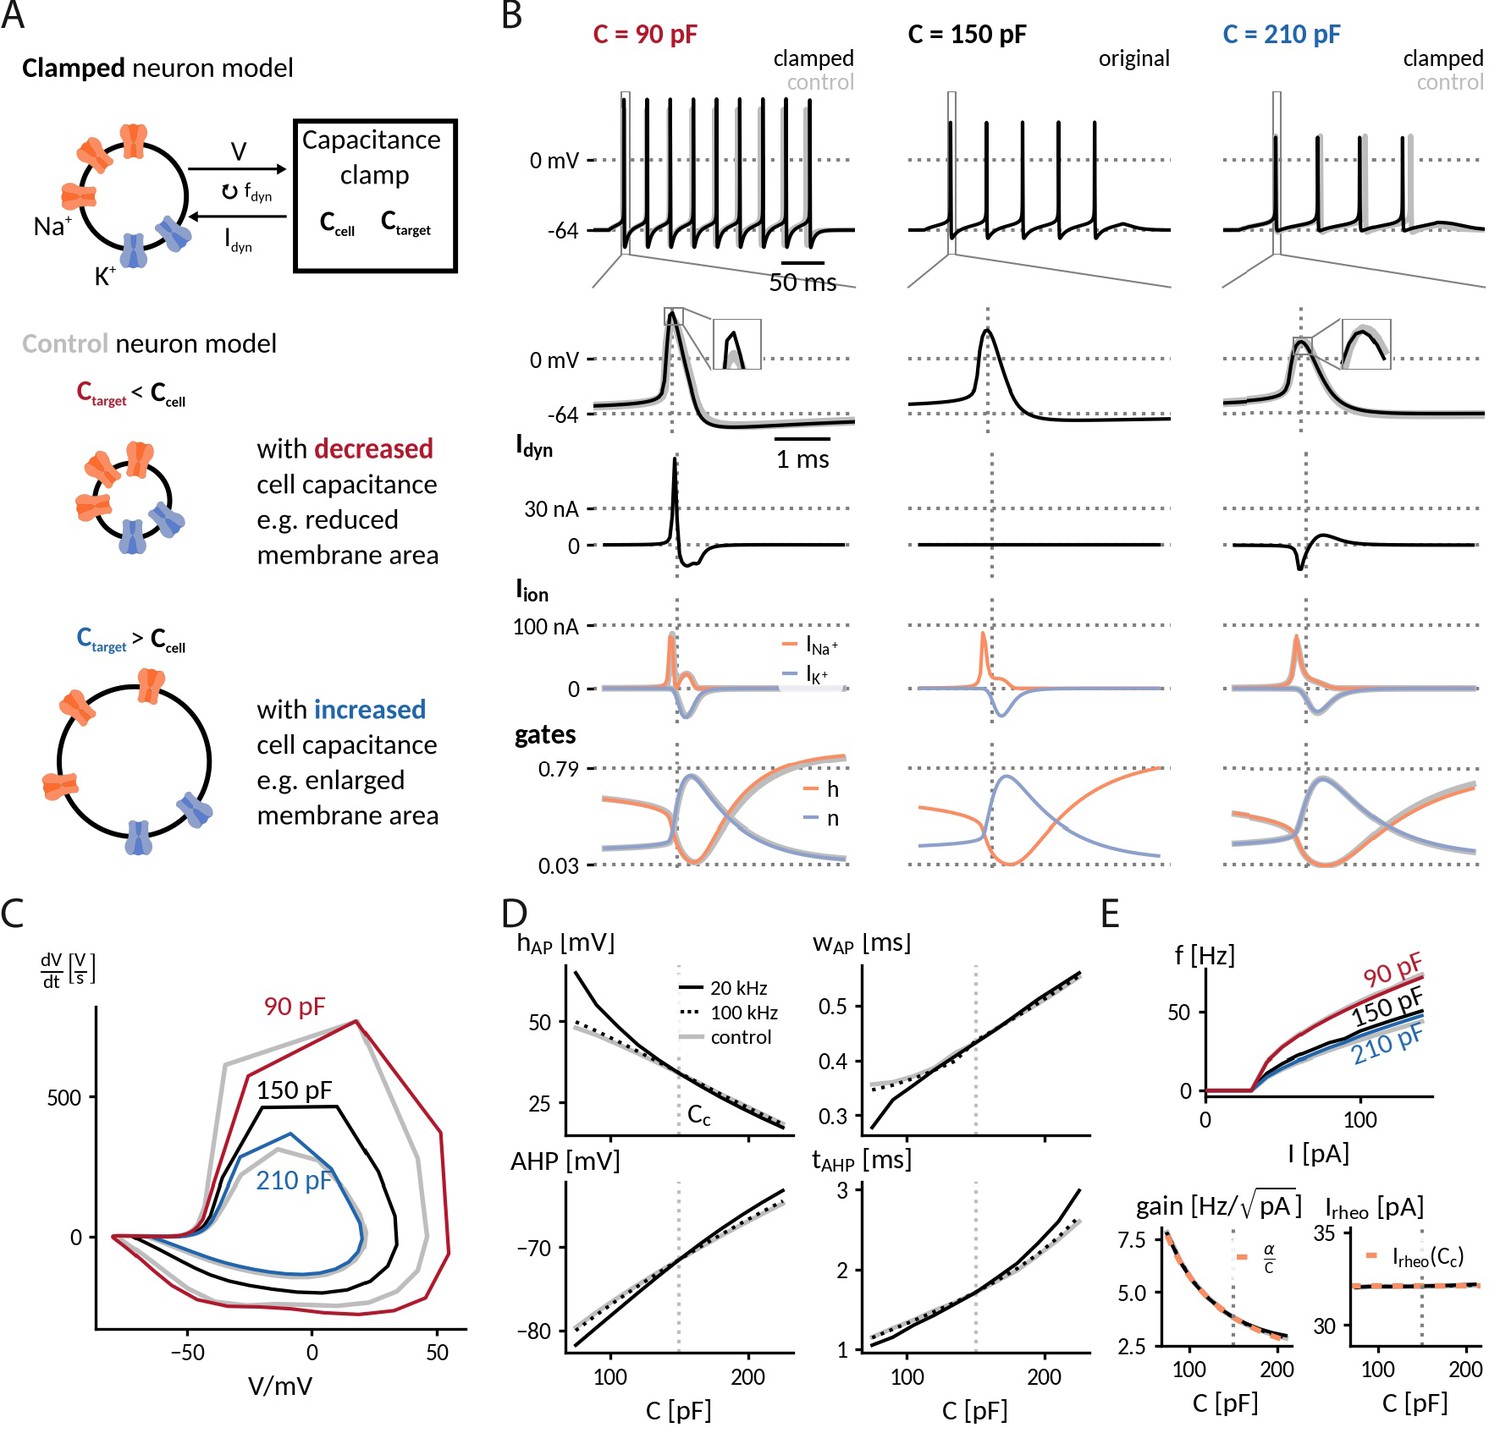
Simulation of the capacitance clamp in a conductance based neuron model.
(A) Neurons coupled to the CapClamp are compared with control neurons with an altered capacitance (depicted as a difference in membrane area). (B) Spiking at 0.6-fold decreased (90 pF), original (150 pF) and 1.4-fold increased capacitance (210 pF) with from top to bottom: spike shape, dynamic clamp current, ionic currents (Na+, K+) and gating states (h: sodium inactivation gate, n: potassium activation gate). Clamped and original traces in black or color, control in gray. All currents are shown with the sign they appear with in the current-balance equation (Equation 2). (C) Comparison of spike shapes in the V--plane (black: original, red and blue: clamped, gray: control). (D) Comparison of spike amplitude (top left), spike width (top right), after hyperpolarization amplitude (lower left) and timing (lower right) across different capacitances with two dynamic clamp frequencies (solid: 20 kHz, dotted: 100 kHz, gray:control). (E) Top: Comparison of f-I curves for capacitances in B. Bottom: Gain and rheobase current of the f-I curves across capacitances (solid: 20 kHz, dotted: 100 kHz, gray: control) compared with the theoretical predictions (orange, dashed) of a decreasing and a constant rheobase (see "Analytically expected effect of capacitance on the form of the f-I curve" in Methods).
Figure 3
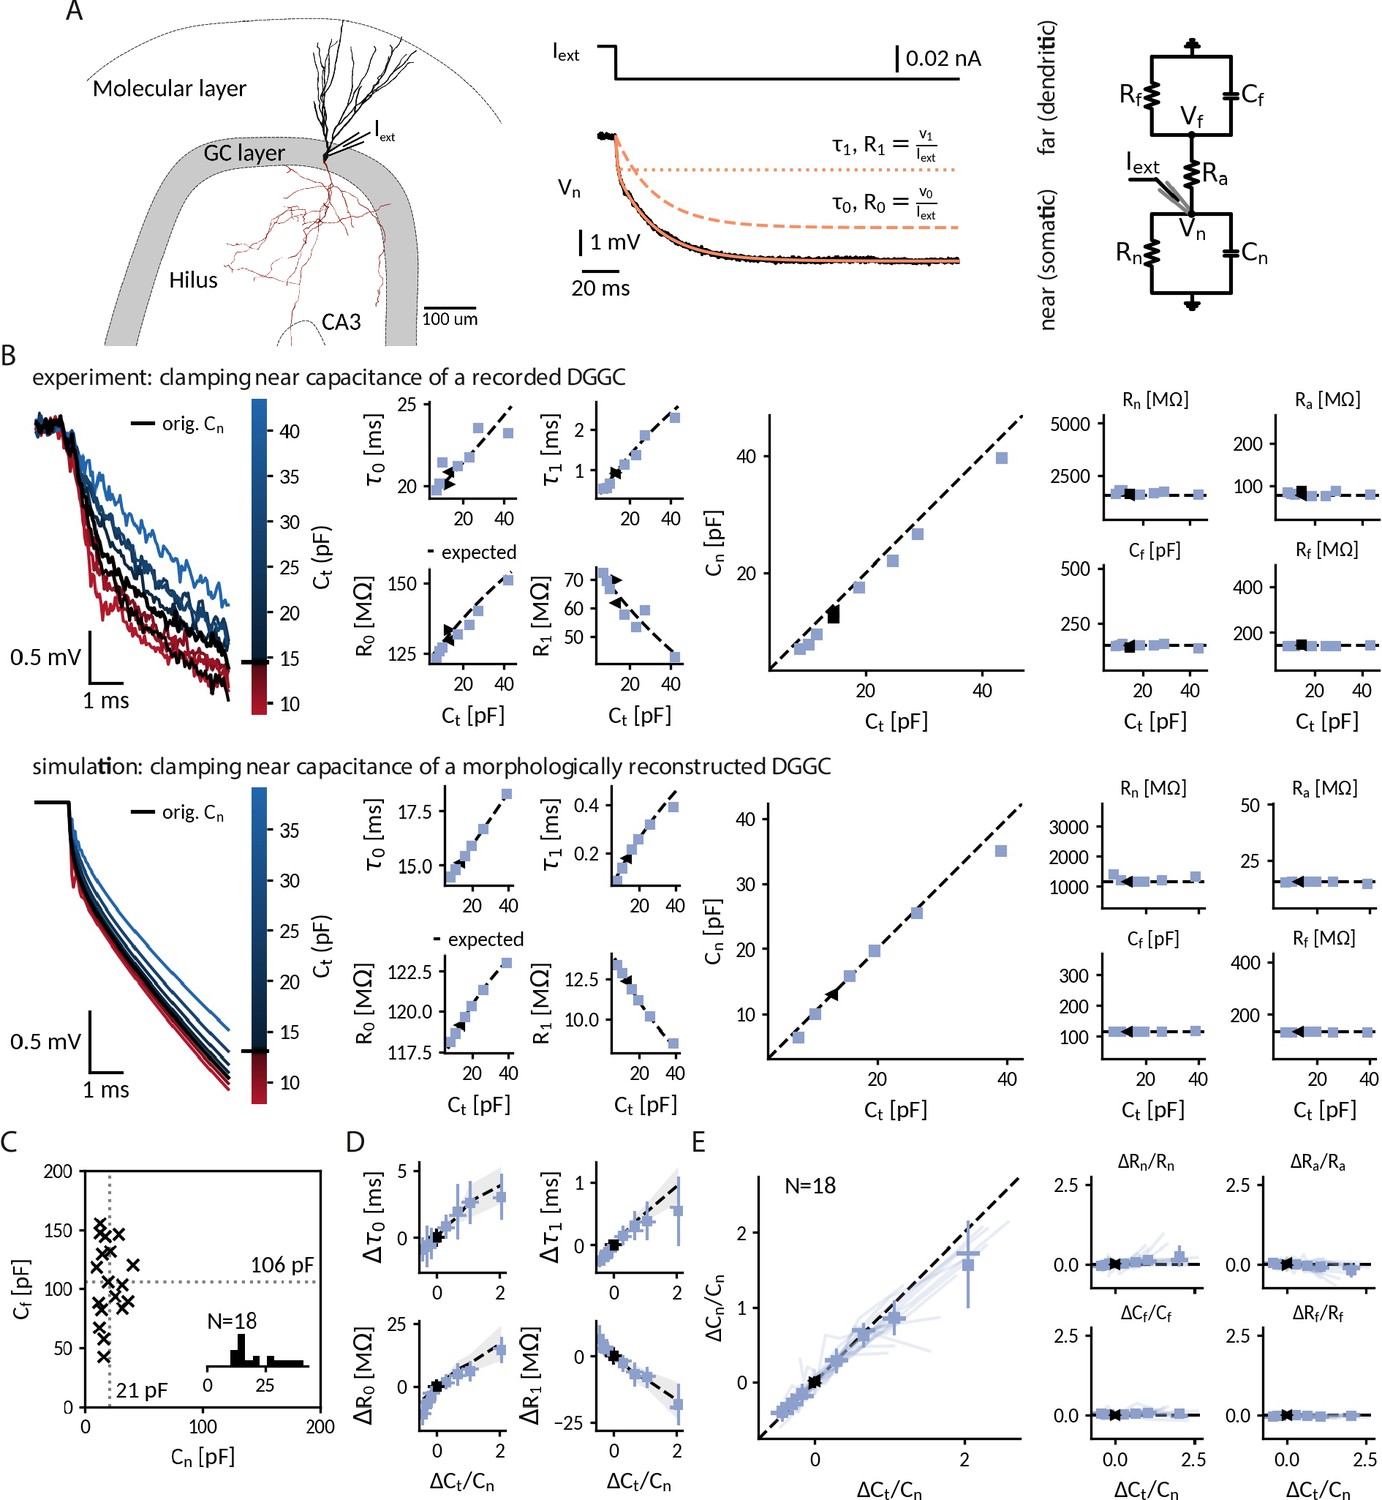
Clamping capacitance in rat dentate gyrus granule cells (DGGCs).
(A) Morphology of a DGGC (left) and response to a hyperpolarizing current injected at the soma, fit via a sum of exponential terms with a slow , v0 and a fast component , v1 (middle), which can be mapped to two resistively coupled RC-circuits (right) with a near (somatic) compartment and , resistive coupling and a far (dendritic) compartment and . (B) Left: Voltage responses of a recorded (top) and a simulated morphologically-reconstructed (bottom) DGGC to a current pulse (exp: –27 pA, sim: –50 pA) clamped at 0.6- to 3-fold the cell’s near capacitance (black: original near capacitance, color: target near capacitances). Middle: Slow and fast components versus target capacitance. Right: Circuit parameters versus target capacitance. ◀, ▶: before and after clamping, blue square: clamped, dashed line: expected values. (C) Measured near and far capacitances for 18 DGGCs (gray dotted: mean). Inset: histogram of near capacitances. (D) Changes of slow and fast components in all recorded cells versus relative targeted change of near capacitance (squares: mean, horizontal line: median, vertical line: std, shaded area: std of expected changes). (E) Relative changes of circuit parameters versus relative targeted change of near capacitance. Legend same as in D and individual cells shown with transparent blue lines.
Figure 4
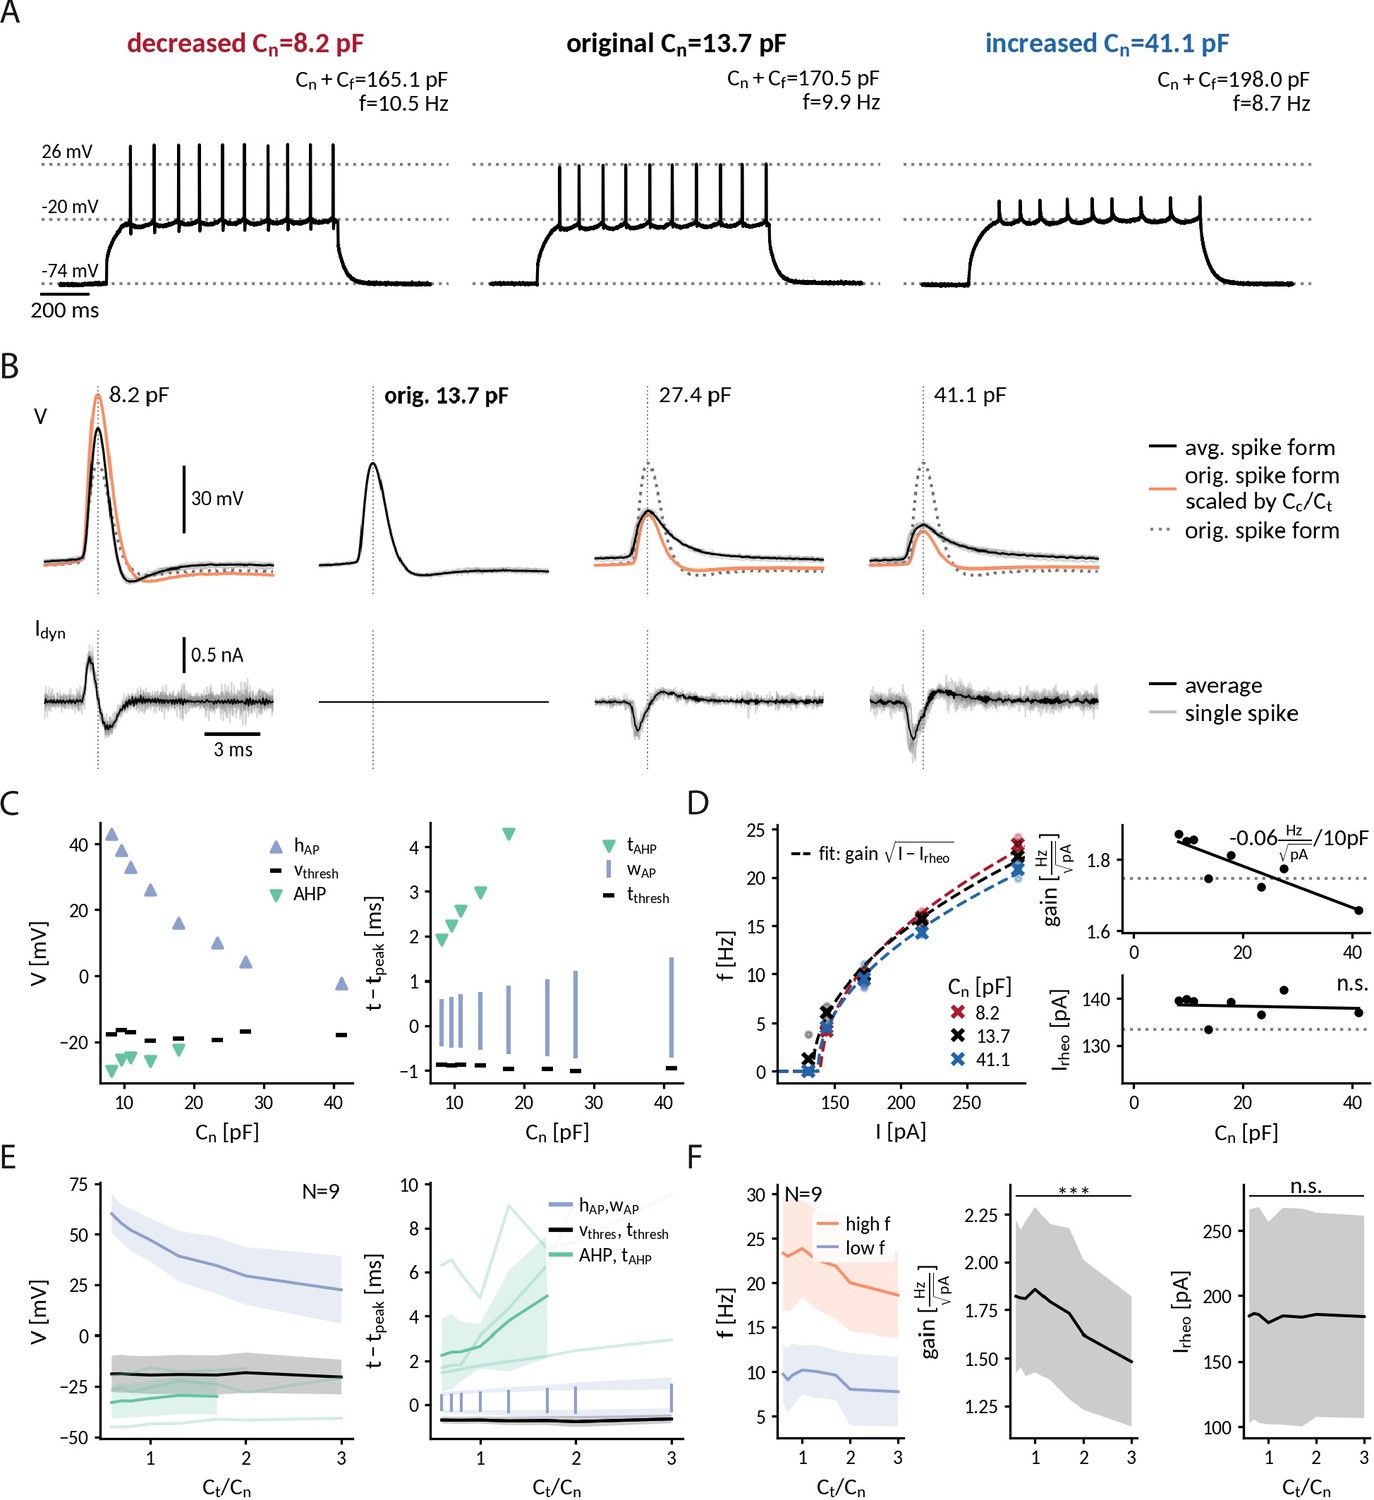
Repetitive spiking and action potential shapes in DGGCs clamped at different capacitances.
(A) Spiking at decreased 0.6-fold (left), original (middle) and increased 3-fold (right) near capacitance . (B) Spike shapes (top) and capacitance clamp currents (bottom) for increasing capacitances from 0.6 to 3-fold of the original near capacitance (black: mean, light gray: single spikes, orange: expected spike shape for unaltered intrinsic currents as described in protocol-2-analysis-of-f-i-curves-and-spike-shapesMethods, dotted: spike shape at original capacitance). (C) Comparison of spike shape (left) and temporal structure (right) across tested near capacitances. (D) Measured f-I curve at 0.6-, 1- and 3-fold near capacitance with fit (dashed lines). Extracted gain and rheobase for all tested near capacitances (dotted line: values at original capacitance 13.7 pF, solid line: linear regression with slope value reported if significantly different from zero p<0.1). (E) Effect of near capacitance changes on spike shape (left) and temporal structure (right) for all recorded DGGCs (solid: mean, shaded: std). To compare different cells, the capacitance is shown relative to the original near capacitance and spikes were compared at 1.2-fold of the cell’s rheobase. (F) Effect of near capacitance changes on firing frequency, low firing (blue) at 1.2 fold rheobase and high firing (red) at 2.0-fold rheobase (left), gain (middle) and rheobase (right) for all recorded DGGCs (solid: mean, shaded: std).
Figure 5
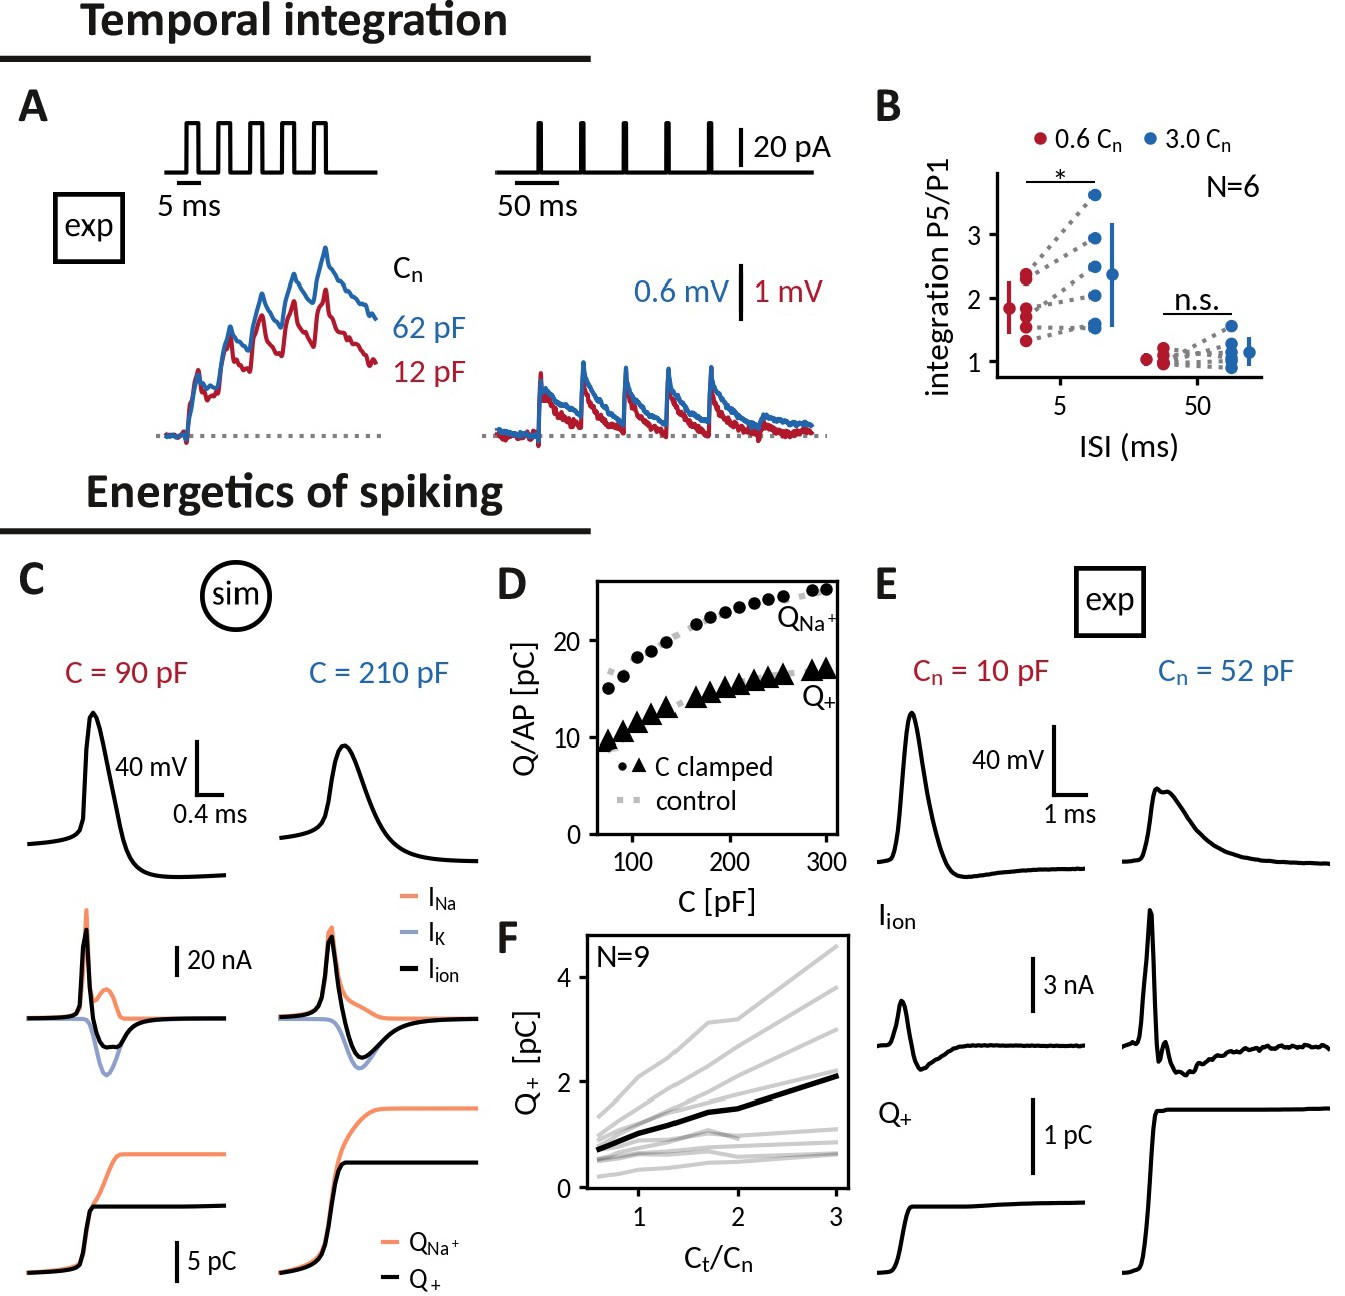
Applying the capacitance clamp to study neuronal signaling and physiology.
Temporal integration: (A) Brief current pulses of 3ms length with interstimulus intervals of 5ms and 50ms (top) and voltage responses of an exemplary DGGC at a decreased (12 pF) and an increased (62 pF) near capacitance (voltage scale adapted to first response height). (B) Ratio of fifth and first response as a measure of temporal integration for a 0.6-fold decreased capacitance in comparison to a threefold increased one at 5ms and 50ms ISI. Energetics of spiking: (C) Spike shape (top), sodium, potassium and total ionic current (middle, shown with the sign they appear with in the current-balance equation, see Equation 2) and deposited sodium as well as depolarizing charge (bottom) in the Wang-Buzsáki neuron model for a 90 pF and a 210 pF capacitance. (D) Sodium and depolarizing charge per action potential versus capacitance (dot and triangle: clamped from an original capacitance of 150 pF, gray: control). (E) Spike shape and depolarizing charge for a dentate gyrus granule cell clamped at decreased 10 pF and increased 52 pF near capacitance. (F) Deposited depolarizing charge versus relative change of near capacitance in recorded DGGCs (black: mean, gray: individual cells).
Appendix 1—figure 1

Analysis of the capacitance clamp as a discrete feedback filter.
(A) Block diagram of the coupled system: RC circuit with original capacitance Cc and capacitance clamp feedback current. (B) Block diagram of the target system: RC circuit with target capacitance Ct. (C) Pole-zero plot of the transfer functions at a decreased (left), the original and an increased capacitance. In addition to mimicking the pole of the target system, the clamped system has an additional pole and an additional zero. (D) Pole and zero position versus capacitance.
Tables
Table 1
Spike shape and firing frequency in a biophysical neuron model at 60 pA as well as f-I curve gain and local gain reduction for a decreased, the original and an increased capacitance, comparing simulations of an actually altered capacitance with the CapClamp.
Values are shown as actual(clamped).
| C (pF) | f (Hz) | (mV) | (ms) | AHP (mV) | Gain (Hz/) | ΔGain (Hz/ per 10 pF) |
|---|---|---|---|---|---|---|
| decreased 90 | 34.9 (34.3) | 45.7 (55.0) | 0.30 (0.30) | –77.8 (-79.7) | 6.5 (6.5) | –0.67 (-0.67) |
| original 150 | 22.1 | 33.9 | 0.39 | –71.5 | 3.8 | –0.22 |
| increased 210 | 17.8 (18.9) | 21.4 (20.1) | 0.48 (0.48) | –66.0 (-64.7) | 2.9 (2.9) | –0.11 (-0.10) |
Key resources table
| Reagent type (species) or resource | Designation | Source or reference | Identifiers | Additional information |
|---|---|---|---|---|
| Strain, strain background (Rattus norvegicus, male and female) | Wistar Rat (wild type) | Wistar Institute of Philadelphia, Pennsylvania | ||
| Peptide, recombinant protein | Avidin conjugated AlexaFluor-647 | Thermo Fisher Scientific | RRID:AB_2336066 | |
| Software, algorithm | Fiji distribution of ImageJ software | imagej.net | RRID:SCR_003070 | |
| Software, algorithm | Neutube | neutracing.com | https://doi.org/10.1523/ENEURO.0049-14.2014 | |
| Software, algorithm | RELACS | relacs. sourceforge.net | RRID:SCR_017280 | |
| Software, algorithm | RELACS CapClamp | This paper | https://doi.org/10.5281/zenodo.6322768 | Capacitance clamp code for RELACS, see "Data and software availability" in Appendix 1 |
| Software, algorithm | RTXI | rtxi.org | https://doi.org/10.1371/journal.pcbi.1005430 | |
| Software, algorithm | RTXI CapClamp | This paper | https://doi.org/10.5281/zenodo.5553946 | Capacitance clamp code for RTXI, see "Data and software availability" in Appendix 1 |
| Software, algorithm | Brian 2 | brian-team/ brian2 | https://doi.org/10.7554/eLife.47314 |
Table 2
Multi-exponential fit and corresponding circuit parameters in the recorded dentate gyrus granule cells (N = 18) and a multicompartment model based on a reconstructed DGGC morphology (see "Multicompartment model of a dentate gyrus granule cell" in Methods).
| DGGCs (mean ± std) | Multicomp. model | |
|---|---|---|
| Exp. fit | ||
| 15.1±4.8 ms | 15.1 ms | |
| R0 | 127.1±44.6 MΩ | 119.2 MΩ |
| 0.77±0.24 ms | 0.18 ms | |
| R1 | 34.5±14.7 MΩ | 12.3 MΩ |
| Circuit | ||
| 21.0±9.4 pF | 13.0 pF | |
| 854.2±394.0 MΩ | 1158.0 MΩ | |
| 52.5±19.8 MΩ | 15.5 MΩ | |
| 105.8±33.0 pF | 113.7 pF | |
| 155.5±59.9 MΩ | 132.8 MΩ |
Appendix 1—table 1
Comparison of online and offline fits to charging curves in the recorded dentate gyrus granule cells (N = 18).
| Online fit (mean ± std) | Offline fit (mean ± std) | |
|---|---|---|
| Two comp. | ||
| 14.9±4.8 ms | 15.1±4.8 ms | |
| R0 | 136.9±47.5 MΩ | 127.1±44.6 MΩ |
| 0.41±0.23 ms | 0.77±0.24 ms | |
| R1 | 25.1±14.1 MΩ | 34.5±14.7 MΩ |
| Circuit | ||
| 14.9±4.7 pF | 21.0±9.4 pF | |
| 1106.3±519.3 MΩ | 854.2±394.0 MΩ | |
| 34.9±19.9 MΩ | 52.5±19.8 MΩ | |
| 99.1±33.7 pF | 105.8±33.0 pF | |
| 159.6±58.1 MΩ | 155.5±59.9 MΩ |
Additional files
Download links
A two-part list of links to download the article, or parts of the article, in various formats.
Downloads (link to download the article as PDF)
Open citations (links to open the citations from this article in various online reference manager services)
Cite this article (links to download the citations from this article in formats compatible with various reference manager tools)
A dynamic clamp protocol to artificially modify cell capacitance
eLife 11:e75517.
https://doi.org/10.7554/eLife.75517


