Structure-activity relationships of mitochondria-targeted tetrapeptide pharmacological compounds
- Department of Molecular and Cell Biology, University of Connecticut, United States
- Social Profit Network, United States
- Department of Biology, York College of CUNY, United States
Figures
Figure 1 with 3 supplements
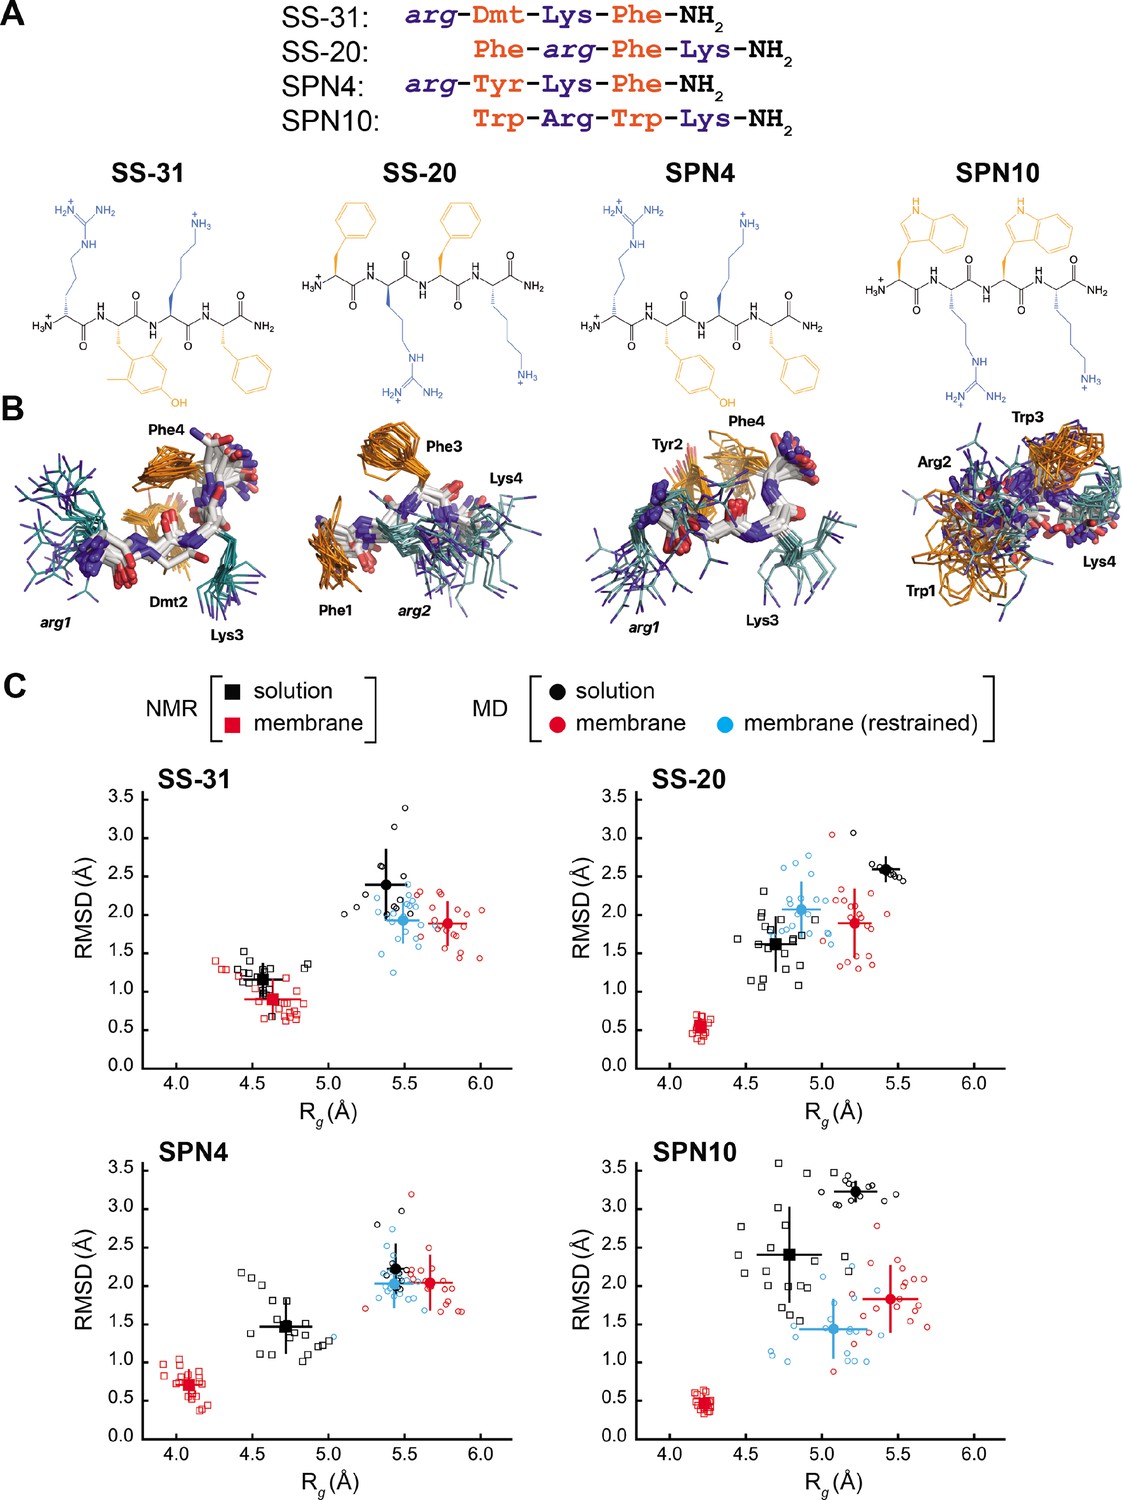
Peptide structures and membrane-driven peptide folding.
(A) Peptide sequences and chemical structures. Upper series: peptide sequences aligned with respect to basic and aromatic side chains; lower series: chemical structures of peptides. Basic and aromatic groups are shown in teal and orange, respectively. Three letter amino acid codes include those for L-amino acids (first letter capitalized, normal font) and D-amino acids (all lower case, italicized). (B) NMR structures of peptides in aqueous solution. The top 20 lowest-energy NMR conformers calculated from rotating frame nuclear Overhauser effect spectroscopy (ROESY) analysis. The main chain atoms are colored by type (carbon, white; oxygen, red; nitrogen, blue); basic and aromatic side chains are colored in teal and orange, respectively. (C) Comparison of peptide conformational variance in NMR and molecular dynamics (MD) simulation assemblies. Radius of gyration (Rg) and root mean square deviation (RMSD) to the average peptide structure calculated for NMR structures in solution (black squares) and in the presence of a membrane (red squares), and for MD simulations of peptides in solution (black circles), in the presence of a lipid bilayer conducted without (red circles), and with (cyan circles) nuclear Overhauser effect (NOE) restraints. Measurements of individual peptides (n=13 for MD solution datasets; n=20 for all other datasets) are shown as small symbols, with ensemble averages and error bars (SD) shown as larger symbols. Corresponding values for the Rg and RMSD measurements are in Supplementary file 4.
-
Figure 1—source data 1
NMR and MD radius of gyration (Rg) and root mean square deviation (RMSD) values.
- https://cdn.elifesciences.org/articles/75531/elife-75531-fig1-data1-v1.xlsx
Figure 1—figure supplement 1
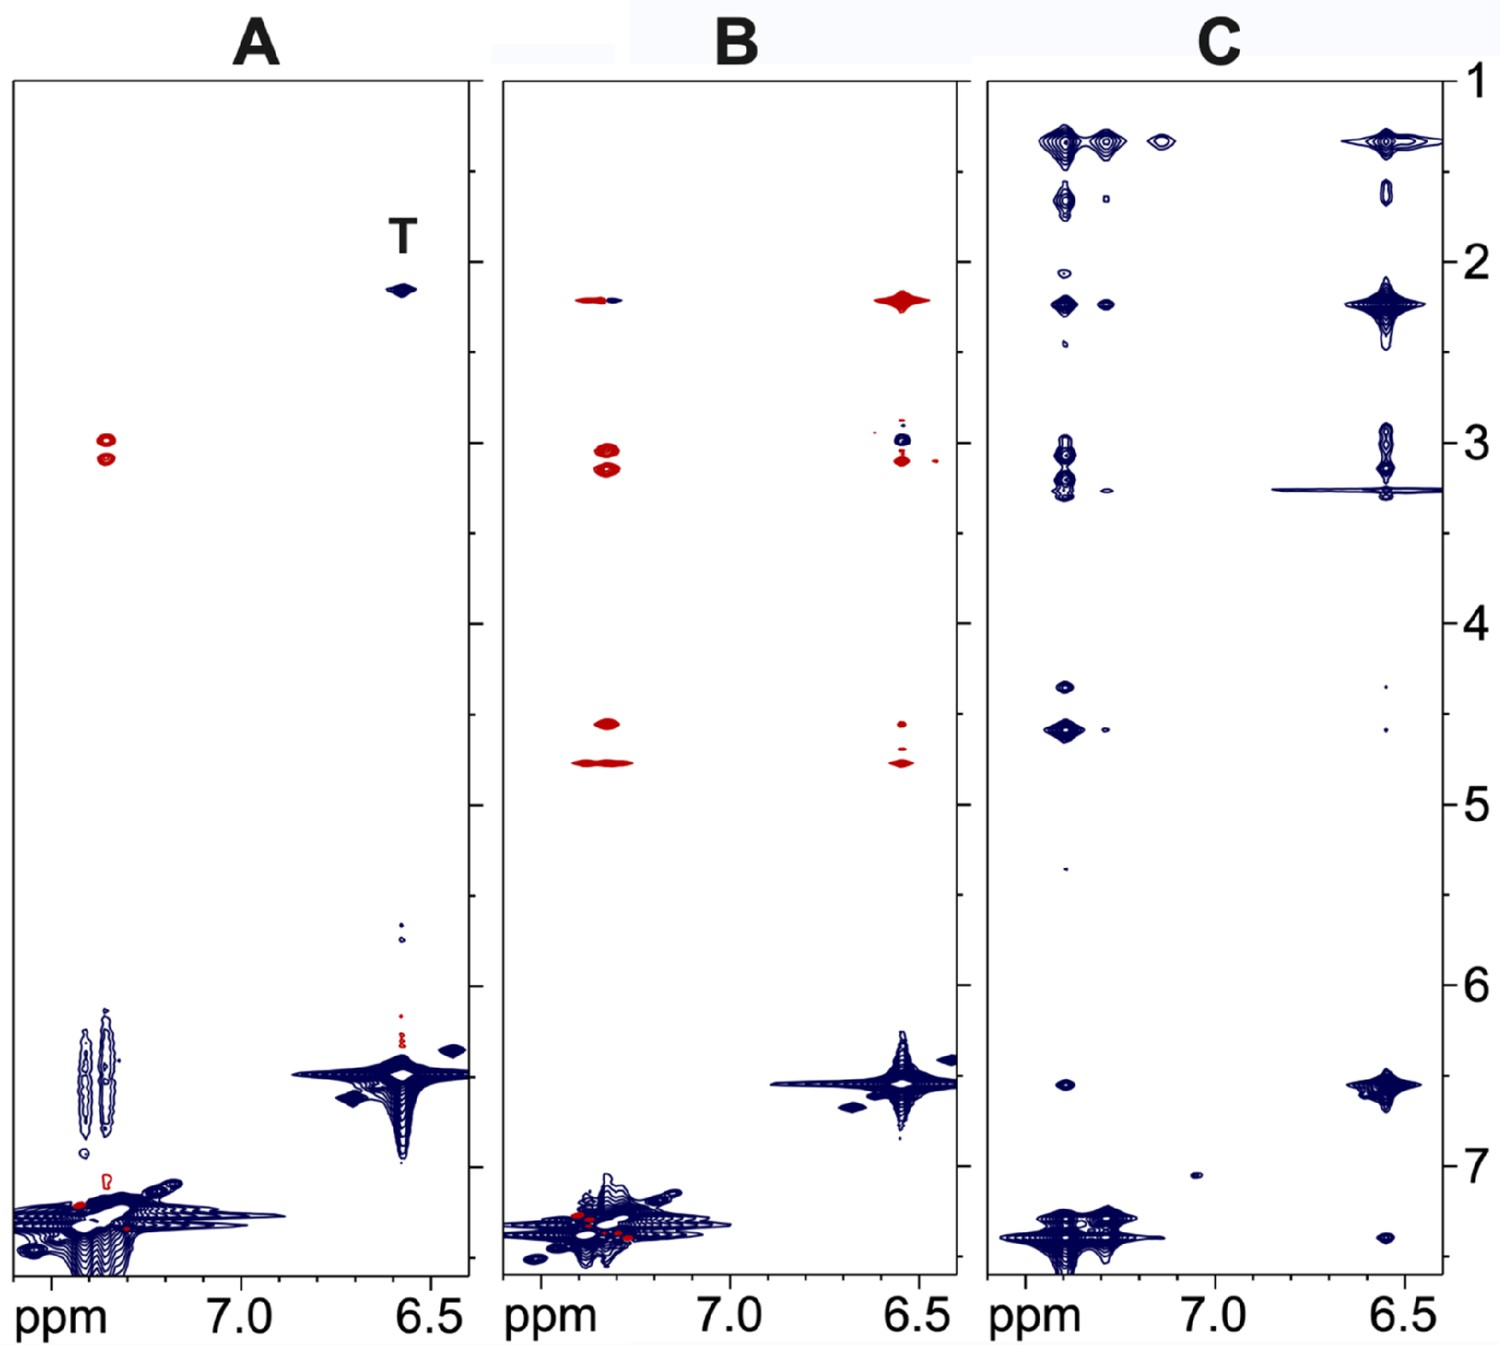
NMR cross-relaxation experiments for the SS-31 peptide.
(A) nuclear Overhauser effect spectroscopy (NOESY) of the free peptide at a 10 mM concentration. There are only a small number of positive nuclear Overhauser effects (NOEs) (red) due to the small size of the peptide. The peak marked ‘T’ is a total correlation spectroscopy (TOCSY) artifact due to coupling of the δ methyl protons and ε aromatic protons of the 2,6-dimethyl tyrosine residue at position 2. (B) ROESY data for the free peptide at a 10 mM concentration showing positive crosspeaks. (C) trNOESY of the bicelle-bound peptide at a 0.75 mM peptide concentration, showing a large number of strong negative transferred NOEs (trNOEs) (blue) that are transferred from the large molecular weight (MW) peptide-bicelle complex to the free peptide.
Figure 1—figure supplement 2
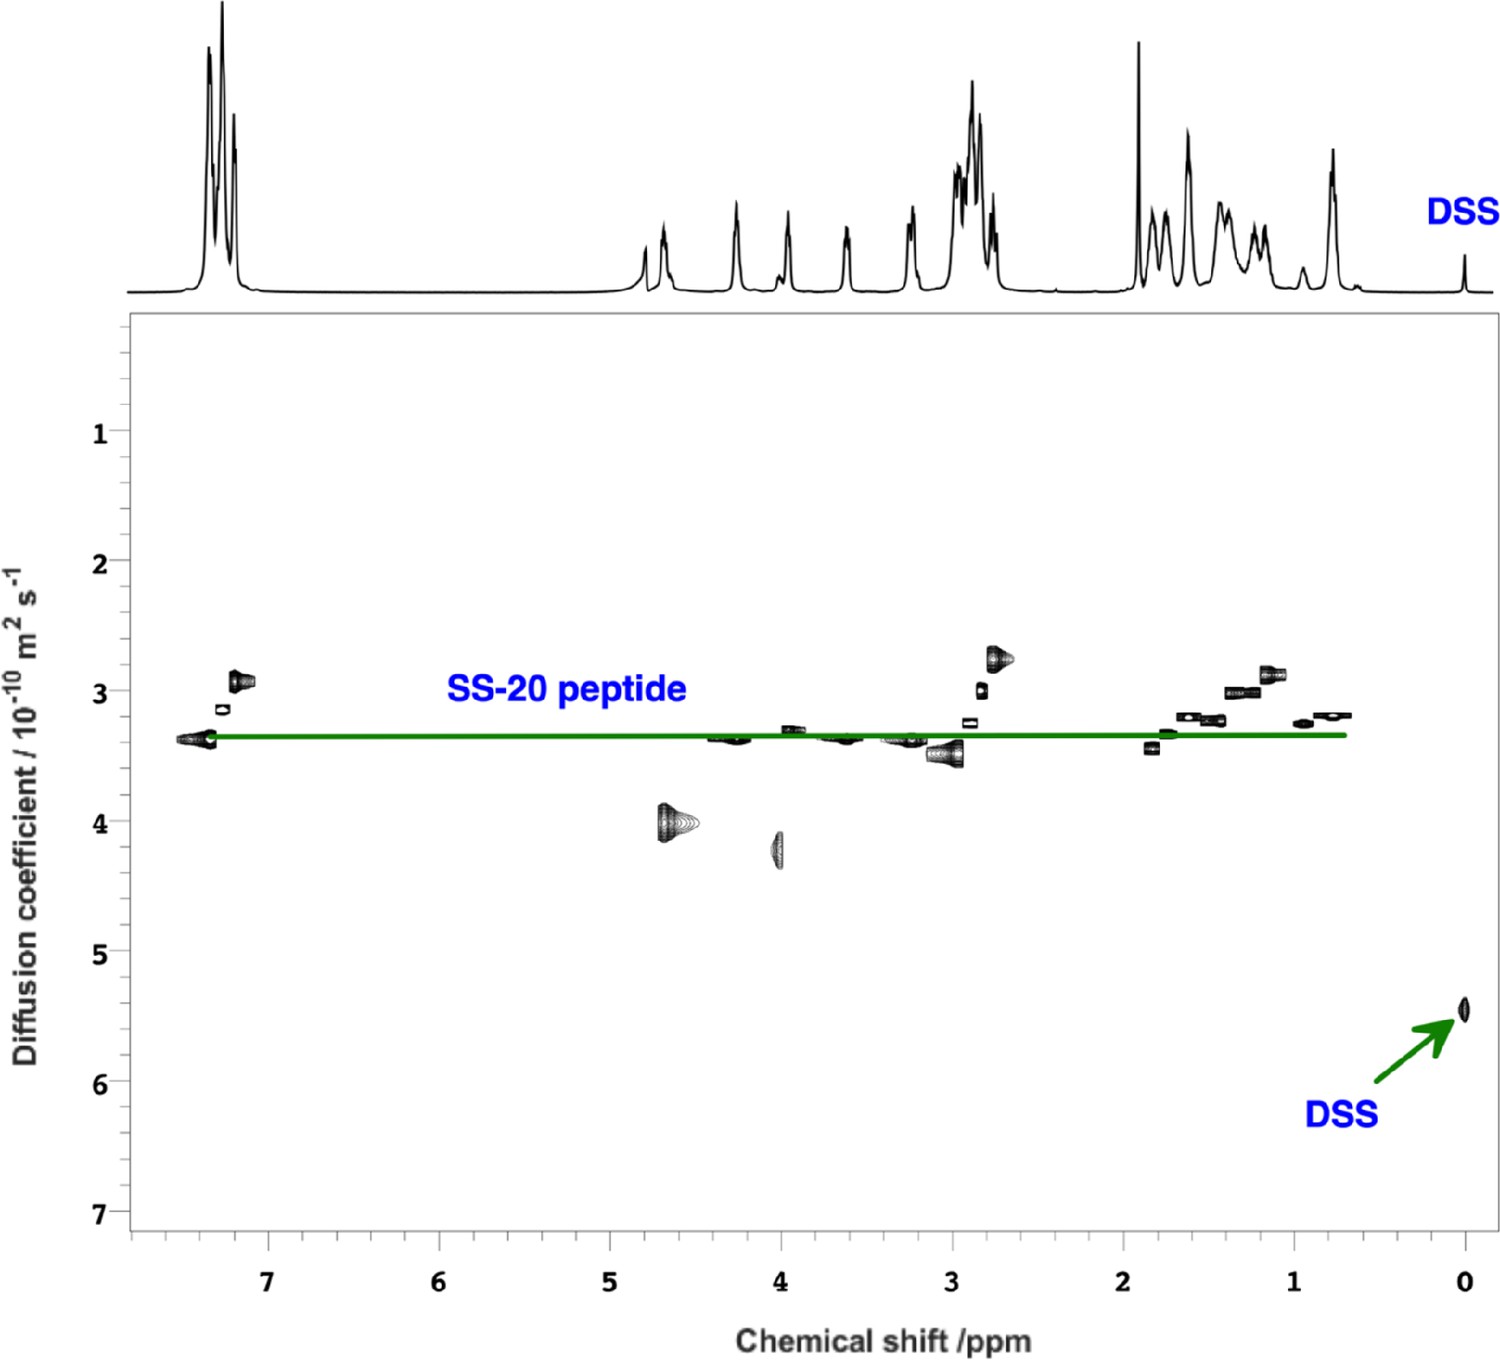
NMR pulse field gradient (PFG)-diffusion data showing the SS-20 peptide is a monomer.
2D-diffusion-ordered spectroscopy (DOSY) spectrum of SS-20 in solution obtained using PFG-NMR experiments using 2,2-Dimethyl-2-silapentane-5-sulfonic acid (DSS) as a standard. The diffusion coefficients, D, were (3.4±0.4) and (5.4±0.1) × 10–10 m2/s for the SS-20 peptide and the diffusion standard DSS, respectively. The radius of hydration for the SS-20 peptide was calculated as Rh,SS-20 = (DDSS/DSS-20)*Rh,DSS = 5.31±0.64, using a value of 3.34 Å for the Rh,DSS of the reference standard. As a further test, we did a 1:100 dilution of the SS-peptide from 10 mM to 0.1 mM and also obtained a similar Rh,SS-20 of 5.7±0.7 Å (not shown). From literature peptide calibration studies (ref. 32), the expected Rh values are 4.9 Å for a four-residue peptide and 7.2 Å for a peptide twice as large (eight residues). Thus the diffusion data are consistent with SS-20 being a monomer in solution, although we cannot exclude peptide association on membranes since our transferred nuclear Overhauser effect (trNOE) data is obtained indirectly from the dissociated monomers in dynamic equilibrium with the membrane bound peptides.
Figure 1—figure supplement 3
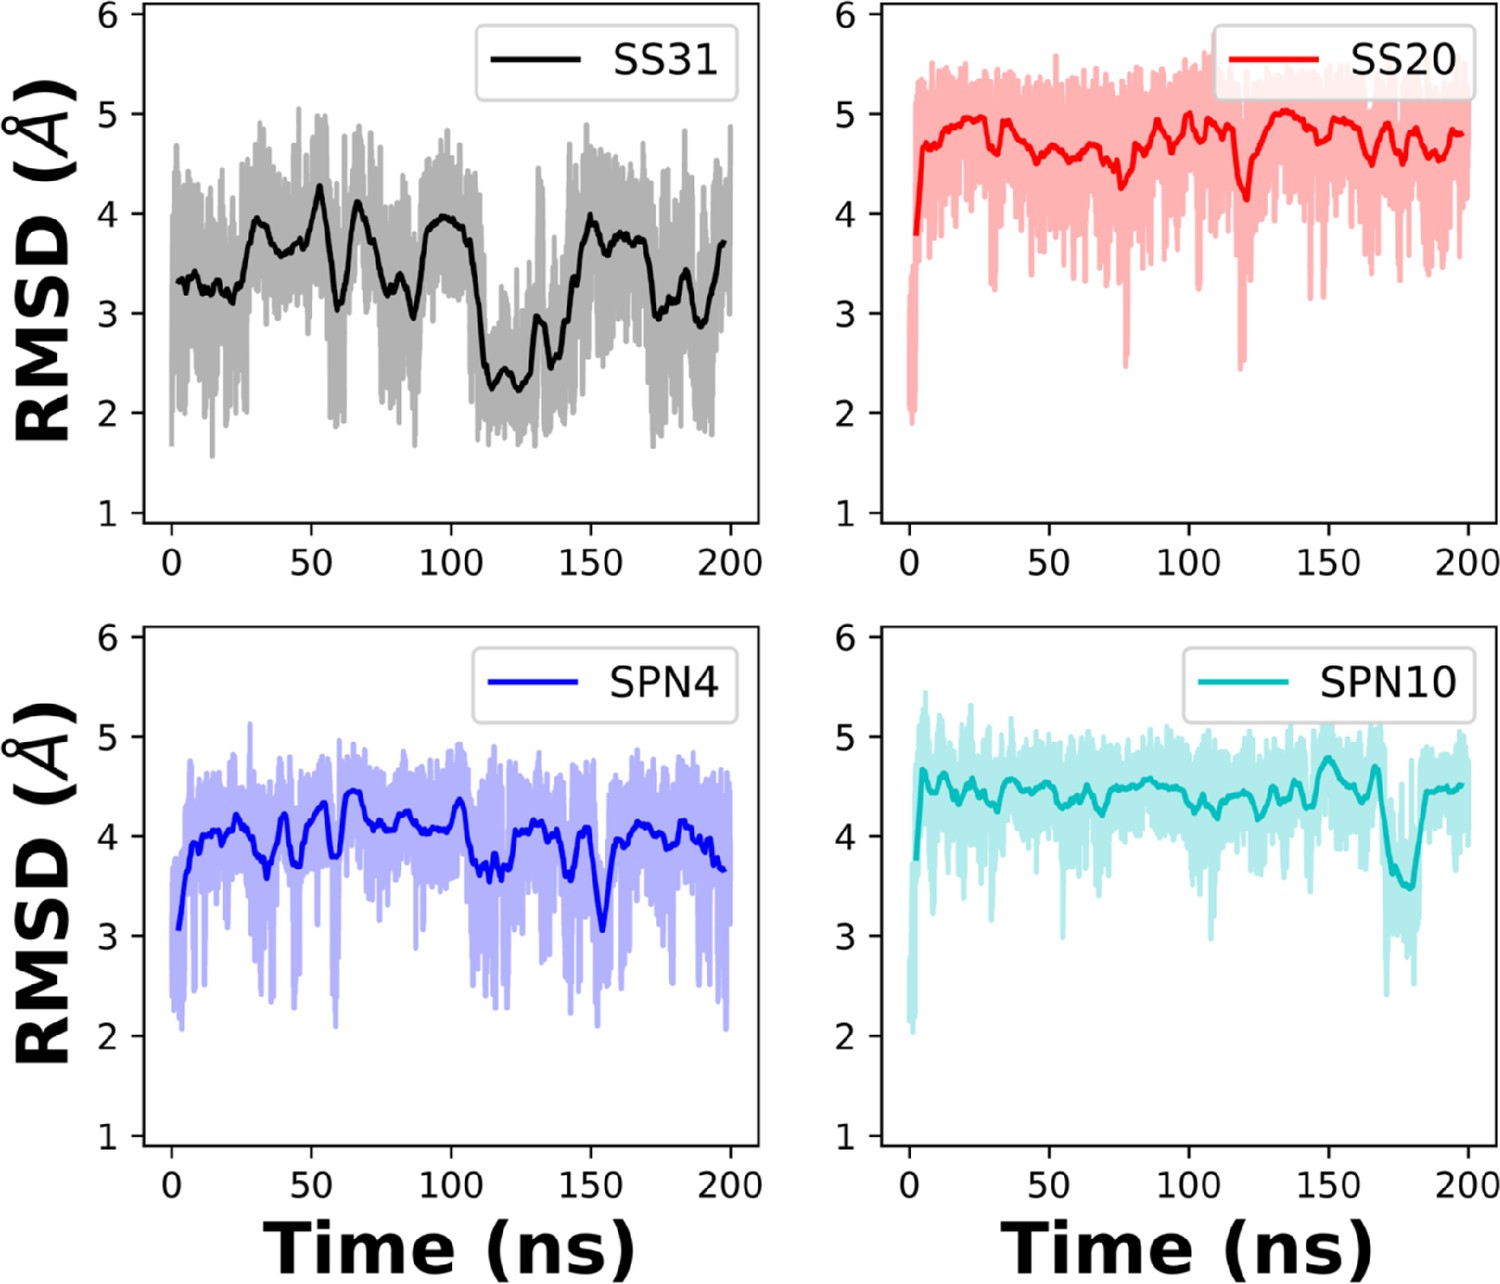
Root mean square deviation (RMSD) of peptides in solution from MD trajectories.
Comparison of the RMSD of each peptide analog in solution over the 200 ns simulation time. The NMR structures in solution were used as initial structures.
Figure 2 with 1 supplement
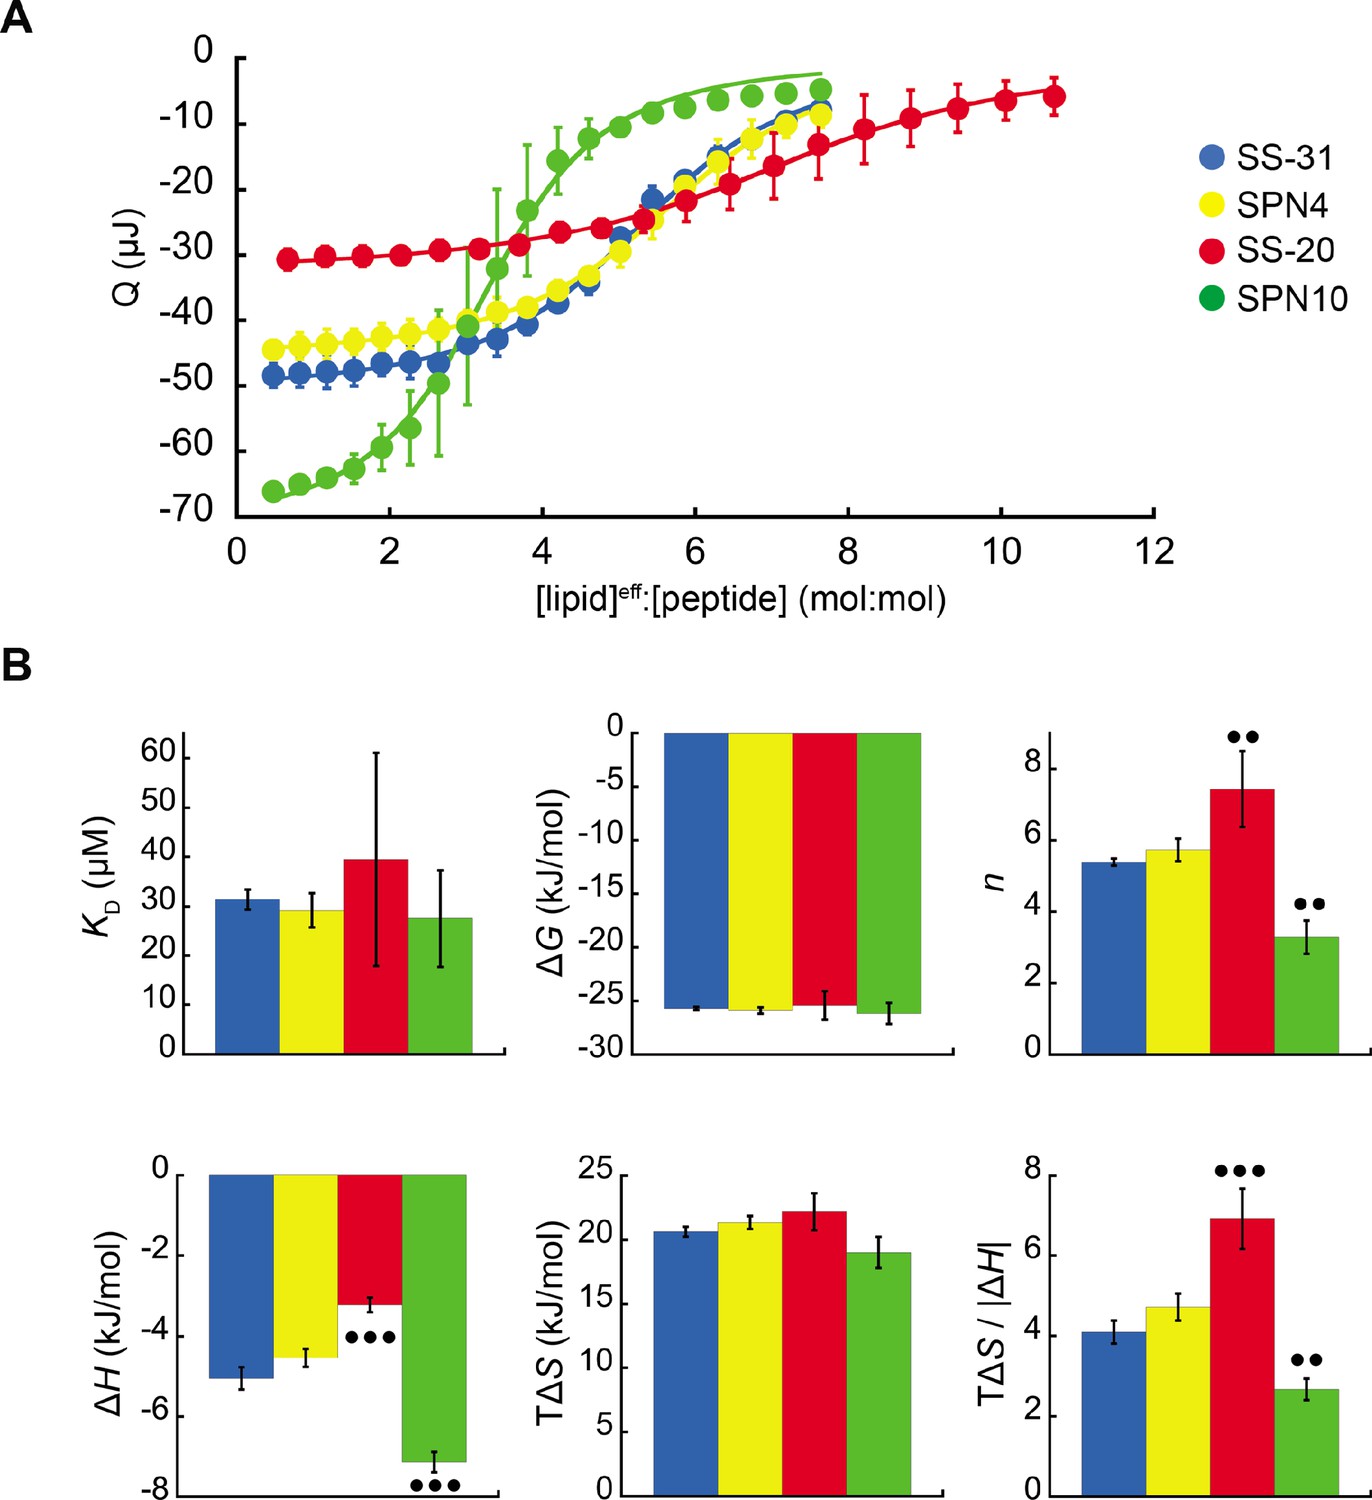
Microcalorimetry of peptide binding to large unilamellar vesicles (LUVs).
(A) Equilibrium binding isotherms. Wiseman plots showing blank-corrected average integrated heats for lipid-into-peptide titrations as a function of [lipid]eff:[peptide] molar ratio using LUVs composed of an 80:20 molar ratio of phosphatidylcholine (POPC):tetraoleoyl cardiolipin (TOCL) with peptides color-coded as shown. Points represent means (n≥3 ± SD), and curve fits are to binding models of single, independent sites. (B) Comparison of binding parameters. Values of equilibrium binding parameters calculated from curve fits are shown for peptides color-coded as in panel A. Statistical comparisons represent one-way ANOVA with Tukey’s multiple comparison test (α=0.05), with differences representing a comparison to SS-31 (no symbol, p>0.05; •• p≤0.01; ••• p≤0.001).
-
Figure 2—source data 1
Isothermal titration calorimetry data and equilibrium binding parameters.
- https://cdn.elifesciences.org/articles/75531/elife-75531-fig2-data1-v1.xlsx
Figure 2—figure supplement 1
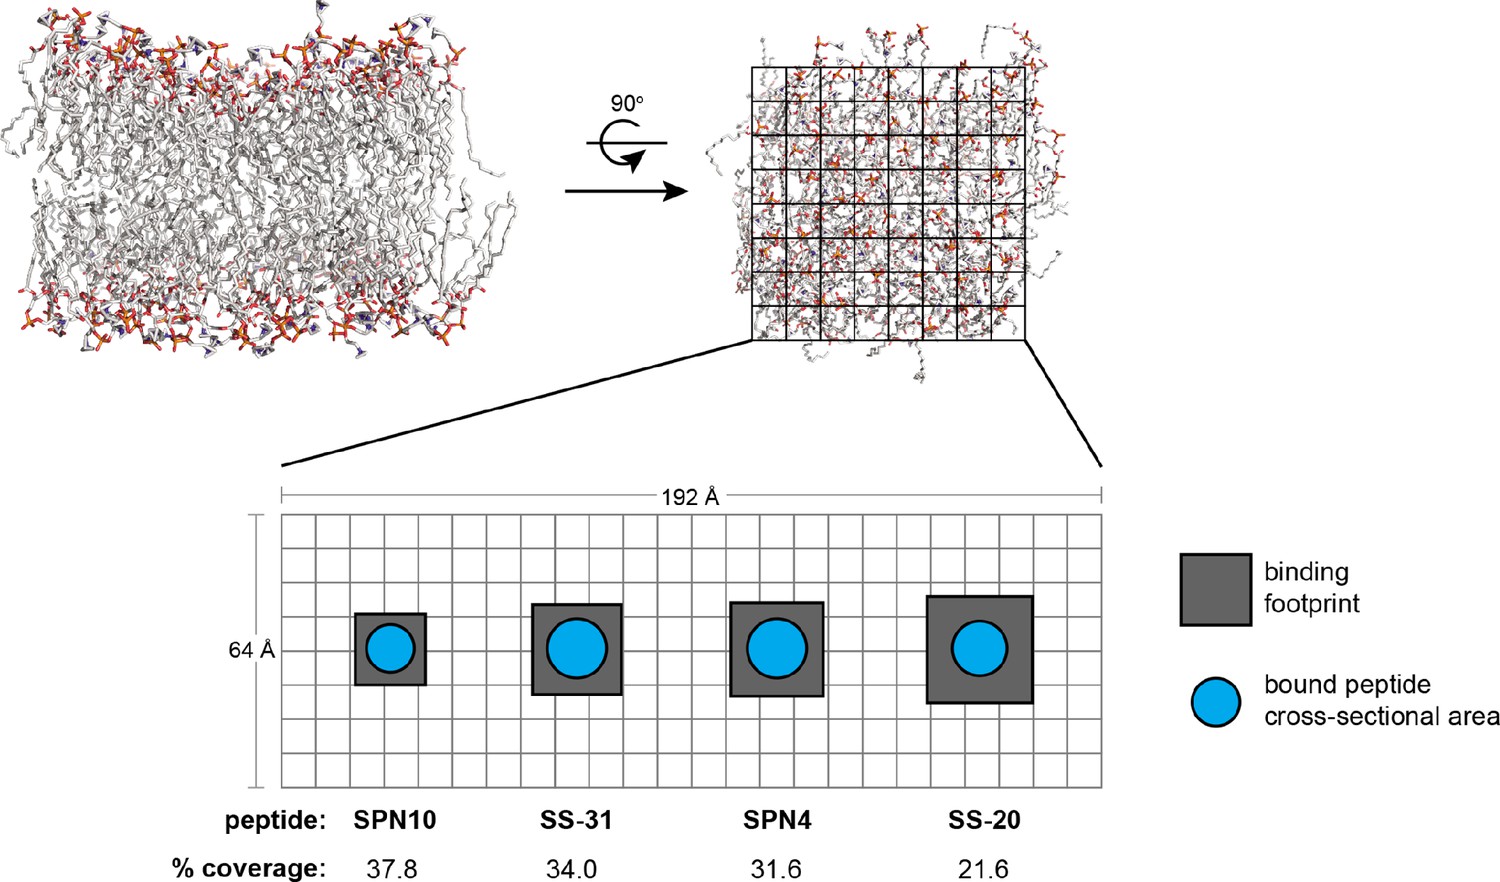
Peptide analog binding footprints and membrane area coverage.
Schematic depicting the total binding footprint (total membrane area occupied per peptide) and approximate physical cross-sectional area of bound peptide. Top-down view of model membrane is parsed in approximate 8Å × 8Å squares. The peptide-specific binding footprints (gray boxes) are estimated from n (the lipid:peptide stoichiometry from isothermal titration calorimetry [ITC] measurements), equal to 270 Å2 (SPN10), 434 Å2 (SS-31), 466 Å2 (SPN4), and 605 Å2 (SS-20). The peptide-specific cross-sectional areas (cyan circles) are estimated from the longest inter-heavy atom distance from our bound NMR structures (11.4 Å [SPN10], 13.7 Å [SS-31], 13.7 Å [SPN4], and 12.9 Å [SS-20]), which were then used as diameters to estimate a maximal circular cross-sectional area (102 Å2 [SPN10], 147.4 Å2 [SS-31], 147.4 Å2 [SPN4], and 130.7 Å2 [SS-20]). The % coverage, calculated as cross-sectional area/binding footprint, provides a metric for the amount of membrane area occupied by peptide.
Figure 3 with 5 supplements
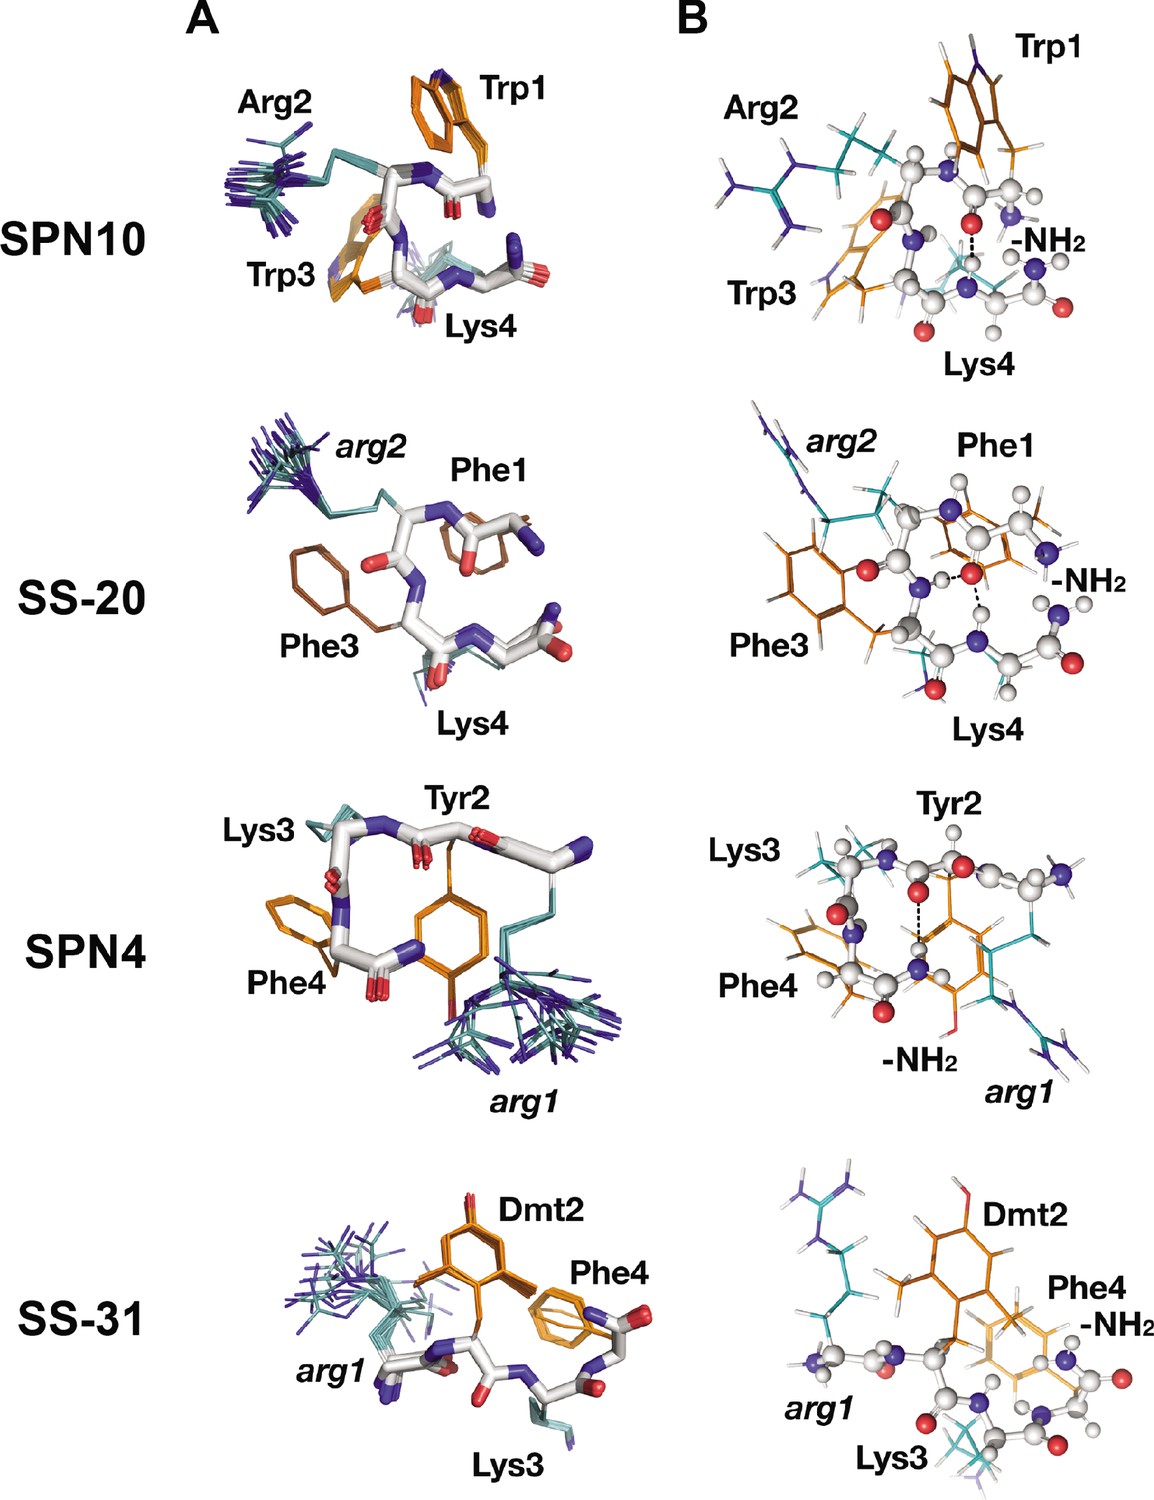
Peptide structures in the bicelle-bound state.
(A) Top 20 lowest energy NMR conformers.Backbone atoms and side chains are color coded as in Figure 1B. (B) Peptide secondary structure. Conformations closest to NMR ensemble means are shown. Backbones are shown in ball-and-stick representation, H-bonds are shown as dotted lines, and side chains are shown as lines (orange for aromatic and teal for basic). Three of the peptides have main chain H-bonds: SPN10 (CO[1] to NH[4]), SS-20 (CO[1] to NH[4]), and SPN4 (CO[2] to NH2[5]). SS-31 is extended and has no H-bonds.
Figure 3—figure supplement 1
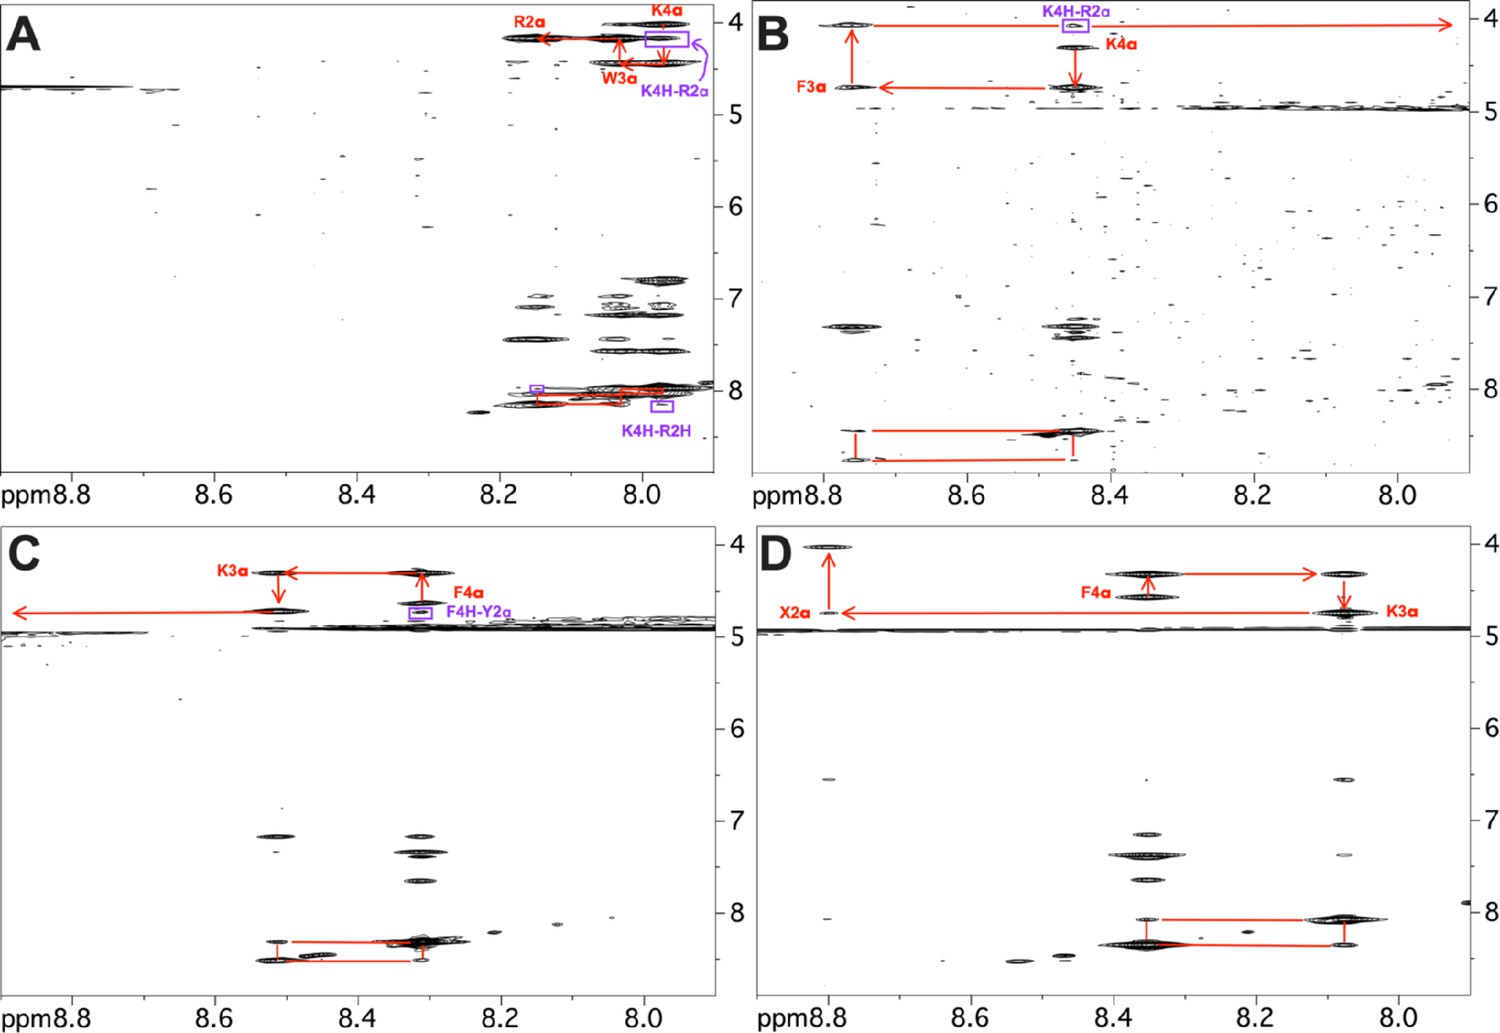
Representative sections of 2D NOESY spectra.
Portions of 2D NOESY spectra collected for the four peptide analogs showing sequential assignments (red) and nuclear Overhauser effects (NOEs) indicative of reverse turn conformations (purple). (A) SPN10, (B) SS-20, (C) SPN10, and (D) SS-31. Three of the peptides show dαN(i,i+2) NOEs that are consistent with reverse turn but not extended structures (purple). The SPN10 peptide has an additional weak dNN(i,i+2) NOE consistent with a turn. In addition to these backbone connectivities, many additional side chain NOEs also support the turn structures. In contrast, the SS-31 peptide only shows sequential backbone NOEs and has an extended structure. The NOEs to resonances between 6 and 7 ppm are to aromatic side chains in the peptides. As expected, the amino protons of the first residue in each peptide are not seen due to fast solvent exchange. Fast solvent exchange also causes the amide proton of the second residue to be extremely weak or not seen in some of the spectra. In the SS-31 peptide ‘X2’ indicates the 2,6-dimethyl tyrosine residue at position 2 in the sequence.
Figure 3—figure supplement 2
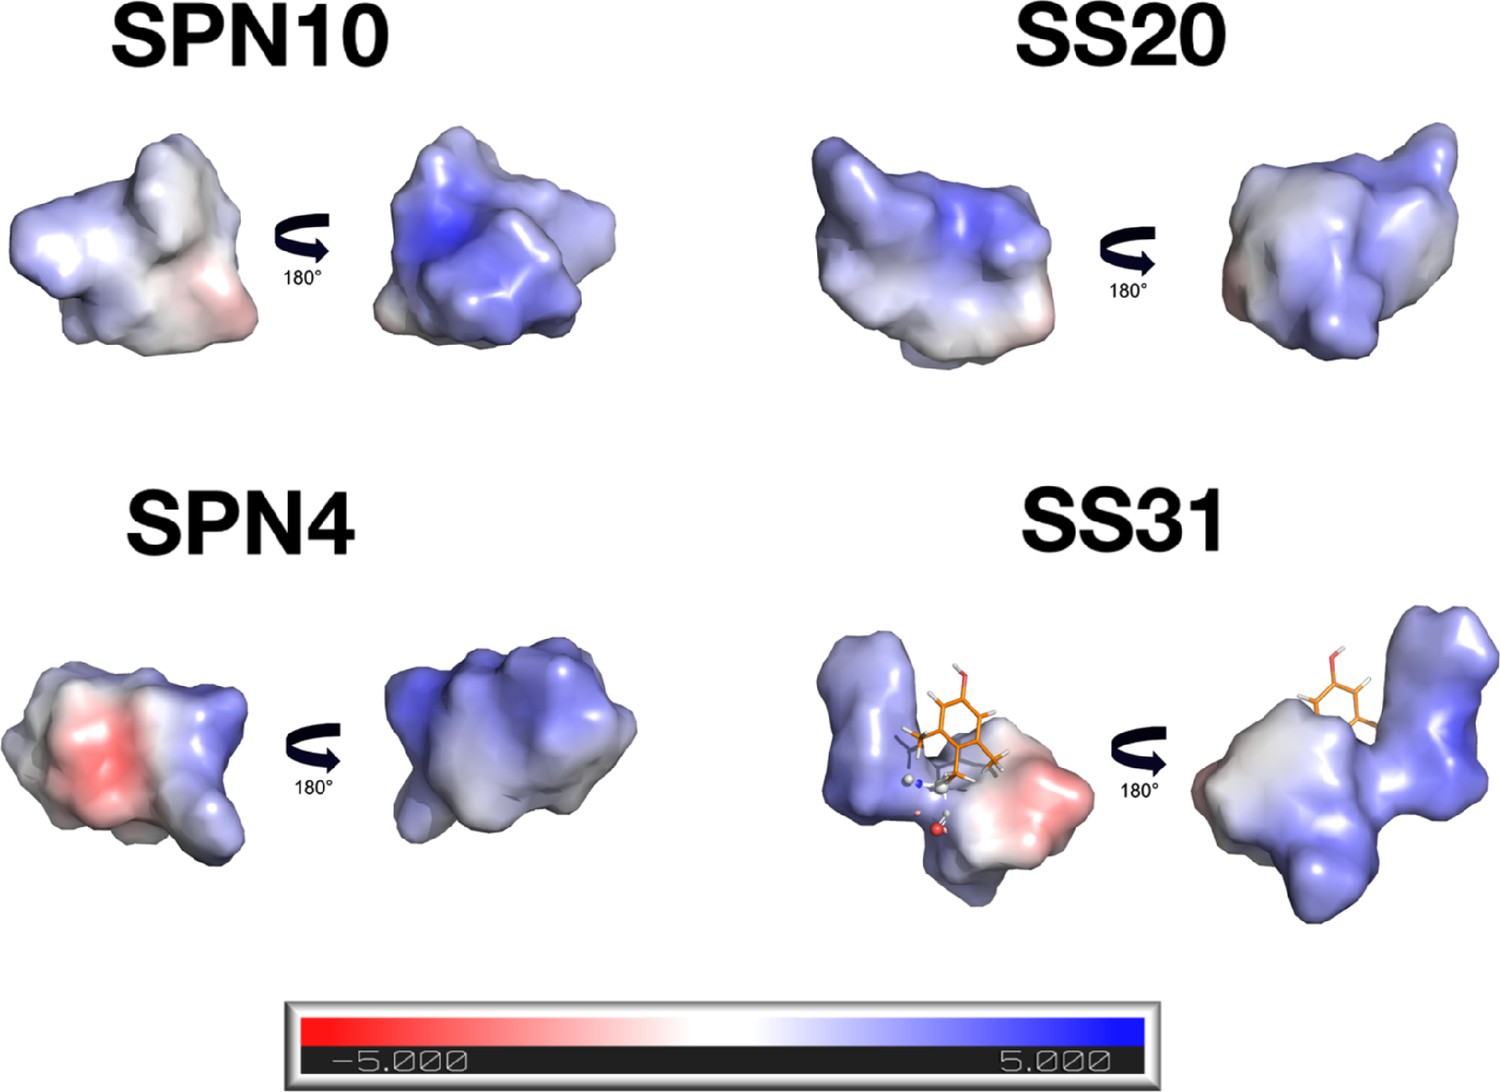
Electrostatic surfaces of peptides in the bound state.
Electrostatic surfaces for the peptides in the bound state were calculated with the APBS program (ref. 119). For each peptide, the first view corresponds to that in Figure 3 and shows a mostly neutral surface. The second is after a 180° rotation along y and shows a predominately positively charged side of the molecule. For the SS-31 peptide, the electrostatic potential was not calculated for dimethyl tyrosine since it is a non-standard amino acid.
Figure 3—figure supplement 3
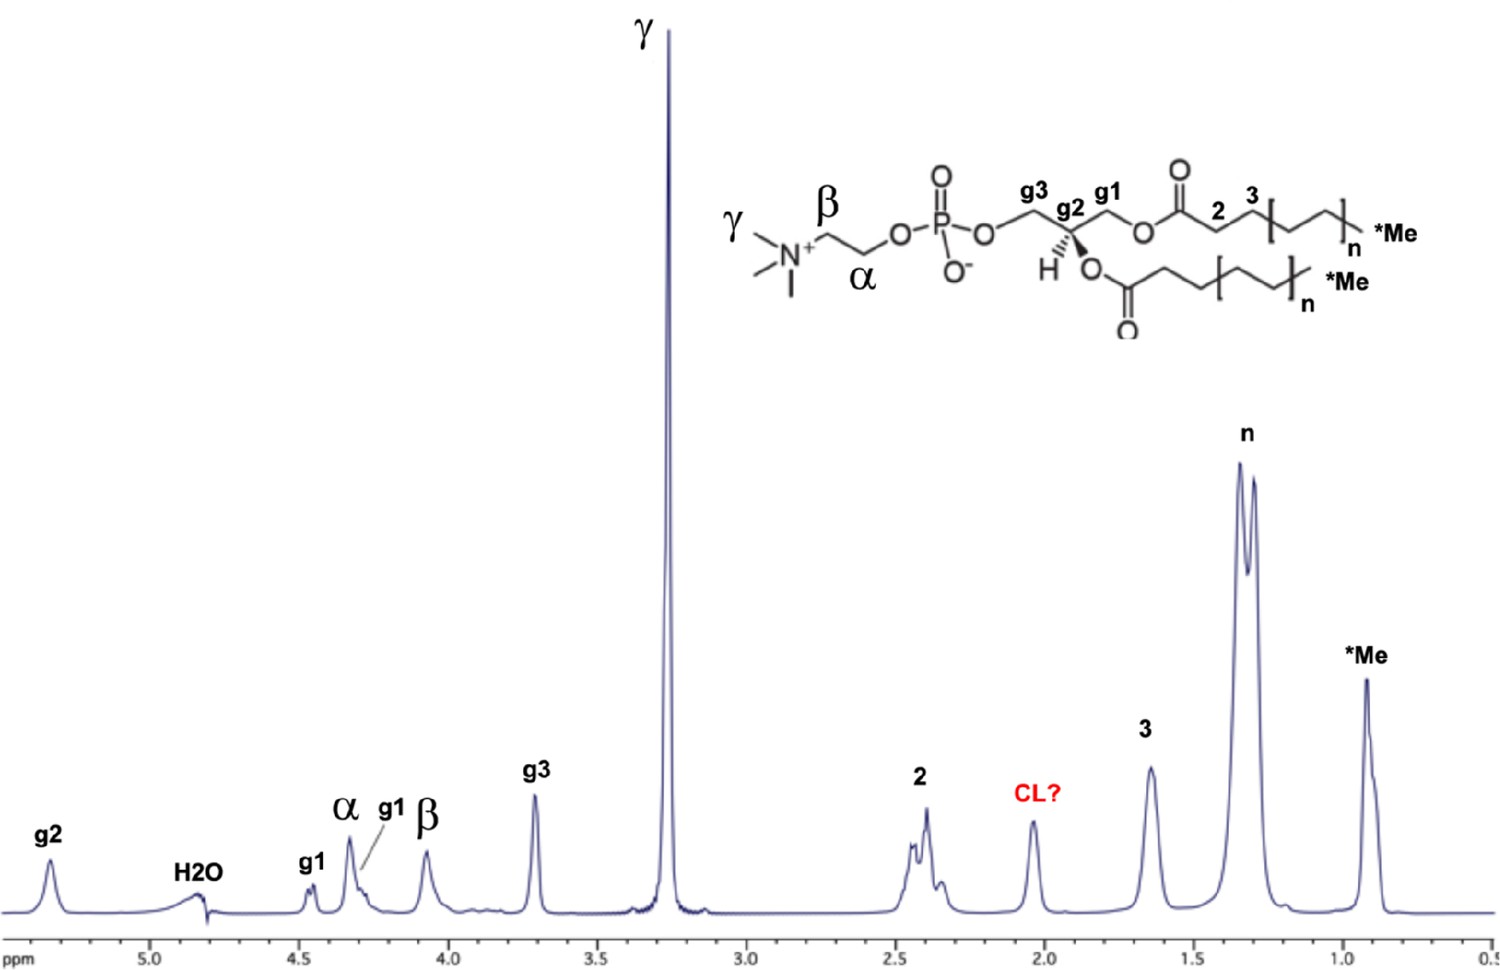
Assignments of bicelle lipid NMR signals.
The NMR spectrum is of the 150 µM tetraoleoyl cardiolipin (TOCL): 1500 µM phosphatidylcholine (POPC): 4500 µM DHPC (1,2-dihexanoyl-sn-glycero-3-phosphocholine) bicelles (ref. 4) in the absence of peptides. The inset shows the chemical structure of POPC, with NMR assignments from a published report (ref. 40) indicated on the spectrum. The signal at 2.05 ppm is likely from the cardiolipin (CL) lipid (possibly the proton on the glycerol sn-2 carbon) since it is absent in bicelles that have only the POPC and DHPC lipids. The assignments above were used to interpret nuclear Overhauser effects (NOEs) between the peptides and bicelle lipids (see Figure 3—figure supplement 4).
Figure 3—figure supplement 4
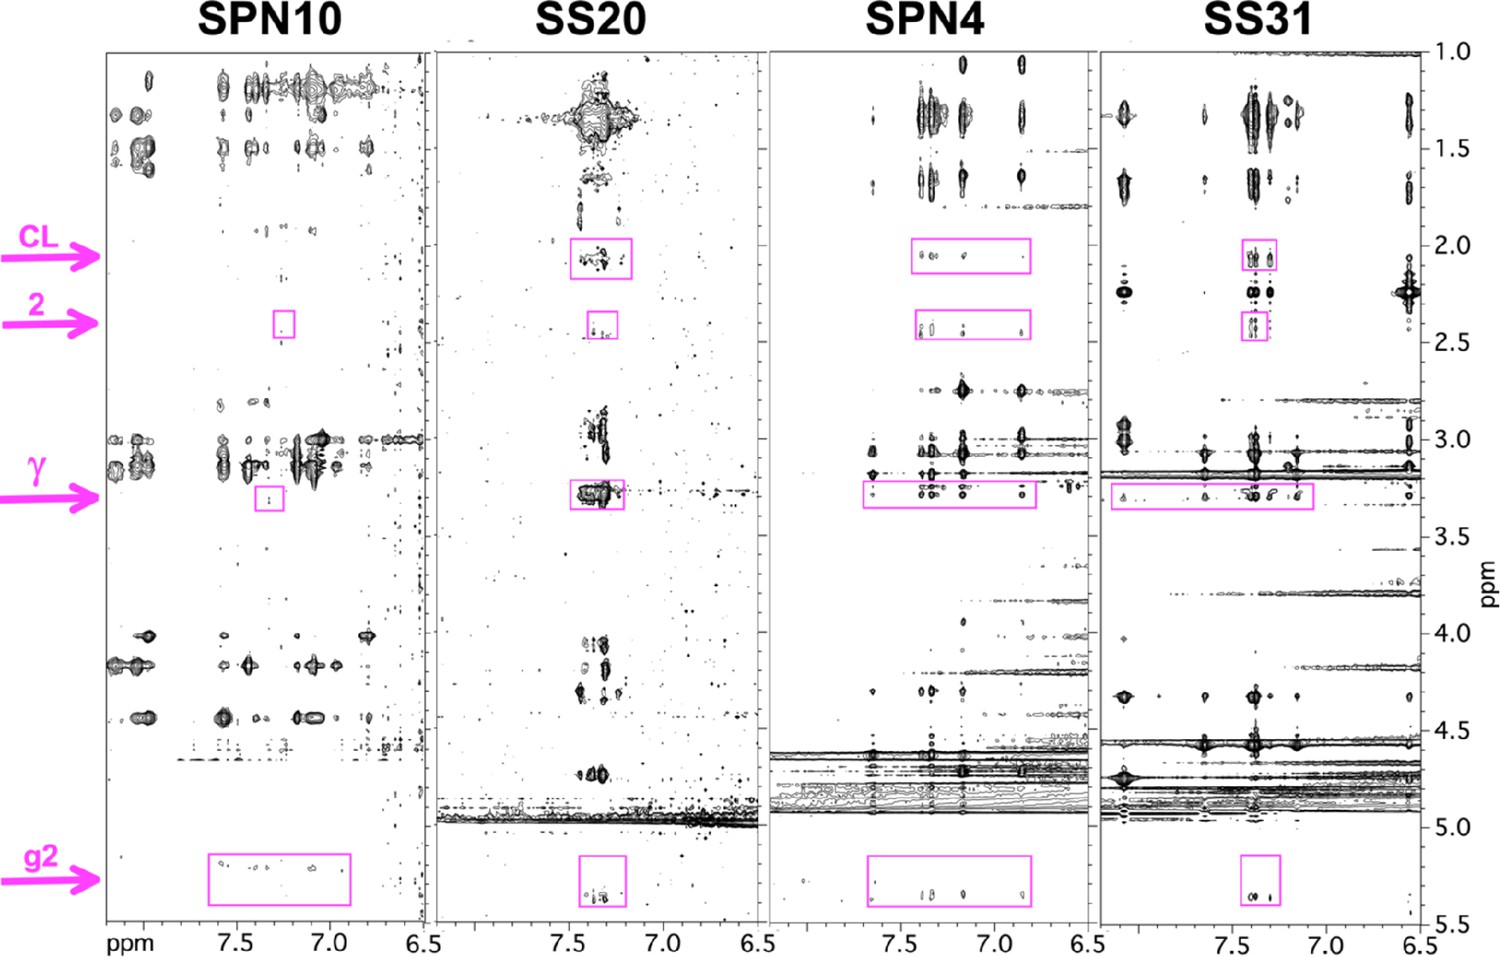
Transferred nuclear Overhauser effects (trNOEs) between peptides and lipids.
Sections of the 2D NOESY spectra recorded on peptides in the presence of bicelles, showing nuclear Overhauser effects (NOEs) to bicelle lipid protons (highlighted in purple). For NMR assignments see Figure 3—figure supplement 3. The ‘CL’ signal is specific to cardiolipin and is tentatively assigned to the proton on the 2-glycerol carbon. Only those lipid resonances with no nearby signals from the peptide were selected for analysis. Note that the peptide NOEs for SPN10 are fewer and weaker than for the other peptides.
Figure 3—figure supplement 5
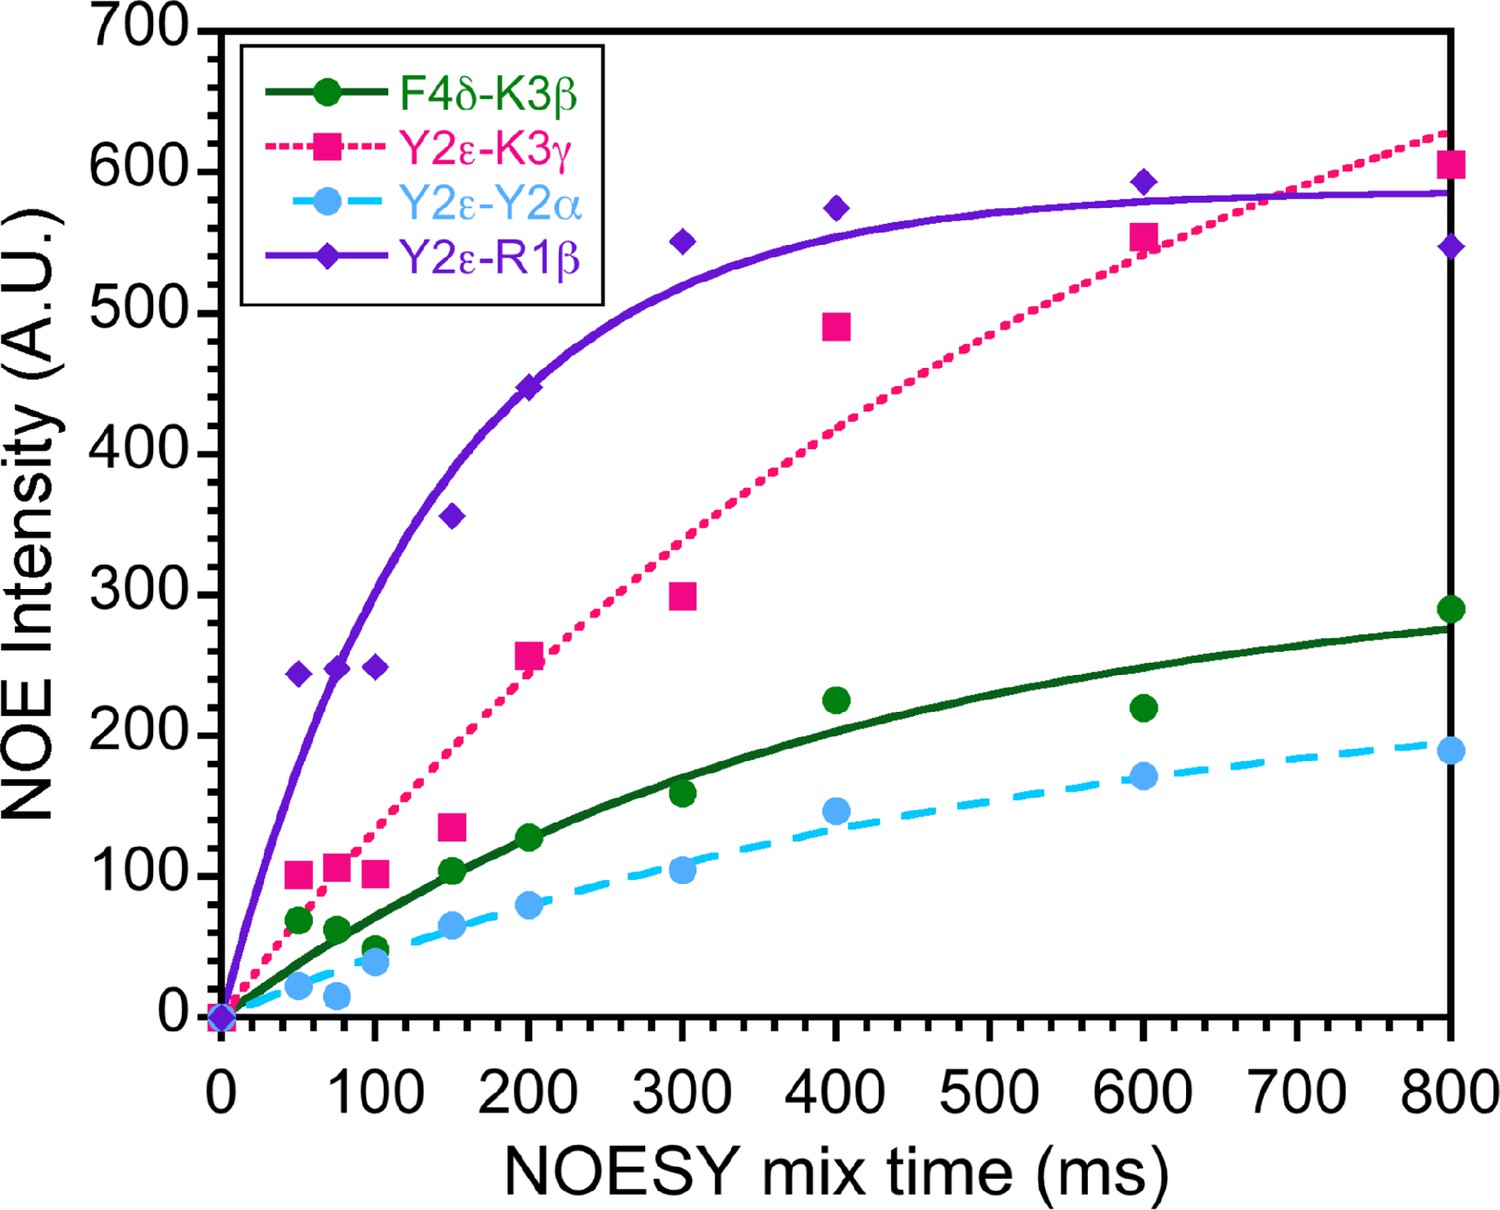
Transferred nuclear Overhauser effect (trNOE) buildup curves.
NOESY buildup curves for the bicelle-bound SPN4 sample at 600 MHz. Nine 2D NOESY spectra were collected to monitor the dependence of nuclear Overhauser effects (NOEs) on the mixing time. Representative data are shown for the four distance contacts listed in the inset. Based on the data, we selected mixing times of 150 ms in the linear portions of the curves to minimize spin diffusion effects.
-
Figure 3—figure supplement 5—source data 1
Transferred nuclear Overhauser effect (trNOE) buildup curve data.
- https://cdn.elifesciences.org/articles/75531/elife-75531-fig3-figsupp5-data1-v1.xlsx
Figure 4 with 10 supplements
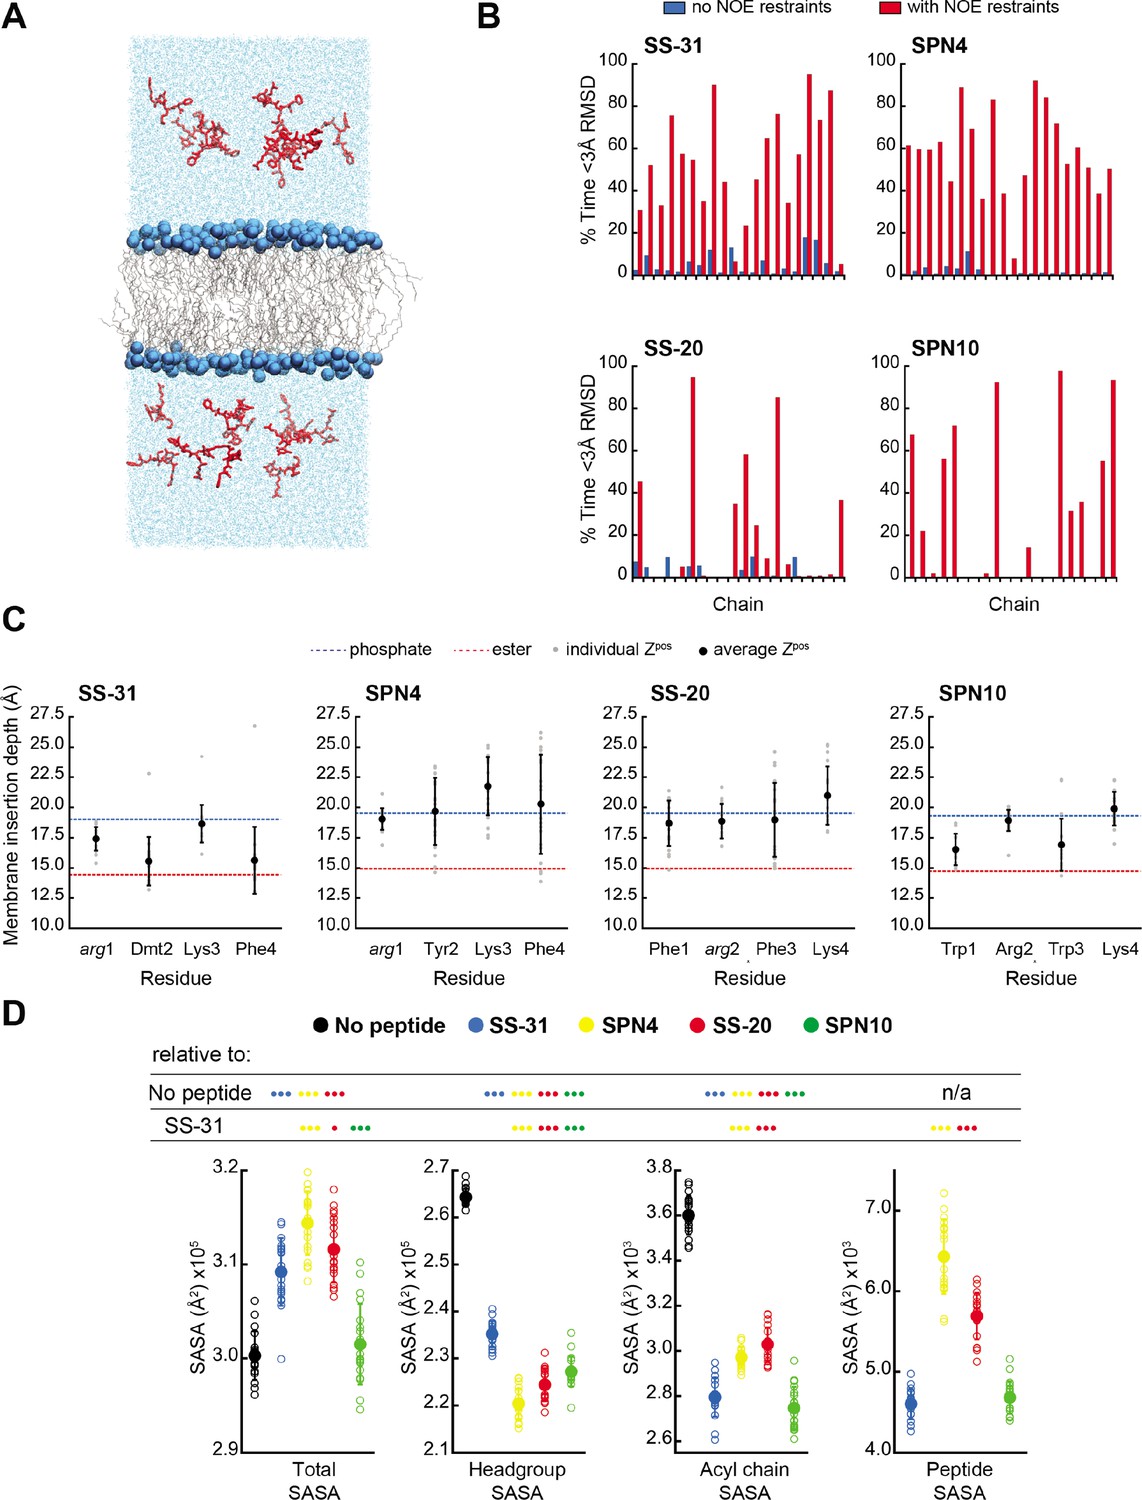
MD simulations of peptide conformations and membrane interactions.
(A) Snapshot of a typical MD simulation. Peptides (red) are shown in the aqueous phase on either side of a bilayer composed of an 80:20 molar ratio of phosphatidylcholine (POPC):tetraoleoyl cardiolipin (TOCL) lipid acyl chains in wireframe, and lipid phosphates shown as blue van der Waals spheres. (B) Comparison of NMR and MD structures. Comparison of the simulation time spent by each peptide analog below a heavy atom root mean square deviation (RMSD) of 3 Å to their respective lead NMR membrane-bound structures before (blue) and after (red) nuclear Overhauser effect (NOE) restraints were imposed. (C) Average membrane insertion depths. Bilayer depth (Zpos, n=20) for Cβ atoms on each residue for each peptide shown in comparison with the average Zpos levels of lipid headgroup phosphates (dashed blue) and lipid ester carbons (dashed red). The positions of the lipid atoms were averaged between the four different peptide systems for consistent comparison. The depths represent normalized distances to the bilayer COM. Gray dots represent individual points and black circles with error bars represent means ± SD. (D) Peptide-dependent solvent accessible surface area (SASA) during MD trajectories. SASA of the total bilayer and peptides system (Total) and individual components (headgroup, acyl chain, and peptide) calculated from MD trajectories in the absence of peptide or with the peptide analogs indicated (n=19 for all measurements). Open symbols show individual block-averaged datapoints from each trajectory and solid symbols with error bars represent means ± SD for each dataset. Statistical comparisons are based on the Wilcoxon rank sum test, with differences representing a comparison to the no-peptide control, or to SS-31 as indicated (no symbol, p>0.05; • p≤0.05; •• p≤0.01; ••• p≤0.001).
-
Figure 4—source data 1
MD data: frequency of sampling states with high similarity to NMR structures, membrane insertion depths, and solvent accessible surface area (SASA) values.
- https://cdn.elifesciences.org/articles/75531/elife-75531-fig4-data1-v1.xlsx
Figure 4—figure supplement 1
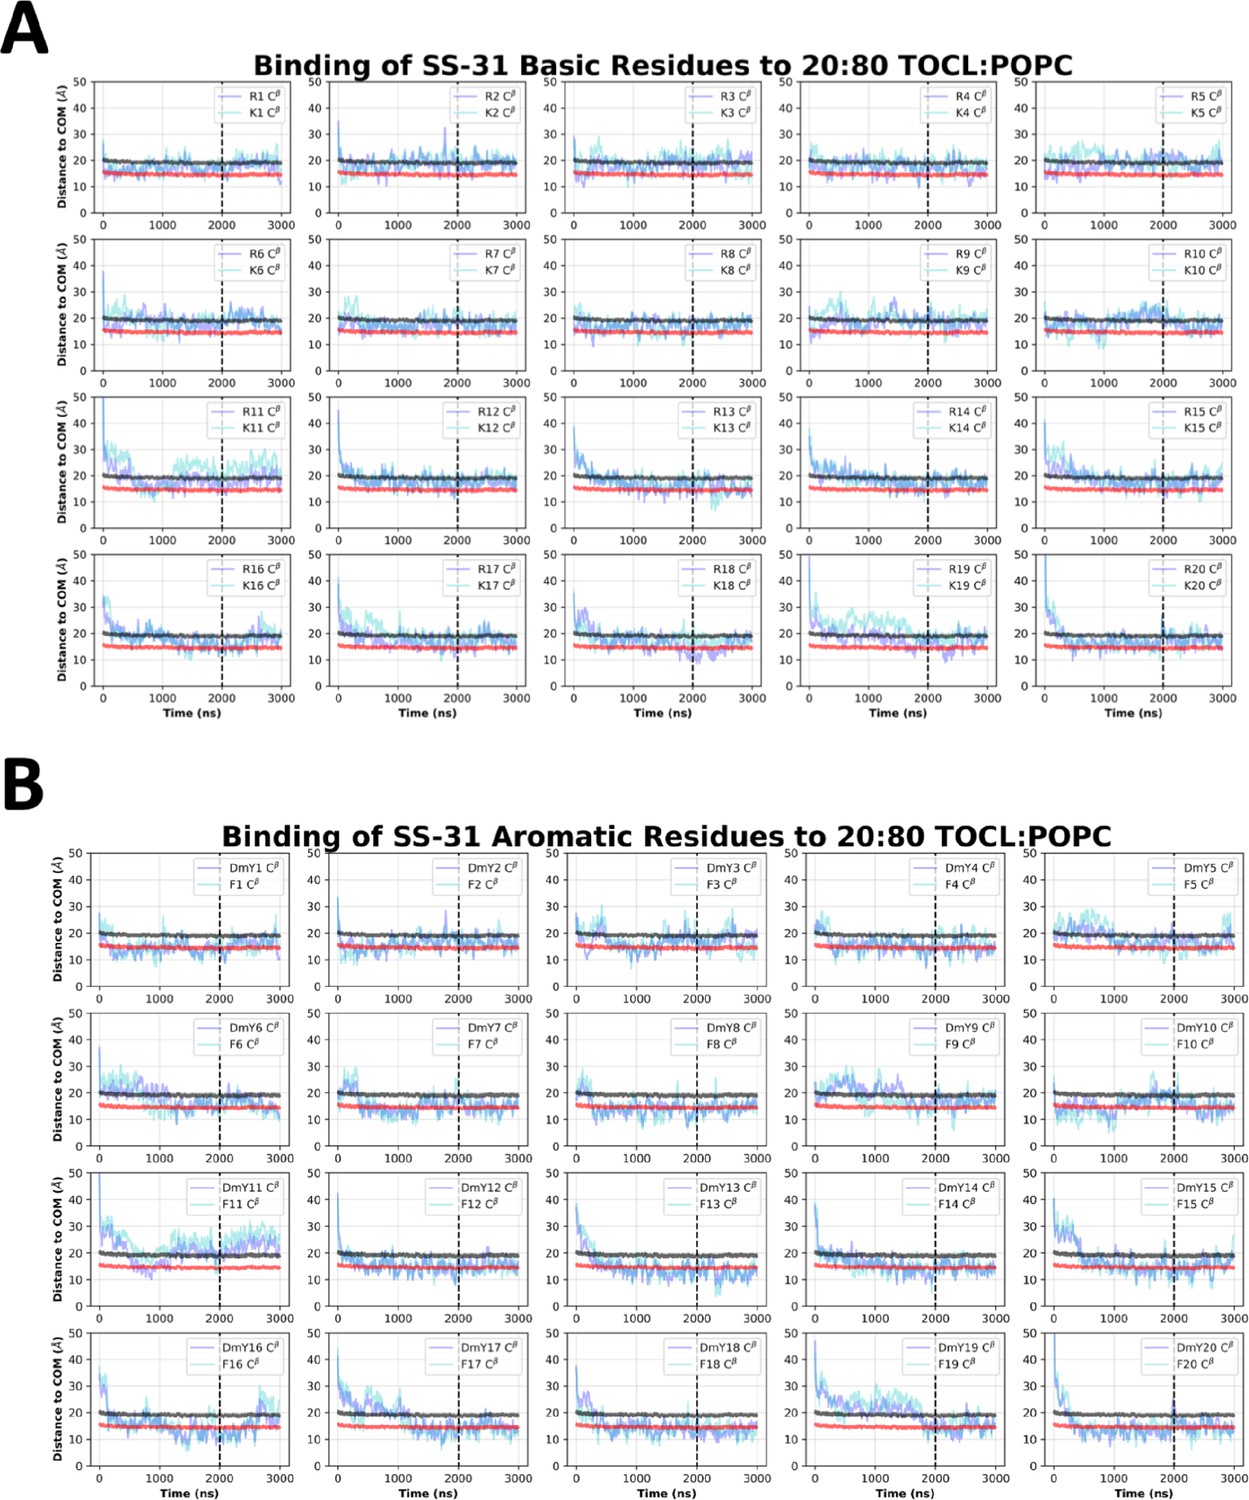
SS-31 side chain insertion depths from MD simulations.
Time course profiles shown for individual SS-31 basic (A) and aromatic (B) side chain positions relative to the bilayer. Positions along the z-axis were determined as the distance between the Cβ atom on each side chain and the calculated center of mass (COM) of the membrane. The black and red horizontal lines, respectively, show the average position of all lipid phosphates and lipid ester carbons relative to the membrane COM. Colored lines show the z coordinates (Zpos) of individual side chains smoothed over 10 ns intervals. The black vertical dotted line indicates when NMR restraints were implemented.
Figure 4—figure supplement 2
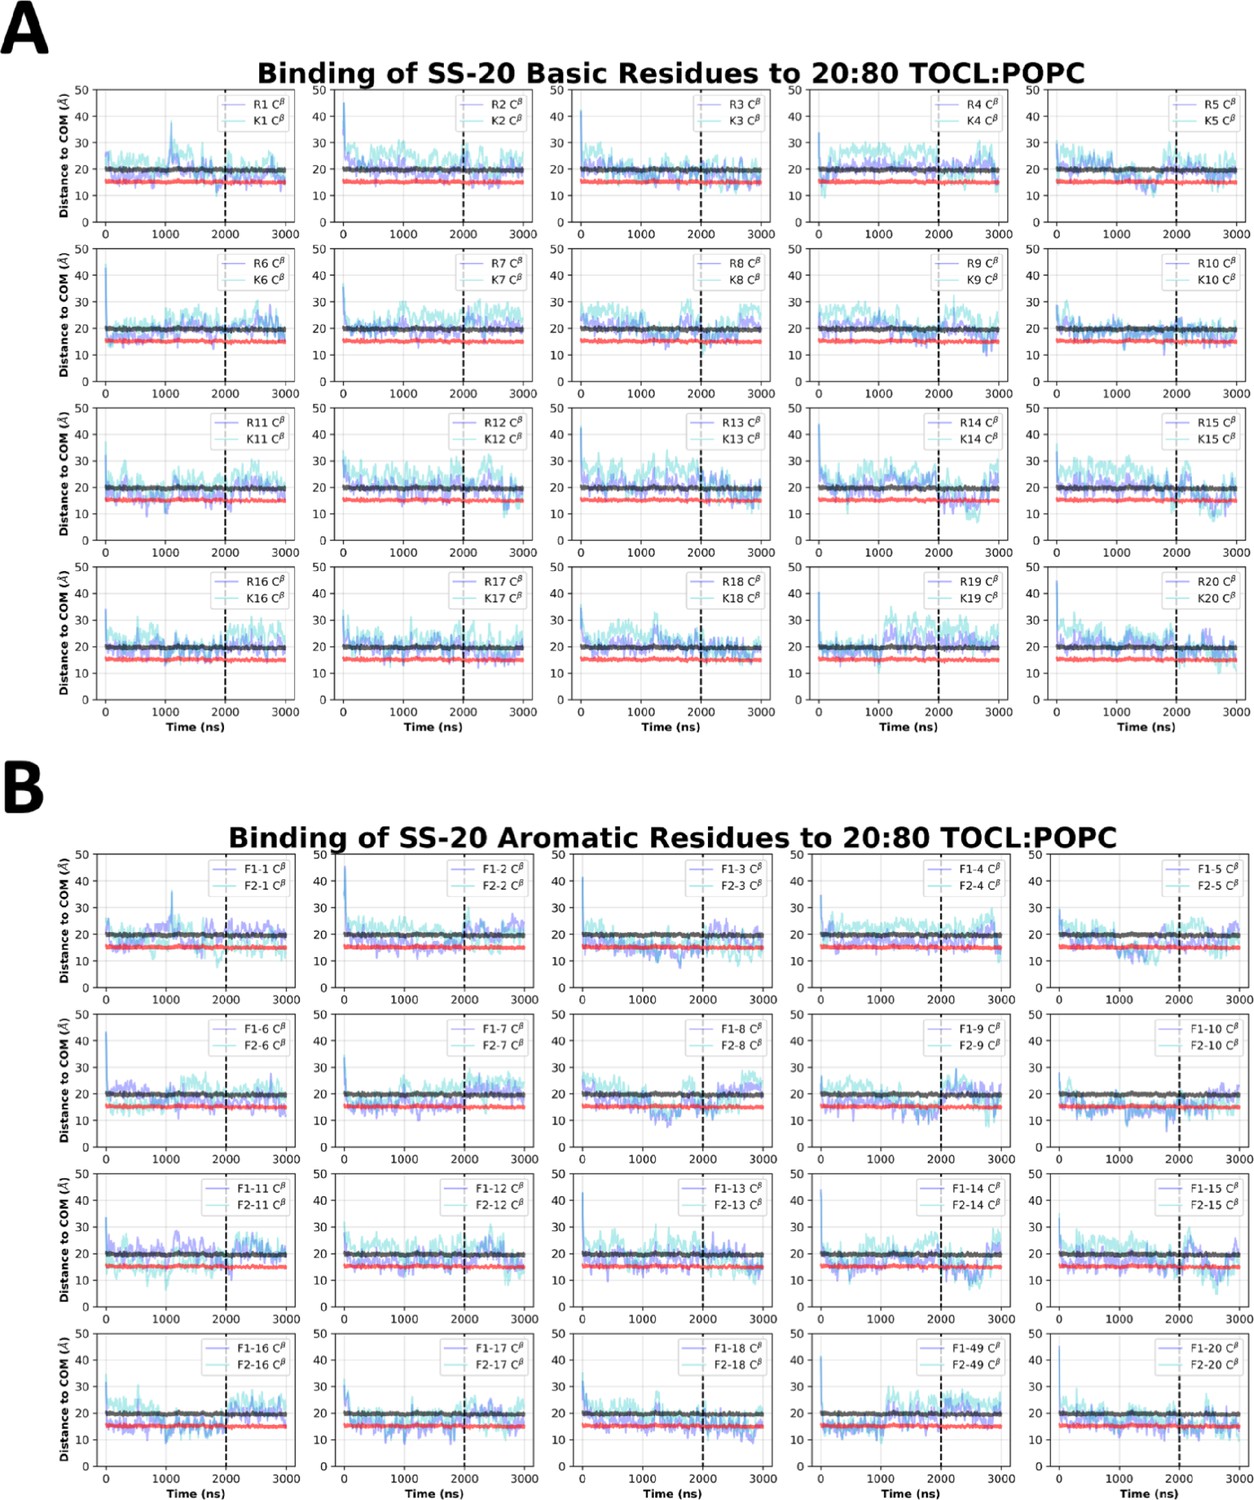
SS-20 side chain insertion depths from MD simulations.
Time course profiles shown for individual SS-20 basic (A) and aromatic (B) side chain positions relative to the bilayer. Positions along the z-axis were determined as the distance between the Cβ atom on each side chain and the calculated center of mass (COM) of the membrane. The black and red horizontal lines, respectively, show the average position of all lipid phosphates and lipid ester carbons relative to the membrane COM. Colored lines show the z coordinates (Zpos) of individual side chains smoothed over 10 ns intervals. The black vertical dotted line indicates when NMR restraints were implemented.
Figure 4—figure supplement 3
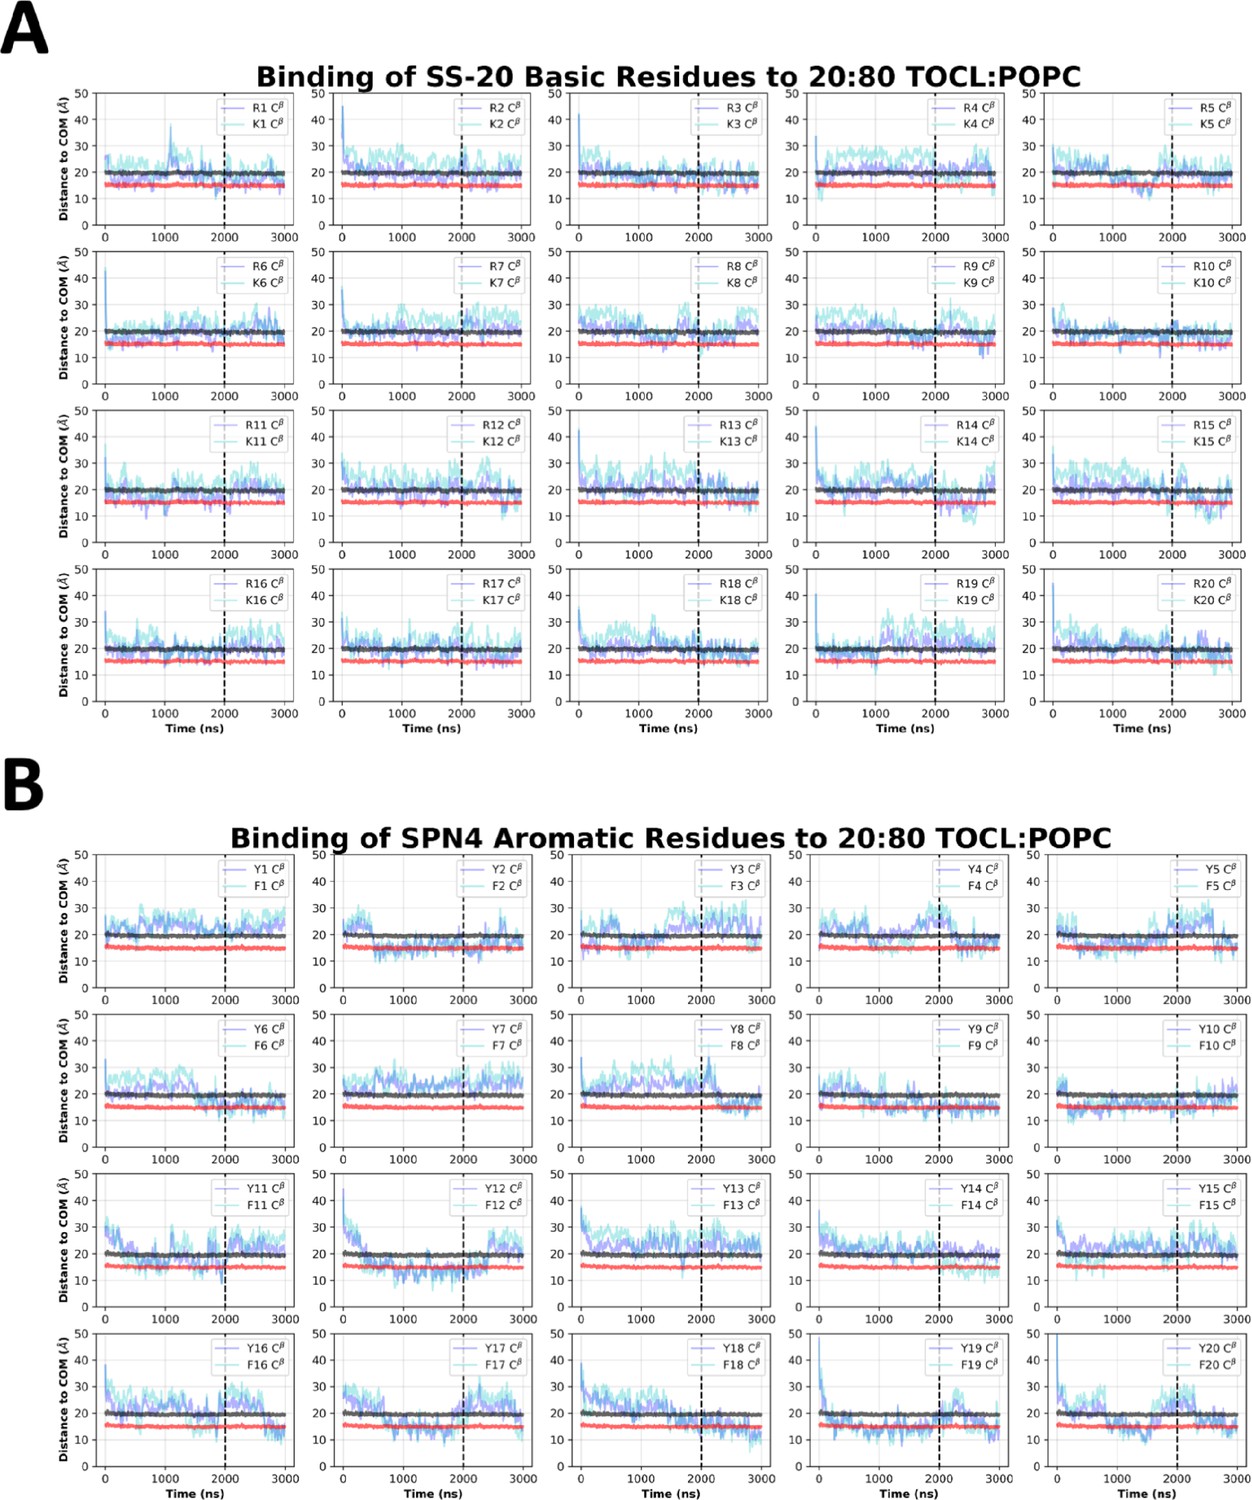
SPN4 side chain insertion depths from MD simulations.
Time course profiles shown for individual SPN4 basic (A) and aromatic (B) side chain positions relative to the bilayer. Positions along the z-axis were determined as the distance between the Cβ atom on each side chain and the calculated center of mass (COM) of the membrane. The black and red horizontal lines, respectively, show the average position of all lipid phosphates and lipid ester carbons relative to the membrane COM. Colored lines show the z coordinates (Zpos) of individual side chains smoothed over 10 ns intervals. The black vertical dotted line indicates when NMR restraints were implemented.
Figure 4—figure supplement 4
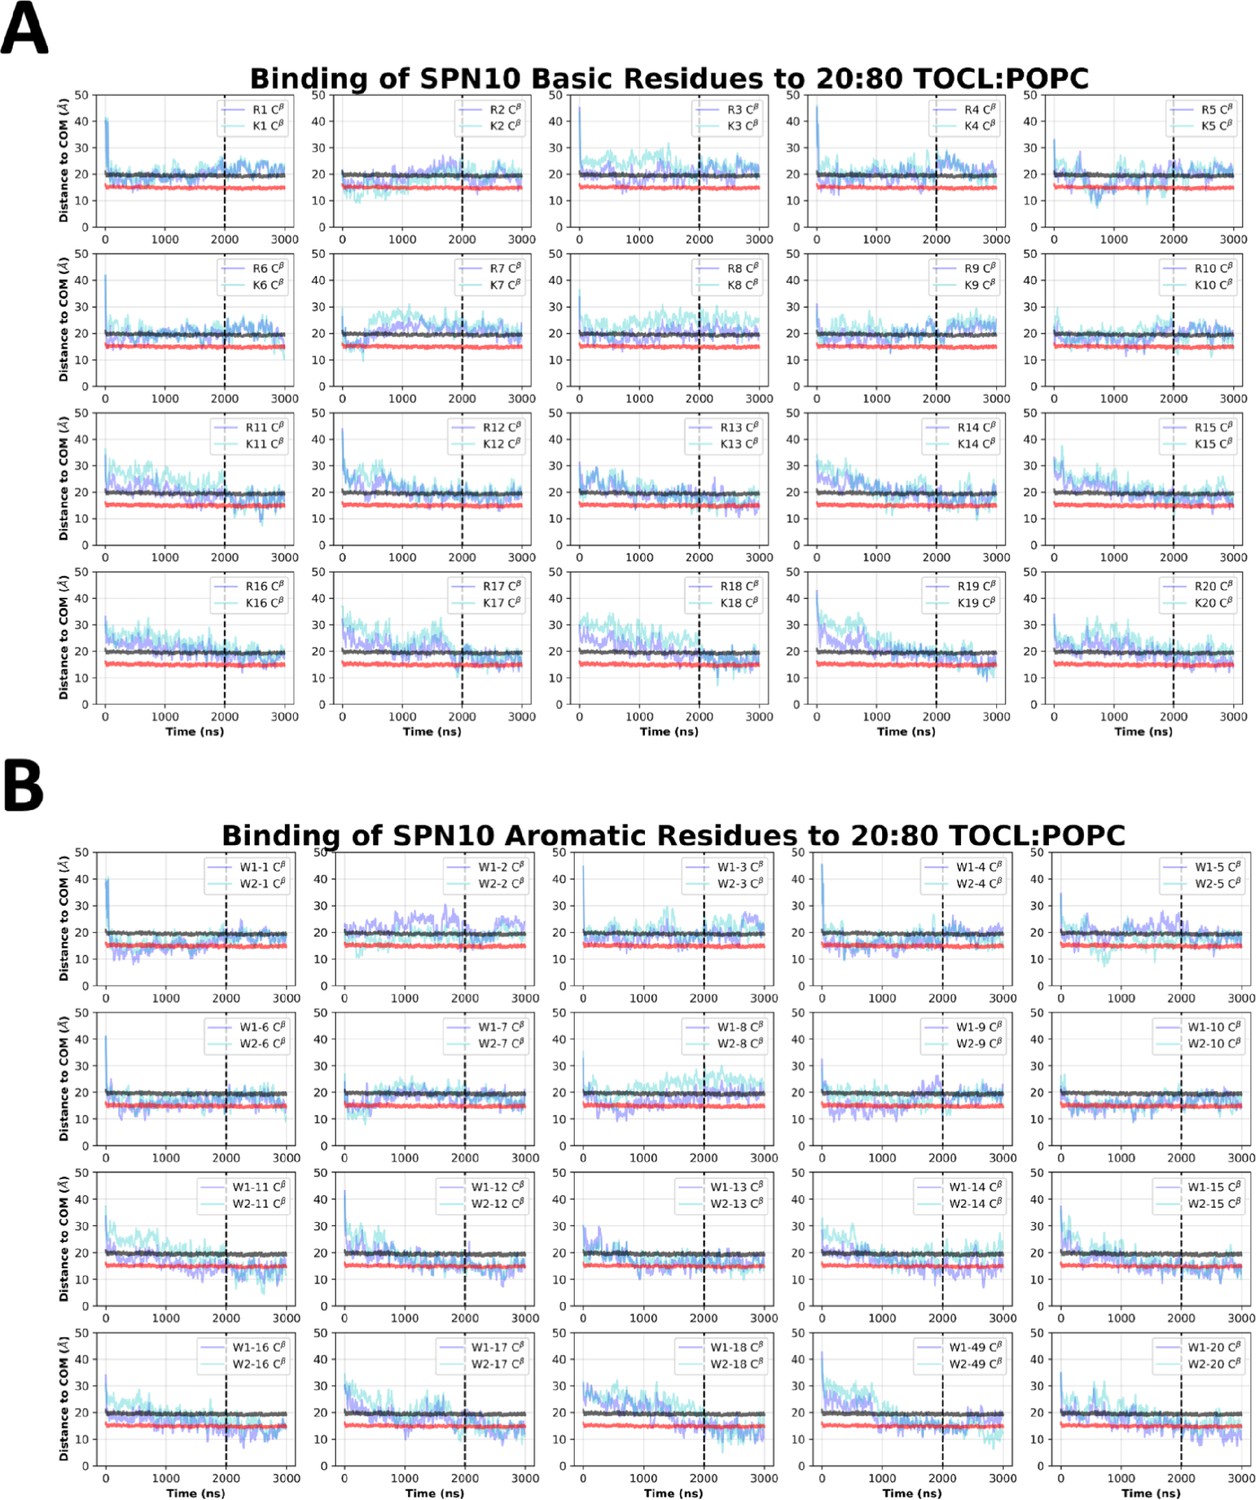
SPN10 side chain insertion depths from MD simulations.
Time course profiles shown for individual SPN10 basic (A) and aromatic (B) side chain positions relative to the bilayer. Positions along the z-axis were determined as the distance between the Cβ atom on each side chain and the calculated center of mass (COM) of the membrane. The black and red horizontal lines, respectively, show the average position of all lipid phosphates and lipid ester carbons relative to the membrane COM. Colored lines show the z coordinates (Zpos) of individual side chains smoothed over 10 ns intervals. The black vertical dotted line indicates when NMR restraints were implemented.
Figure 4—figure supplement 5
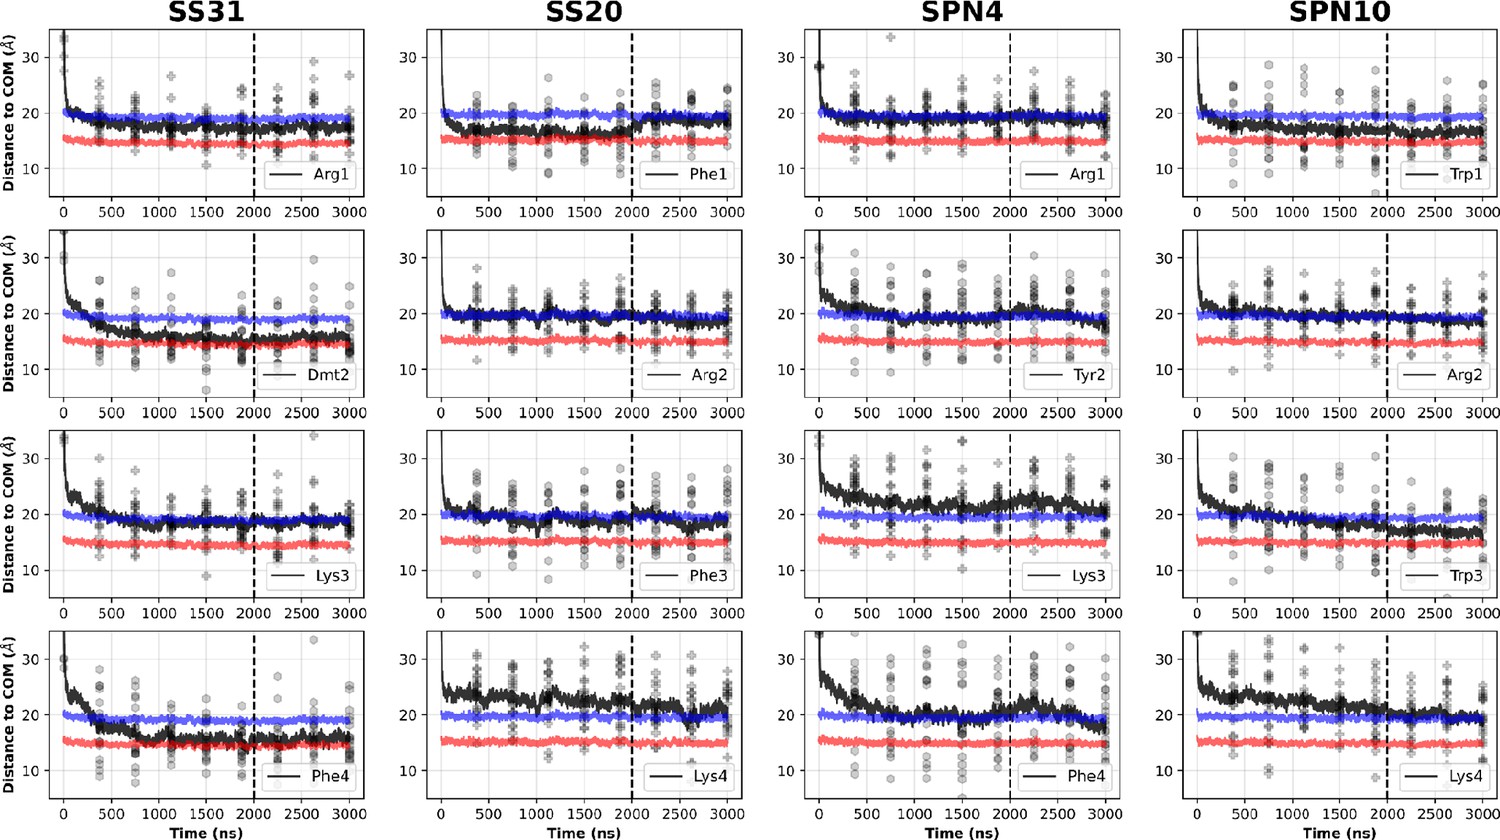
Comparison of peptide side chain insertion depths from MD simulations.
Time course profiles summarizing the profiles shown in Figure 4—figure supplements 1–4, showing the peptide basic (plus sign) and aromatic (hexagon) side chain positions relative to the bilayer over time. Positions along the z-axis were determined as the distance between the Cβ atom on each side chain and the calculated center of mass (COM) of the membrane. The black and red horizontal lines, respectively, show the average position of all lipid phosphates and lipid ester carbons relative to the calculated COM of the membrane for each peptide system. Black traces show the average z coordinates (Zpos) across all side chains (20 peptides/system) smoothed over 10 ns intervals. The black vertical dotted line indicates when NMR restraints were implemented. In general, the residues of SS-31 buried the deepest, followed by SPN10, SS-20, and SPN4. Whereas for SS-31 the lysine buried below the lipid phosphates, the lysine of all other peptides were at or above this plane. A similar trend was established amongst the peptides for the arginine moieties, except that all these residues were buried below the plane of the lipid phosphates. Additionally, the same trend applied to the burial depths of the aromatics; perhaps most notably, SPN4 was the only peptide to have aromatics positioned above the plane of the lipid phosphates.
Figure 4—figure supplement 6
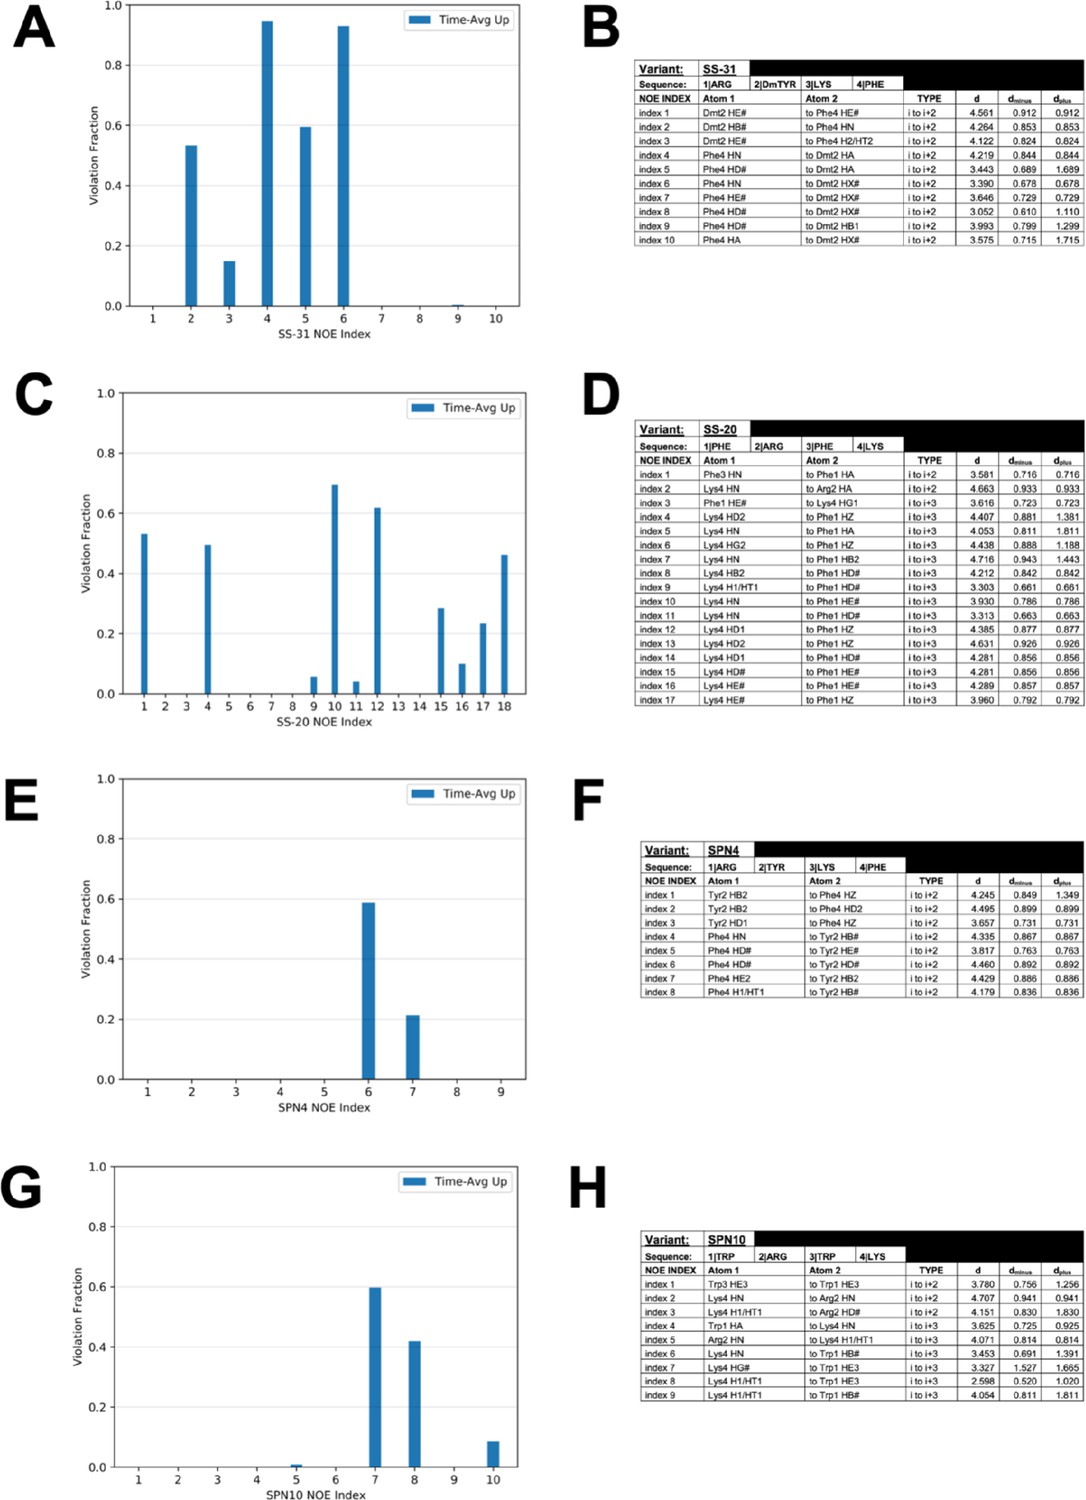
Nuclear Overhauser effect (NOE) restraint violations from peptide-bilayer MD simulations.
Comparison of the fraction of simulation time in which time-averaged ensembles of peptides violated the upper bound for each NOE restraint for (A) SS-31, (C) SS-20, (E) SPN4, and (G) SPN10. Table of NOE restraints imposed in peptide-bilayer MD simulations for (B) SS-31, (D) SS-20, (F) SPN4, and (H) SPN10.
Figure 4—figure supplement 7
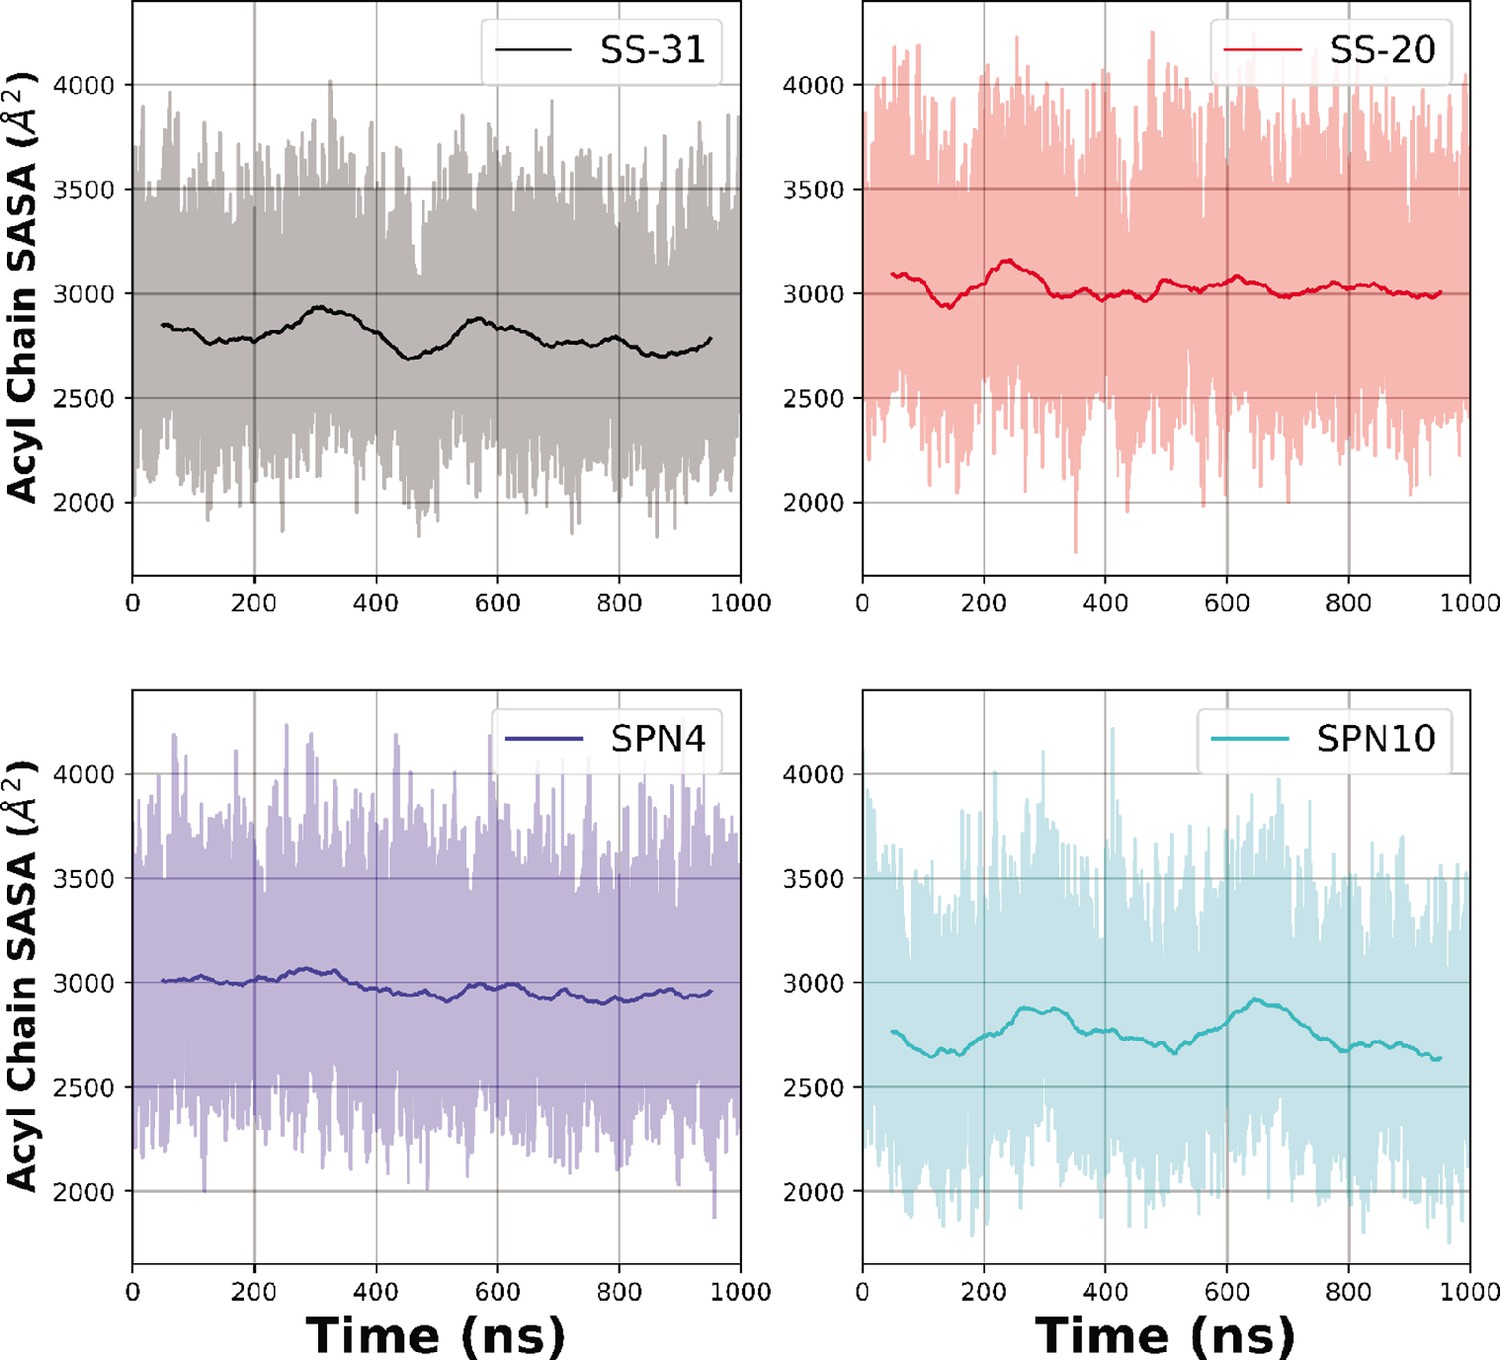
Time courses of solvent accessible surface area (SASA) measurements from MD trajectories.
Temporal evolution of the raw (lighter colored traces) and smoothed (thicker traces, 100 ns rolling average) SASA of bilayer lipid acyl chain region calculated over time for each peptide analog.
Figure 4—figure supplement 8
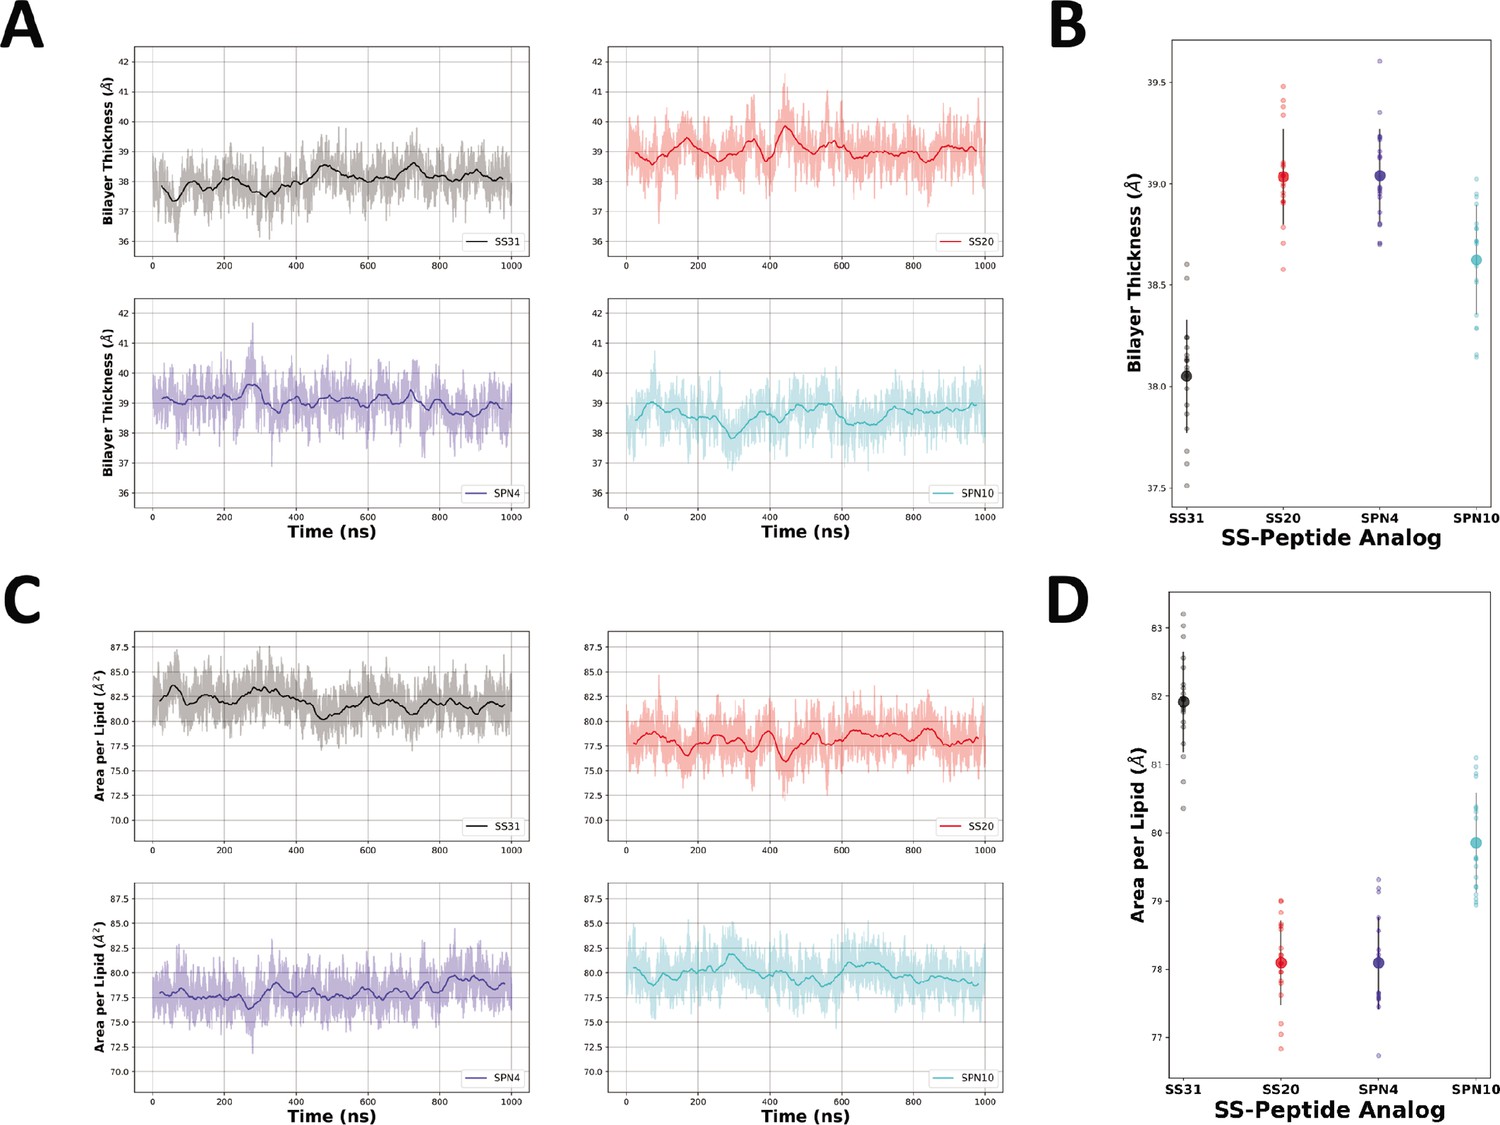
Bilayer thickness and area per lipid measurements from MD simulations.
(A) The raw (lighter color) and smoothed (darker color, 50 ns rolling average) thickness of each bilayer were calculated as the difference between the average phosphate positions in the upper and lower leaflets over time for each peptide analog. (C) The raw (lighter color) and smoothed (darker color, 40 ns rolling average) area per lipid of each bilayer were calculated over time for each peptide analog. Individual readings of bilayer thickness (B) and area per lipid (D) of each bilayer in the presence of different peptide analogs are shown as individual points (n=19 in each case). Smaller color-coded circles represent individual measurements and larger circles with error bars represent means ± SD, calculated from 50 ns blocks in the last microsecond of each trajectory.
-
Figure 4—figure supplement 8—source data 1
MD data: bilayer thickness and area per lipid values.
- https://cdn.elifesciences.org/articles/75531/elife-75531-fig4-figsupp8-data1-v1.xlsx
Figure 4—figure supplement 9
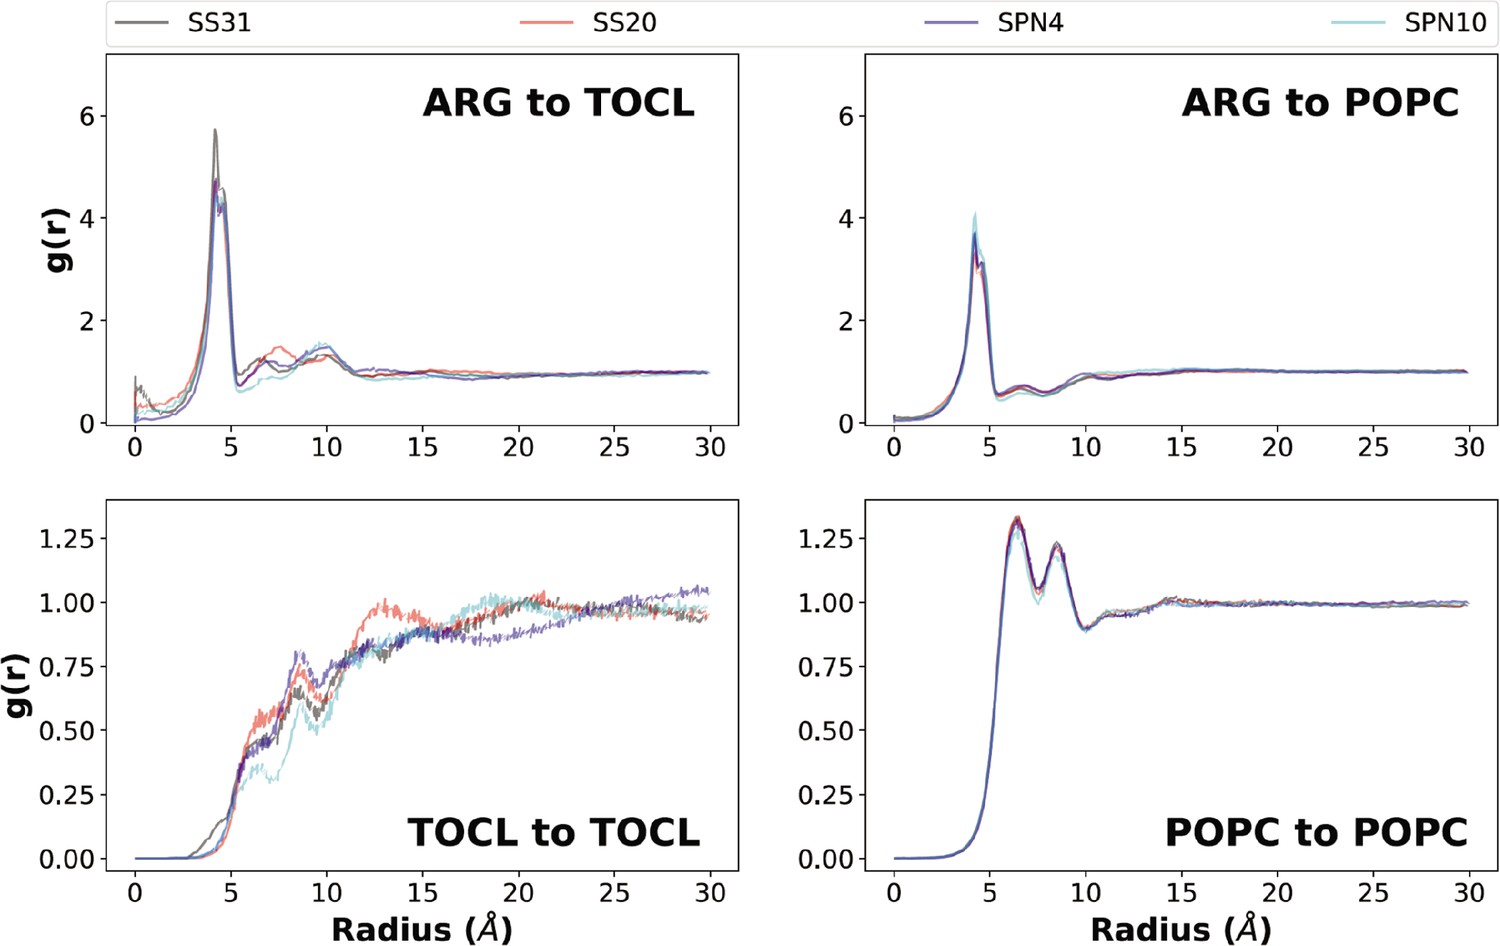
Lipid radial distribution profiles from MD simulations.
Upper panels: lipid distributions around different peptide analogs. Lateral (x-y plane) radial distributions averaged across both leaflets from the Arg (reference is the Arg-Cζ atom) to lipid headgroup phosphate atoms (top left: tetraoleoyl cardiolipin [TOCL], P1; top right: phosphatidylcholine [POPC], P). Three distinct radial shells of TOCL and POPC phosphate groups are observed around the Arg-Cζ atom: a primary shell (radius ~4 Å), a secondary shell (radius ~6–8 Å), and a tertiary shell (radius ~9–12 Å). Notably, SS-31 had an additional density in the 0–2 Å range, which agreed with the insertion depth data showing an Arg residue residing below the phosphates on average and can thus overlap in the x-y plane for this radial distribution. Lower panels: lipid-to-lipid distributions in the presence of different peptide analogs. Lateral (x-y) radial distribution profiles of phosphate to phosphate in each lipid group (bottom left: TOCL, P1; bottom right: POPC, P). Approximately, four radial shells of cardiolipin (CL) phosphate groups are observed around the P1 atom: a primary density (radius ~6 Å), as well as secondary (radius ~8–10 Å), tertiary (radius ~12–15 Å), and quaternary (radius ~16–22 Å) densities. For PC phosphate groups, the four radial shells include a primary density (radius 6–7 Å), as well as secondary (radius ~8–9 Å), tertiary (radius ~11–12 Å), and quaternary (radius ~14–15 Å) densities.
Figure 4—figure supplement 10
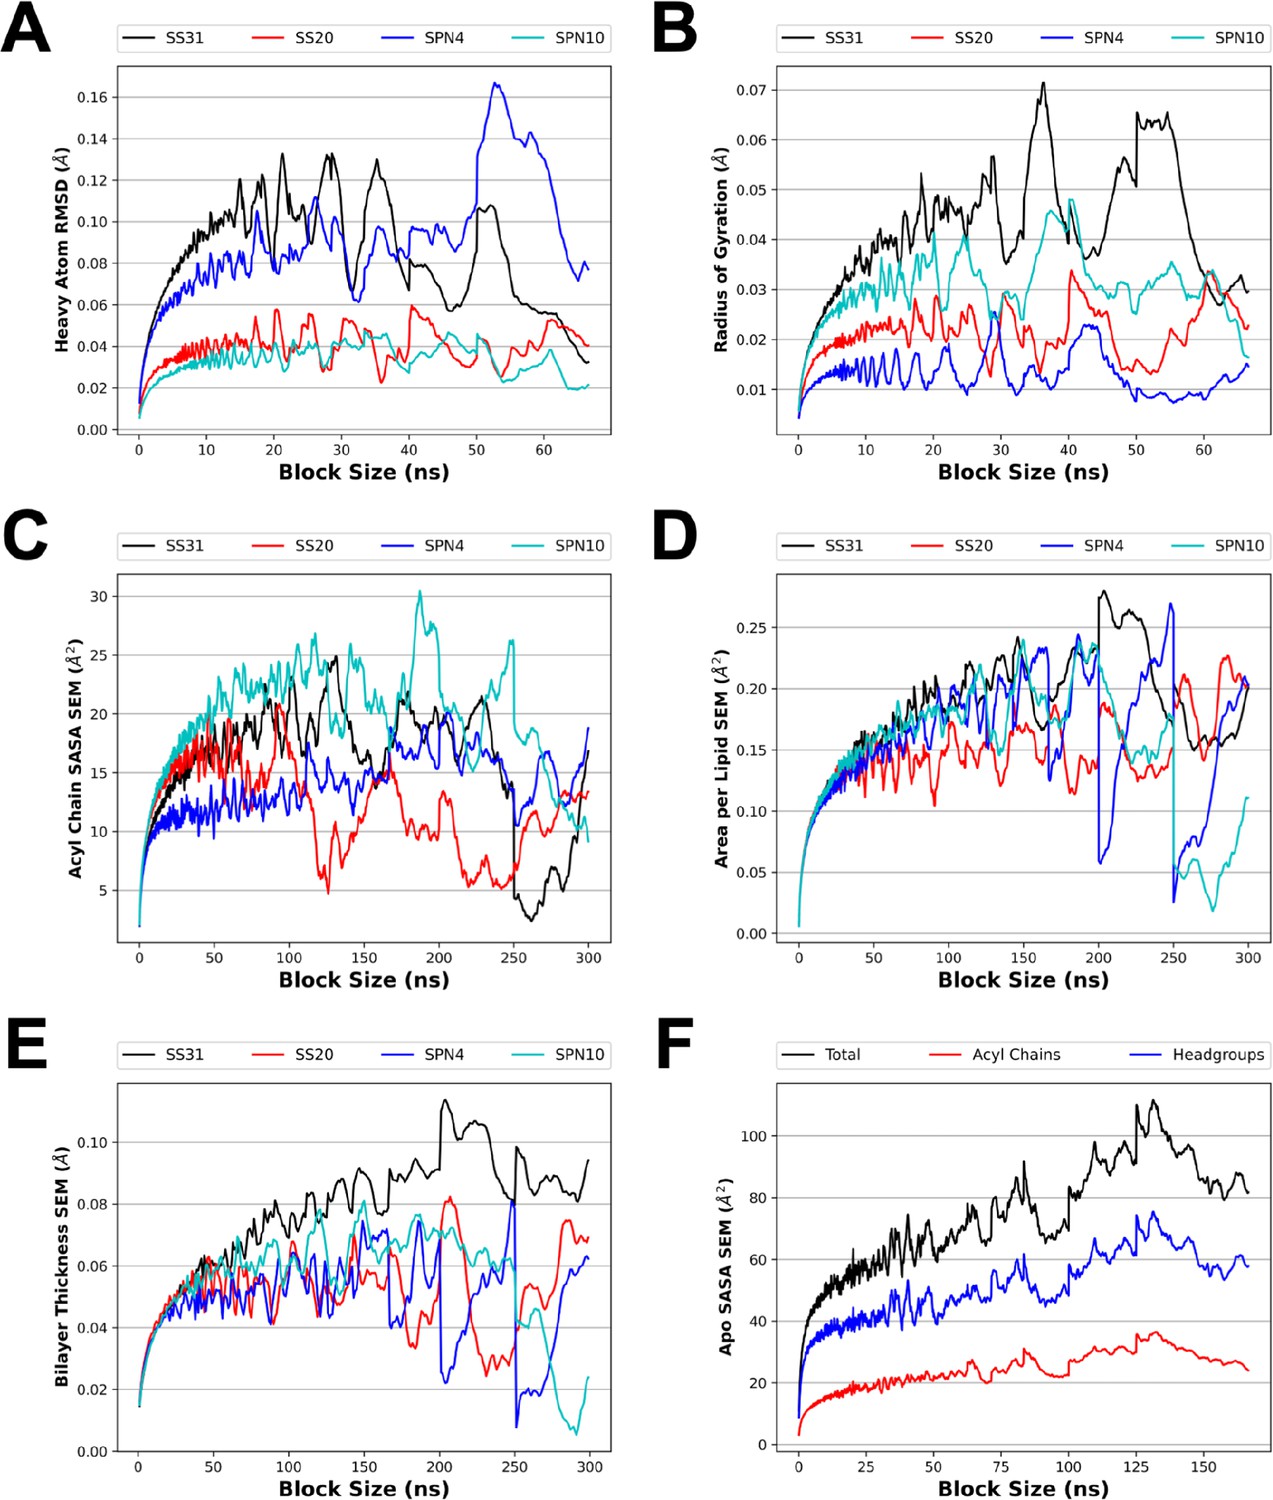
Blocked SE for several analyses from MD simulations.
To make optimal use of our sampling from the MD simulations, time course equilibrium data was divided into independent samples. Block averaging was used to select a time interval for which the data would be decorrelated with itself. The blocked SE was measured for the heavy atom root mean square deviation (RMSD; A) and radius of gyration (B) of the MD simulation of a single peptide in solution (A, B; see Figure 1C). The blocked SE was also measured for several membrane properties including solvent accessible surface area (SASA) (C and F; see Figure 4D), area per lipid (D; see Figure 4—figure supplement 7, panels C,D), and bilayer thickness (E; see Figure 4—figure supplement 7, panels A and B). The block sizes selected were 15 ns (A and B), 25 ns (F), and 50 ns (C, D, and E). The first block of simulation time was excluded from the block averaging analysis of SASA, area per lipid, and bilayer thickness to account for system relaxation.
Figure 5 with 1 supplement
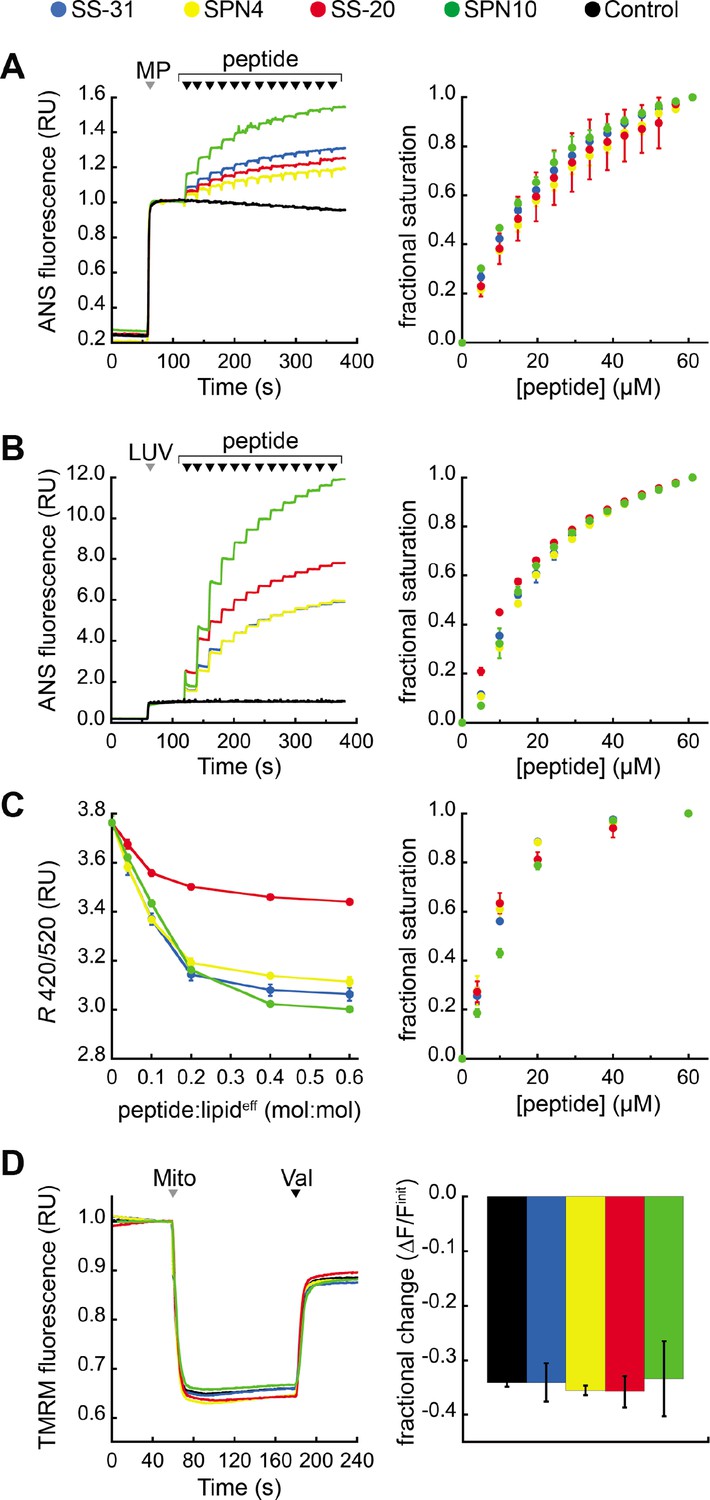
Effects of peptides on membrane electrostatic potentials.
(A,B) Effects on surface potential (ψs). Left: signal-averaged time courses of 1,8-ANS emission with addition of (A) mitoplasts (generated from Saccharomyces cerevisiae mitochondria, 200 µg total protein) or (B) 80:20 phosphatidylcholine (POPC):tetraoleoyl cardiolipin (TOCL) large unilamellar vesicles (LUVs) (100 nmol lipideff), shown by gray arrowheads (‘MP’ and ‘LUV’, respectively), followed by sequential addition of peptide (10 nmol each), shown by black arrowheads. All data normalized to emission with mitoplasts or LUVs only (60–120 s). Right: saturation binding curves taken from 1,8-ANS time course data. (C) Effects on dipole potential (ψd). Left: profile of di-8-ANEPPS measurements (R, ratio of 670 nm emission from 420 nm and 520 nm excitation peaks) in the presence of 80:20 POPC:TOCL LUVs (25 nmol lipideff). Right: saturation binding curves taken from ratiometric di-8-ANEPPS measurements. (D) Effects on transmembrane potential (ΔΨm). Left: signal-averaged time course profiles of TMRM emission with addition of mitochondria from S. cerevisiae (200 µg total protein) following preincubation with 10 μM of respective peptide (gray arrowhead, ‘Mito’) and addition of ionophore valinomycin (black arrowhead, ‘Val’). All data normalized to the pre-mitochondria addition mean (40–55 s). Right: fractional change in TMRM emission following mitochondria addition. All means and traces are from n=3 independent samples and all error bars indicate SD. Control, addition of peptide buffer vehicle only.
-
Figure 5—source data 1
Membrane electrostatic parameters: ANS mitoplasts, ANS liposomes, ANEPPS, and TMRM data.
- https://cdn.elifesciences.org/articles/75531/elife-75531-fig5-data1-v1.xlsx
Figure 5—figure supplement 1
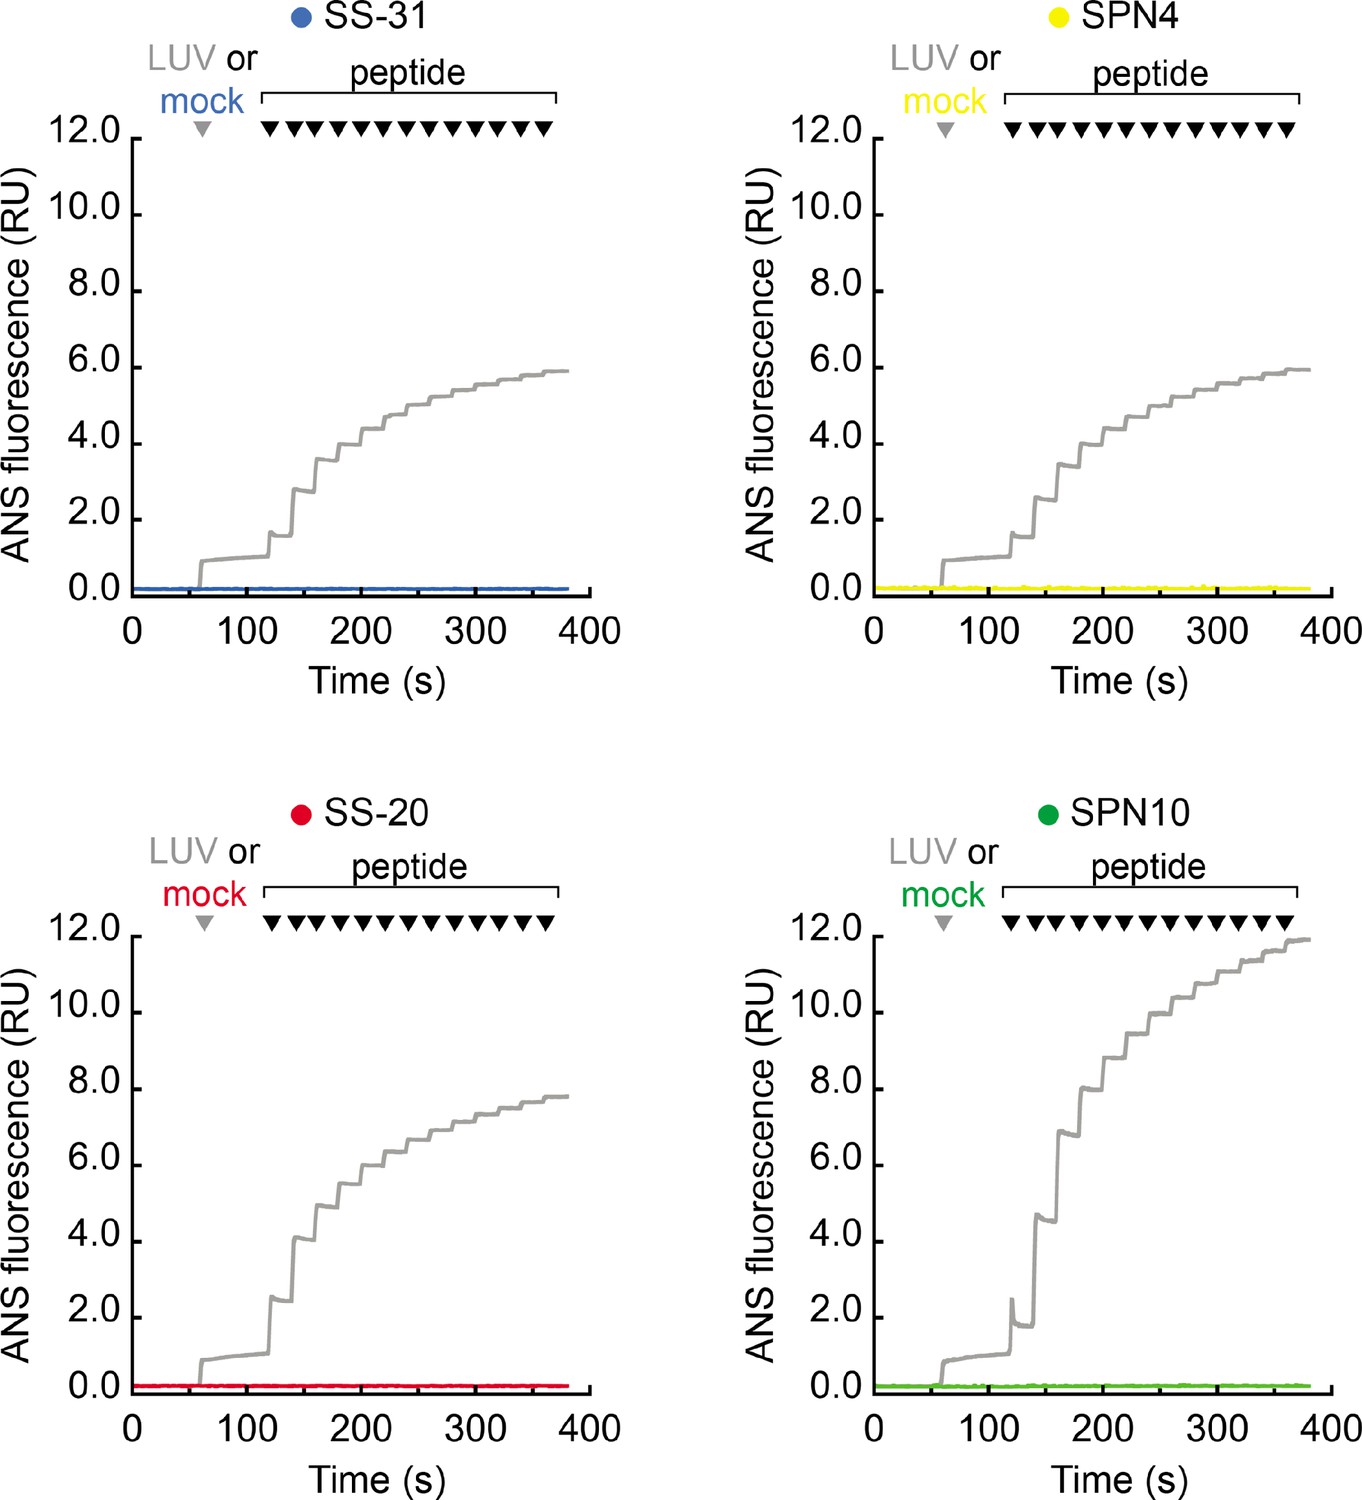
Emission of 1,8-ANS with peptide titration in the absence of membranes.
Time course measurements of 1,8-ANS fluorescence intensity performed as described in Figure 5B. The gray traces are taken directly from Figure 5B (shown here for comparison), where the gray arrowhead indicates the addition of large unilamellar vesicles (LUVs). Traces in color show mock reactions in which the gray arrowhead indicates the addition of LUV buffer only (no membranes added). In all cases, the indicated peptides were sequentially added (increments of 10 nmol), where indicated by black arrowheads.
-
Figure 5—figure supplement 1—source data 1
ANS data with and without membranes.
- https://cdn.elifesciences.org/articles/75531/elife-75531-fig5-figsupp1-data1-v1.xlsx
Figure 6 with 1 supplement
Cellular localization and efficacy of mitochondria-targeted peptides in cell culture.
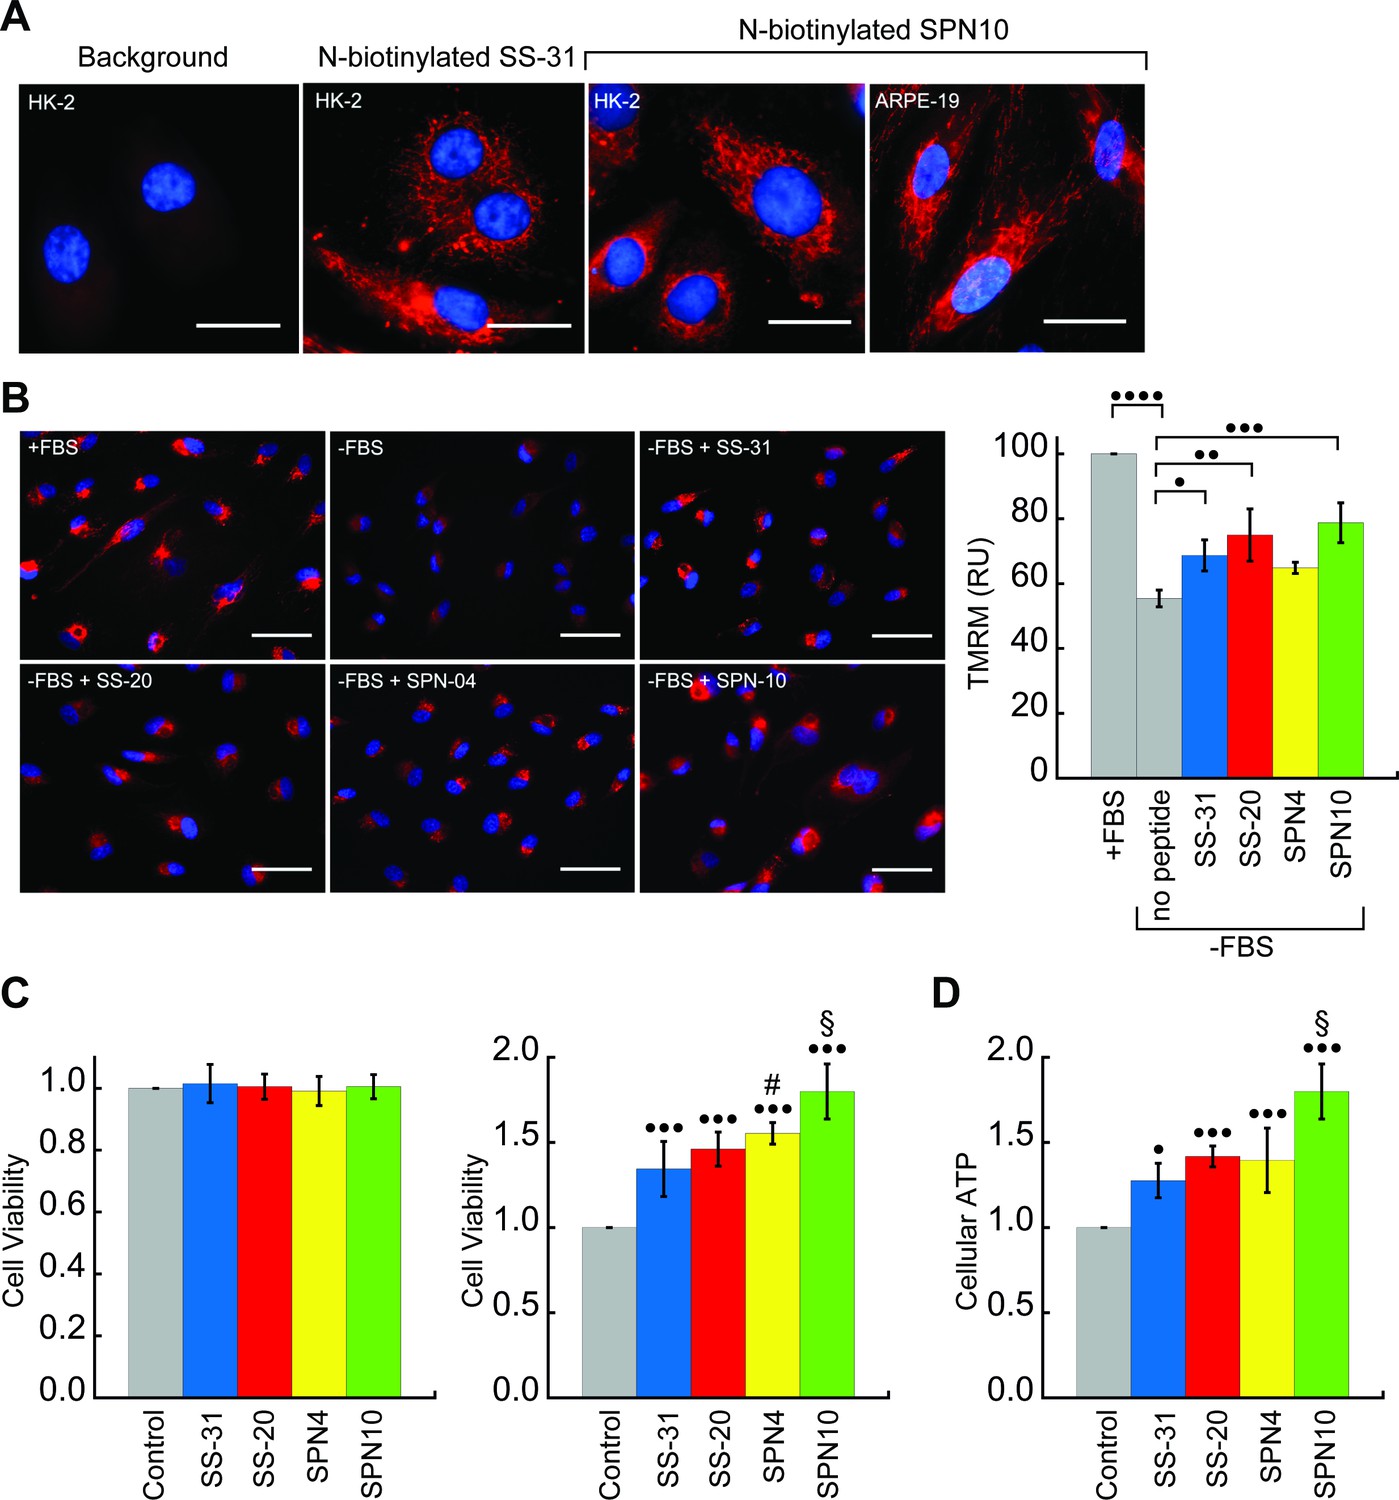
(A) Intracellular localization of peptides. Confocal microscopy images of N-biotinylated SS-31 (bio-SS-31) and N-biotinylated SPN10 (bio-SPN10) in human kidney epithelial cells (HK-2) and retinal pigment epithelial cells (ARPE-19) as indicated. Biotin was visualized with streptavidin-AlexaFluor 594 (red), and cell nuclei were stained with Hoechst 33342 (blue). Scale bars: 25 µm. (B) Peptide-dependent restoration of ΔΨm. ARPE-19 cells were grown with serum (+fetal bovine serum [FBS]) or subject to serum withdrawal for 3 days (−FBS) followed by incubation ± mitochondria-targeted peptides (10 nM), as indicated, for 2 hr prior to imaging. Left: representative fluorescence microscopy images show nuclei staining with Hoechst 33342 (blue) and mitochondria visualization with TMRM (red), which accumulates in a ΔΨm-dependent manner. Scale bars: 50 µm. Right: TMRM intensity was normalized to nuclear number per field. Means ± SD are from three independent experiments, and data were averaged from four to six random fields per experiment. Serum deprivation significantly reduced TMRM intensity (•••• p≤0.0001) and peptide treatment restored TMRM intensity to varying levels of significance relative to the no peptide control (• p≤0.05; •• p≤0.01; ••• p≤0.001). (C and D) Peptide-dependent protection of cell viability and ATP production. HK-2 cells grown without or with 7 days of serum deprivation in the absence or presence of mitochondria-targeted peptides (10 nM) as indicated. Reported values are normalized to the no peptide control. (C) Left: viability of cells grown 3 days under control conditions (Dulbecco’s Modified Eagle’s Medium [DMEM] supplemented with FBS); right: viability of cells subjected to 7 days of serum deprivation (DMEM only). (D) Cellular ATP levels of cells subjected to 7 days of serum deprivation. All means are from n=5–6 independent samples and all error bars indicate SD. Statistical comparisons show differences representing a comparison to vehicle-only control (• p≤0.01; ••• p≤0.0001) or comparison to SS-31 treatment (# p≤0.05; § p≤0.001). All statistical analyses in panels B–D represent one-way ANOVA with Tukey’s multiple comparison test.
-
Figure 6—source data 1
Cell culture data: TMRM, cell viability, and cellular ATP measurements.
- https://cdn.elifesciences.org/articles/75531/elife-75531-fig6-data1-v1.xlsx
Figure 6—figure supplement 1
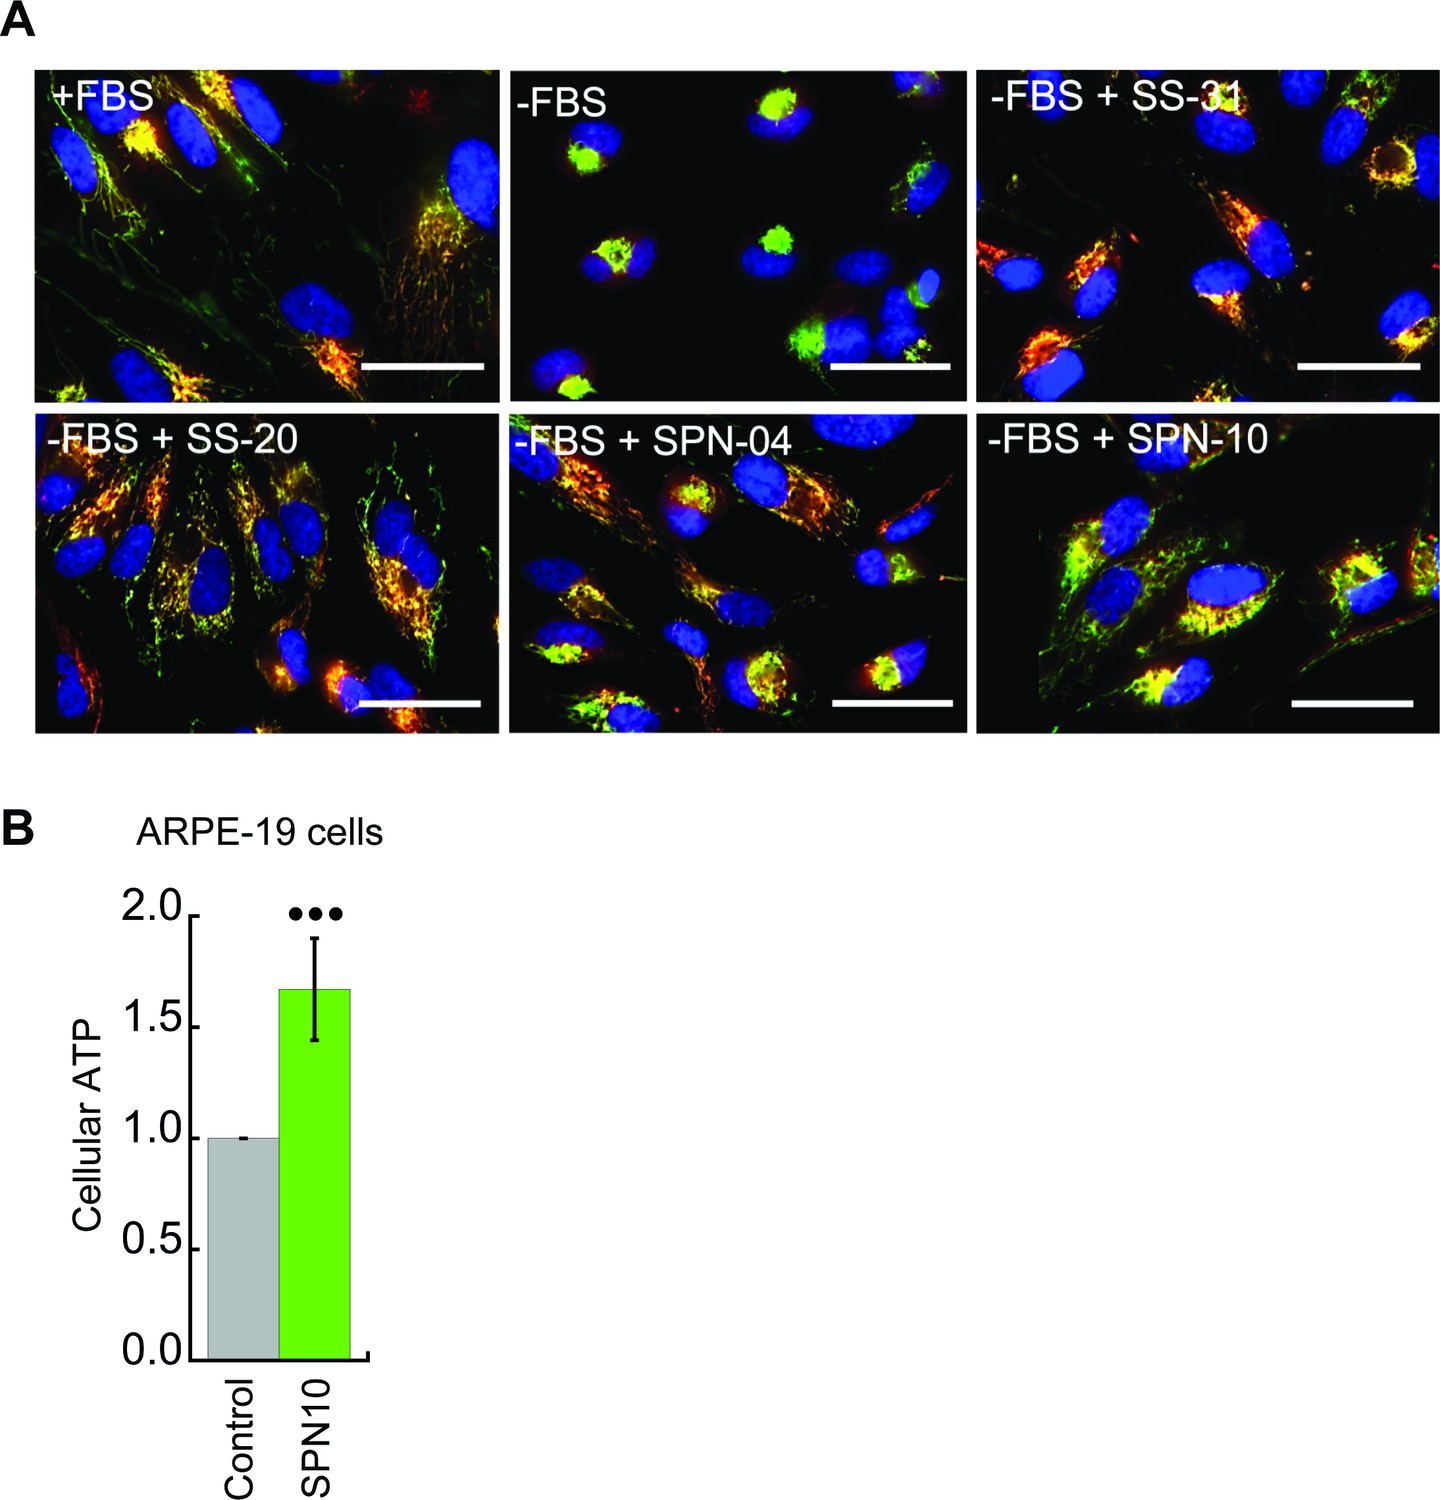
Peptide-dependent restoration of mitochondrial structure and ATP content with serum deprivation stress.
(A) Effects on mitochondrial morphology. Representative confocal images of human kidney epithelial cells (HK-2) taken under the same conditions of serum withdrawal as described in Figure 6B. Nuclei were visualized with Hoechst 33342 (blue). Mitochondria were visualized with probes that accumulate in a ΔΨm-dependent manner (TMRM, red) and in a ΔΨm-independent manner (MitoTracker Green, green). Scale bars: 50 µm. (B) Peptide-dependent restoration of ATP content. Retinal pigment epithelial cells (ARPE-19) were subjected to serum deprivation with SPN10 treatment (10 nM) or vehicle only exactly as described in Figure 6D (••• p≤0.0001 determined by one-way ANOVA with Tukey’s multiple comparison test).
-
Figure 6—figure supplement 1—source data 1
Cell culture data: cellular ATP measurements.
- https://cdn.elifesciences.org/articles/75531/elife-75531-fig6-figsupp1-data1-v1.xlsx
Tables
Author response table 1
| Peptide | LogP(o/w) | qPolariz (Å3) | FOSA (Å2) |
|---|---|---|---|
| SS-31 | -1.868 | 55.768 | 326.69 |
| SS-20 | -1.852 | 54.319 | 278.69 |
| SPN04 | -2.278 | 55.375 | 234.03 |
| SPN10 | -1.798 | 57.984 | 243.73 |
Additional files
-
Supplementary file 1
NMR chemical shift assignments for the peptides evaluateda,b.
- https://cdn.elifesciences.org/articles/75531/elife-75531-supp1-v1.docx
-
Supplementary file 2
Statistics for the 20 lowest-energy NMR structures of peptides in their free states.
- https://cdn.elifesciences.org/articles/75531/elife-75531-supp2-v1.docx
-
Supplementary file 3
Statistics for the 20 lowest-energy NMR structures of peptides in their bicelle-bound state.
- https://cdn.elifesciences.org/articles/75531/elife-75531-supp3-v1.docx
-
Supplementary file 4
Root mean square deviation (RMSD) and radius of gyration (Rg) values for NMR measurements and MD simulations.
- https://cdn.elifesciences.org/articles/75531/elife-75531-supp4-v1.docx
-
Supplementary file 5
Improved structural agreement between MD and NMR when imposing nuclear Overhauser effect (NOE) restraints.
- https://cdn.elifesciences.org/articles/75531/elife-75531-supp5-v1.docx
-
Supplementary file 6
Comparison of tetrapeptide analogs evaluated in this study.
- https://cdn.elifesciences.org/articles/75531/elife-75531-supp6-v1.docx
-
Transparent reporting form
- https://cdn.elifesciences.org/articles/75531/elife-75531-transrepform1-v1.docx
Download links
A two-part list of links to download the article, or parts of the article, in various formats.
Downloads (link to download the article as PDF)
Open citations (links to open the citations from this article in various online reference manager services)
Cite this article (links to download the citations from this article in formats compatible with various reference manager tools)
Structure-activity relationships of mitochondria-targeted tetrapeptide pharmacological compounds
eLife 11:e75531.
https://doi.org/10.7554/eLife.75531


