Glypican-1 drives unconventional secretion of fibroblast growth factor 2
- Heidelberg University, Biochemistry Center, Germany
- Institut für Chemie und Biochemie, Freie Universität Berlin, Germany
Figures
Figure 1
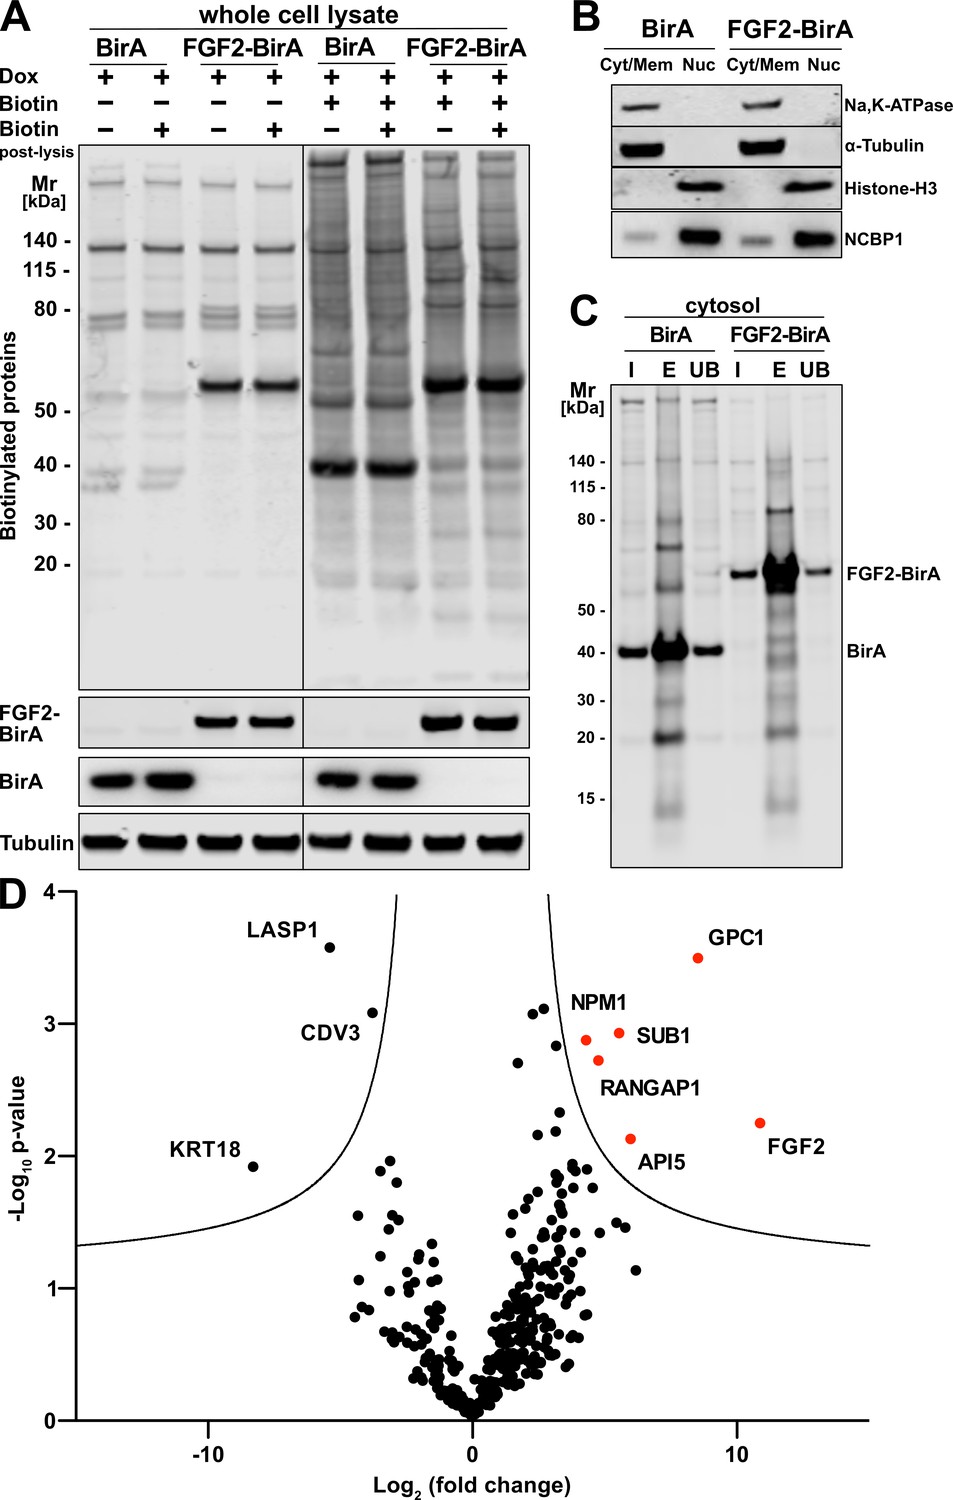
Glypican-1 (GPC1) and fibroblast growth factor 2 (FGF2) are in spatial proximity to a cellular context.
(A) HeLa S3 cells stably expressing either FGF2-BirA or myc-tagged BirA (control) in a doxycycline-dependent manner were cultured as detailed in the Materials and methods section. Whole cell lysates generated from the experimental conditions indicated were subjected to a Western blot analysis. Biotinylated proteins were identified with fluorescent streptavidin. The expression of the fusion proteins was tested with antibodies directed against FGF2 (for FGF2-BirA) or the myc epitope (for BirA). In all samples, tubulin was used as a loading control. (B) HeLa S3 cells expressing FGF2-BirA or myc-tagged BirA were fractionated into nuclei (Nuc) and cellular membranes plus cytosol (Cyt/Mem) as described in the Materials and methods section. The fractionation was controlled by markers for the plasma membrane (Na,K-ATPase), the cytosol (α-tubulin), and nuclear proteins (histone-H3 and NCBP1). (C) Large-scale preparations of nuclei-free fractions from both FGF2-BirA and myc-tagged BirA expressing cell lines containing biotinylated target proteins. Based on the Cyt/Mem fractionation shown in panel B, all biotinylated proteins were isolated using streptavidin beads. Following elution (lane ‘E’), all regions except those containing the BirA fusion proteins were extracted and subjected to a quantitative mass spectrometry analysis shown in panel D. For details see Materials and methods. (D) Biotinylated proteins identified by mass spectrometry and visualized by a Volcano plot indicating hits based on their relative abundance in FGF2-BirA versus myc-tagged BirA-expressing cells. The quantification was based on peptide intensities expressed as ‘x-fold change’ (log2; FGF2-BirA/myc-BirA). The experiment was performed in three replicates from which p-values (−log10) were calculated (unpaired t-test, two-sided). For further details, see Materials and methods.
-
Figure 1—source data 1
Raw data of the BioID screening procedure identifying proteins in proximity to fibroblast growth factor 2 (FGF2) in intact cells.
- https://cdn.elifesciences.org/articles/75545/elife-75545-fig1-data1-v2.xlsx
Figure 2 with 2 supplements
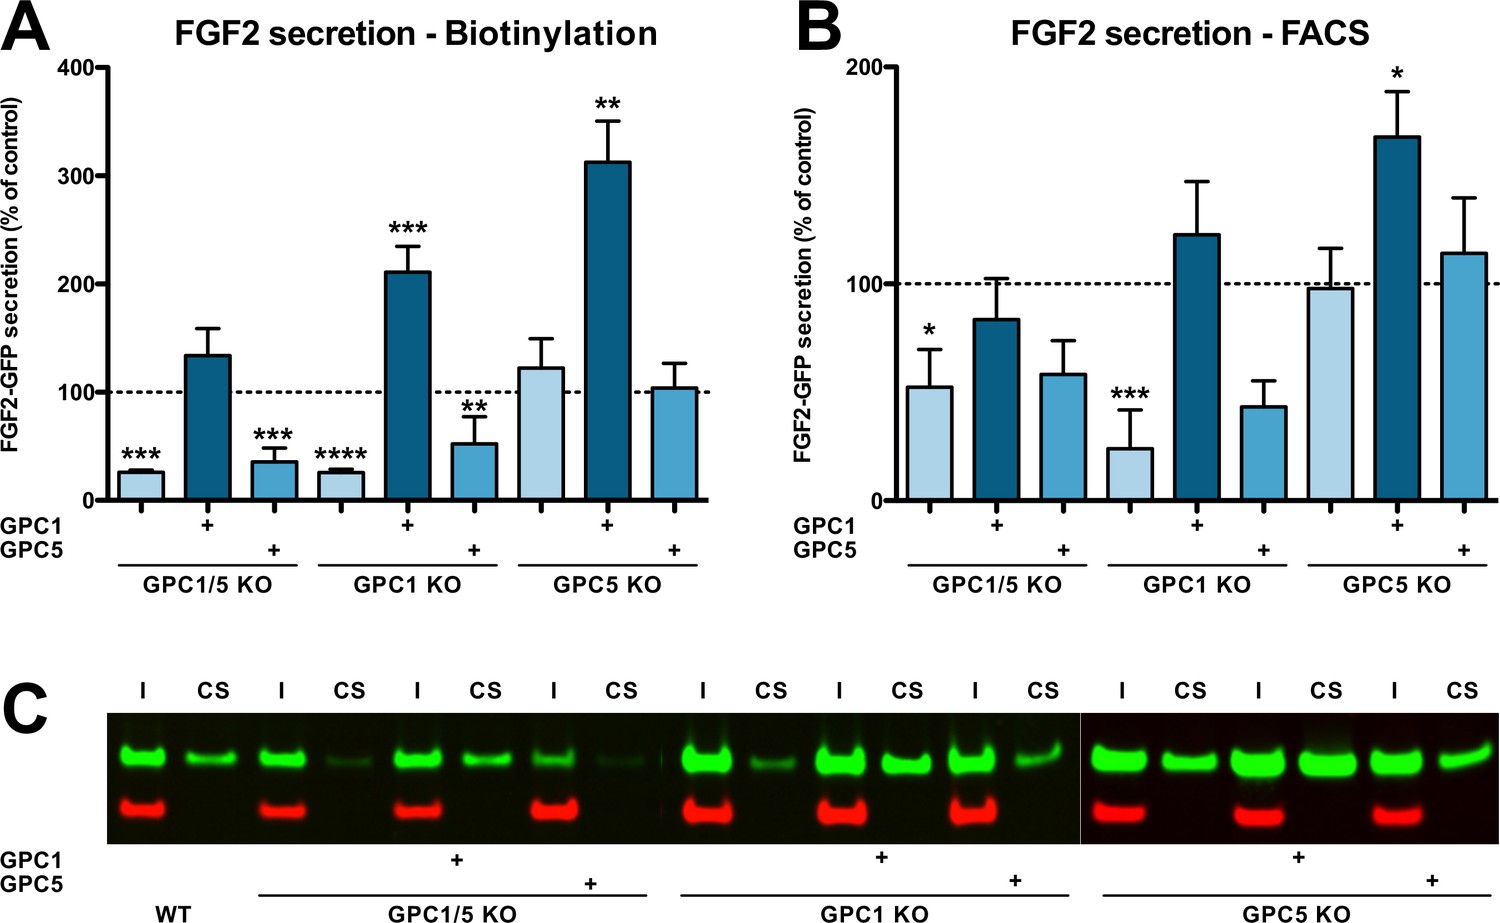
Efficient secretion of fibroblast growth factor 2 (FGF2) to cell surfaces depends on Glypican-1 (GPC1).
(A) Quantitative analysis of FGF2 secretion under the experimental conditions indicated measured by cell surface biotinylation. Standard deviations are shown (n = 4). (B) Quantitative analysis of FGF2 secretion under the experimental conditions indicated measured by analytical flow cytometry. Standard deviations are shown (n = 5). (C) Representative example of a cell surface biotinylation experiment used for the quantitative analysis and statistics shown in panel A (I = input; CS = cell surface). Statistical analyses were based on a two-tailed t-test (*, p ≤ 0.05; **, p ≤ 0.01, and ***, p ≤ 0.001). For details, see Materials and methods.
-
Figure 2—source data 1
Raw data of the cell surface biotinylation and flow cytometry experiments quantifying fibroblast growth factor 2 (FGF2) secretion under the conditions indicated.
- https://cdn.elifesciences.org/articles/75545/elife-75545-fig2-data1-v2.xlsx
Figure 2—figure supplement 1
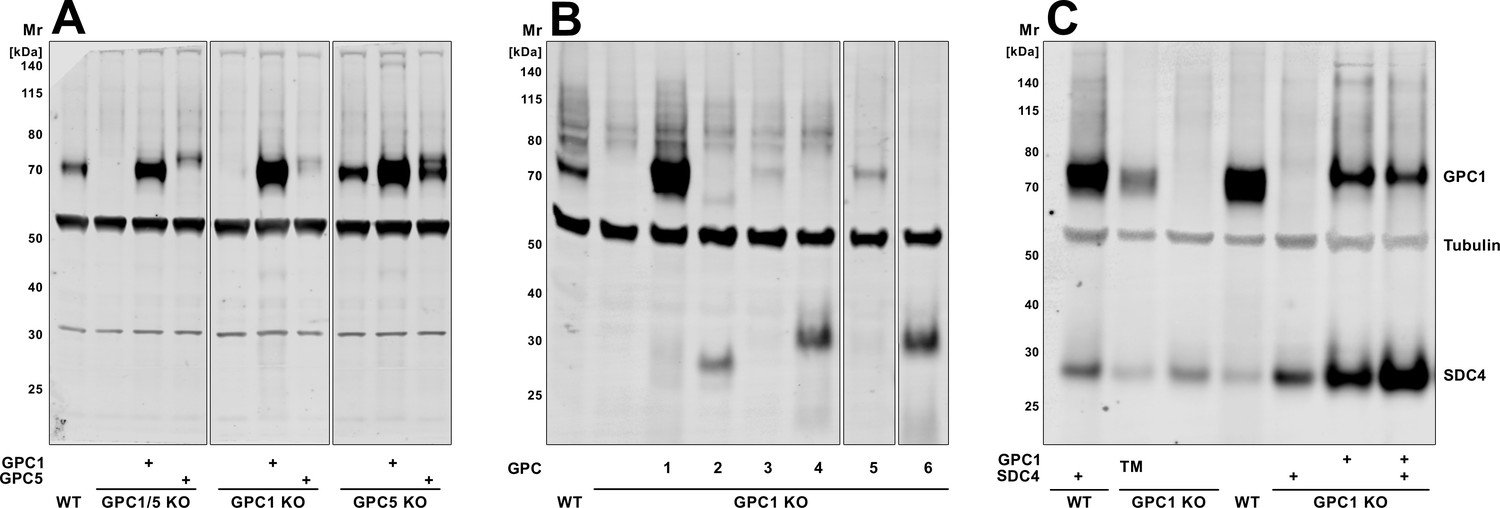
Characterization of engineered HeLa S3 cells used to quantify fibroblast growth factor 2 (FGF2) secretion efficiencies.
(A) HeLa S3 cell lines with different knockout backgrounds along with overexpression of Glypican-1 (GPC1) and GPC5, respectively, as indicated. (B) HeLa S3 cell lines with a GPC1 knockout background along with overexpression of GPC family members as indicated. (C) HeLa S3 cell lines with a GPC1 knockout background along with overexpression of either GPC1, SDC4, or a GPC1 construct in which the glycosylphosphatidylinositol (GPI) anchor was replaced by a transmembrane span derived from SDC4. All panels represent Western analyses following digestion with heparinase III using antibodies directed against the heparan sulfate attachment site (3G10) to detect the proteins indicated. For experimental details, see Materials and methods.
Figure 2—figure supplement 2
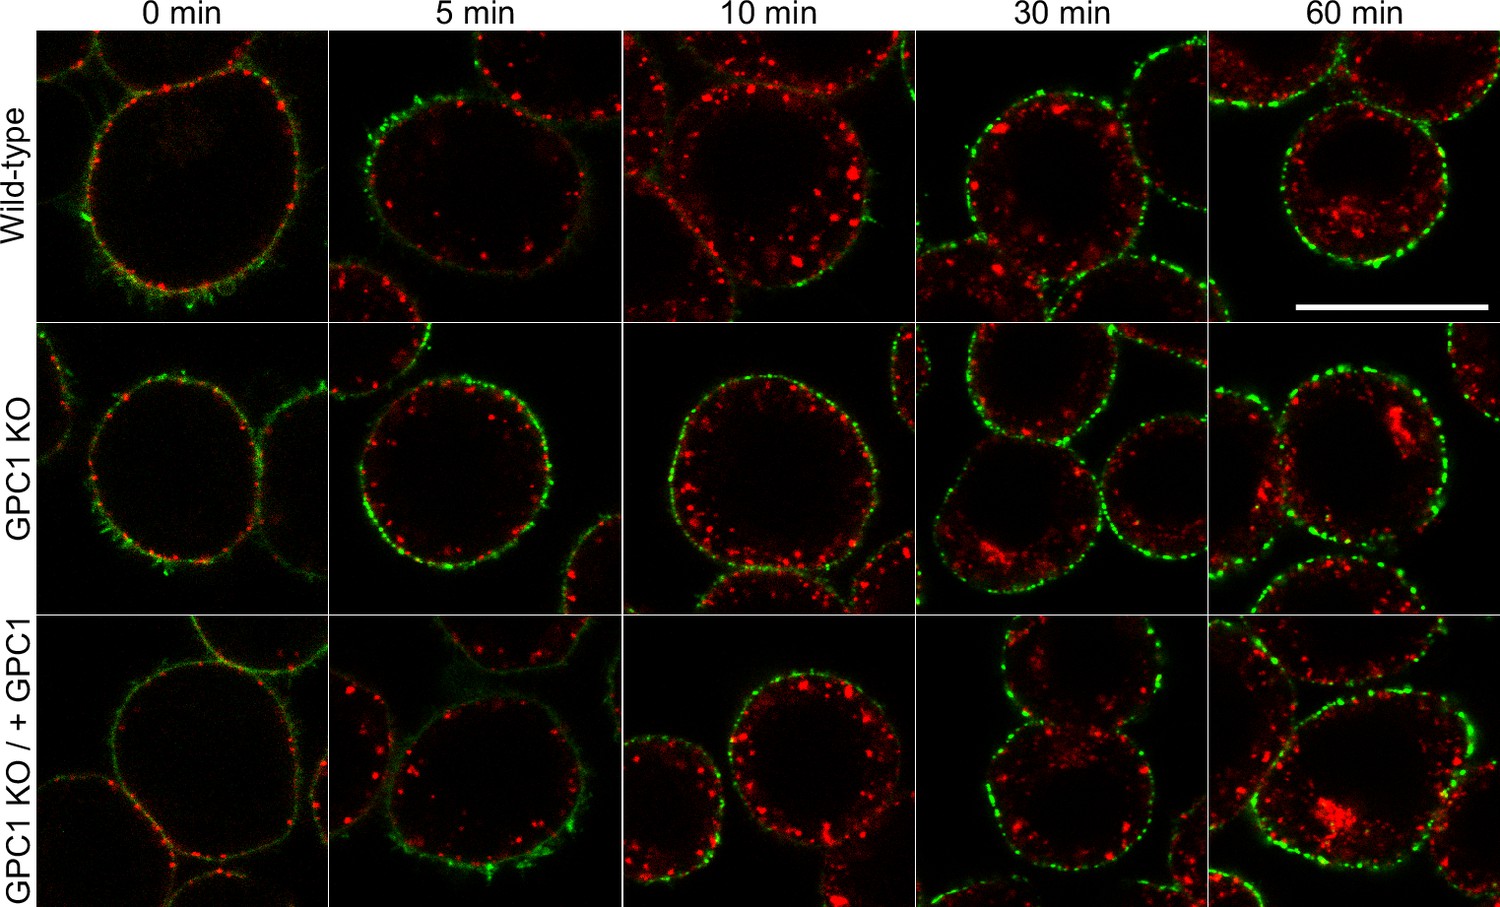
Visualization of endocytosis of fluorescent transferrin versus fibroblast growth factor 2 (FGF2)-GFP in HeLa S3 cells comparing wild-type, Glypican-1 (GPC1) knockout and GPC1 knockout plus GPC1 overexpression conditions.
Endocytosis of recombinant FGF2-GFP (5 µg/ml, in green) and Transferrin-Alexa Fluor546 (25 µg/ml, in red) was visualized for the times indicated in HeLa S3 wild-type, GPC1 knockout, and GPC1 knockout cells overexpressing GPC1. The data shown are representative for three independent experiments. Scale bar = 20 µm.
Figure 3
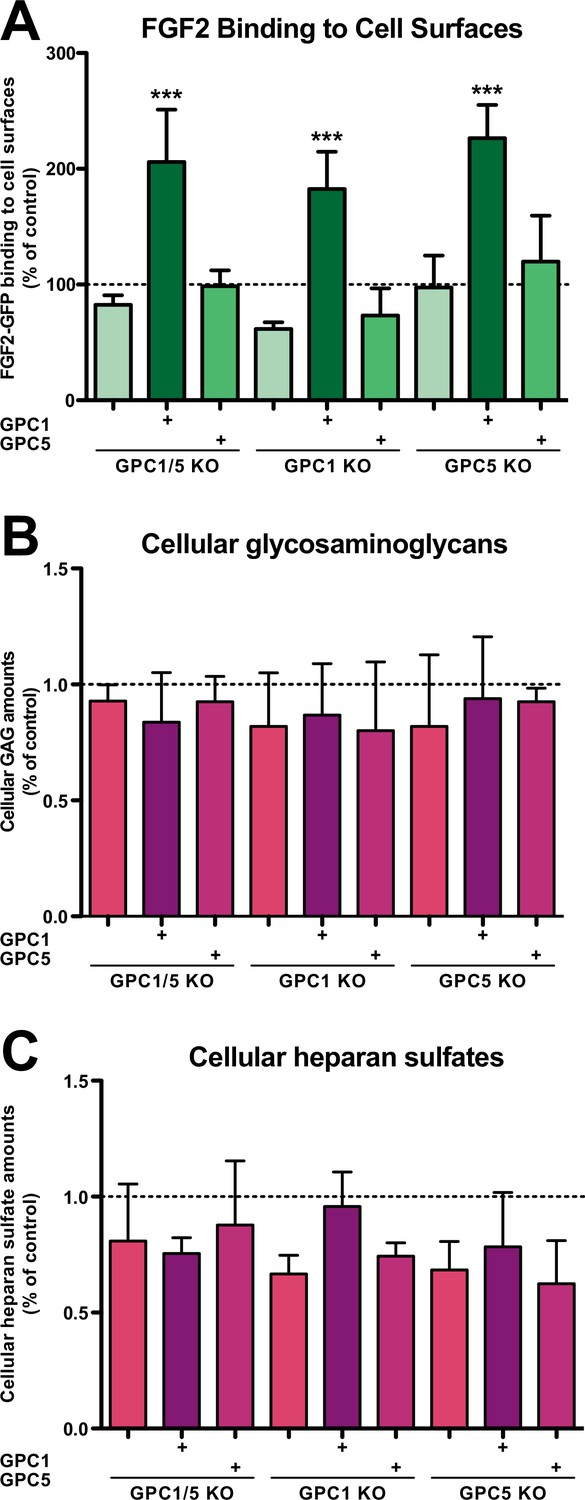
Fibroblast growth factor 2 (FGF2)-GFP binding to cell surfaces is increased in Glypican-1 (GPC1)-overexpressing cells.
(A) Quantitative analysis of the FGF2-GFP binding capacity of cell surfaces under the experimental conditions indicated using flow cytometry. Standard deviations are shown (n = 5). Statistical significance was analyzed using a one-way ANOVA test combined with Tukey’s post hoc test (*, p ≤ 0.05; **, p ≤ 0.01, and ***, p ≤ 0.001). (B) Quantification of the total amounts of GAG chains under the experimental conditions indicated. Standard deviations are shown (n = 4). Statistical significance was analyzed using a one-way ANOVA test combined with Tukey’s post hoc test (*, p ≤ 0.05; **, p ≤ 0.01, and ***, p ≤ 0.001). (C) Quantification of the total amounts of heparan sulfate chains under the experimental conditions indicated. Standard deviations are shown (n = 3). Statistical significance was analyzed using a one-way ANOVA test combined with Tukey’s post hoc test (*, p ≤ 0.05; **, p ≤ 0.01, and ***, p ≤ 0.001). For details, see Materials and methods.
-
Figure 3—source data 1
Raw data of experiments quantifying fibroblast growth factor 2 (FGF2) binding to cell surfaces as well as glycosaminoglycan and heparan sulfate contents of cells under the conditions indicated.
- https://cdn.elifesciences.org/articles/75545/elife-75545-fig3-data1-v2.xlsx
Figure 4
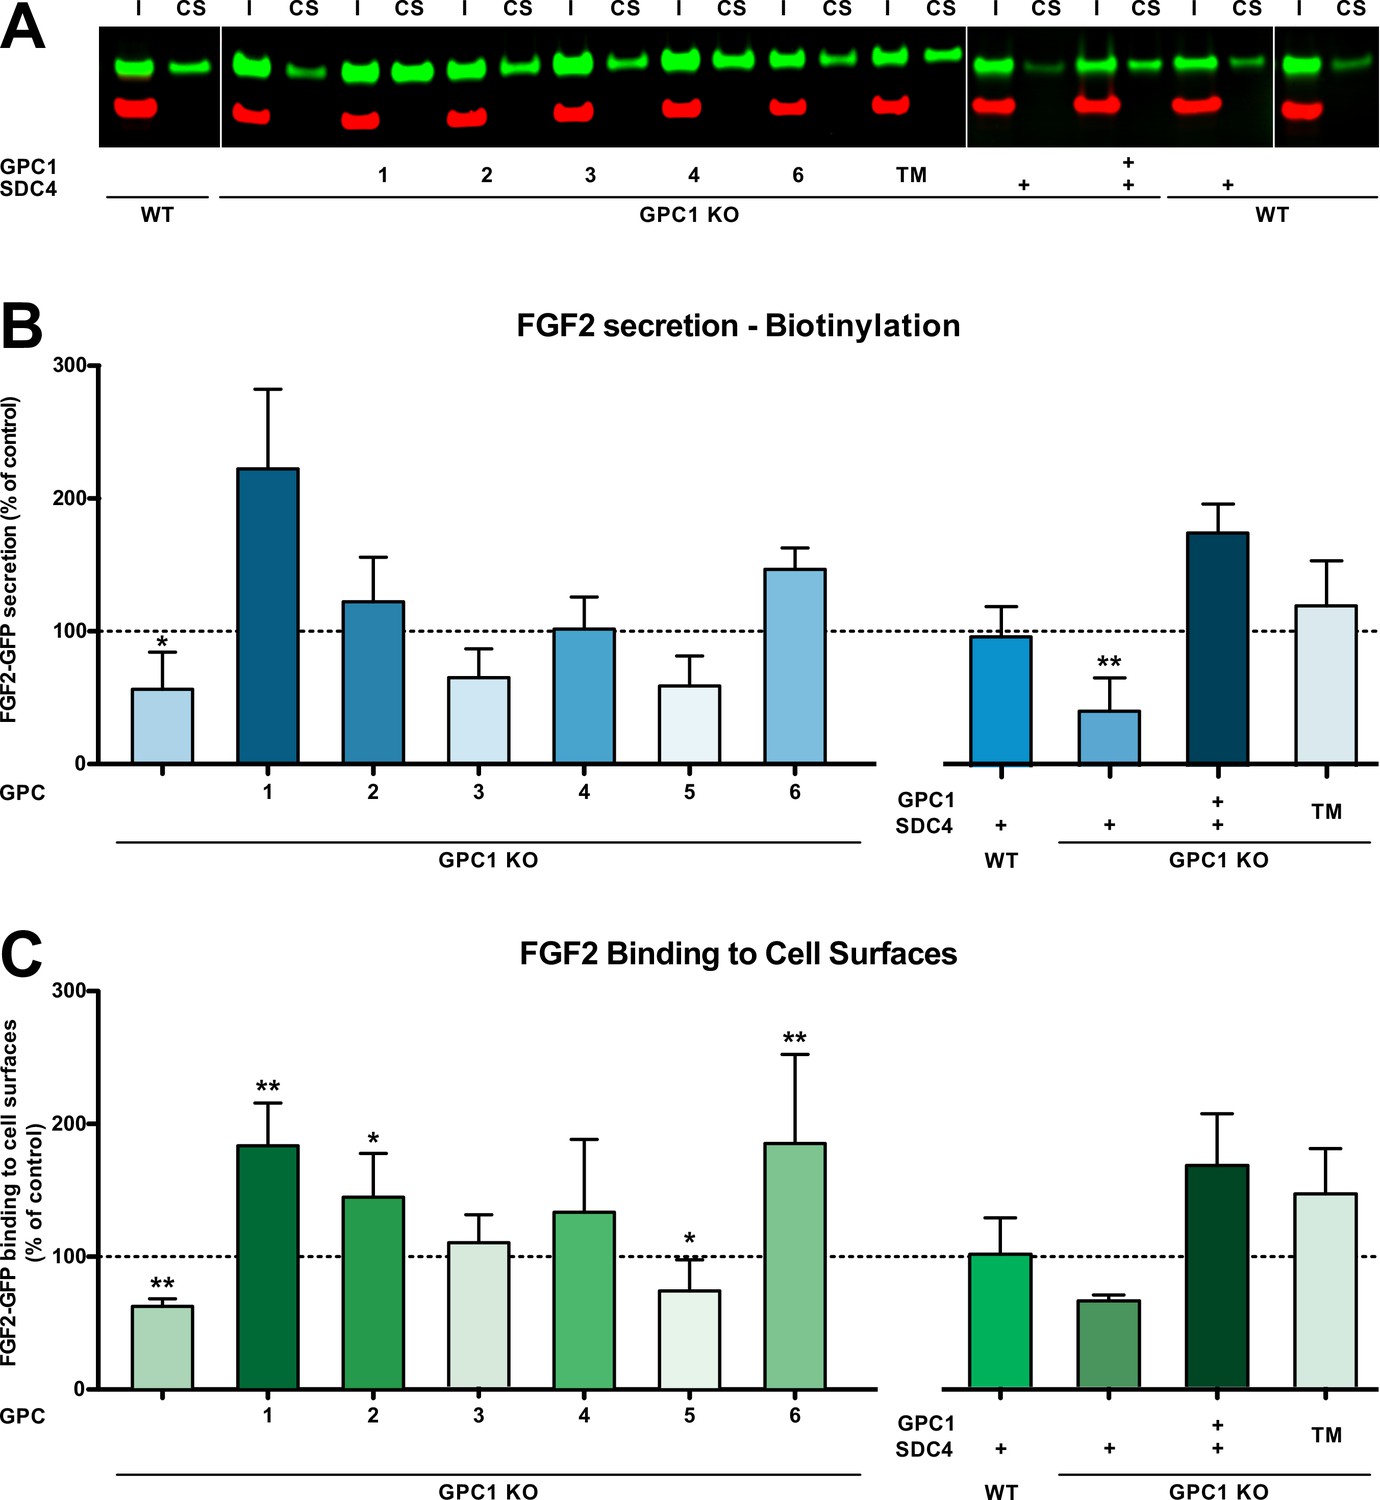
Glypican-1 (GPC1) is the principal heparan sulfate proteoglycan involved in unconventional secretion of fibroblast growth factor 2 (FGF2).
(A) Representative example for the raw data of cell surface biotinylation experiments used to quantify and to statistically evaluate unconventional secretion of FGF2 under the conditions indicated (I = input; CS = cell surface). Standard deviations are shown (n = 5). (B) Quantitative comparison of all six GPC family members, GPC1 with a transmembrane anchor (‘TM’) and SDC4 (syndecan 4) with regard to their potential to drive FGF2 secretion upon overexpression in a GPC1 knockout background based on cell surface biotinylation experiments. Standard deviations are shown (n = 5). (C) Quantitative comparison of all six GPC family members, GPC1 with a transmembrane anchor (‘TM’) and SDC4 (syndecan 4) with regard to their potential to affect the cell surface binding capacities for FGF2-GFP. FGF2-GFP binding to cell surfaces was analyzed by flow cytometry. Standard deviations are shown (n = 4). Statistical analyses were based on a two-tailed t-test (*, p ≤ 0.05; **, p ≤ 0.01, and ***, p ≤ 0.001). For details, see Materials and methods.
-
Figure 4—source data 1
Raw data of the cell surface biotinylation and flow cytometry experiments quantifying fibroblast growth factor 2 (FGF2) secretion and FGF2 cell surface binding under the conditions indicated.
- https://cdn.elifesciences.org/articles/75545/elife-75545-fig4-data1-v2.xlsx
Figure 5
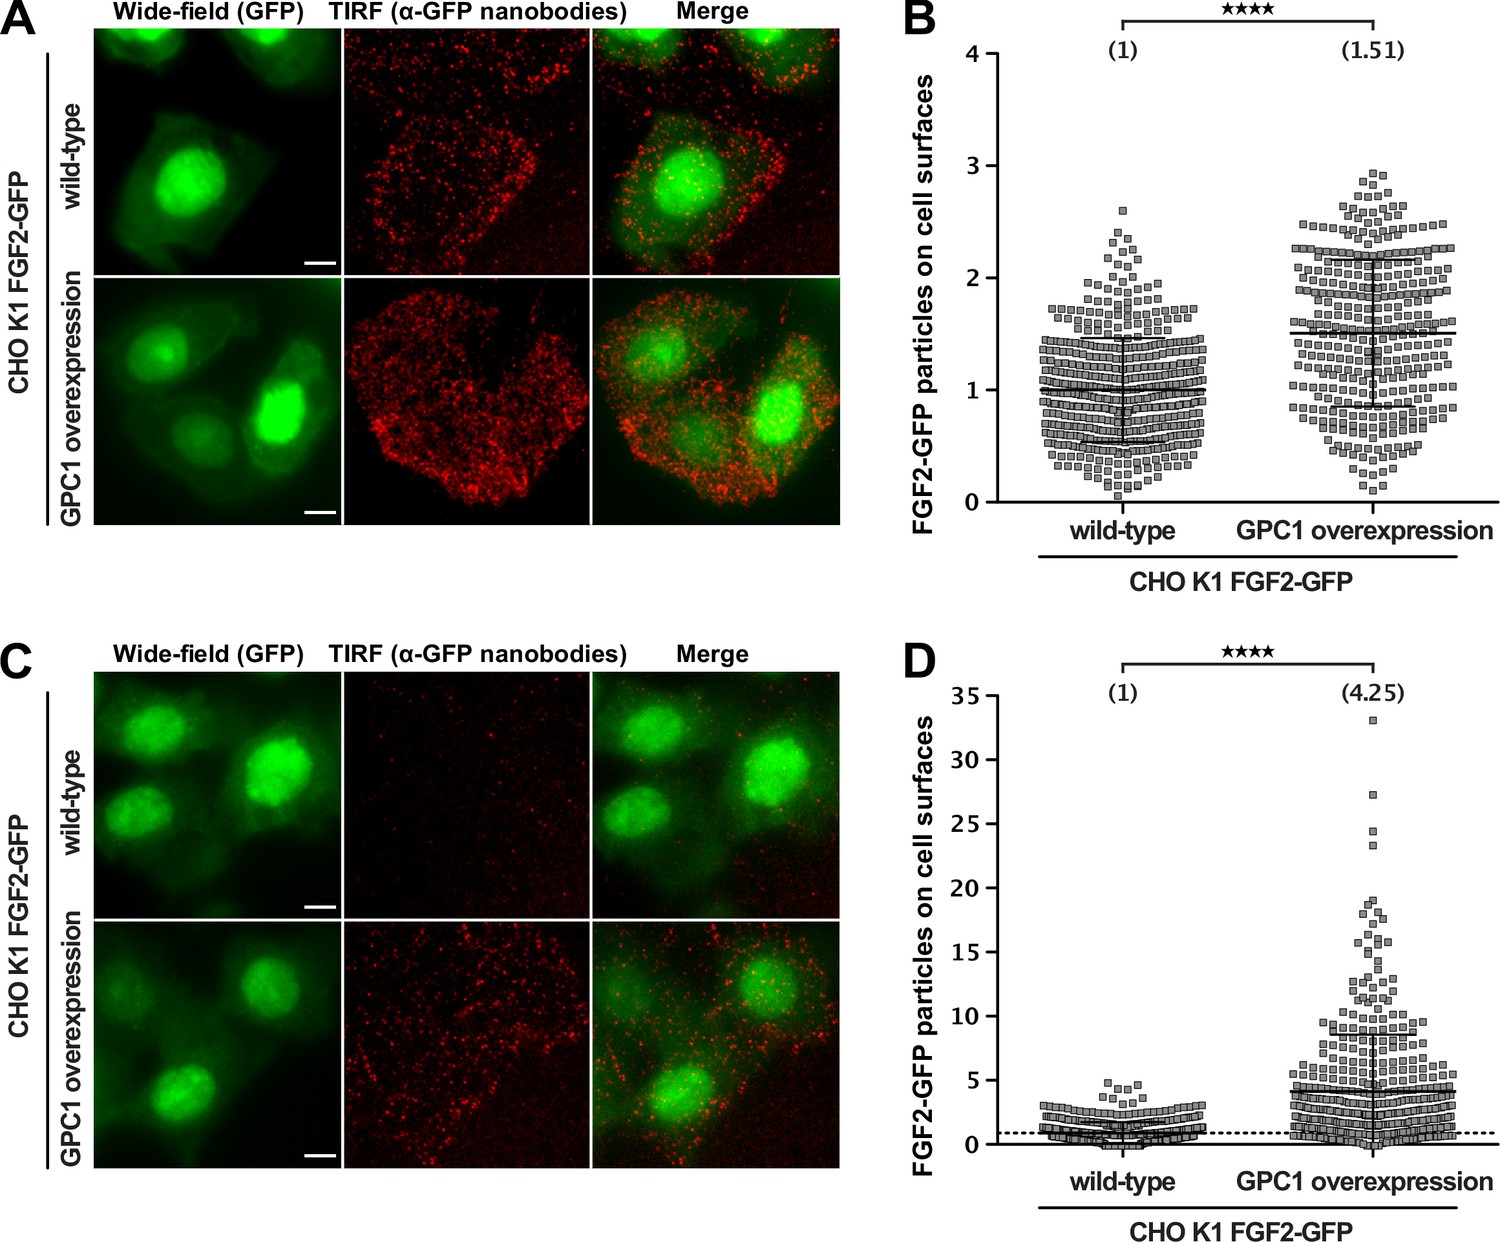
Glypican-1 (GPC1) overexpression results in increased fibroblast growth factor 2 (FGF2) secretion efficiencies.
FGF2 secretion efficiencies in wild-type and GPC1-overexpressing cells were assessed by TIRF microscopy using anti-GFP nanobodies to detect single FGF2-GFP molecules on cell surfaces as described earlier (Dimou et al., 2019). For details, see Materials and methods.
(A) Representative examples under experimental conditions at high FGF2-GFP expression levels. (B) Quantification and statistical analysis of experiments corresponding to the experimental conditions shown in panel A. (C) Representative examples under experimental conditions at low FGF2-GFP expression levels. EM Gain of the wide-field (GFP) was increased for this condition, in order to allow selection of cell area for subsequent quantification. (D) Quantification and statistical analysis of experiments corresponding to the experimental conditions shown in panel B. Data are shown as mean ± SD (n = 4) (panels B and D). The secretion efficiency of the wild-type cells was set to 1; in panel D, a dotted line was put at 1, to facilitate visualization. The statistical analysis was based on an unpaired t-test (****, p < 0.0001).
-
Figure 5—source data 1
Raw data of the cell-based TIRF experiments quantifying fibroblast growth factor 2 (FGF2) recruitment at the inner plasma membrane leaflet and FGF2 translocation to the outer plasma membrane leaflet under the conditions indicated.
- https://cdn.elifesciences.org/articles/75545/elife-75545-fig5-data1-v2.xlsx
Figure 6 with 2 supplements

Glypican-1 (GPC1) and fibroblast growth factor 2 (FGF2) form a strong pair of interaction partners.
Recombinant constructs encoding soluble ectodomains of GPC1 (panel A), GPC1 ΔHS (panel B; a mutant form to which heparan sulfate chains cannot be added), GPC5 (panel C), GPC6 (panel D), and SDC4 (panel E; a member of the syndecan family of heparan sulfate proteoglycans) were expressed and purified from HEK293 cells (see Figure 6—figure supplement 1). Using biolayer interferometry, interactions studies with temporal resolution visualizing both association and dissociation kinetics were conducted with purified FGF2 (Figure 6—figure supplement 1) at the concentrations indicated. The data shown are representative for two independent experiments. Experimental details are given in the Materials and methods section.
Figure 6—figure supplement 1
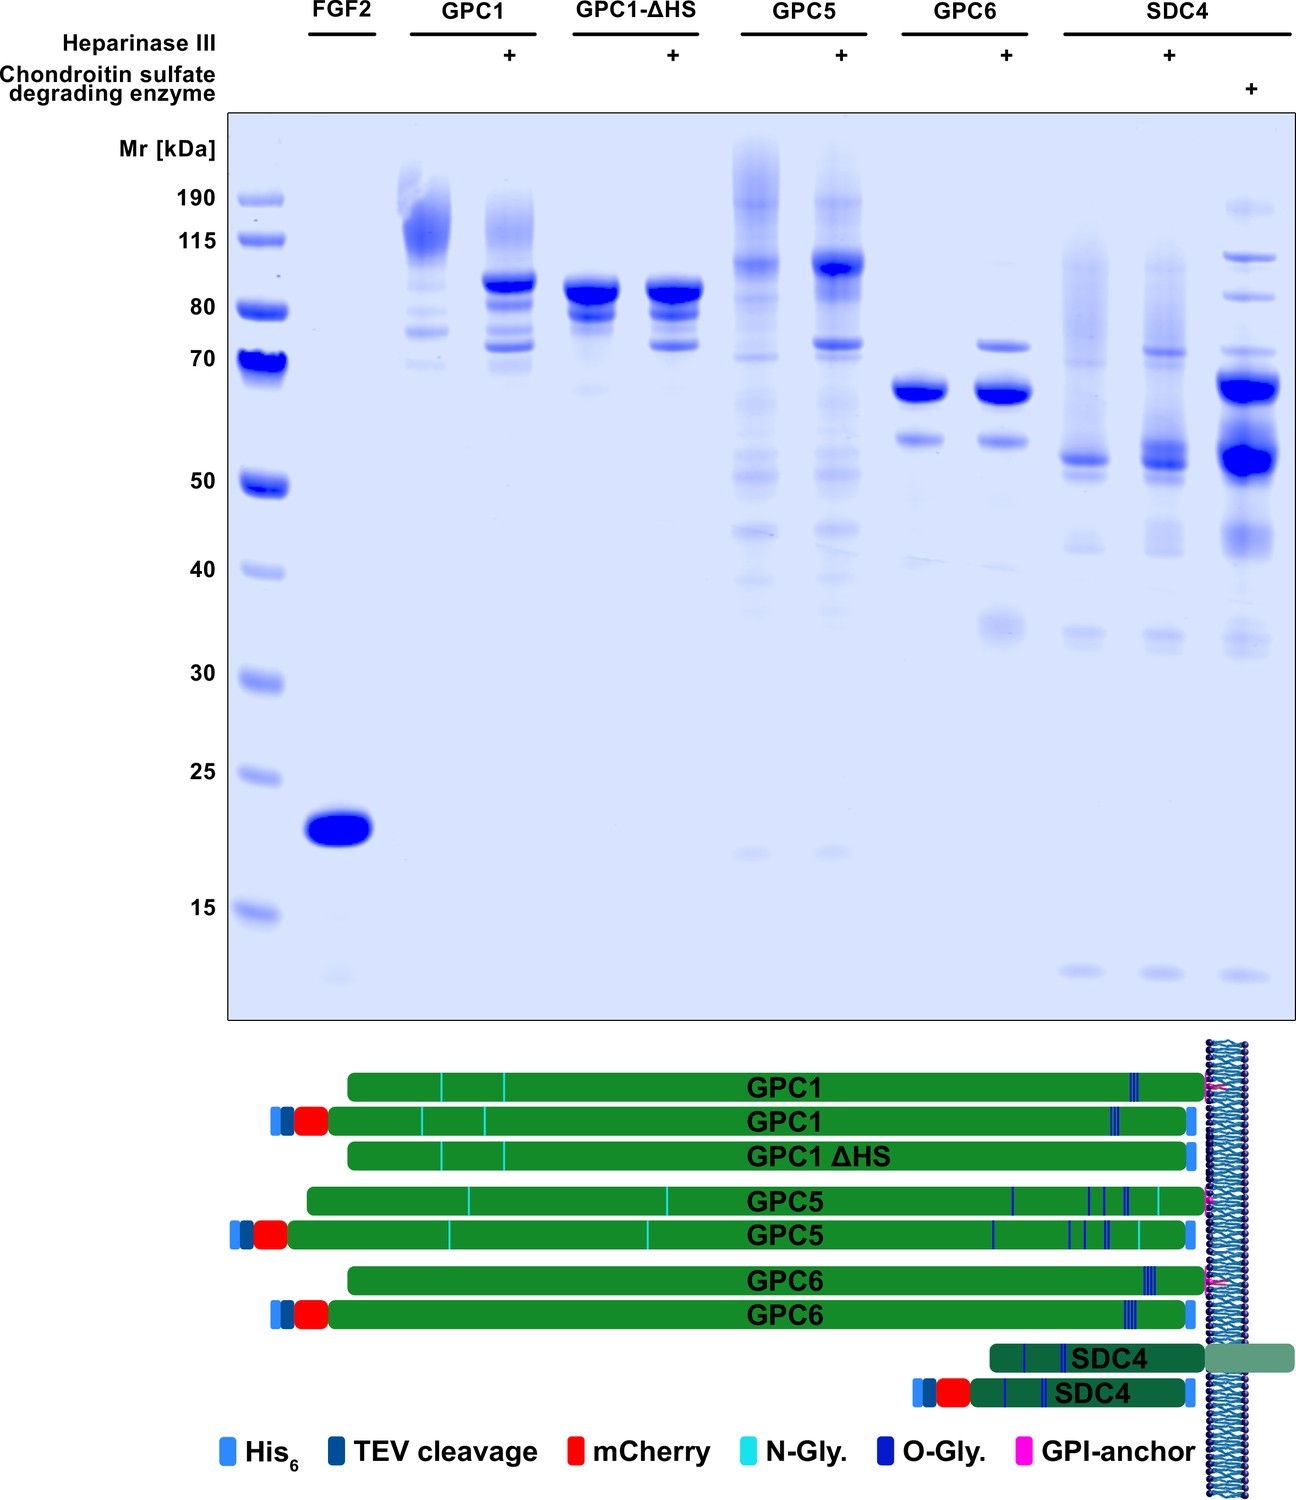
Expression and purification of soluble recombinant forms of fibroblast growth factor 2 (FGF2) and the various heparan sulfate proteoglycans.
FGF2 was expressed and purified from Escherichia coli cells. All heparan sulfate proteoglycans indicated were expressed and purified from HEK293 cells. For details, see Materials and methods. Upper panel: SDS-PAGE analysis of all purified proteins (Coomassie staining). Lower panel: Schematic description of constructs used in this study in comparison to the endogenous forms.
-
Figure 6—figure supplement 1—source data 1
Unprocessed and uncropped image file of a SDS-PAGE analysis of the recombinant forms of GPC family members and fibroblast growth factor 2 (FGF2) used in the BLI experiments shown in Fig.
- https://cdn.elifesciences.org/articles/75545/elife-75545-fig6-figsupp1-data1-v2.zip
Figure 6—figure supplement 2
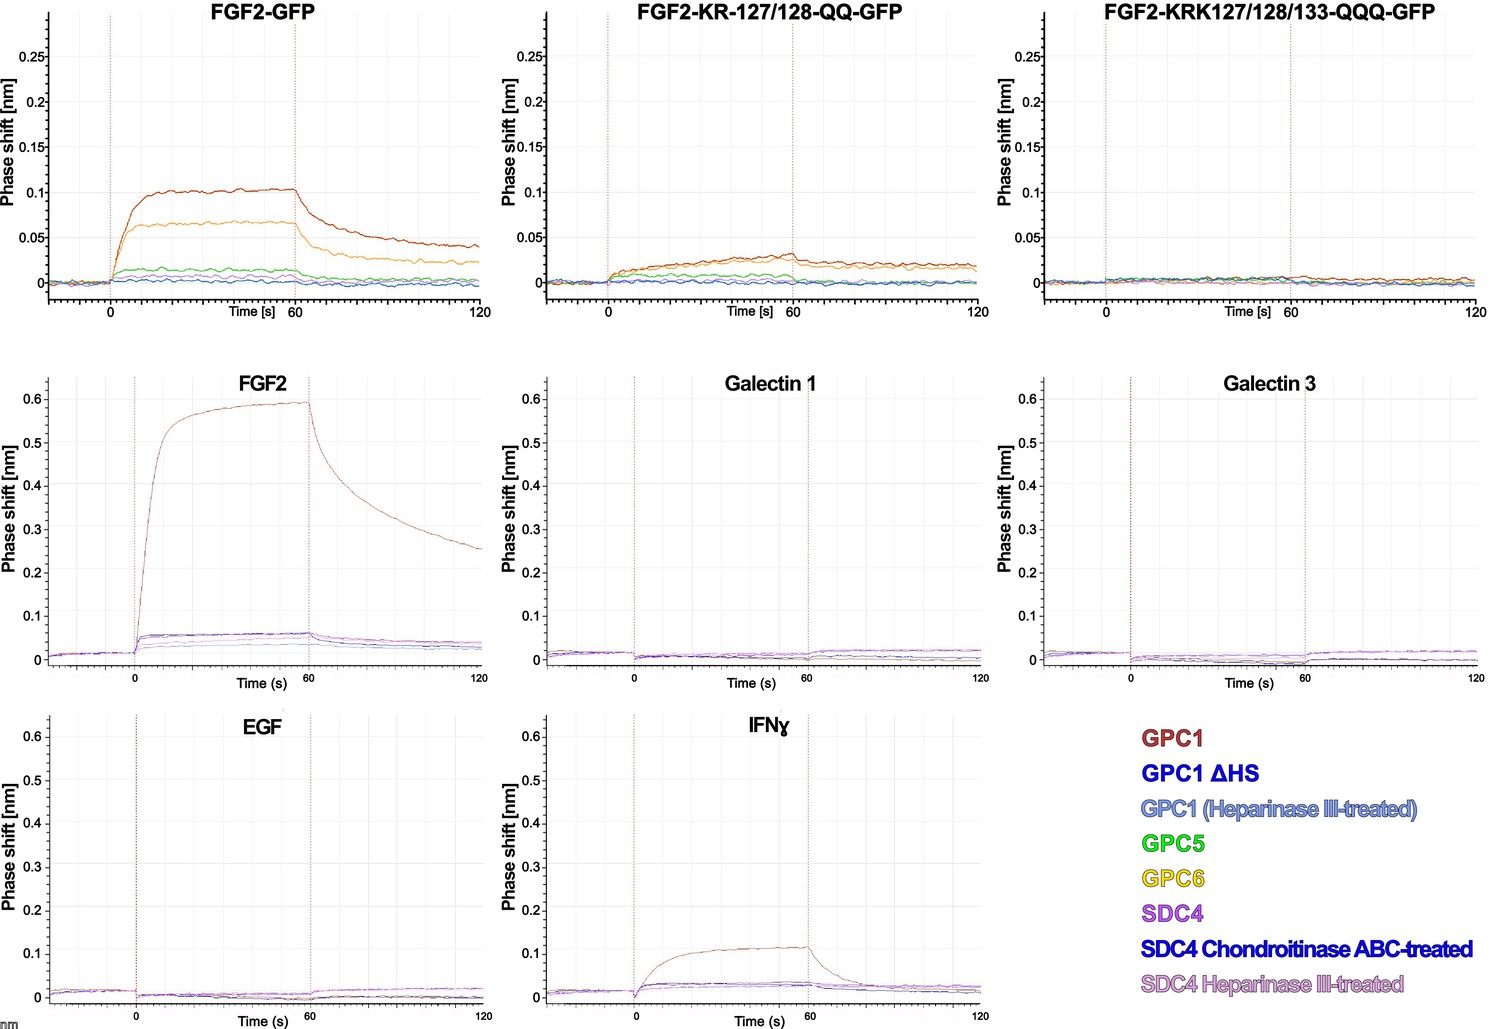
Interaction studies between different kinds of heparan sulfate proteoglycans and growth factors or cytokines using biolayer interferometry.
Heparan sulfate proteoglycans were loaded onto BLI sensors as indicated by the color code. In some cases, they were treated with heparinase III or chondroitinase ABC as indicated. The binding partners were used in solution at a concentration of 60 nM. The data shown are representative for two independent experiments. For details, see Materials and methods.
Figure 7 with 1 supplement
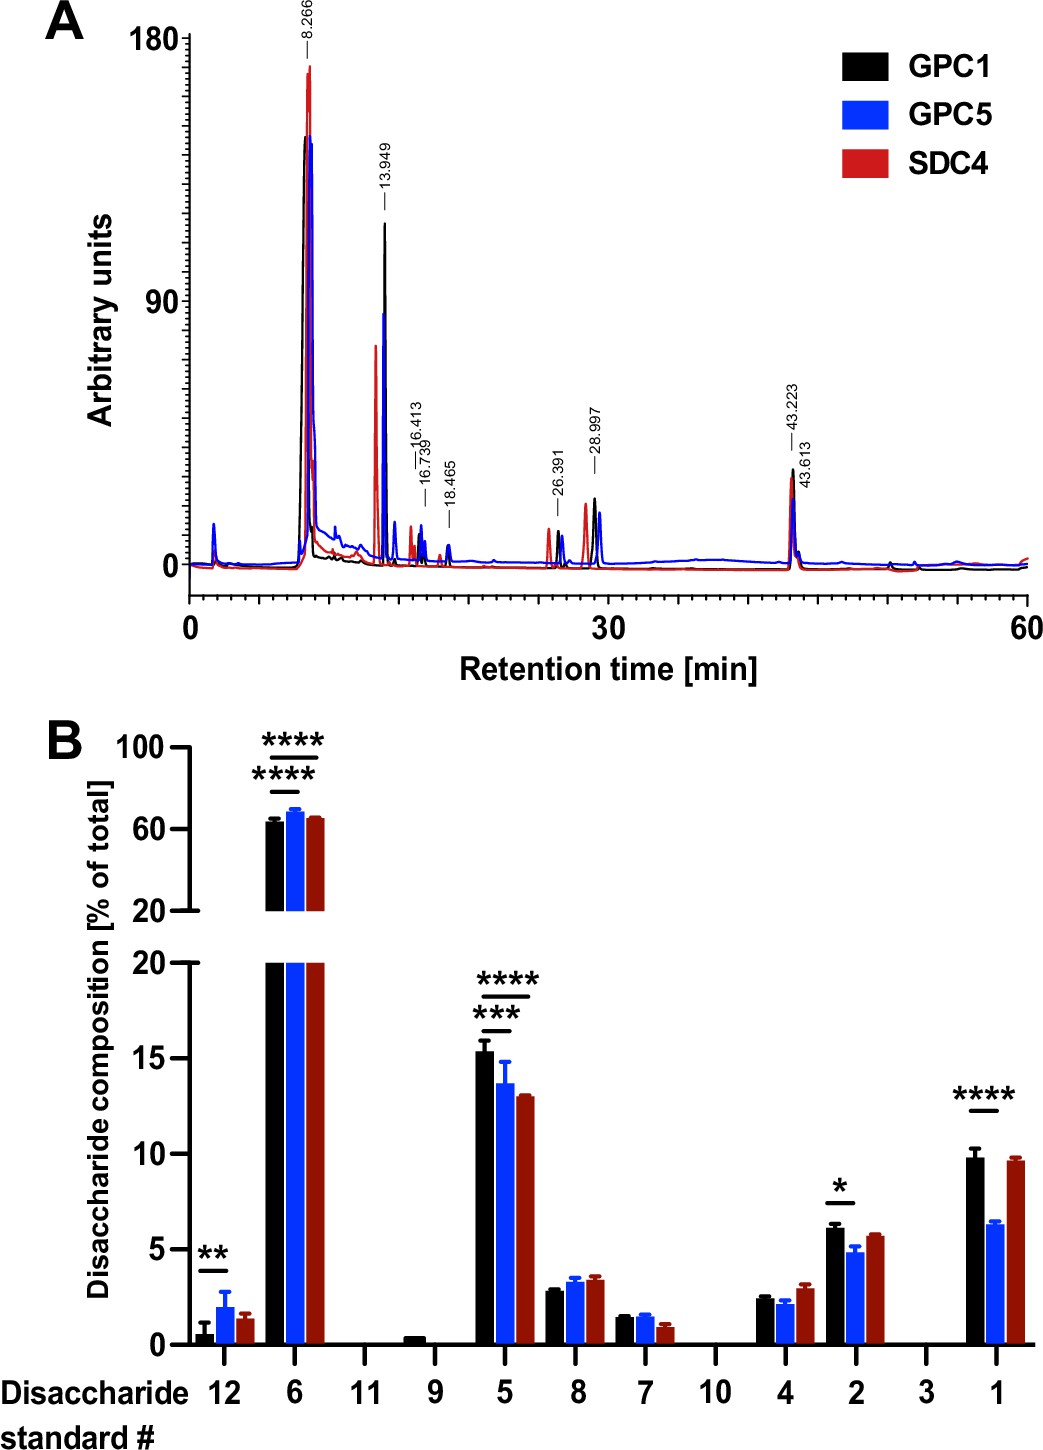
Quantitative characterization of the disaccharide contents of heparan sulfate chains derived from Glypican-1 (GPC1), GPC5, and SDC4.
The recombinant forms of GPC1, GPC5, and SDC4 described in Figure 6 and Figure 6—figure supplement 1 were treated with a mixture of the heparinases I + II and III to release the disaccharide units of their heparan sulfate chains. These were then identified by their retention times in a analytical anion exchange HPLC setup using synthetic disaccharides as standards (Figure 7—figure supplement 1). For details, see Materials and methods.
(A) Representative elution profile of the disaccharide units derived from the heparan sulfate chains of GPC1 (black), GPC5 (blue), and SDC4 (red). (B) Statistical analysis of four independent experiments providing the relative abundances of heparan sulfate disaccharide units corresponding to the 12 standards (Figure 7—figure supplement 1) contained in GPC1 (black), GPC5 (blue), and SDC4 (red). Standard deviations are shown. Statistics were based on a two-way ANOVA test combined with a Bonferroni post-test (*, p ≤ 0.05; **, p ≤ 0.01; ***, p ≤ 0.001, and ****, p ≤ 0.0001).
-
Figure 7—source data 1
Raw data of the analytical HPLC experiments quantifying disaccharide units of the heparan sulfate chains of the proteoglycans indicated.
- https://cdn.elifesciences.org/articles/75545/elife-75545-fig7-data1-v2.xlsx
Figure 7—figure supplement 1
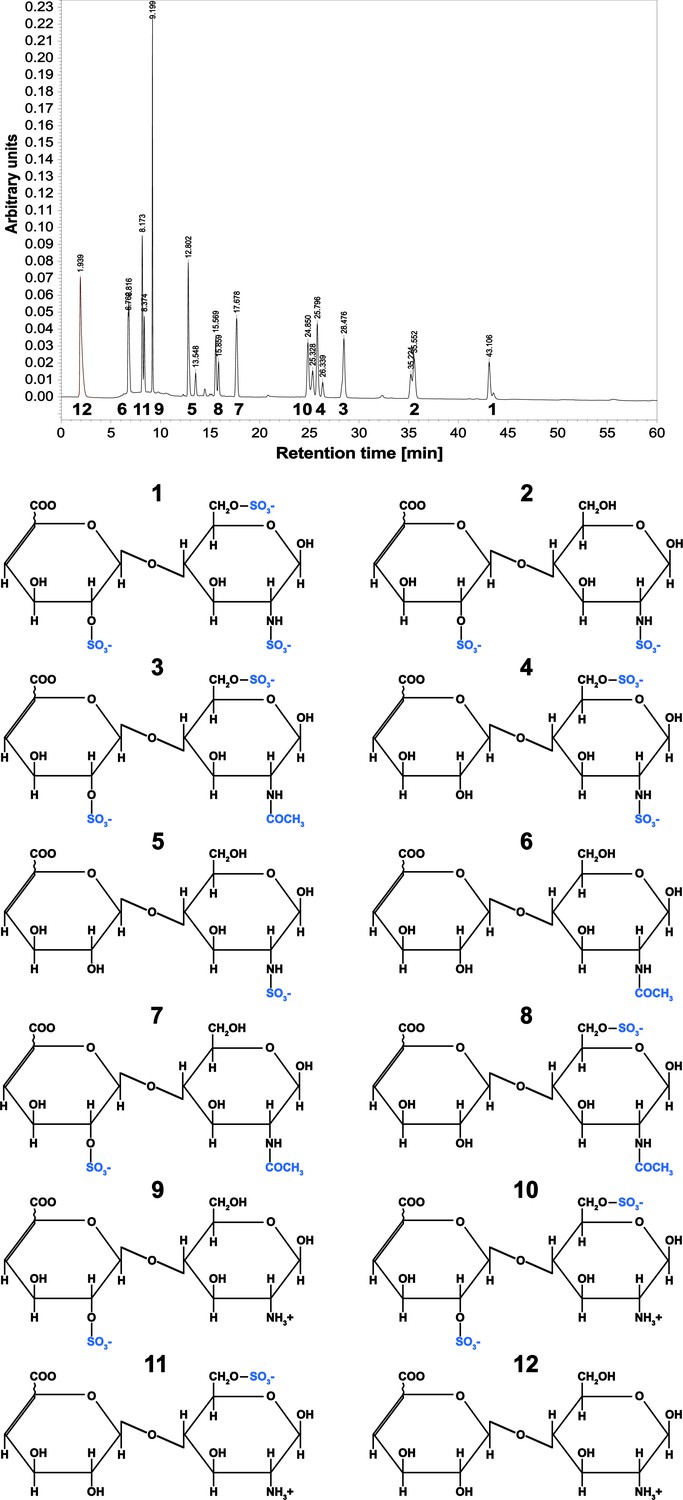
Characterization of synthetic dissacharide standards corresponding to the building blocks of heparan sulfate chains using an analytical HPLC analysis.
The standards used were commercial products (Iduron, UK). They were characterized for their retention times on a strong anion exchange column operated by a HPLC system. For experimental details, see Materials and methods.
Figure 8
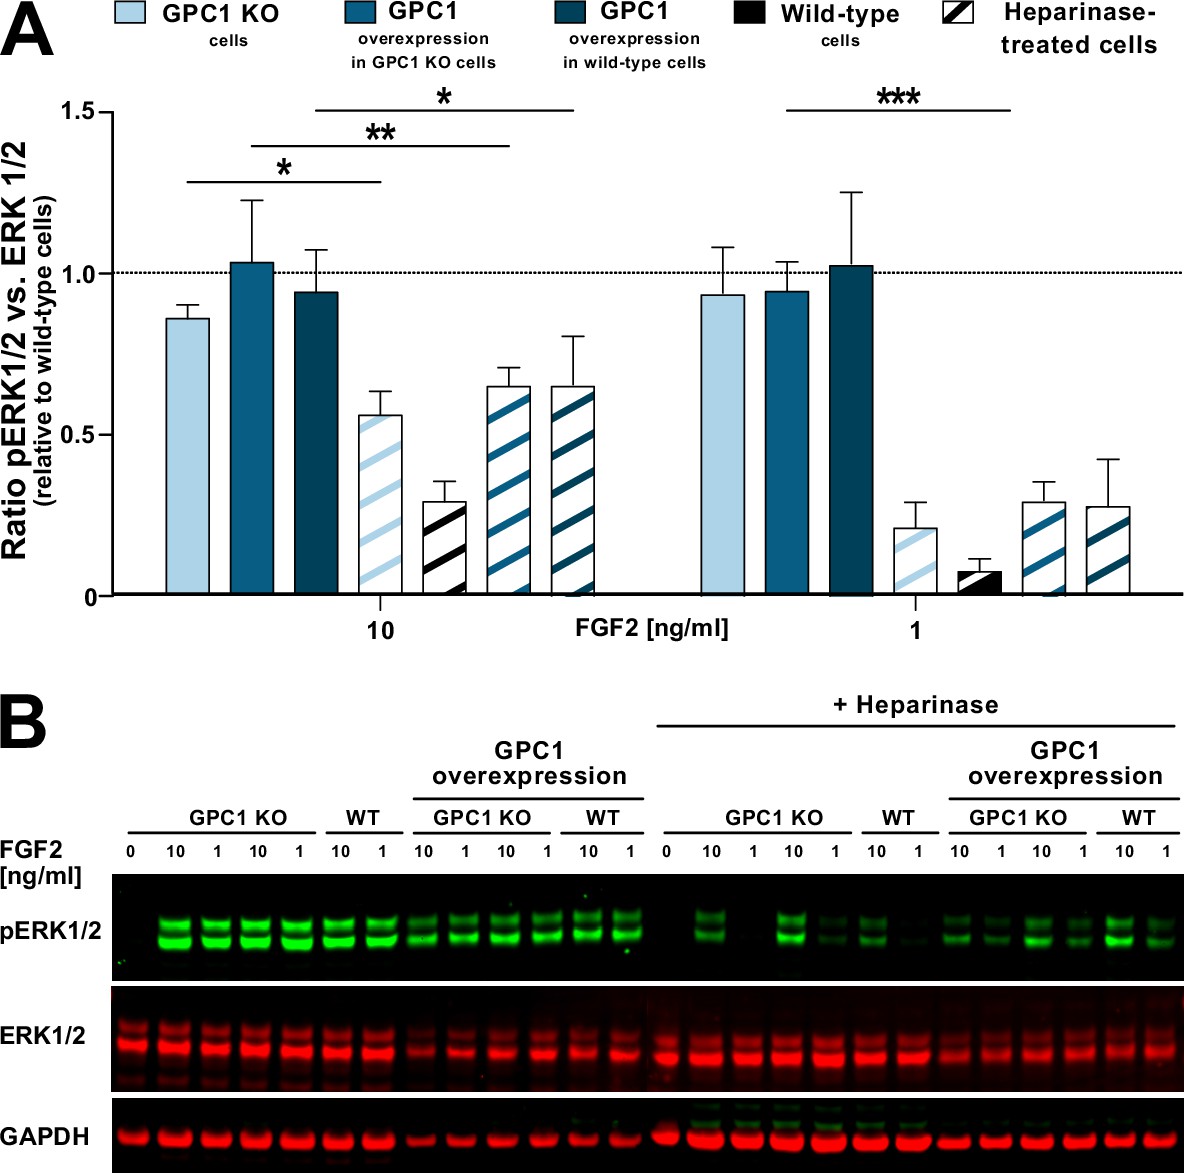
Glypican-1 (GPC1) is dispensable for fibroblast growth factor 2 (FGF2) signaling.
Various forms of HeLa cells including wild-type and GPC1 knockout cells as well as cells overexpressing GPC1 in either a wild-type or a GPC1 knockout background were treated with recombinant FGF2 at the concentrations indicated. Where indicated, cells were treated with a mixture of heparinase I, II, and III used as a positive control. As a read-out for FGF signaling, the ratio between phosphorylated and unphosphorylated ERK1/2 was determined. For experimental details, see Materials and methods.
(A) Quantitative analysis of the pERK1/2 to ERK1/2 ratio (n=4; standard deviations are shown). The statistical analysis was based on a one-way ANOVA test combined with Tukey’s post hoc test (*, p ≤ 0.05; **, p ≤ 0.01, and ***, p ≤ 0.001). (B) A representative Western analysis was used for the quantification and statistical analysis shown in panel A. The GAPDH signal was used as a loading control.
-
Figure 8—source data 1
Raw data of the cell-based signaling experiments quantifying fibroblast growth factor 2 (FGF2)-induced signaling cascades under the conditions indicated.
- https://cdn.elifesciences.org/articles/75545/elife-75545-fig8-data1-v2.xlsx
Videos
Video 1
Endocytosis of recombinant fibroblast growth factor 2 (FGF2)-GFP (5 µg/ml, in green) and Transferrin-Alexa Fluor546 (25 µg/ml, in red) was visualized in HeLa S3 wild-type cells.
One frame corresponds to 1 min. The data shown are representative for three independent experiments. Scale bar = 20 µm.
Video 2
Endocytosis of recombinant fibroblast growth factor 2 (FGF2)-GFP (5 µg/ml, in green) and Transferrin-Alexa Fluor546 (25 µg/ml, in red) was visualized in HeLa S3 Glypican-1 (GPC1) knockout cells.
One frame corresponds to 1 min. The data shown are representative for three independent experiments. Scale bar = 20 µm.
Video 3
Endocytosis of recombinant fibroblast growth factor 2 (FGF2)-GFP (5 µg/ml, in green) and Transferrin-Alexa Fluor546 (25 µg/ml, in red) was visualized in HeLa S3 knockout cells overexpressing Glypican-1 (GPC1).
One frame corresponds to 1 min. The data shown are representative for three independent experiments. Scale bar = 20 µm.
Additional files
-
Transparent reporting form
- https://cdn.elifesciences.org/articles/75545/elife-75545-transrepform1-v2.docx
-
Source data 1
- https://cdn.elifesciences.org/articles/75545/elife-75545-data1-v2.zip
Download links
A two-part list of links to download the article, or parts of the article, in various formats.
Downloads (link to download the article as PDF)
Open citations (links to open the citations from this article in various online reference manager services)
Cite this article (links to download the citations from this article in formats compatible with various reference manager tools)
Glypican-1 drives unconventional secretion of fibroblast growth factor 2
eLife 11:e75545.
https://doi.org/10.7554/eLife.75545


