Controlling SARS-CoV-2 in schools using repetitive testing strategies
- Centre for Health Economic Research and Modelling Infectious Diseases, University of Antwerp, Belgium
- Interuniversity Institute of Biostatistics and statistical Bioinformatics, Data Science Institute, Hasselt University, Belgium
- INSERM, Sorbonne Université, Pierre Louis Institute of Epidemiology and Public Health, France
- Tokyo Tech World Research Hub Initiative (WRHI), Tokyo Institute of Technology, Japan
- Department of Infectious Diseases, Liège University Hospital, Belgium
- Artificial Intelligence Lab, Department of Computer Science, Vrije Universiteit Brussel, Belgium
- KU Leuven, Department of Microbiology and Immunology, Rega Institute for Medical Research, University of Leuven, Belgium
Figures
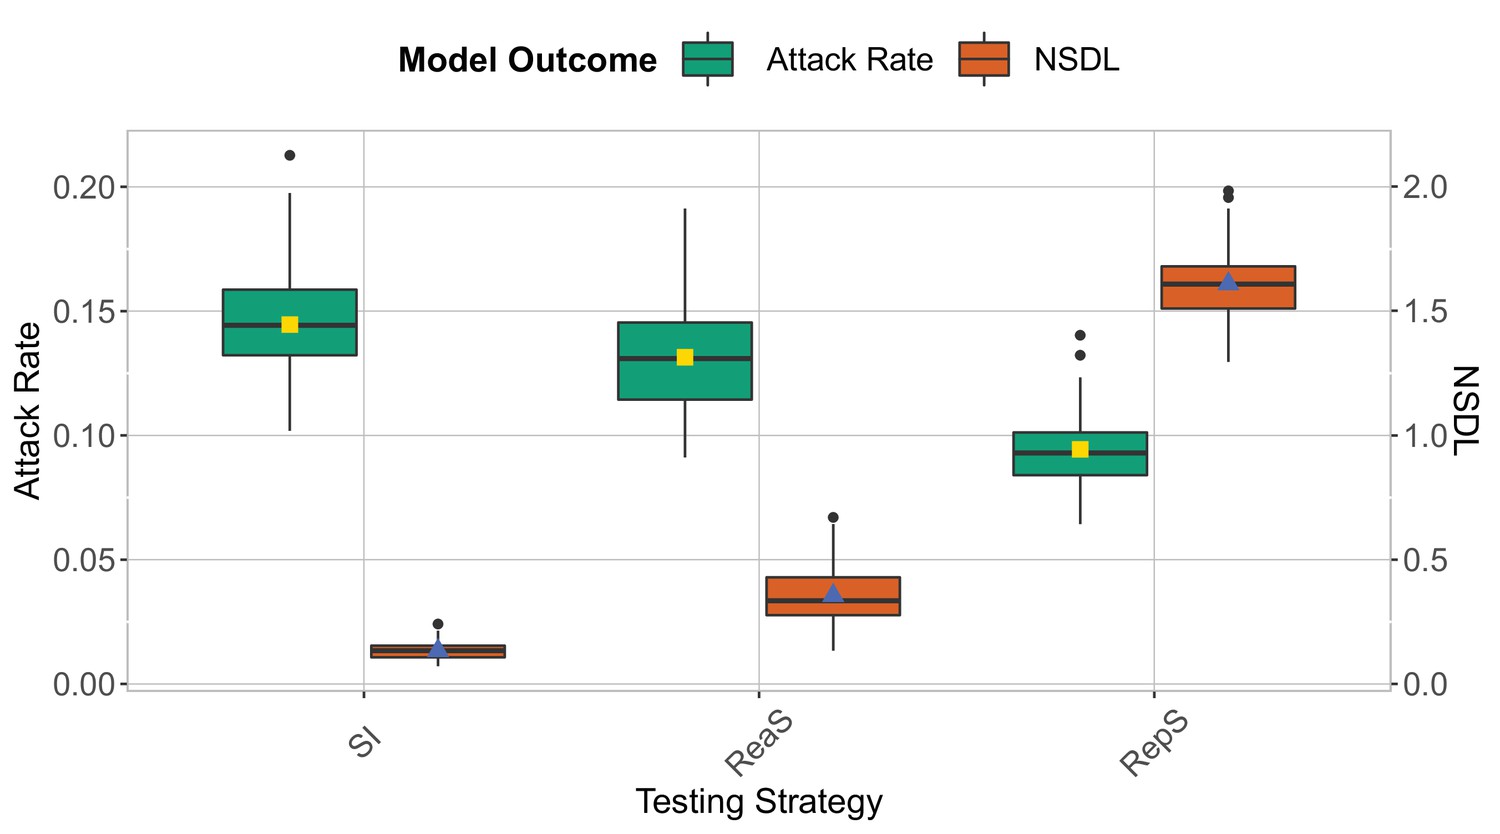
Figure 1
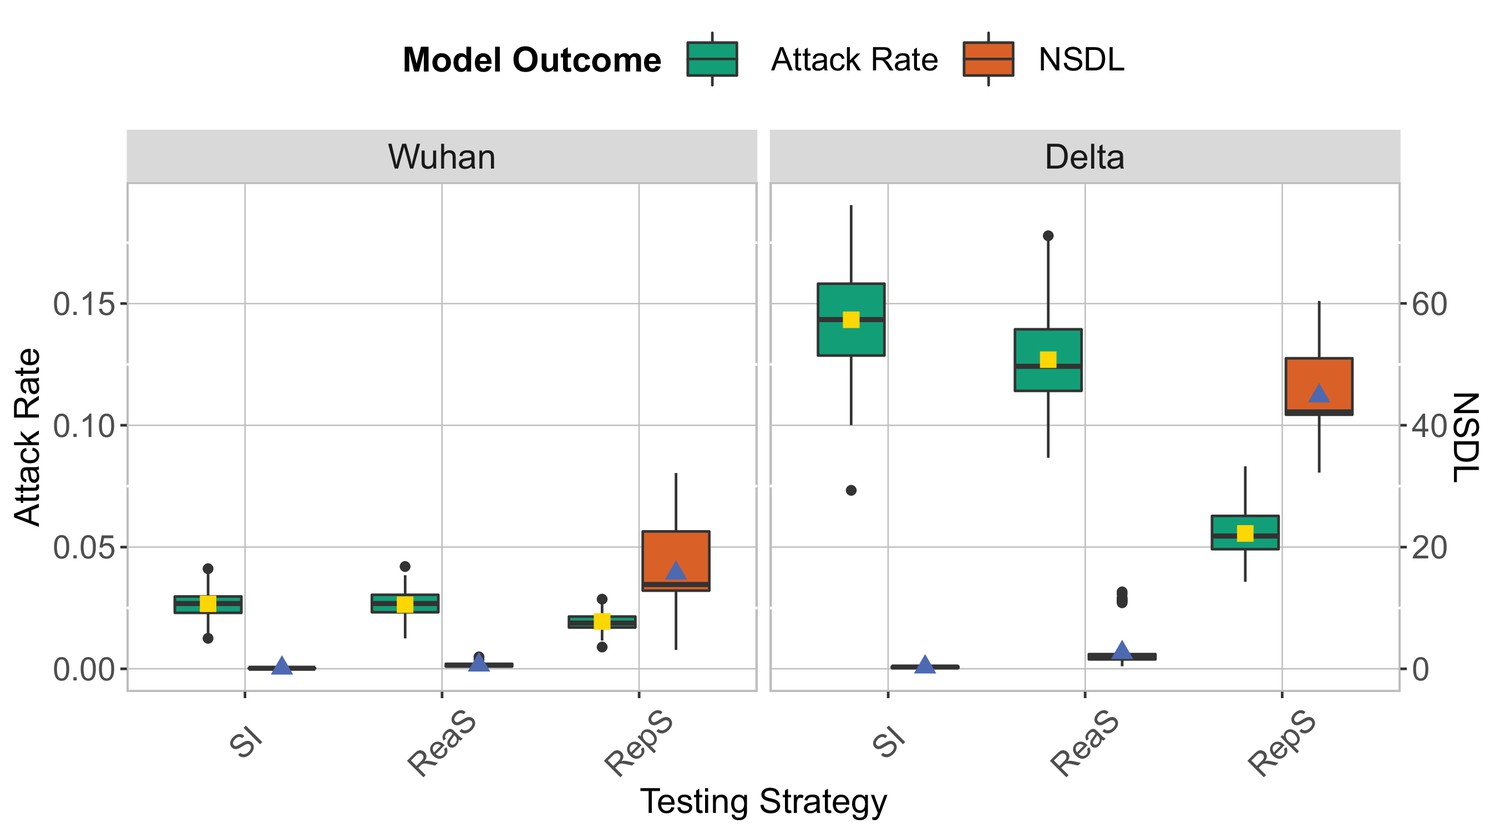
We show the base scenario for the Wuhan strain (left panel) and Delta VoC (right panel) for a moderate seeding of 5 seeds per week.
In each panel, we consider three testing strategies: symptomatic testing (SI), symptomatic testing in combination with reactive screening (ReaS) and repetitive screening (RepS). For each of the testing strategies we show a boxplot of the attack rate (green boxplot) and NSDL (orange boxplot) together with their mean values (respectively, yellow and blue dots). The epidemic is simulated for 100 days.
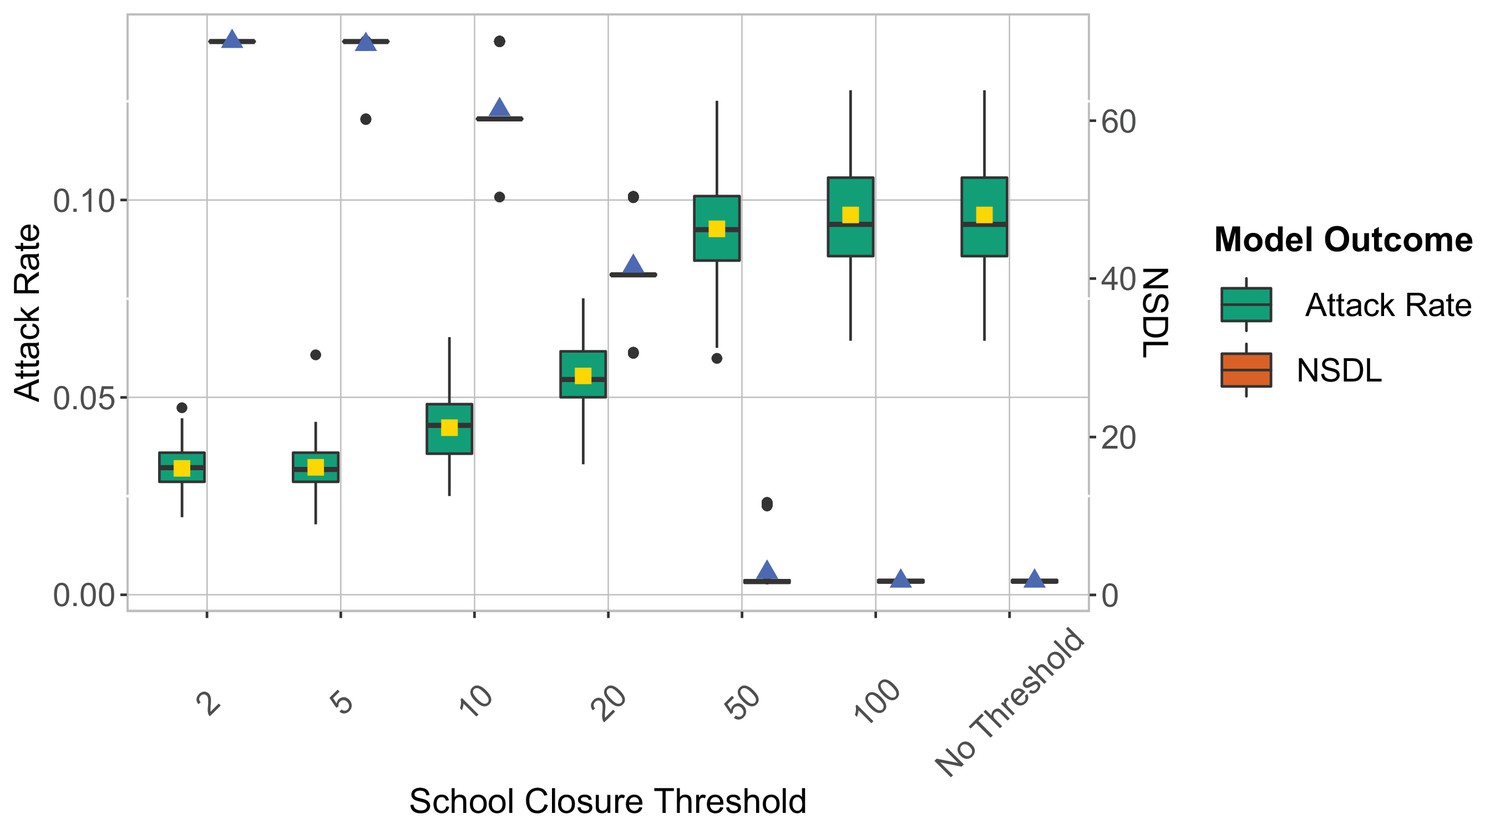
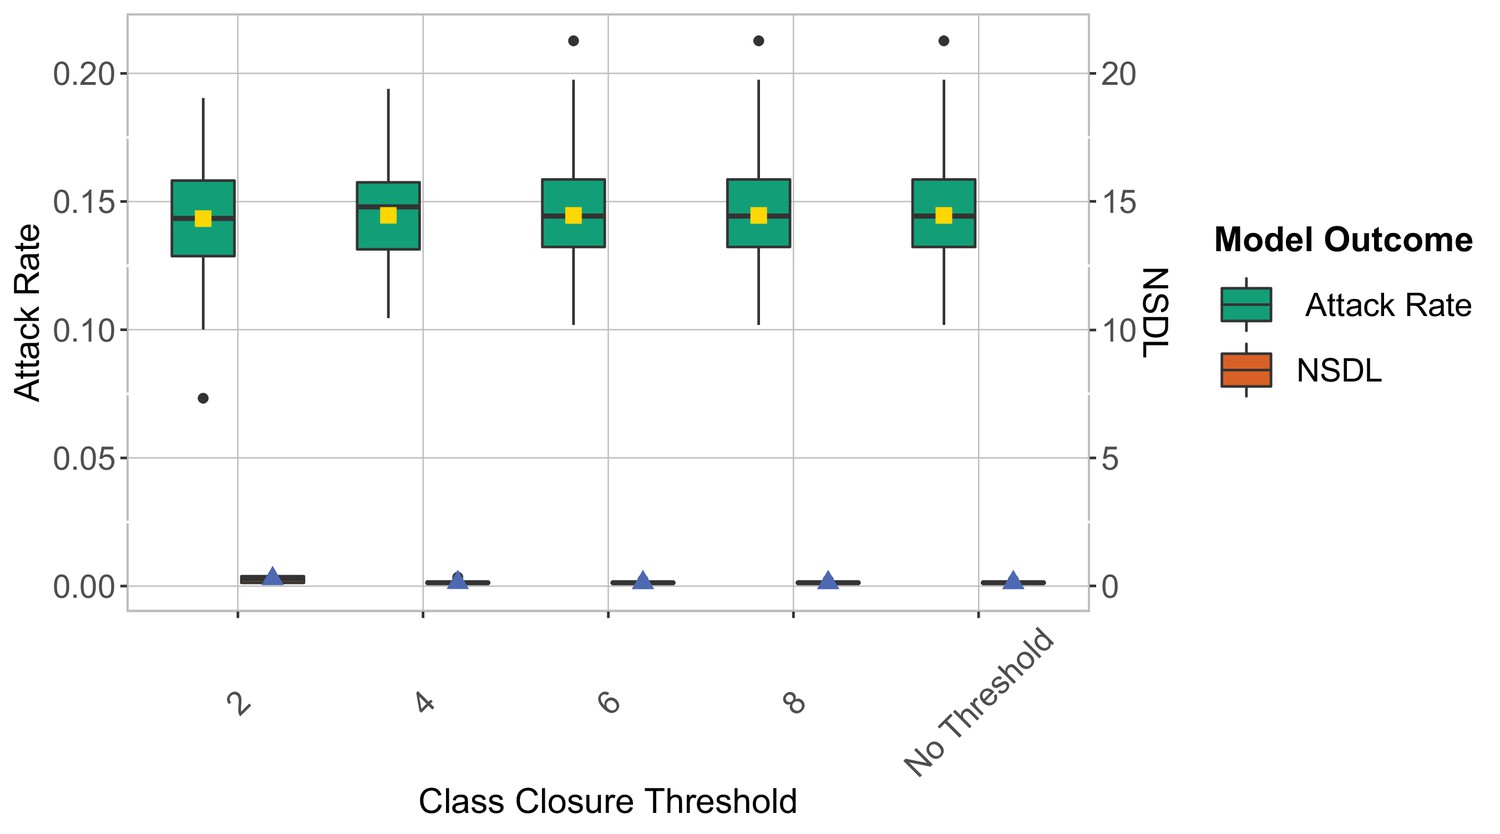
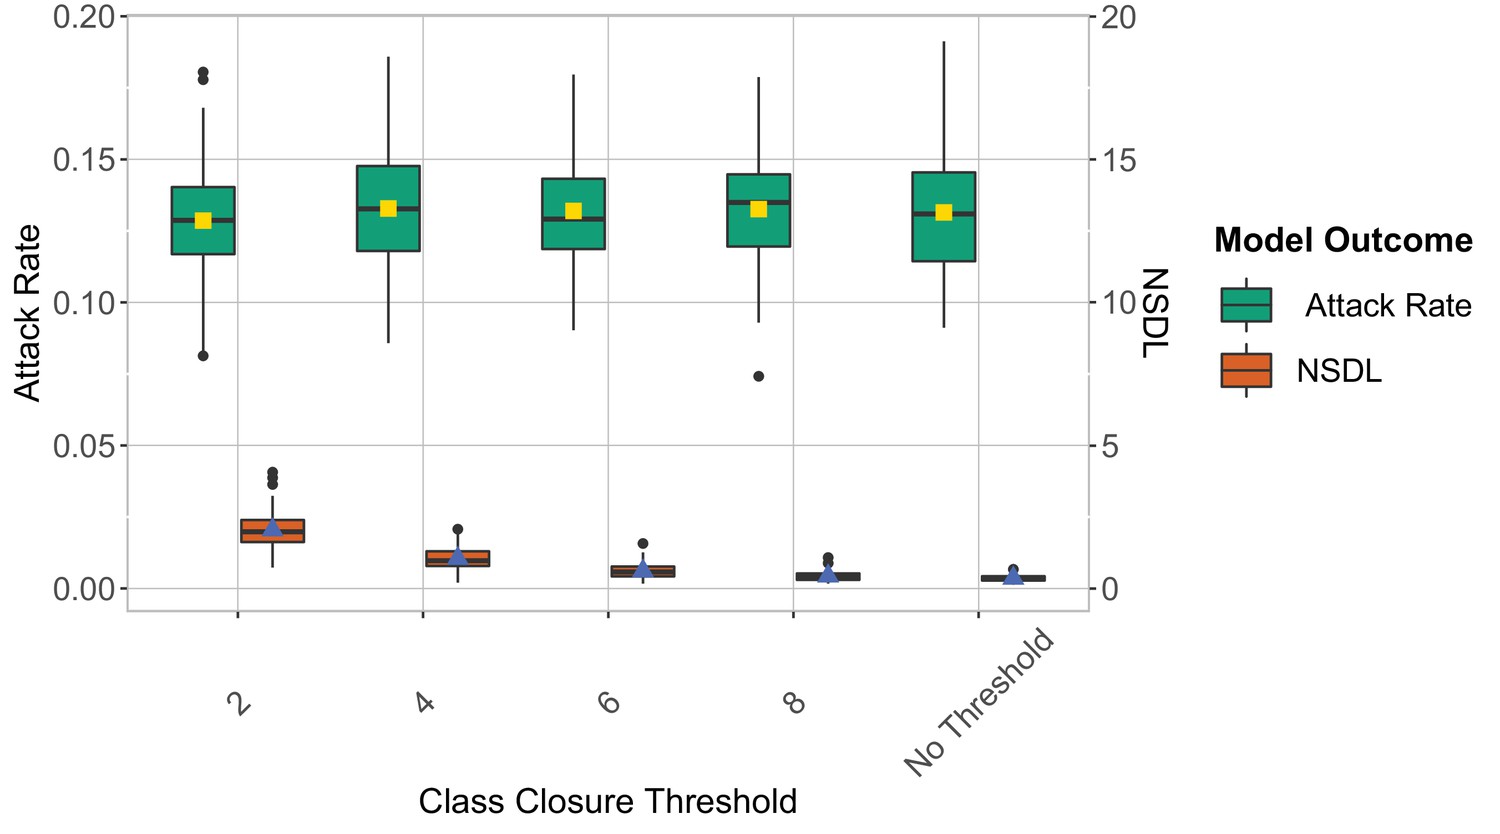
Figure 2
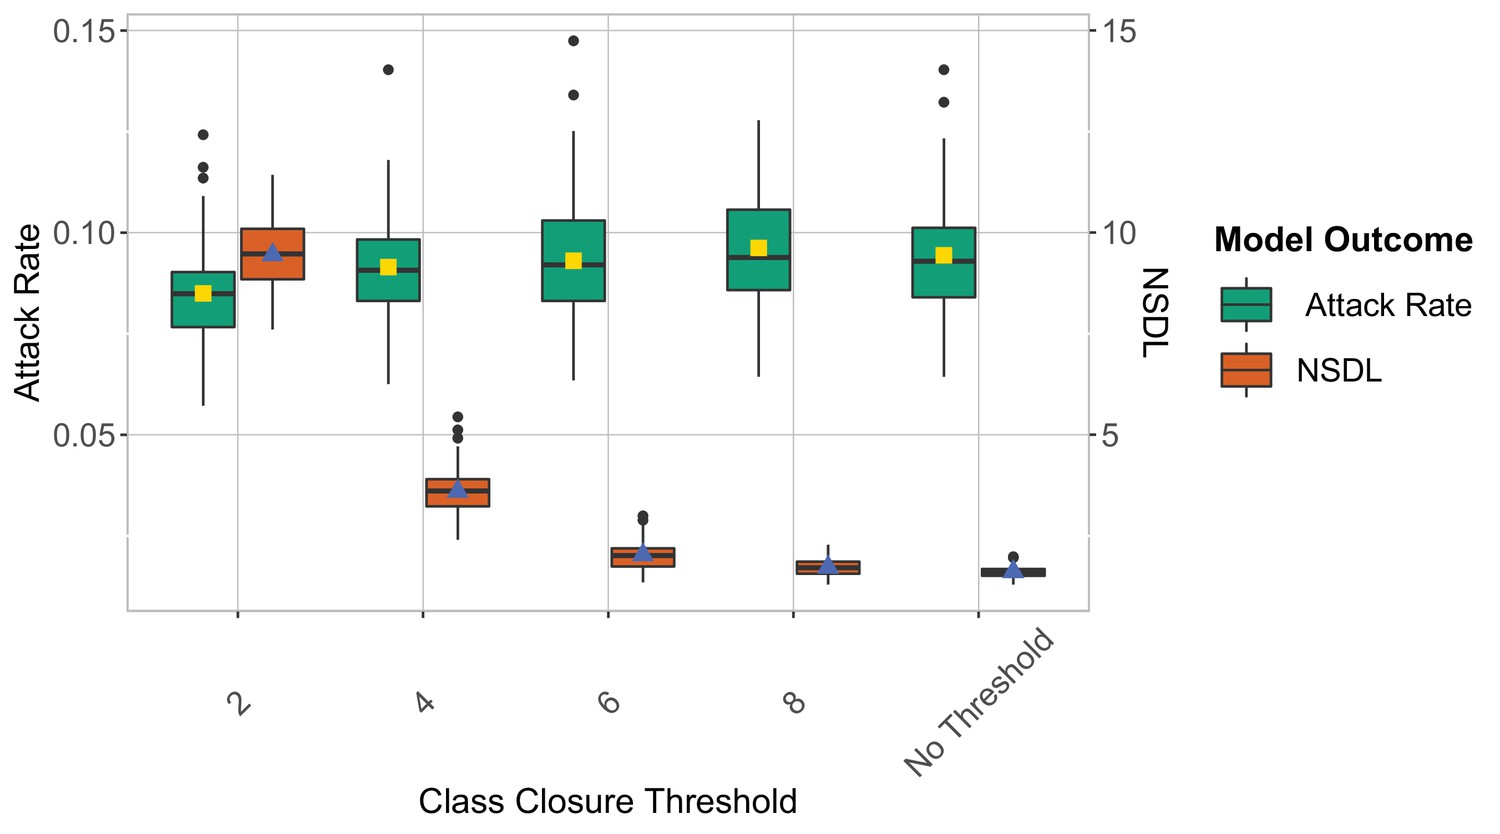
We show the repetitive testing strategy in the context of the Delta VoC for a moderate seeding of 5 seeds per week, where we consider different class closure thresholds, and no school closure threshold.
The epidemic is simulated for 100 days. This experiment shows that when repetitive testing is in place, a higher class closure threshold has little effect on the attack rate, yet it significantly reduces the NSDL (Table 1).
Appendix 1—figure 1
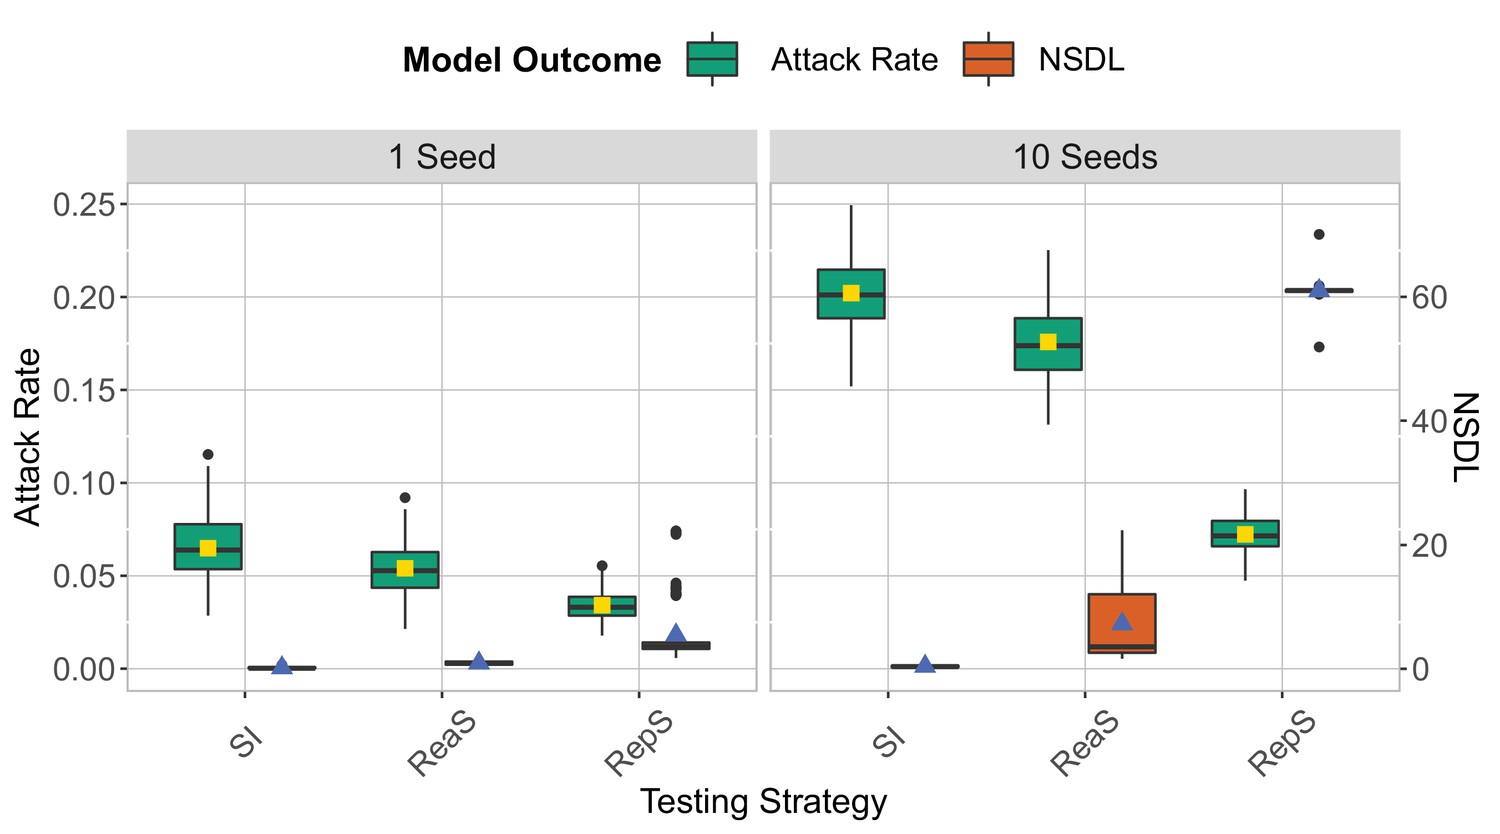
We compare the testing strategies in the context of the Delta VoC for a seeding of 1 seed per week (left panel) and 10 seeds per week (right panel).
School and class thresholds are set, respectively, to 20 and 2 detected cases. The epidemic is simulated for 100 days. This experiment shows that increasing the number of seeds leads to an increase in both the attack rate and NSDL.
Appendix 1—figure 2
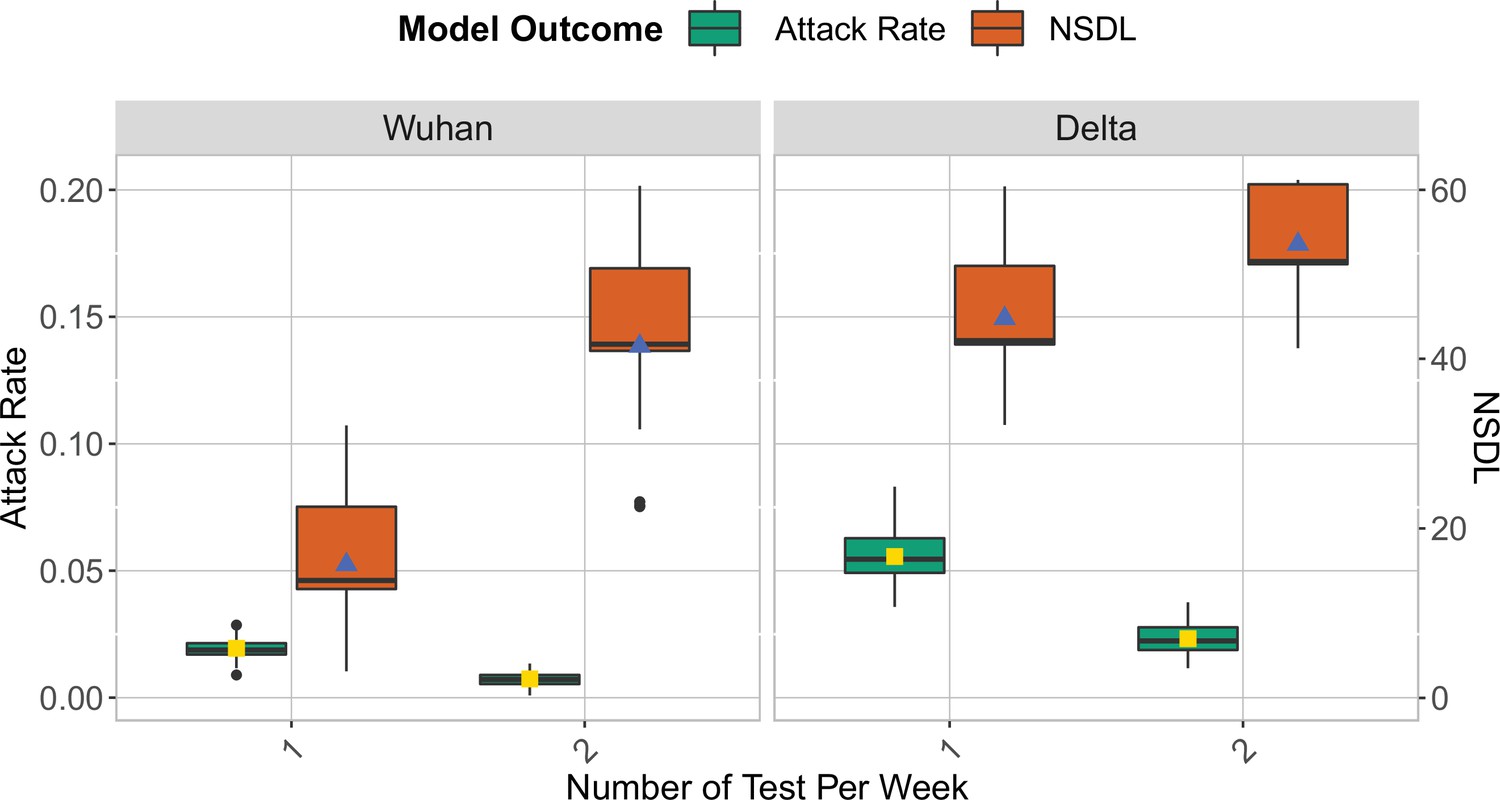
We show the repetitive testing strategy in the context of the Wuhan strain and the Delta VoC for a moderate seeding of 5 seeds per week, where we consider a repetitive testing strategy for which the entire school population is tested either once or twice per week.
We consider class closure threshold of 2 and school closure threshold of 20 cases. The epidemic is simulated for 100 days. This experiment demonstrates that for a highly infectious virus strain, repetitive testing can further reduce the number of transmissions at school while increasing the NSDL.
Appendix 1—figure 3

We show the repetitive testing strategy in the context of the Wuhan strain and the Delta VoC for a moderate seeding of 5 seeds per week, where we consider a repetitive testing strategy for which the entire school population is tested either once or twice per week.
We consider class closure threshold of 8 and no school closure threshold. The epidemic is simulated for 100 days. This experiment demonstrates that twice testing can reduce the number of transmissions at school and the NSDL when assumptions on class and school thresholds are relaxed.
Appendix 1—figure 4

We compare the reactive screening strategy in the context of the Delta VoC for a moderate seeding of 5 seeds per week, when varying the number of screening.
The class closure threshold is of eight detected cases, and there is no school closure threshold. The epidemic is simulated for 100 days. This experiments shows that increasing the number of screening has a small effect on the attack rate and NSDL.
Appendix 1—figure 5
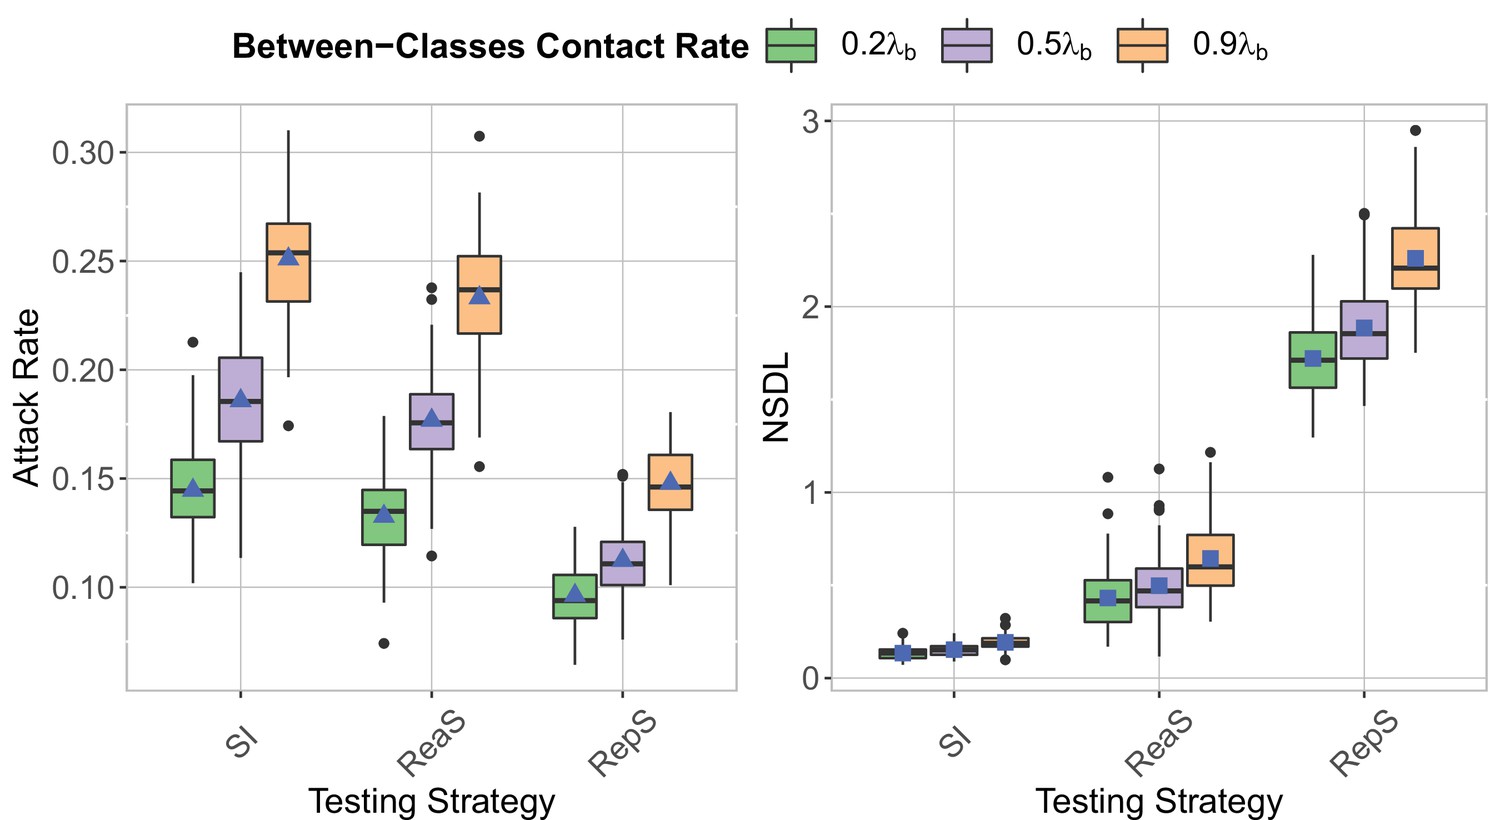
We compare testing strategy in the context of the Delta VoC for a moderate seeding of 5 seeds per week, when varying the proportion of between classes contacts compared to a pre-pandemic scenario.
The class closure threshold is of eight detected cases, and there is no school closure threshold. The epidemic is simulated for 100 days. This experiments shows that increasing between classes contact rate increases both the attack rate (left panel) and the NSDL (right panel).
Appendix 1—figure 6

We compare the testing strategies in the context of the Delta VoC for a moderate seeding of 5 seeds per week, when varying the proportion of immune children.
The class closure threshold is of eight detected cases, and there is no school closure threshold. The epidemic is simulated for 100 days. This experiments shows that increasing the proportion of immune children decrease both the attack rate (left panel) and the NSDL (right panel) for all the testing strategies.
Appendix 1—figure 7
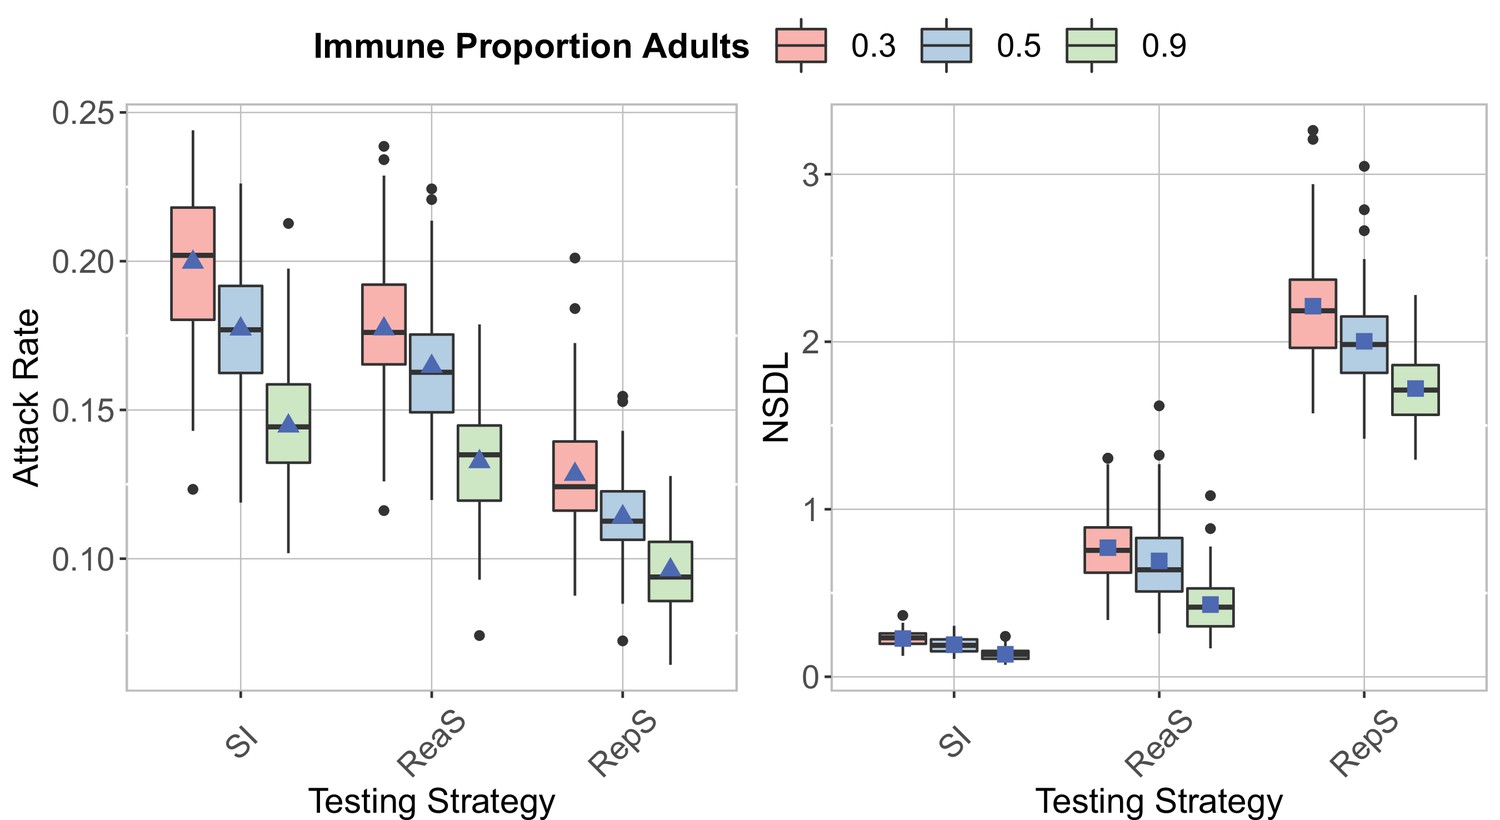
We compare the testing strategies in the context of the Delta VoC for a moderate seeding of 5 seeds per week, when varying the proportion of immune adults.
The class closure threshold is of eight detected cases, and there is no school closure threshold. The epidemic is simulated for 100 days. This experiments shows that increasing the proportion of immune adults decrease both the attack rate (left panel) and the NSDL (right panel) for all the testing strategies.
Appendix 1—figure 8
We show the testing strategies in the context of the Delta VoC for a moderate seeding of 5 seeds per week, where we consider asymptomatic carriers to be as infectious as the symptomatic ones.
The class closure threshold is of eight detected cases, and there is no school closure threshold. The epidemic is simulated for 100 days. The repetitive screening strategy is shown to reduce the attack rate (left panel), while leading to a higher NSDL (right panel).
Appendix 1—figure 9
We show the repetitive testing strategy in the context of the Delta VoC for a moderate seeding of 5 seeds per week, where we consider different school closure thresholds.
The class closure threshold is set to eight detected cases. The epidemic is simulated for 100 days. This experiments shows that a low school closure threshold decreases the attack rate but it increases the NSDL.
Appendix 1—figure 10
We show the reactive screening strategy in the context of the Delta VoC for a moderate seeding of 5 seeds per week, where we consider different school closure thresholds.
The class closure threshold is set to eight detected cases. The epidemic is simulated for 100 days. This experiments shows that a low school closure threshold decreases the attack rate but it increases the NSDL.
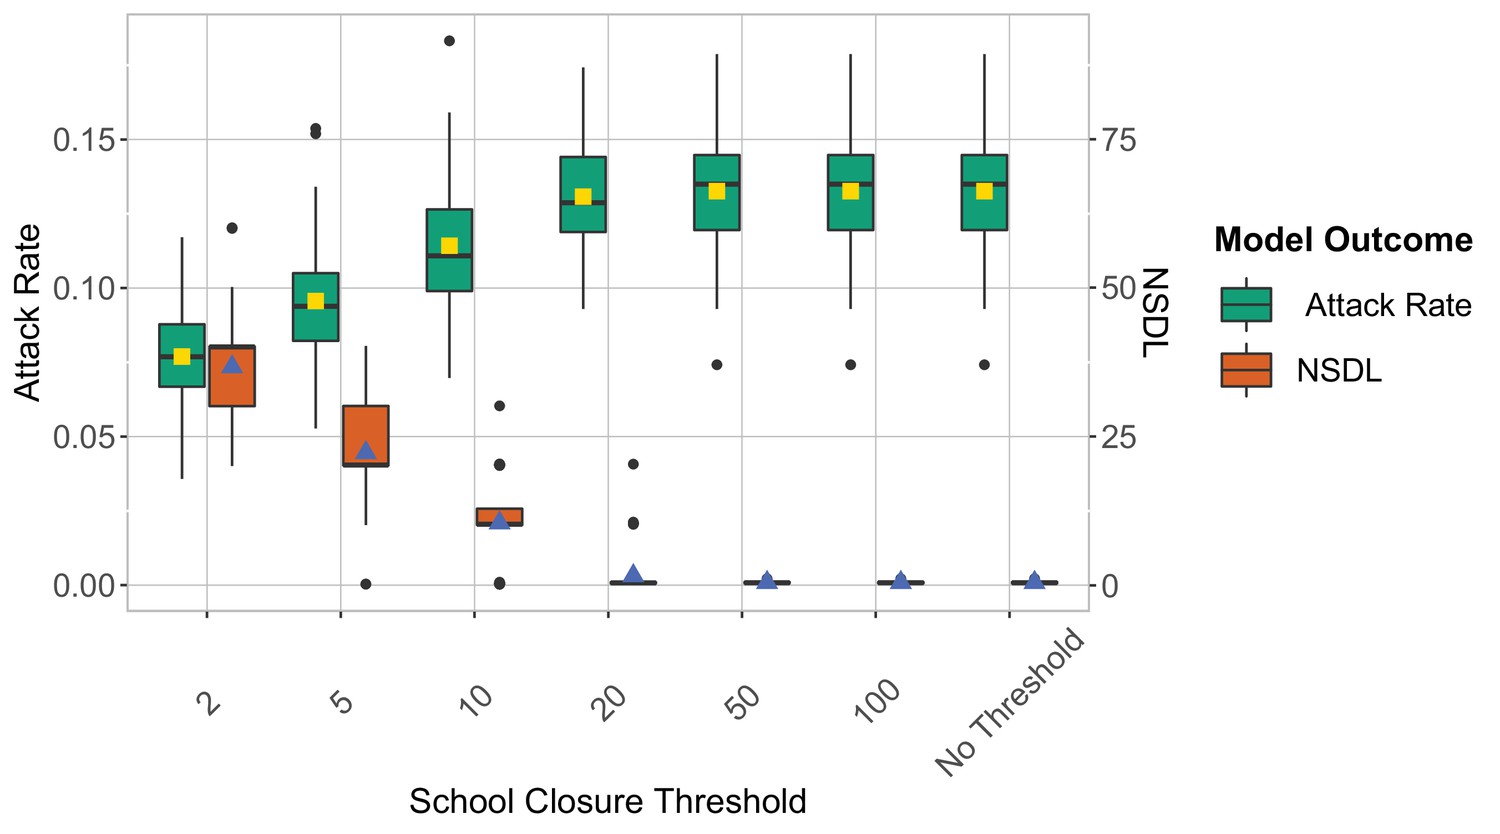
Appendix 1—figure 11
We show the symptomatic isolation strategy in the context of the Delta VoC for a moderate seeding of 5 seeds per week, where we consider different school closure thresholds.
The class closure threshold is set to 8 detected cases. The epidemic is simulated for 100 days. This experiments shows that a low school closure threshold decreases the attack rate but it increases the NSDL.
Appendix 1—figure 12

We show the testing strategies in the context of the Delta VoC for a seeding of 1 seeds per month, where we consider different school closure thresholds.
The class closure threshold is set to eight detected cases. The epidemic is simulated for 100 days. The repetitive screening strategy is shown to decrease the attack rate (left panel) compared to reactive screening and symptomatic isolation, while increasing the NSDL (right panel).
Appendix 1—figure 13
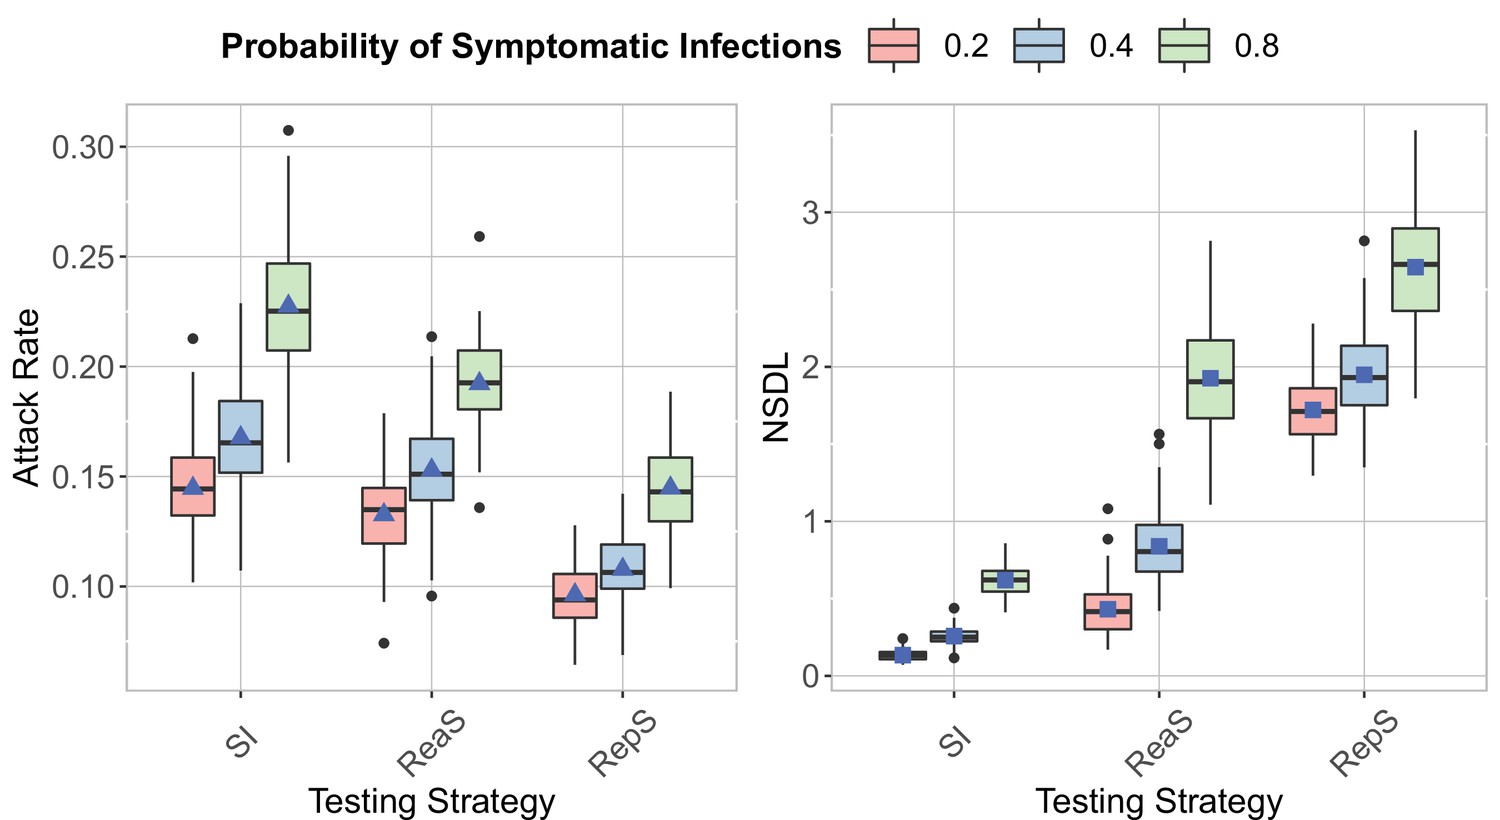
We show the testing strategies in the context of the Delta VoC for a moderate seeding of 5 seeds per week, where we consider different probability of having a symptomatic infection.
The class closure threshold is set to 8 detected cases and there is no school closure threshold. The epidemic is simulated for 100 days. This experiment shows that to an increase in the probability of having a symptomatic infection it corresponds an increase in the attack rate (left panel) and the NSDL (right panel).
Appendix 1—figure 14
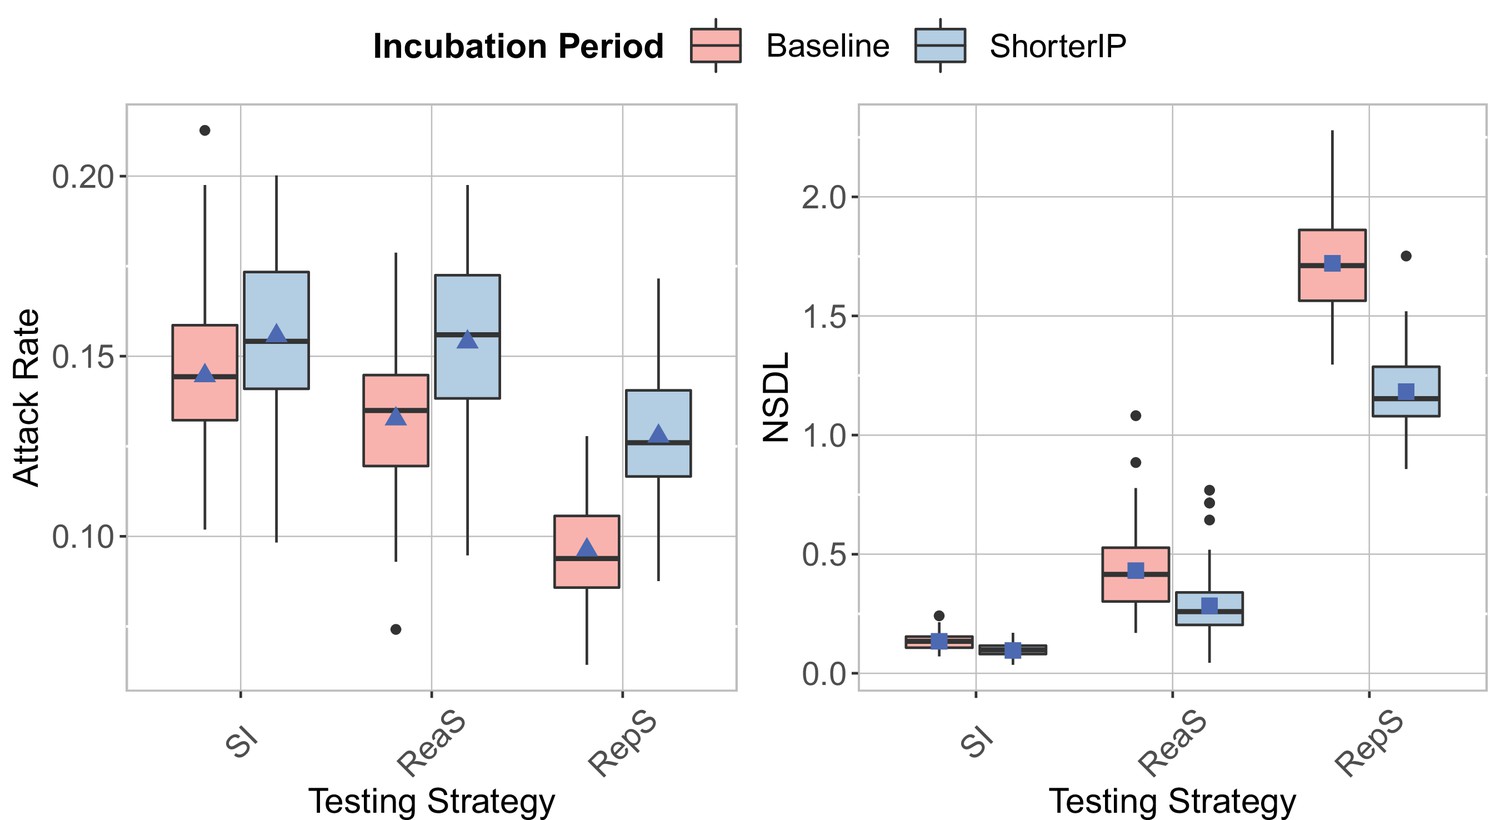
We show the testing strategies in the context of the Delta VoC for a moderate seeding of 5 seeds per week, where we consider different incubation period.
The class closure threshold is set to eight detected cases and there is no school closure threshold. The epidemic is simulated for 100 days. The repetitive screening strategy is shown to decrease the attack rate (left panel) compared to reactive screening and symptomatic isolation, while increasing the NSDL (left panel). Reactive screening and repetitive screening are less effective in reducing the attack rate when the incubation period is shorter.
Appendix 1—figure 15
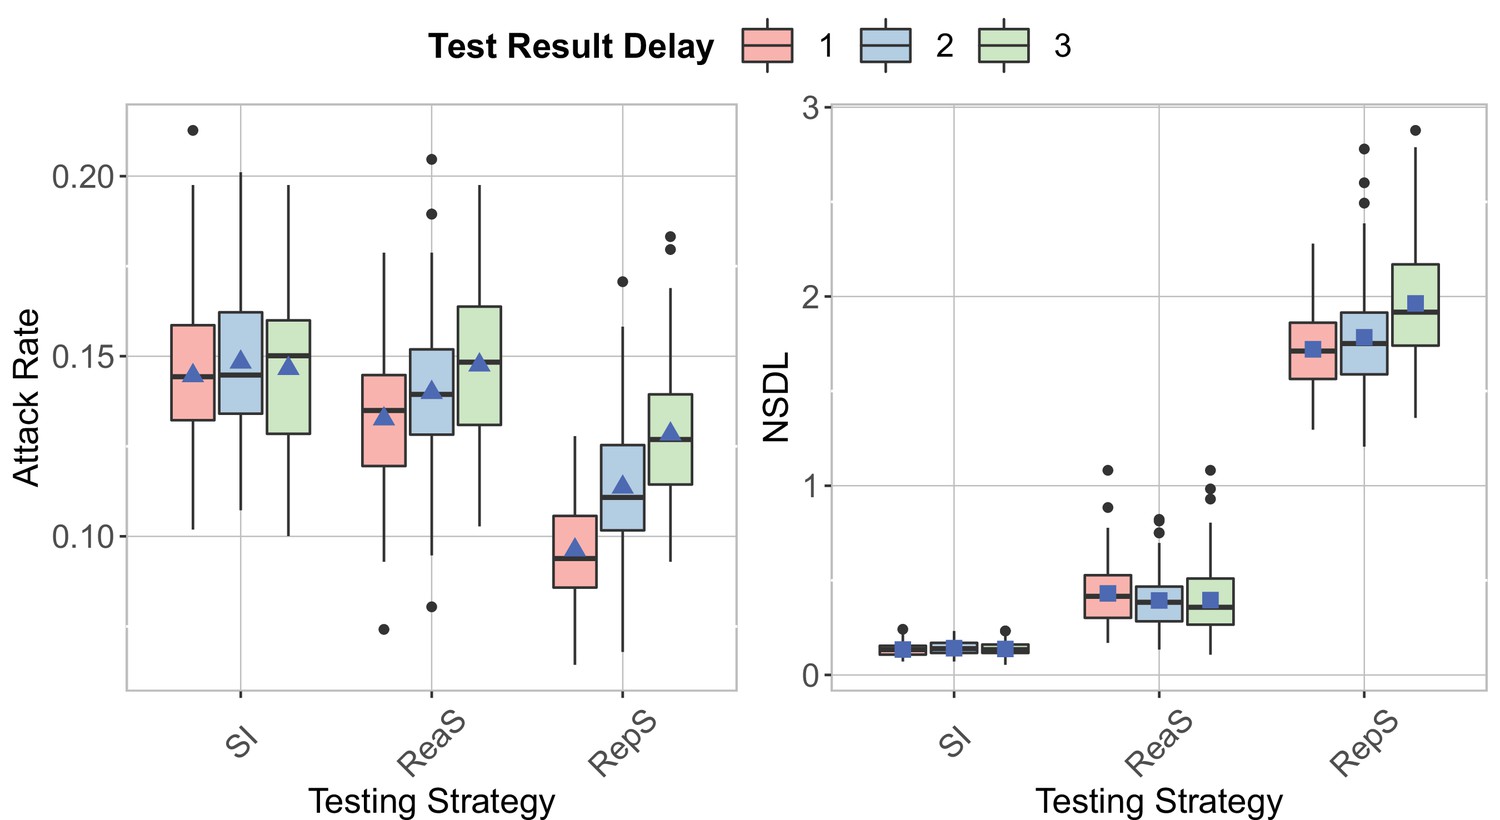
We show the testing strategies in the context of the Delta VoC for a moderate seeding of 5 seeds per week, where we consider different turnaround time for the test result.
The class closure threshold is set to 8 detected cases and there is no school closure threshold. The epidemic is simulated for 100 days. An increase in the attack rate is shown for repetitive testing and reactive screening with an increase in the turnaround time (left panel). The NSDL increases with an increase in the turnaround time, while a similar trend is shown for the other strategies (right panel).
Appendix 1—figure 16
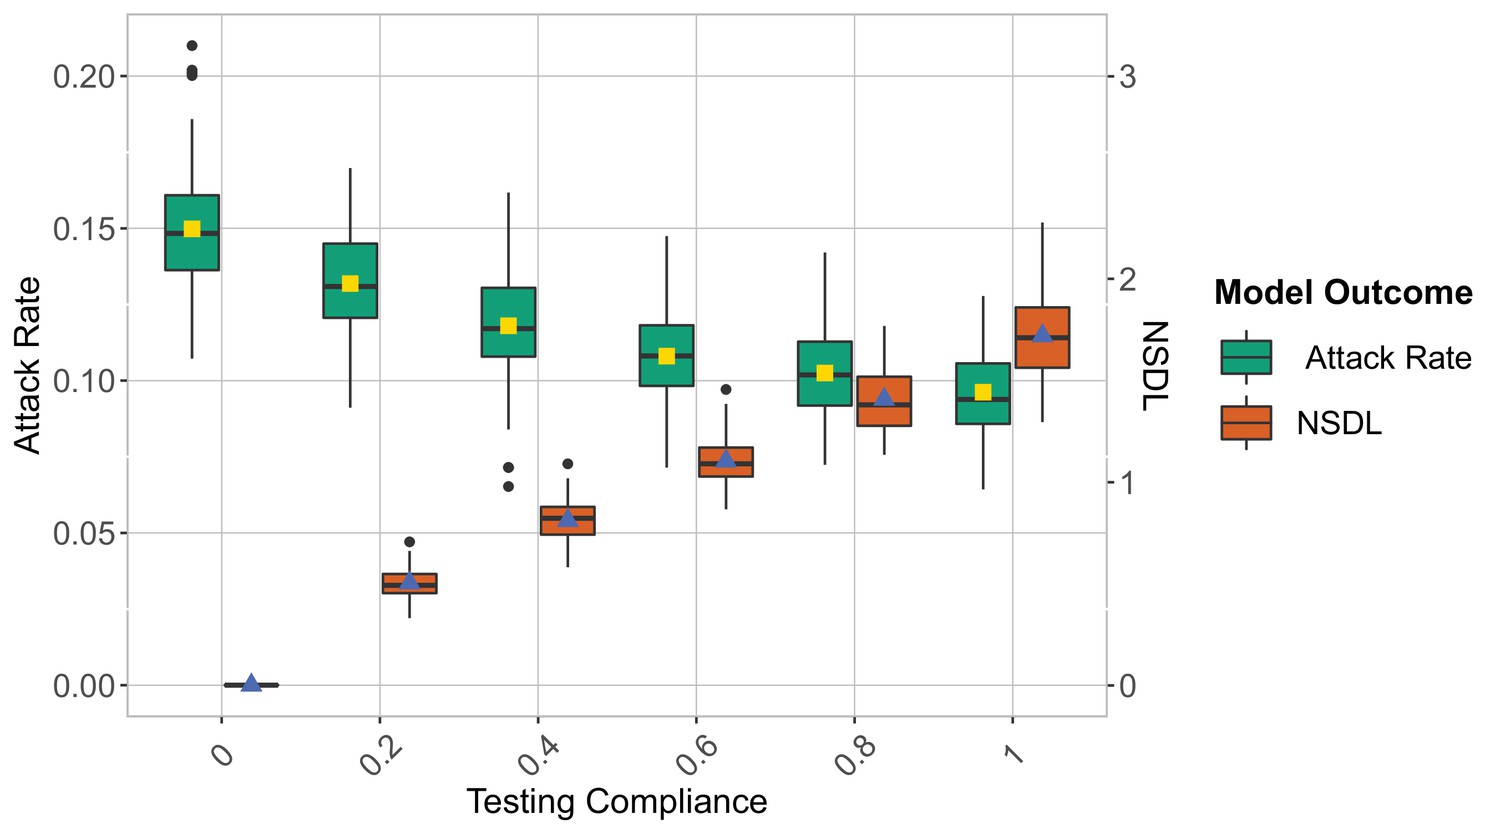
We show the repetitive testing strategies in the context of the Delta VoC for a moderate seeding of 5 seeds per week, when varying the compliance to testing.
The class closure threshold is set to eight detected cases and there is no school closure threshold. The epidemic is simulated for 100 days. For an increase in the compliance the attack rate decreases and the NSDL increases.
Appendix 1—figure 17
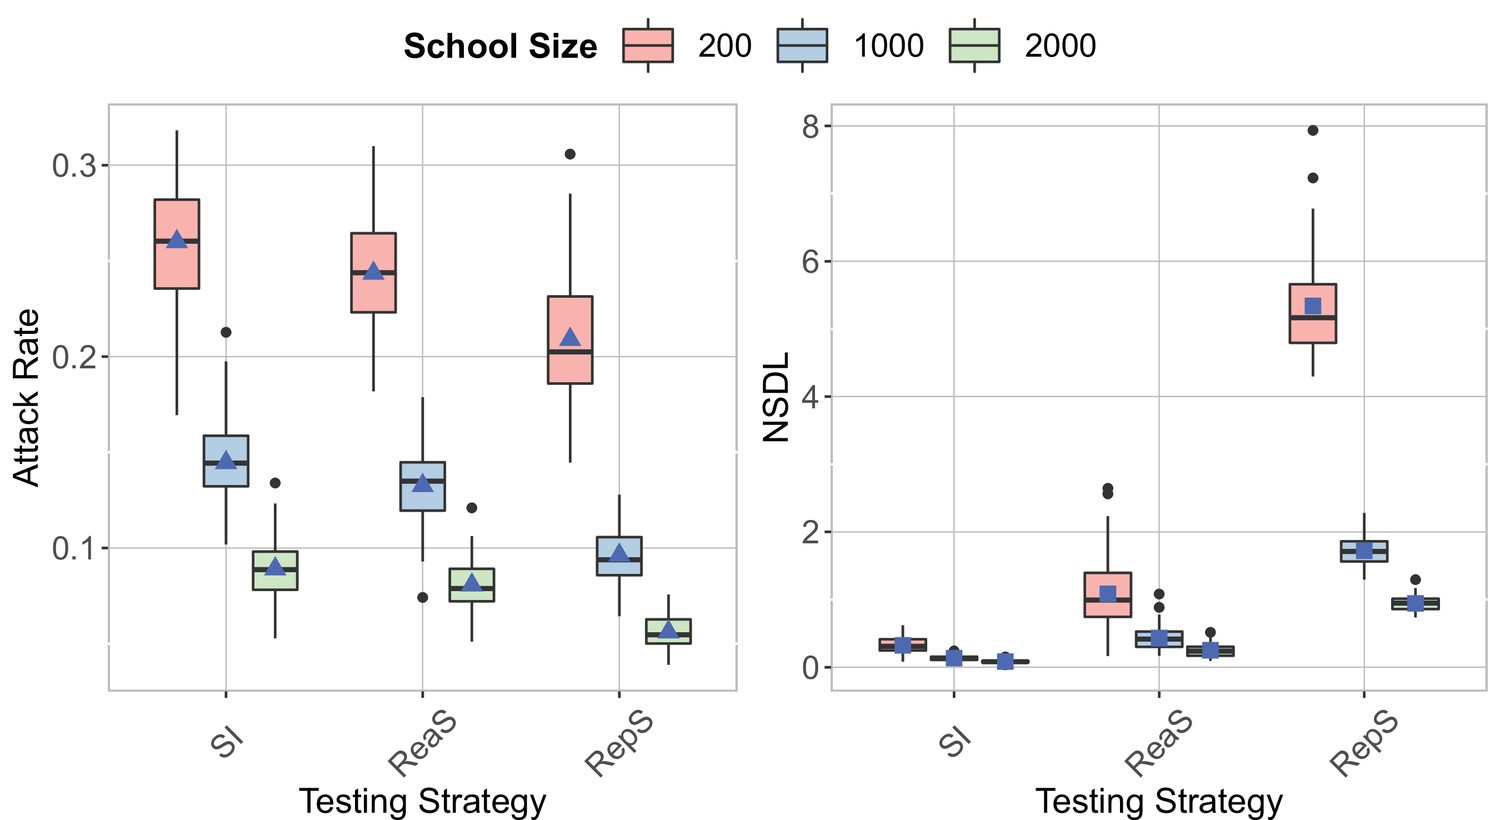
We show the testing strategies in the context of the Delta VoC for a moderate seeding of 5 seeds per week, when varying the school size.
The class closure threshold is set to eight detected cases and there is no school closure threshold. The epidemic is simulated for 100 days. For an increase in the school size, the attack rate increases and the NSDL decreases.
Appendix 1—figure 18
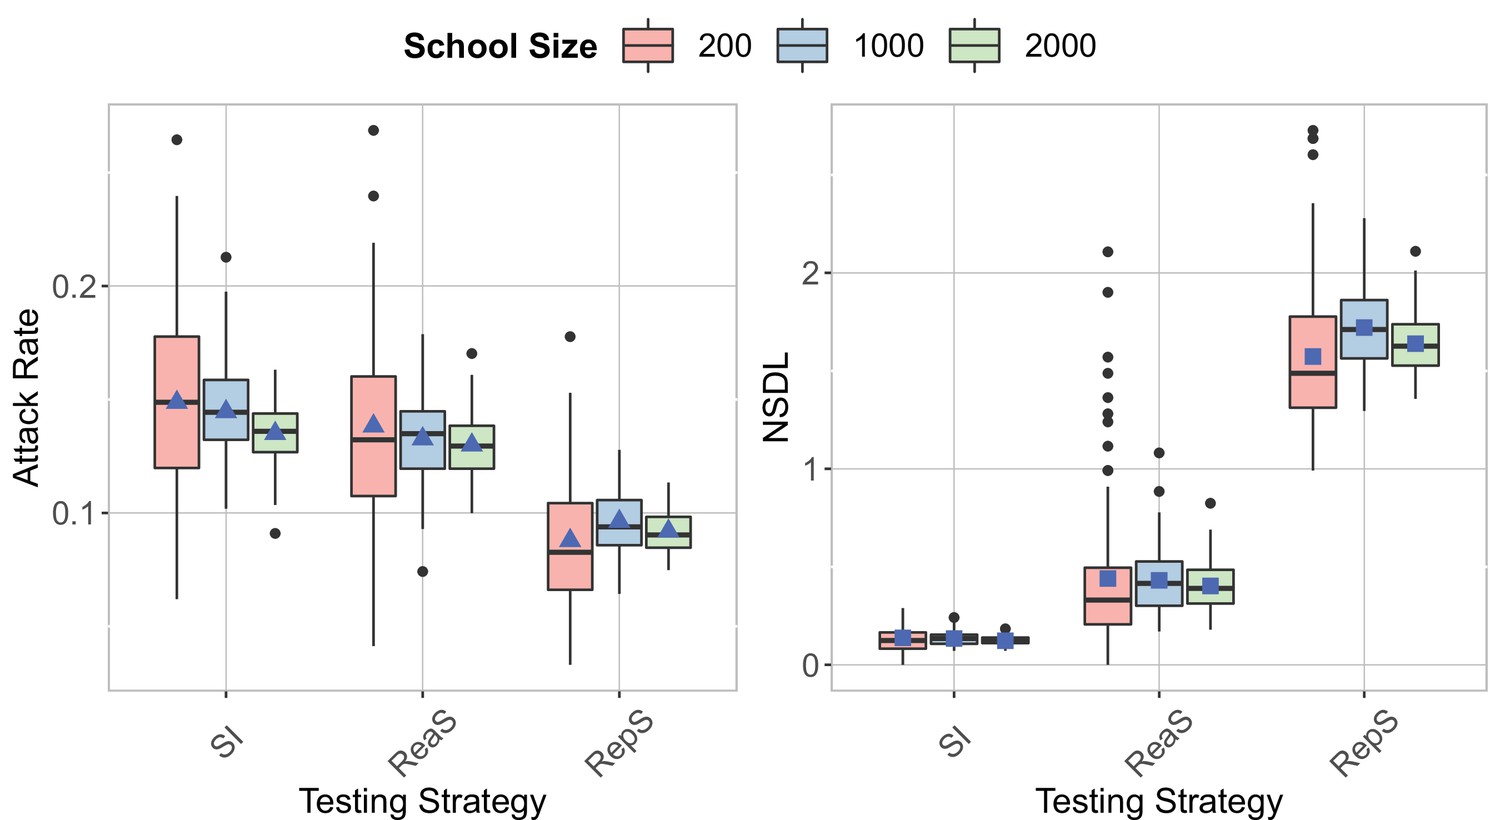
We show the testing strategies in the context of the Delta VoC for a seeding of 1 case per week for a school of size 200, 5 seeds per week for a school of size 1000 and 10 seeds per week for a school of size 2000.
The class closure threshold is set to eight detected cases and there is no school closure threshold. The epidemic is simulated for 100 days. This experiment shows that a high stochasticity for a small school size, but similar attack rates and NSDL when the proportion of seeds over the school size is the same.
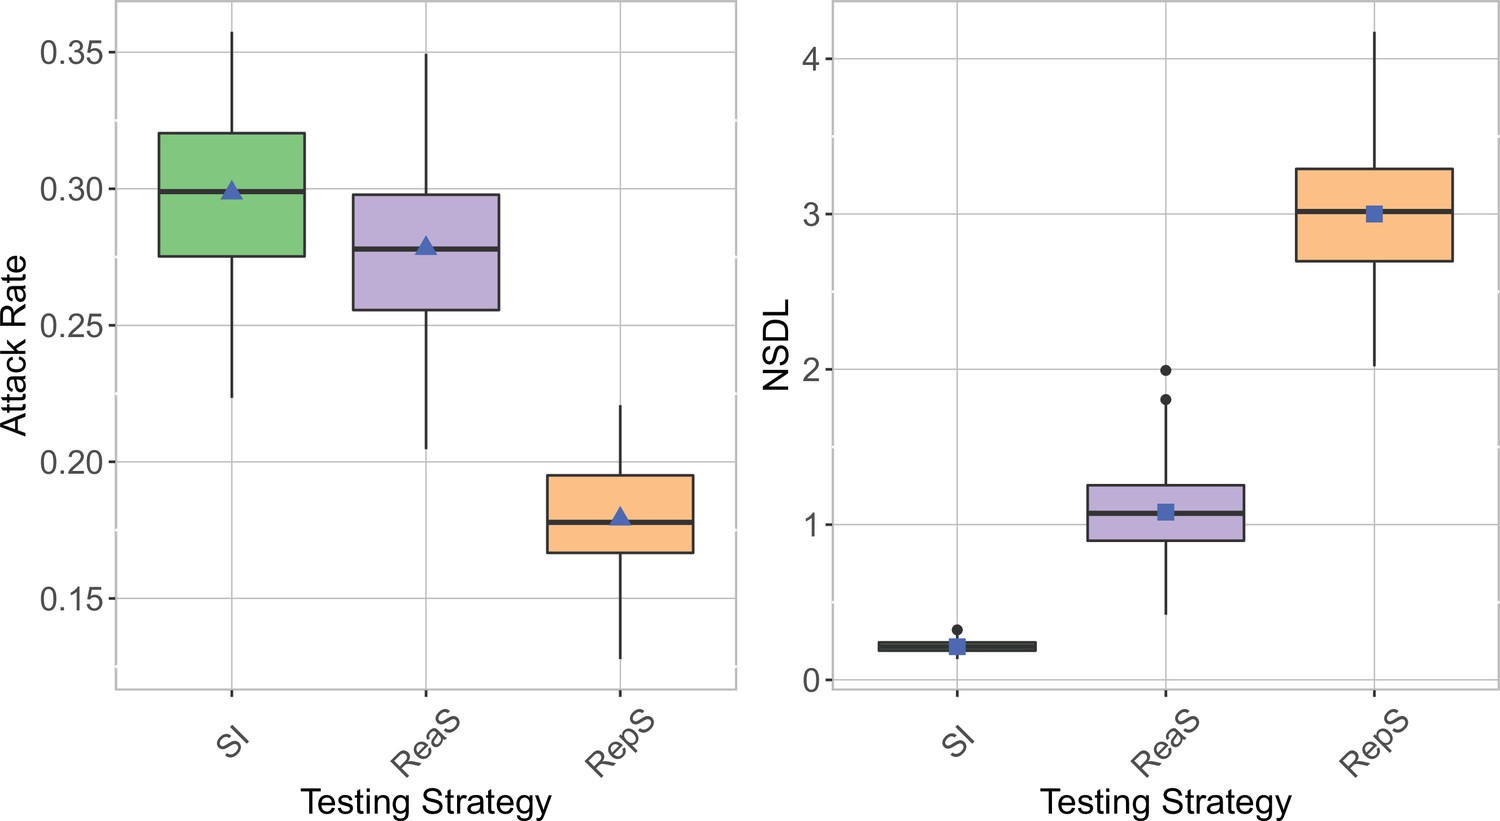
Appendix 1—figure 19
We show the testing strategies in the context of the Delta VoC for a moderate seeding of 5 seed per week when no class and school closures are considered.
The epidemic is simulated for 100 days. This experiment shows that repetitive testing decreases the attack rate while increasing the NSDL compared to the other testing strategies.
Appendix 1—figure 20
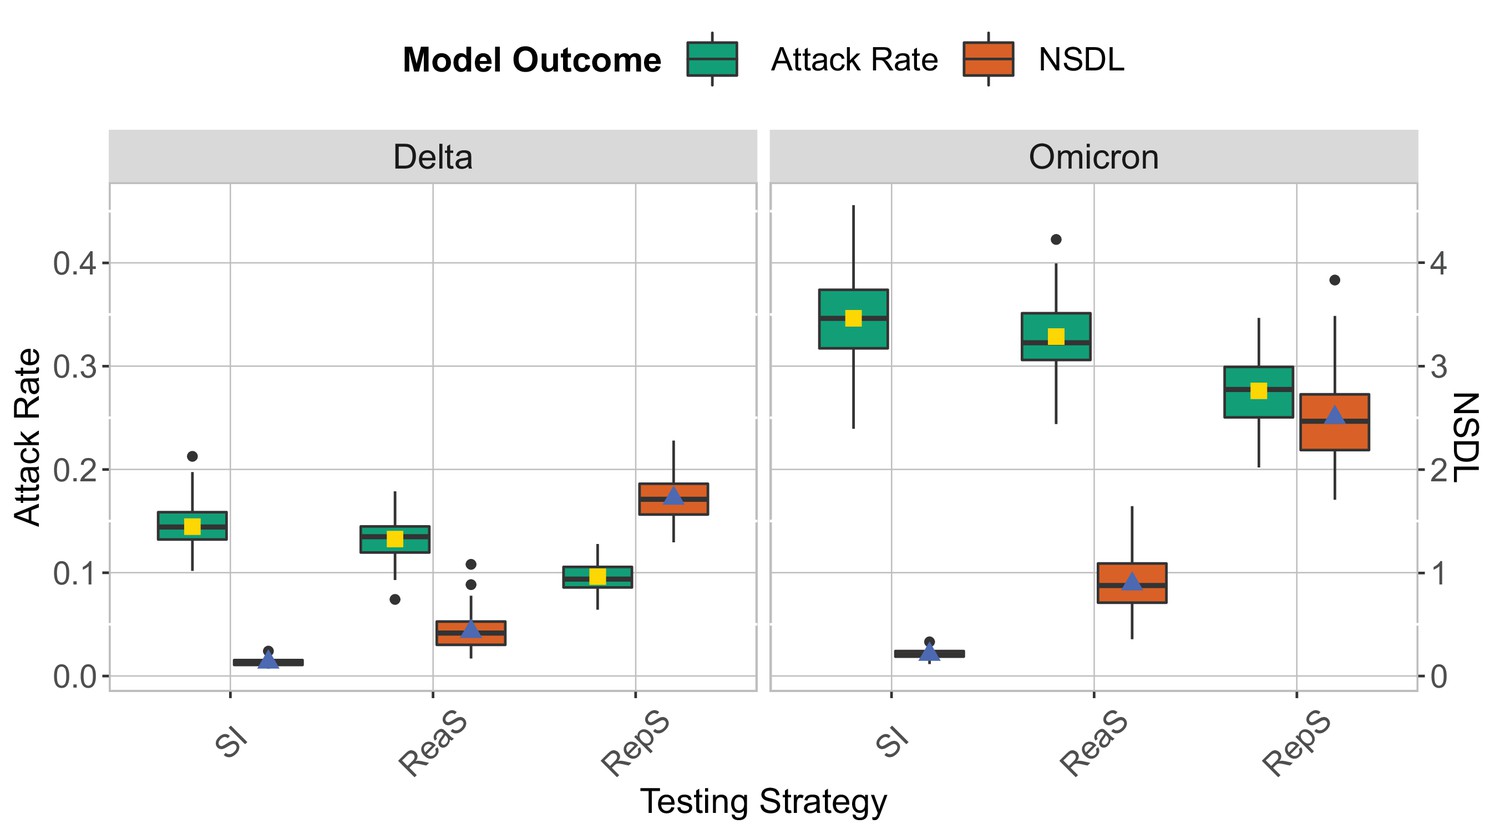
We show the testing strategies in the context of the Delta and Omicron variants for a moderate seeding of 5 seeds per week, when no school closure is considered and the class threshold is set to value 8.
The epidemic is simulated for 100 days. Omicron is implemented by lowering the immunity proportion to 0.1 for children and 0.5 for adults, and by considering a shorter incubation period (mean 3.3 days and standard deviation of 2.2 days). This experiment shows that it is more difficult to contain the Omicron strain in a school setting. The repetitive screening strategy is shown to decrease the attack rate compared to reactive screening and symptomatic isolation while increasing the NSDL.
Appendix 1—figure 21
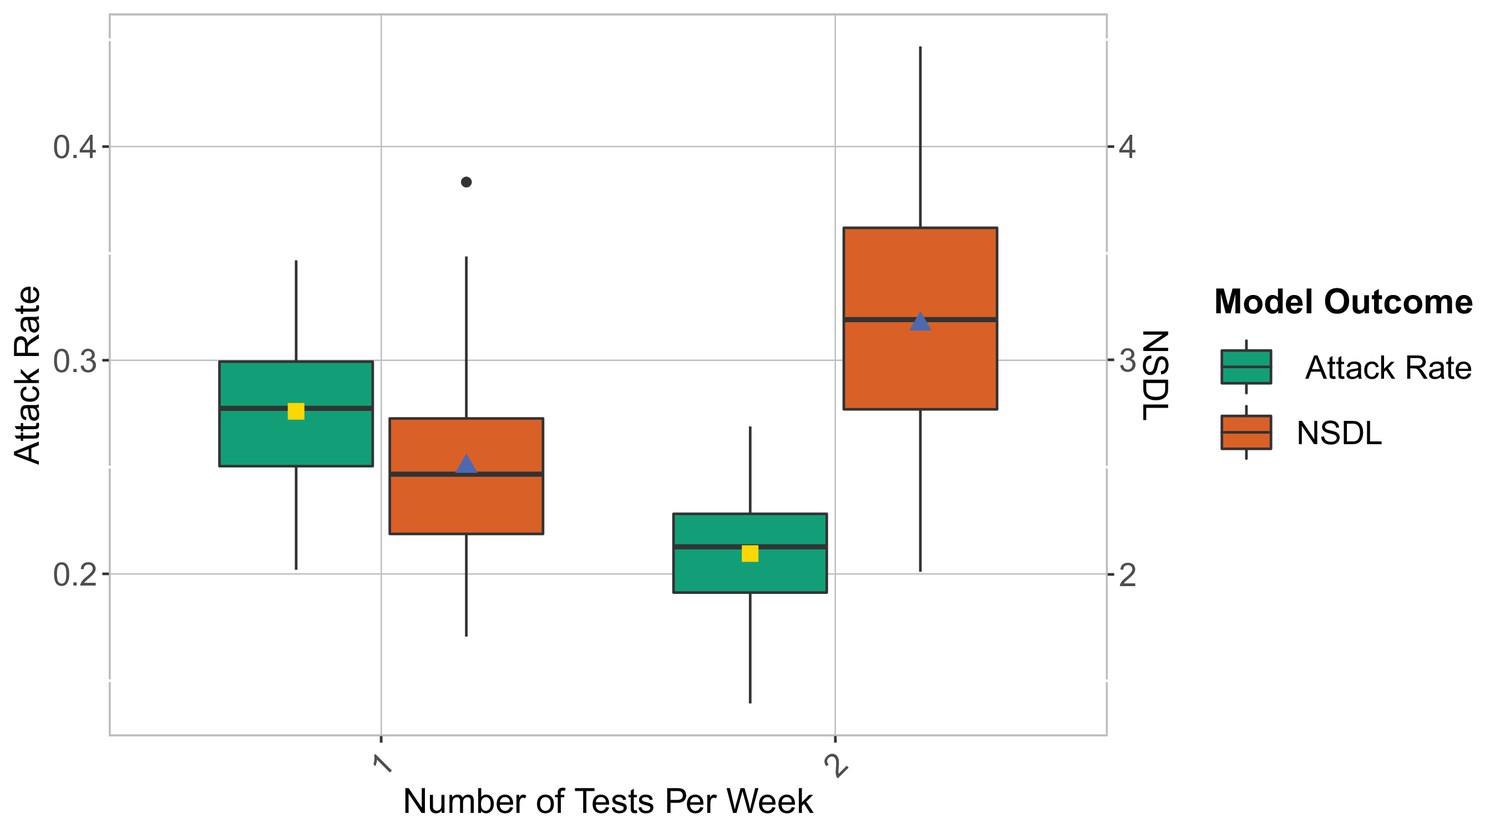
We show the repetitive testing strategy in the context of the Omicron VoC for a moderate seeding of 5 seeds per week, where we consider a repetitive testing strategy where the entire school population is tested either once or twice per week.
We consider class closure threshold of 8 and no school closure threshold. The epidemic is simulated for 100 days. This experiment demonstrates that in the contest of Omicron, repetitive testing can further reduce the number of transmissions at school when twice testing per week is considered.
Appendix 1—figure 22

We show the testing strategies compared to a no-testing scenario (No Testing) in the context of the Delta variants for a moderate seeding of 5 seeds per week.
when school and class closures are set, respectively, to 20 and 2 detected cases. The epidemic is simulated for 100 days. This experiment shows that symptomatic isolation and the no testing scenario have a similar performance.
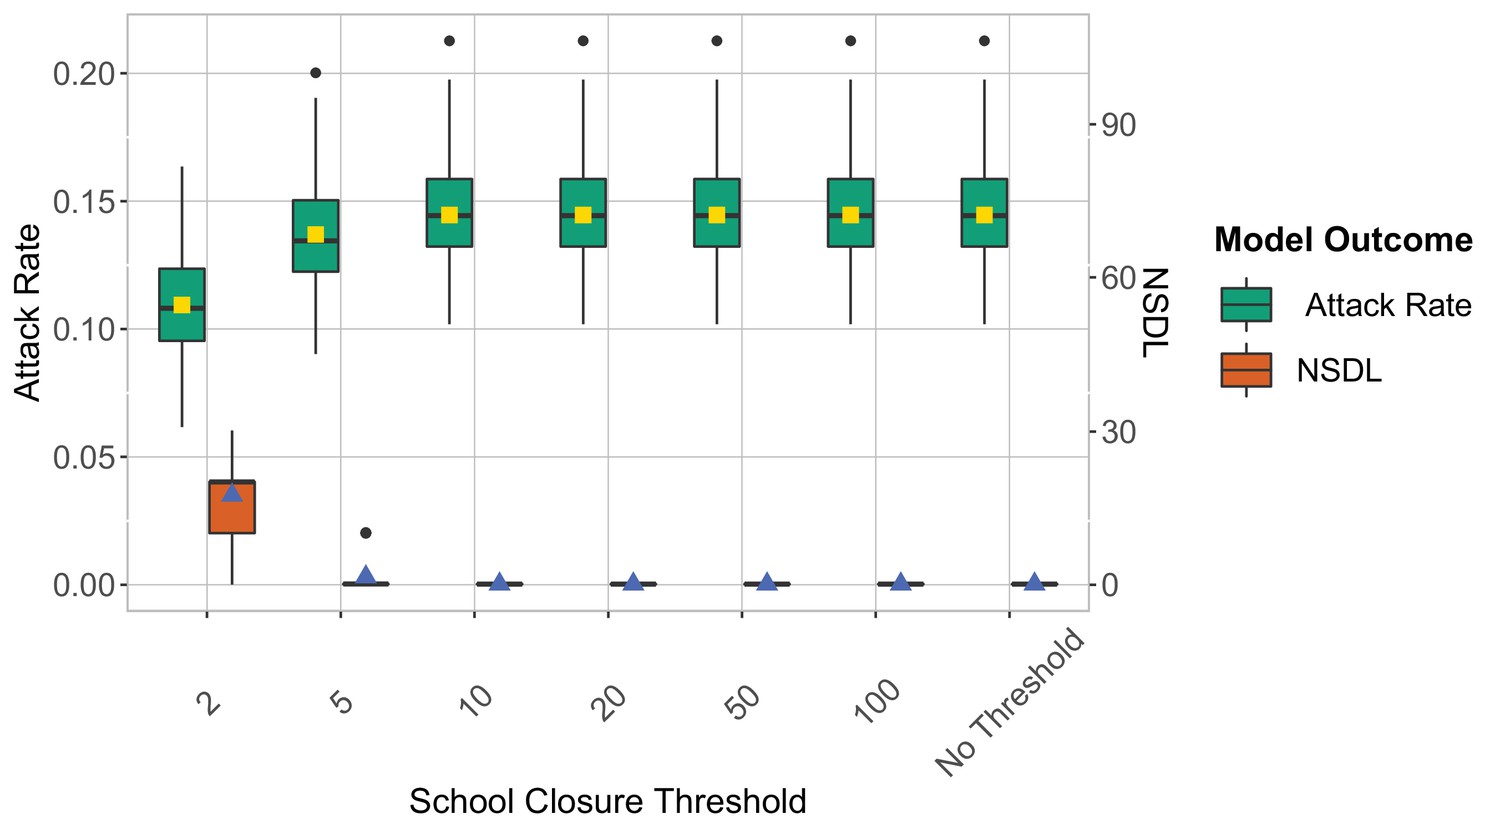
Appendix 1—figure 23
We show the symptomatic isolation strategy in the context of the Delta VoC for a moderate seeding of 5 seeds per week, where we consider different class closure thresholds, and no school closure threshold.
The epidemic is simulated for 100 days. We note that in this experiment symptomatic isolation performs similarly for different class closure thresholds.
Appendix 1—figure 24
We show the reactive screening strategy in the context of the Delta VoC for a moderate seeding of 5 seeds per week, where we consider different class closure thresholds, and no school closure threshold.
The epidemic is simulated for 100 days. We note that in this experiment symptomatic isolation performs similarly for different class closure thresholds.
Tables
Table 1
Median and 95% Quantile Interval - Class closure threshold scenario.
| Class Closure Threshold | Summary Measure | Median | 95% Quantile Interval |
|---|---|---|---|
| 2 | Attack Rate | 0.08 | [0.07,0.11] |
| 4 | Attack Rate | 0.09 | [0.07,0.12] |
| 6 | Attack Rate | 0.09 | [0.07,0.12] |
| 8 | Attack Rate | 0.09 | [0.07,0.12] |
| No Threshold | Attack Rate | 0.09 | [0.07,0.11] |
| 2 | NSDL | 9.5 | [7.86, 11.16] |
| 4 | NSDL | 3.6 | [2.50, 4.81] |
| 6 | NSDL | 2.01 | [1.46, 2.83] |
| 8 | NSDL | 1.71 | [1.36, 2.17] |
| No Threshold | NSDL | 1.61 | [1.39, 1.91] |
Additional files
Download links
A two-part list of links to download the article, or parts of the article, in various formats.
Downloads (link to download the article as PDF)
Open citations (links to open the citations from this article in various online reference manager services)
Cite this article (links to download the citations from this article in formats compatible with various reference manager tools)
Controlling SARS-CoV-2 in schools using repetitive testing strategies
eLife 11:e75593.
https://doi.org/10.7554/eLife.75593


