Role of anterior insula cortex in context-induced relapse of nicotine-seeking
- Department of Pharmacology, Medical University of Innsbruck, Austria
- Amsterdam UMC location Vrije Universiteit Amsterdam, Department of Anatomy & Neurosciences, Netherlands
- Amsterdam Neuroscience, Compulsivity Impulsivity and Attention, Netherlands
- Department of Integrative Neurophysiology, Center for Neurogenomics and Cognitive Research, Amsterdam Neuroscience, Vrije Universiteit, Netherlands
- School of Psychology, University of New South Wales, Australia
Figures
Figure 1
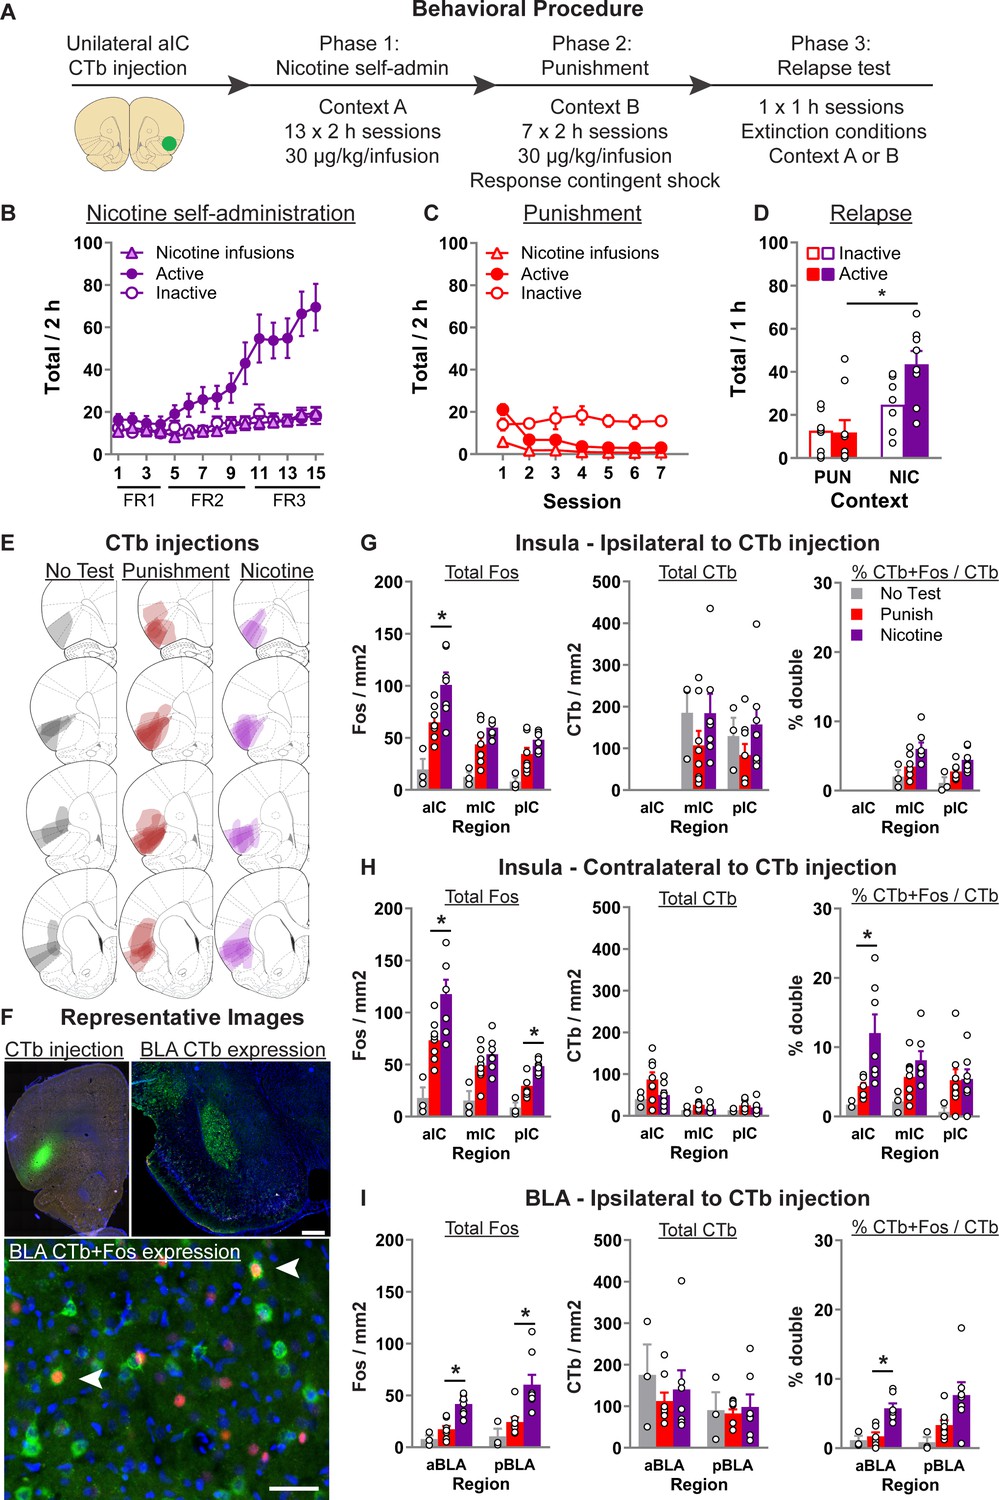
Context-induced relapse of punished nicotine-seeking is associated with selective activation of BLA → aIC and contralateral aIC → aIC projections.
(A) Outline of the experimental procedure (n = 19 females). Mean ± standard error of the mean (SEM) active and inactive nose-pokes, and nicotine infusions, during nicotine self-administration in context A (B), punishment in context B (C), and the context-induced nicotine-relapse test in context B or A (D). (E) Representative plots of the spread of CTb injections for the three groups. (F) Representative images of CTb injection in aIC, and CTb + Fos in BLA. Data are mean ± SEM number of Fos or CTb neurons per mm2, and percentage Ctb + Fos neurons, in the IC hemisphere ipsilateral to CTb injection (G), insular cortex (IC) hemisphere contralateral to the CTb injection (H), or BLA ipsilateral to the CTb injection (I). *p < 0.05; aIC, anterior insula cortex; mIC, middle insula cortex; pIC, posterior insula cortex; BLA, basolateral amygdala; FR, fixed-ratio.
-
Figure 1—source data 1
Figure 1 - raw data.
- https://cdn.elifesciences.org/articles/75609/elife-75609-fig1-data1-v2.xlsx
Figure 2 with 2 supplements
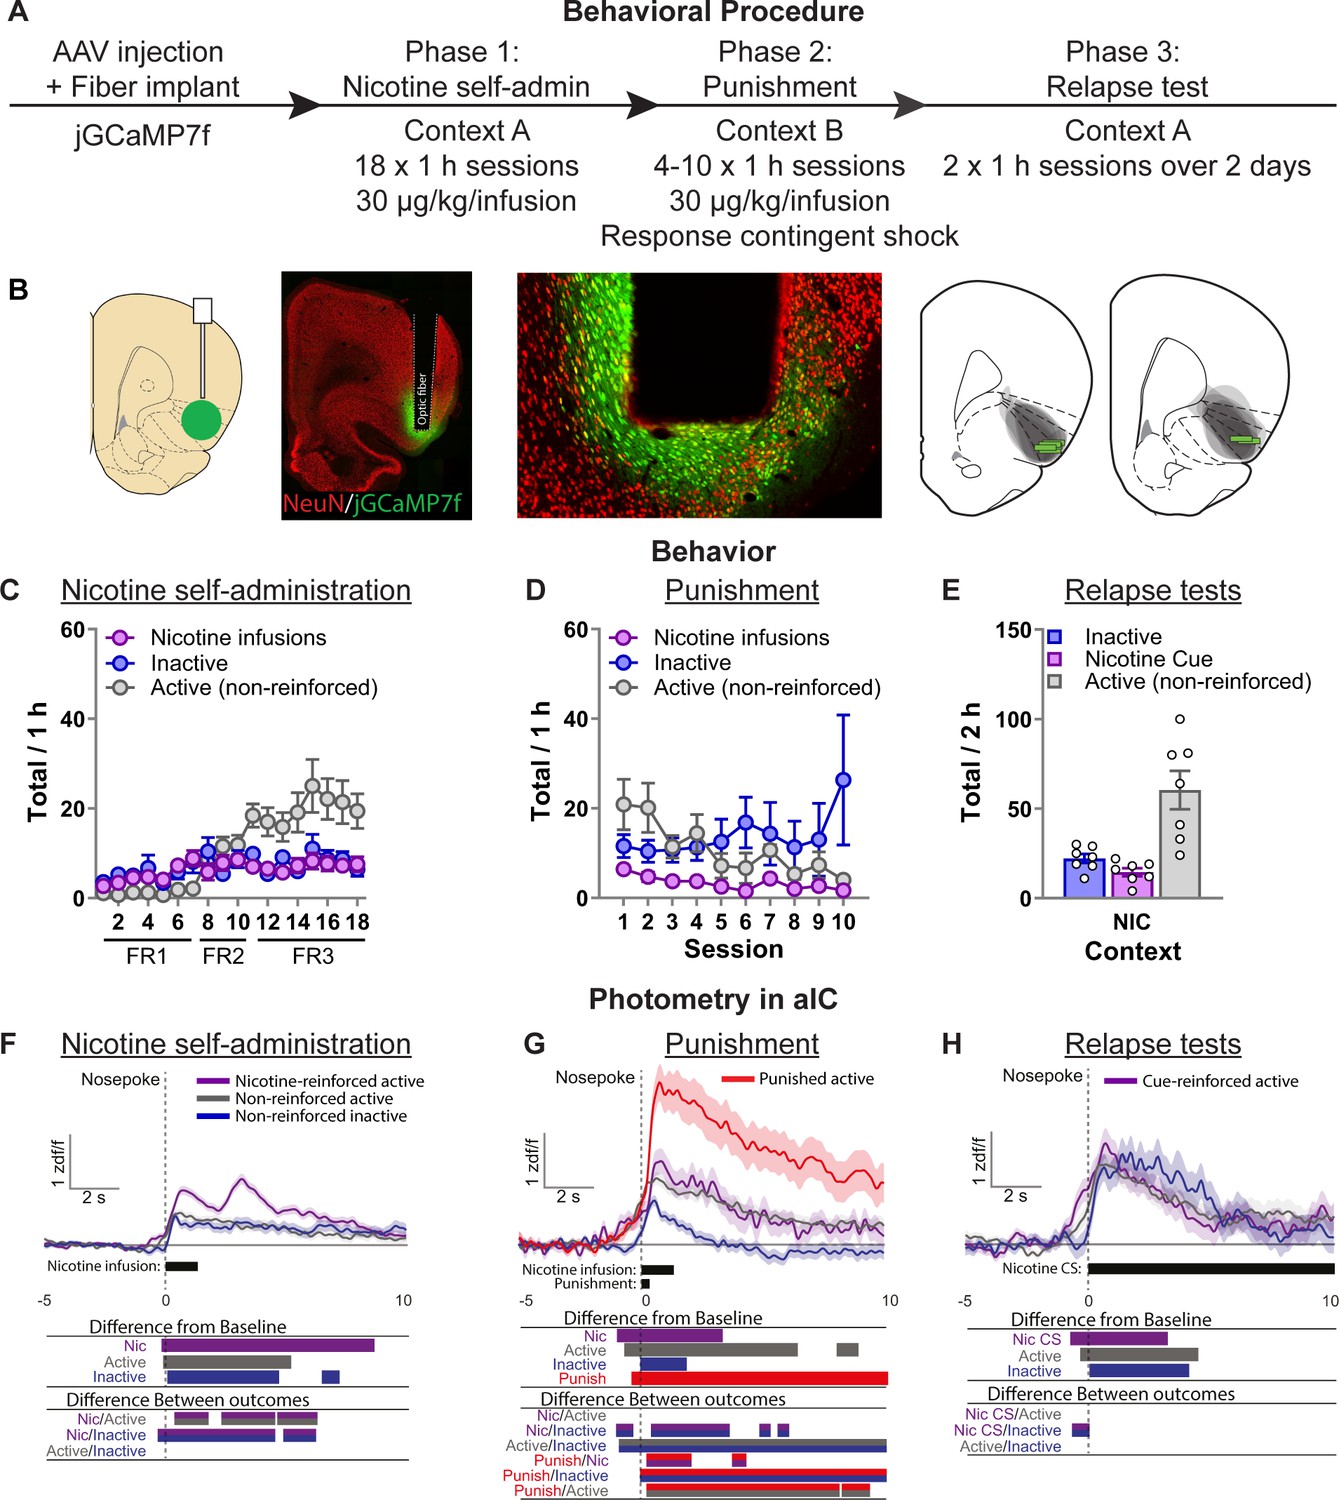
Photometry reveals nicotine and punishment-associated activity in anterior insula cortex (aIC).
(A) Outline of the experimental procedure (n = 7 female). (B) Representative images of jGCaMP7f expression and fiber implant in aIC. Mean ± standard error of the mean (SEM) nicotine infusions, inactive nose-pokes, and nonreinforced active nose-pokes during nicotine self-administration in context A (C), punishment in context B (D), and the context-induced nicotine-seeking tests (E). (F) Ca2+ traces around the nose-poke in aIC self-administration in context A (Reinforced active [Nic]: n = 751; Nonreinforced active: n = 838; Inactive: n = 588). (G) Ca2+ traces around the nose-poke in aIC during punishment in context B (Reinforced active [Nic]: n = 89; Nonreinforced active: n = 366; Inactive: n = 318; Punish: n = 137). (H) Ca2+ traces around the nose-poke in aIC during context-induced relapse test in context A (Active + Nic CS: n = 95; Active nonreinforced: n = 187; Inactive: n = 80). For all photometry traces, bars at bottom of graph indicate significant deviations from baseline (dF/F ≠ 0), or significant differences between the specific events (Nicotine infusion, nonreinforced active nose-poke, inactive nose-poke, Punishment, or Nicotine CS), determined via bootstrapped confidence intervals (95% CIs), and permutation tests with alpha 0.008 and 0.01 for comparisons between punishment sessions, and self-administration and tests, respectively. Vertical dashed line indicates nose-poke, horizontal line indicates baseline (dF/F = 0).
-
Figure 2—source data 1
Figure 2 - raw data and statistical outputs.
- https://cdn.elifesciences.org/articles/75609/elife-75609-fig2-data1-v2.xlsx
Figure 2—figure supplement 1
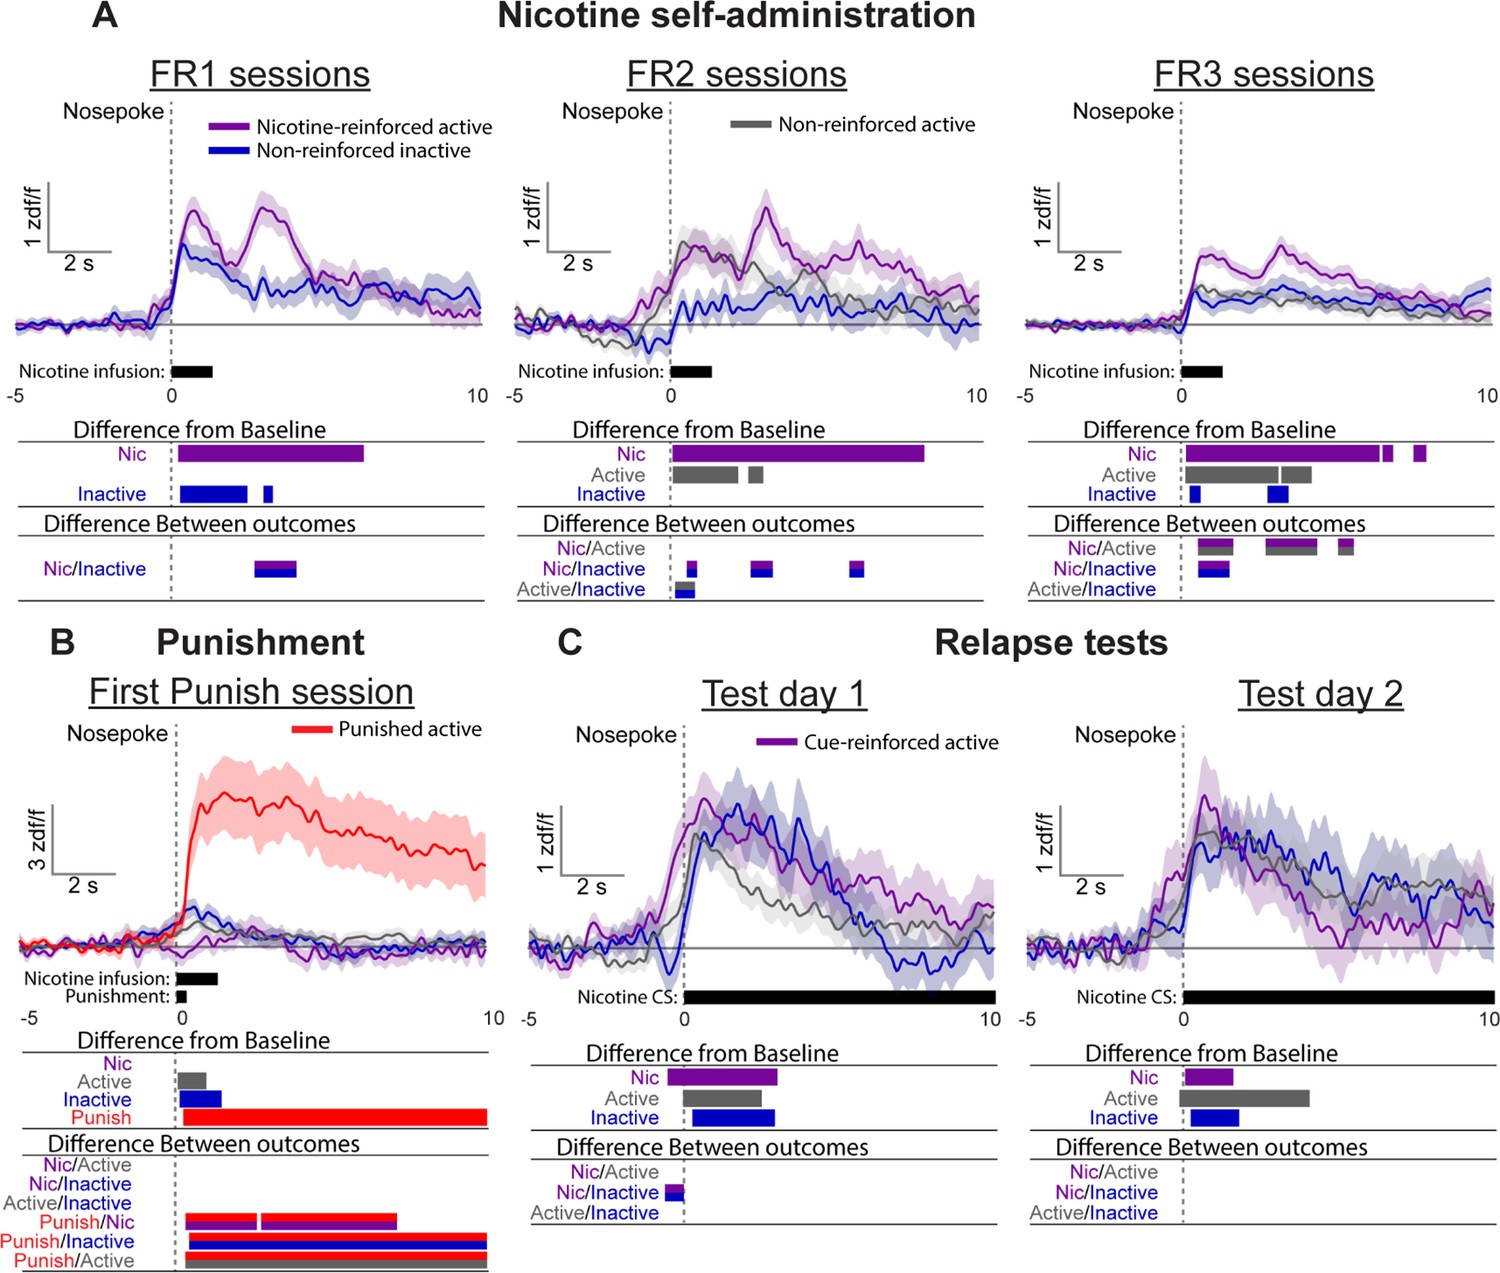
Additional photometry analysis across phases.
(A) Ca2+ traces around the nose-poke in anterior insula cortex (aIC) self-administration during FR1 (left; Reinforced active [Nic]: n = 213, Inactive: n = 151), FR2 (middle; Reinforced active [Nic]: n = 156; Nonreinforced active: n = 150; Inactive: n = 114), and FR3 (right; Reinforced active [Nic]: n = 382; Nonreinforced active: n = 685; Inactive: n = 323). (B) Ca2+ traces around the nose-poke in aIC during the first punishment session (Reinforced active [Nic]: n = 17; Nonreinforced active: n = 85; Inactive: n = 54; Punish: n = 25). (C) Ca2+ traces around the nose-poke in aIC during context-induced relapse test in context A during test day 1 (left; Reinforced active [Nic]: n = 42; Nonreinforced active: n = 88; Inactive: n = 40) and test day 2 (right; Reinforced active [Nic]: n = 53; Nonreinforced active: n = 99; Inactive: n = 40). For all photometry traces, bars at bottom of graph indicate significant deviations from baseline (dF/F ≠ 0) determined via bootstrapped confidence intervals (95% CI), or significant differences between the specific events (Nicotine infusion, nonreinforced active nose-poke, inactive nose-poke, Punishment, or Nicotine CS), determined by permutation tests with alpha 0.008 and 0.01 for comparisons between punishment sessions, and self-administration and tests, respectively. Vertical dashed line indicates nose-poke, horizontal line indicates baseline (z-dF/F=0).
-
Figure 2—figure supplement 1—source data 1
Figure 2 - figure supplement 1 statistical outputs.
- https://cdn.elifesciences.org/articles/75609/elife-75609-fig2-figsupp1-data1-v2.xlsx
Figure 2—figure supplement 2
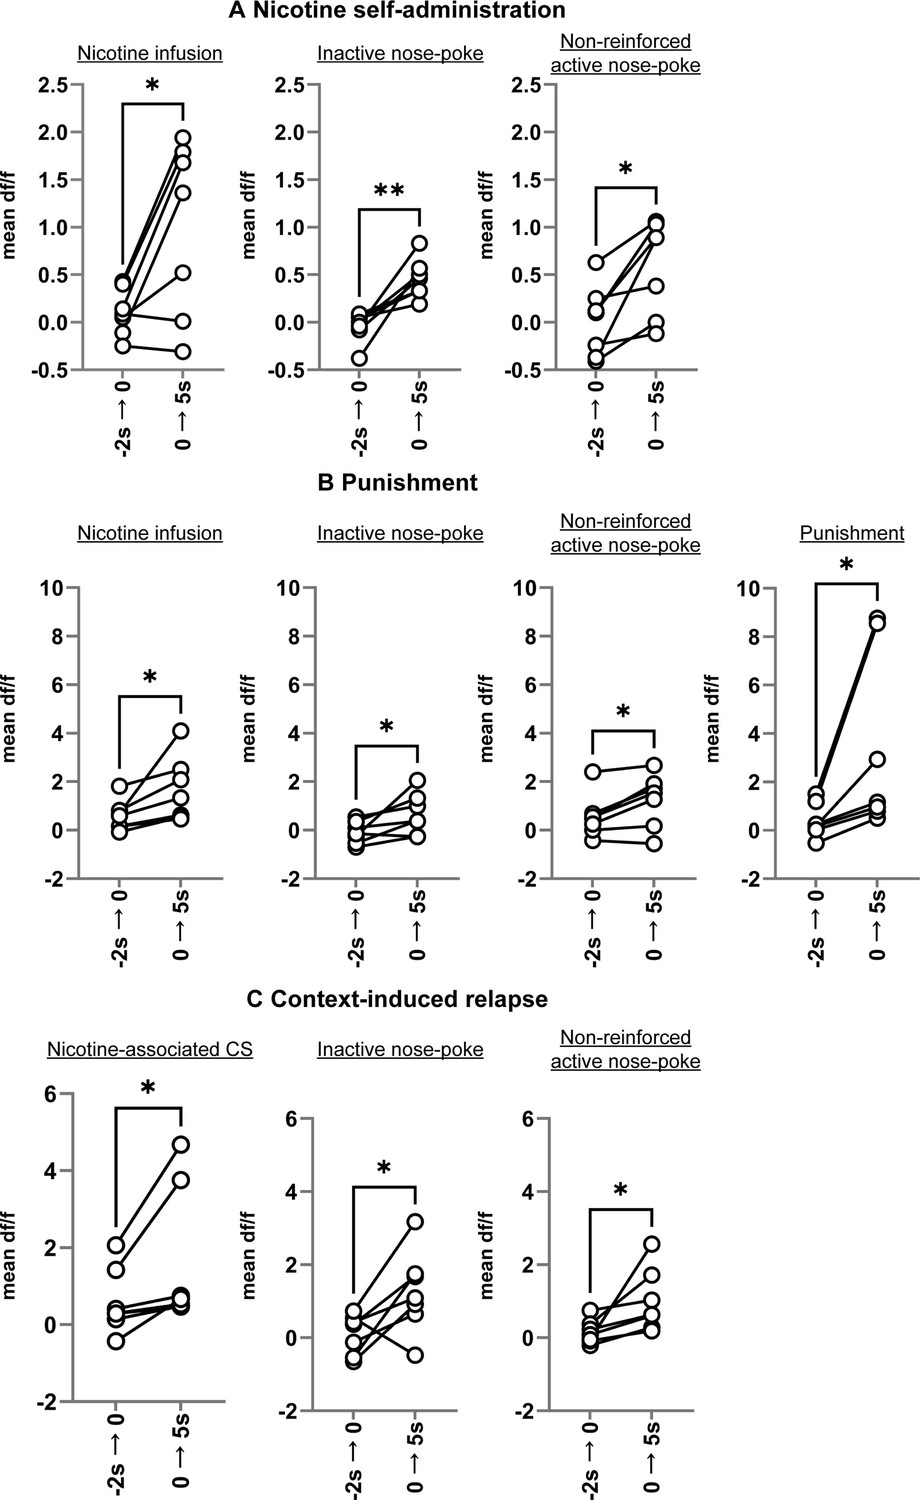
Mean df/f analysis of the photometry data.
(A) Mean df/f for the different response types during nicotine self-administration. (B) Mean df/f for the different response types during nicotine punishment. (C) Mean df/f for the different response types during the context-induced relapse tests in context A. *p < 0.05; **p < 0.01.
-
Figure 2—figure supplement 2—source data 1
Figure 2 - figure supplement 2 raw data.
- https://cdn.elifesciences.org/articles/75609/elife-75609-fig2-figsupp2-data1-v2.xlsx
Figure 3
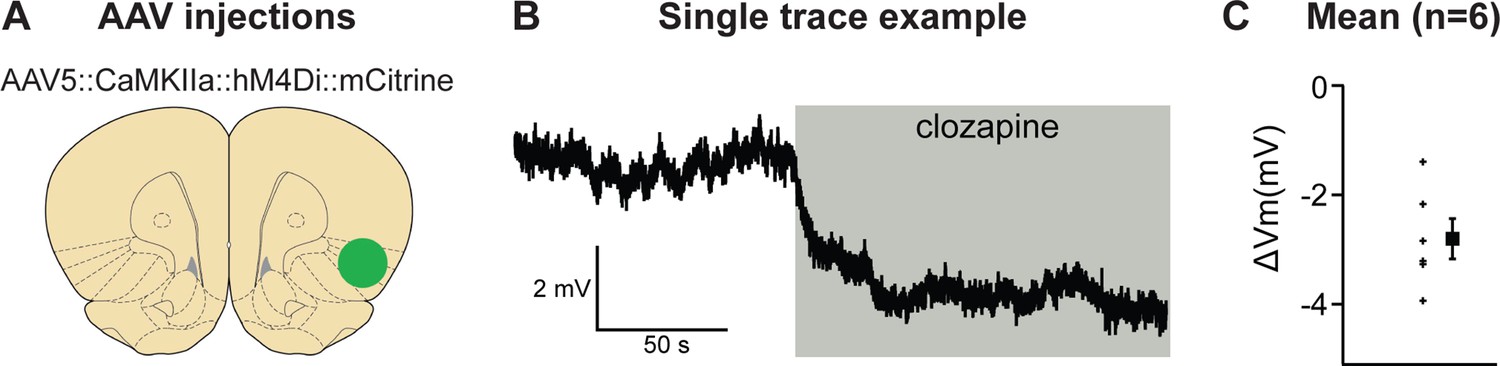
Validation of chemogenetic inhibition of anterior insula cortex (aIC) neurons expressing hM4Di by clozapine.
(A) The virus injection location. (B) Example trace of inward current demonstrating clear clozapine-induced hyperpolarization of the hM4Di expressing neurons. (C) The average hyperpolarization induced by clozapine for the n = 6 neurons recorded (left) and the mean hyperpolarization (right) for these neurons.
-
Figure 3—source data 1
Figure 3 - raw data.
- https://cdn.elifesciences.org/articles/75609/elife-75609-fig3-data1-v2.xlsx
Figure 4 with 1 supplement
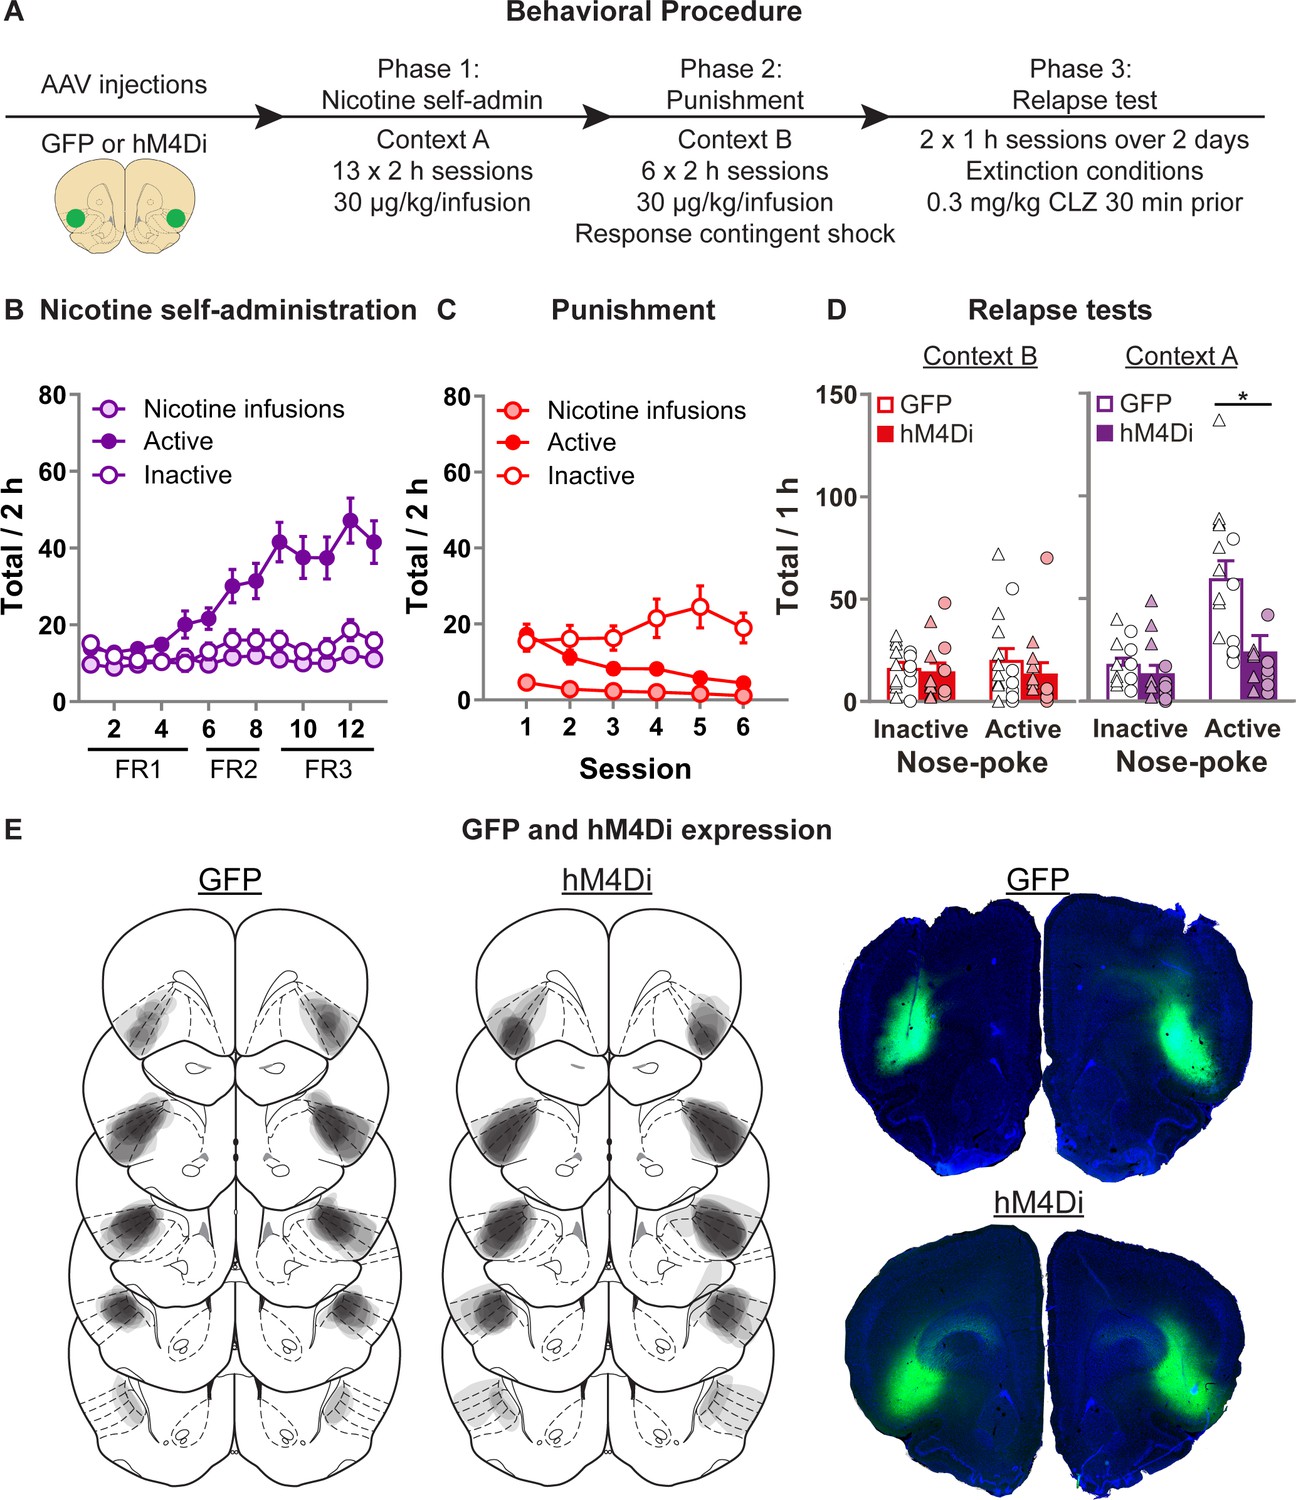
Effect of chemogenetic inhibition of anterior insula cortex (aIC) on context-induced relapse of punished nicotine-seeking.
(A) Outline of the experimental procedure (n = 15 females, 13 males). (B) Mean ± standard error of the mean (SEM) nicotine infusions, active, inactive nose-pokes during nicotine self-administration in context A. (C) Mean ± SEM nicotine infusions, active, inactive nose-pokes during punishment in context B. (D) Mean ± SEM nose-pokes during the context-induced relapse tests. Individual data also plotted, triangles = female, circles = male. (E) Representative plots of the spread of GFP (left) and hM4Di (middle) in aIC of rats in experiment 4. Right top shows an example section of a rat showing GFP expression in aIC, and right bottom shows an example of hM4Di expression. *p < 0.05; CLZ, clozapine; FR, fixed-ratio.
-
Figure 4—source data 1
Figure 4 - raw data.
- https://cdn.elifesciences.org/articles/75609/elife-75609-fig4-data1-v2.xlsx
Figure 4—figure supplement 1
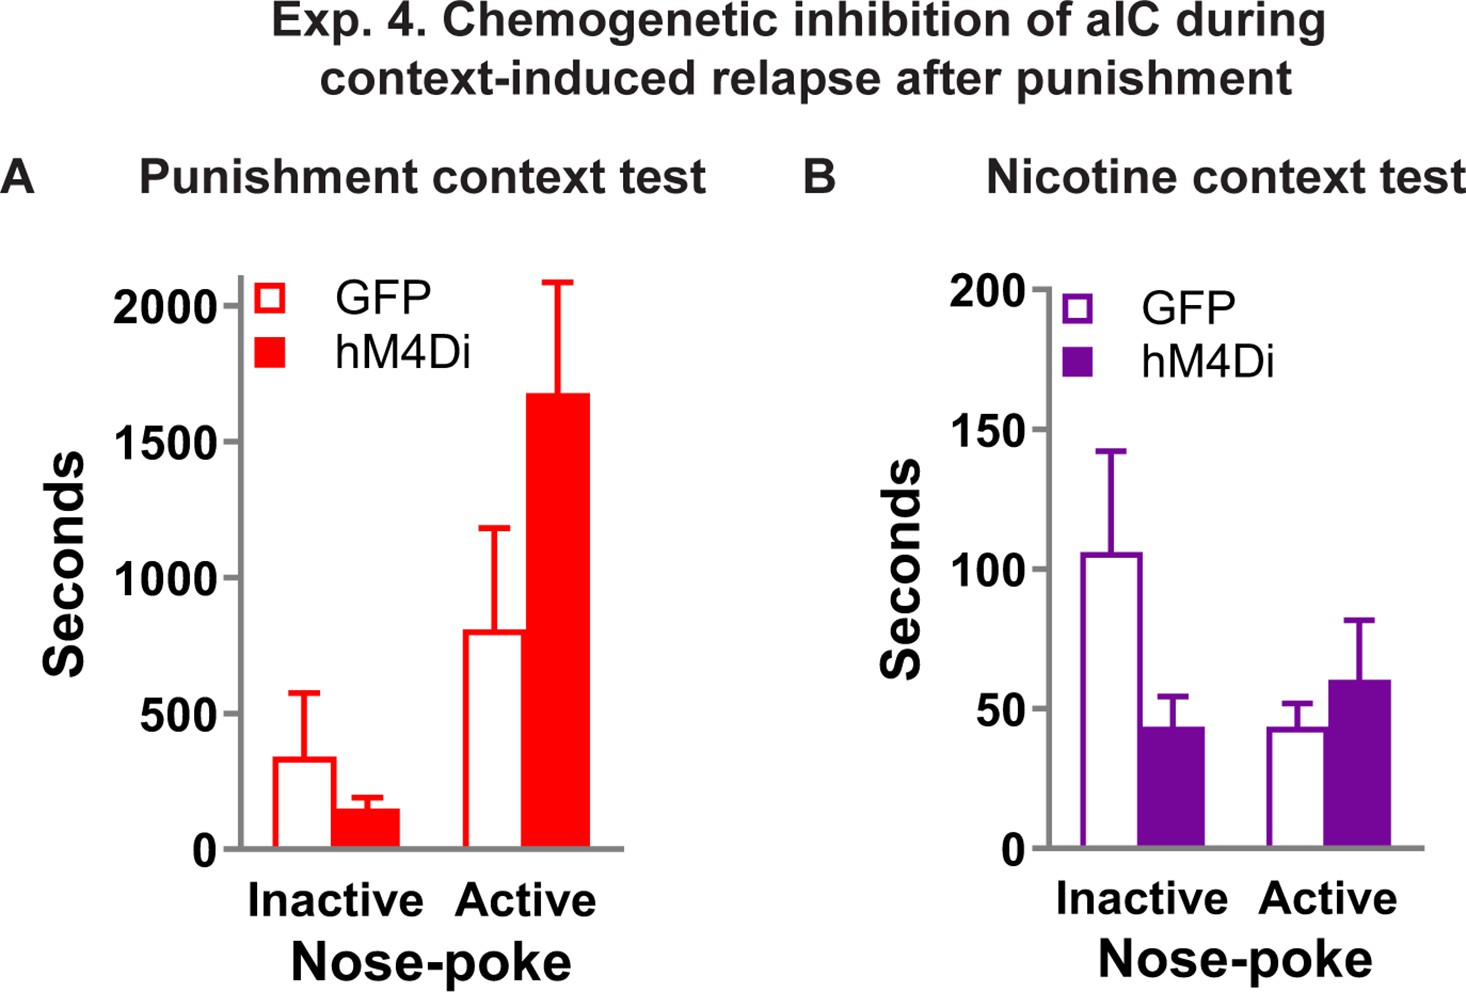
Effect of chemogenetic inhibition of anterior insula cortex (aIC) on latency to the first nose-poke during context-induced relapse tests.
Mean ± standard error of the mean (SEM) time (in seconds) for the first response to be made both the active and inactive nose-pokes during the test sessions of experiment 4. (A) Test in the punishment context (context B); (B) test in the nicotine context (context A).
-
Figure 4—figure supplement 1—source data 1
Figure 4 - figure supplement 1 raw data.
- https://cdn.elifesciences.org/articles/75609/elife-75609-fig4-figsupp1-data1-v2.xlsx
Figure 5 with 1 supplement
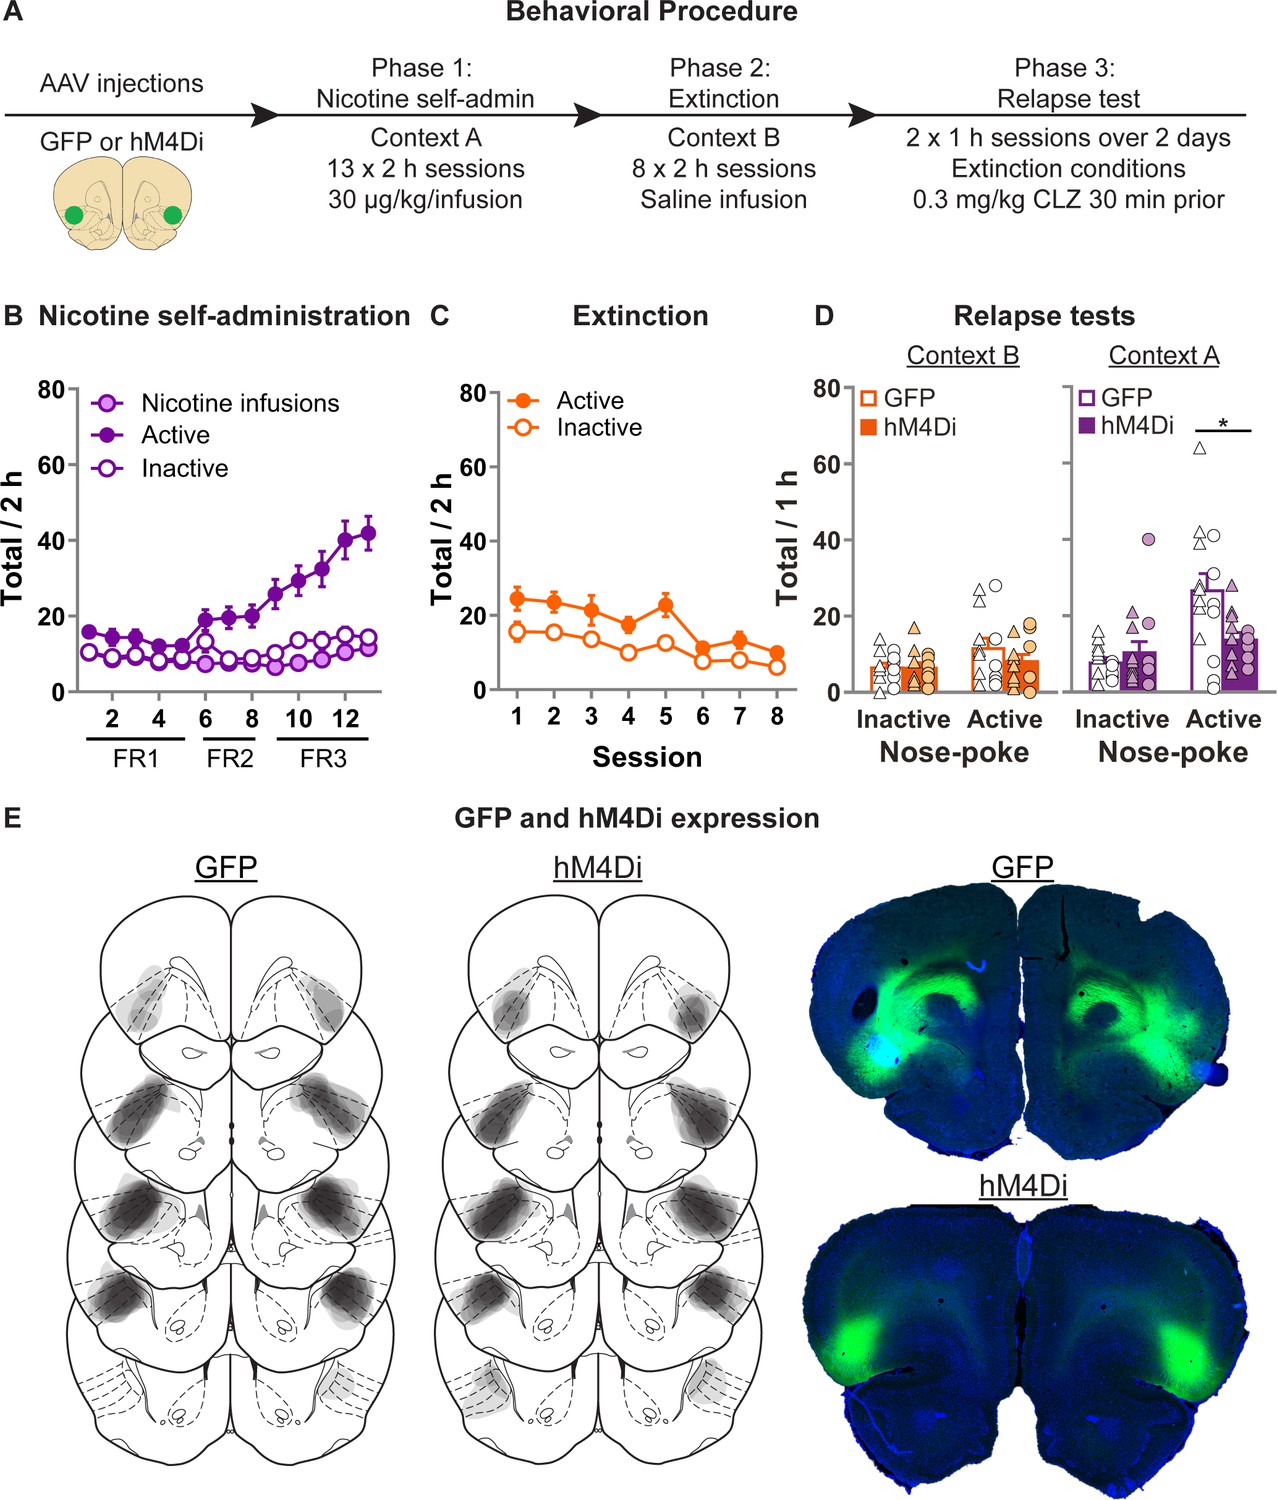
Effect of chemogenetic inhibition of anterior insula cortex (aIC) on context-induced relapse of extinguished nicotine-seeking.
(A) Outline of the experimental procedure (n = 18 females, 13 males). (B) Mean ± standard error of the mean (SEM) nicotine infusions, active, inactive nose-pokes during nicotine self-administration in context A. (C) Mean ± SEM active, inactive nose-pokes during extinction in context B. (D) Mean ± SEM nose-pokes during the context-induced relapse tests. Individual data also plotted, triangles = female, circles = male. (E) Representative plots of the spread of GFP (left) and hM4Di (middle) in aIC of rats in experiment 5. Right top shows an example section of a rat showing GFP expression in aIC, and right bottom shows an example of hM4Di expression. CLZ, clozapine; FR, fixed-ratio.
-
Figure 5—source data 1
Figure 5 - raw data.
- https://cdn.elifesciences.org/articles/75609/elife-75609-fig5-data1-v2.xlsx
Figure 5—figure supplement 1
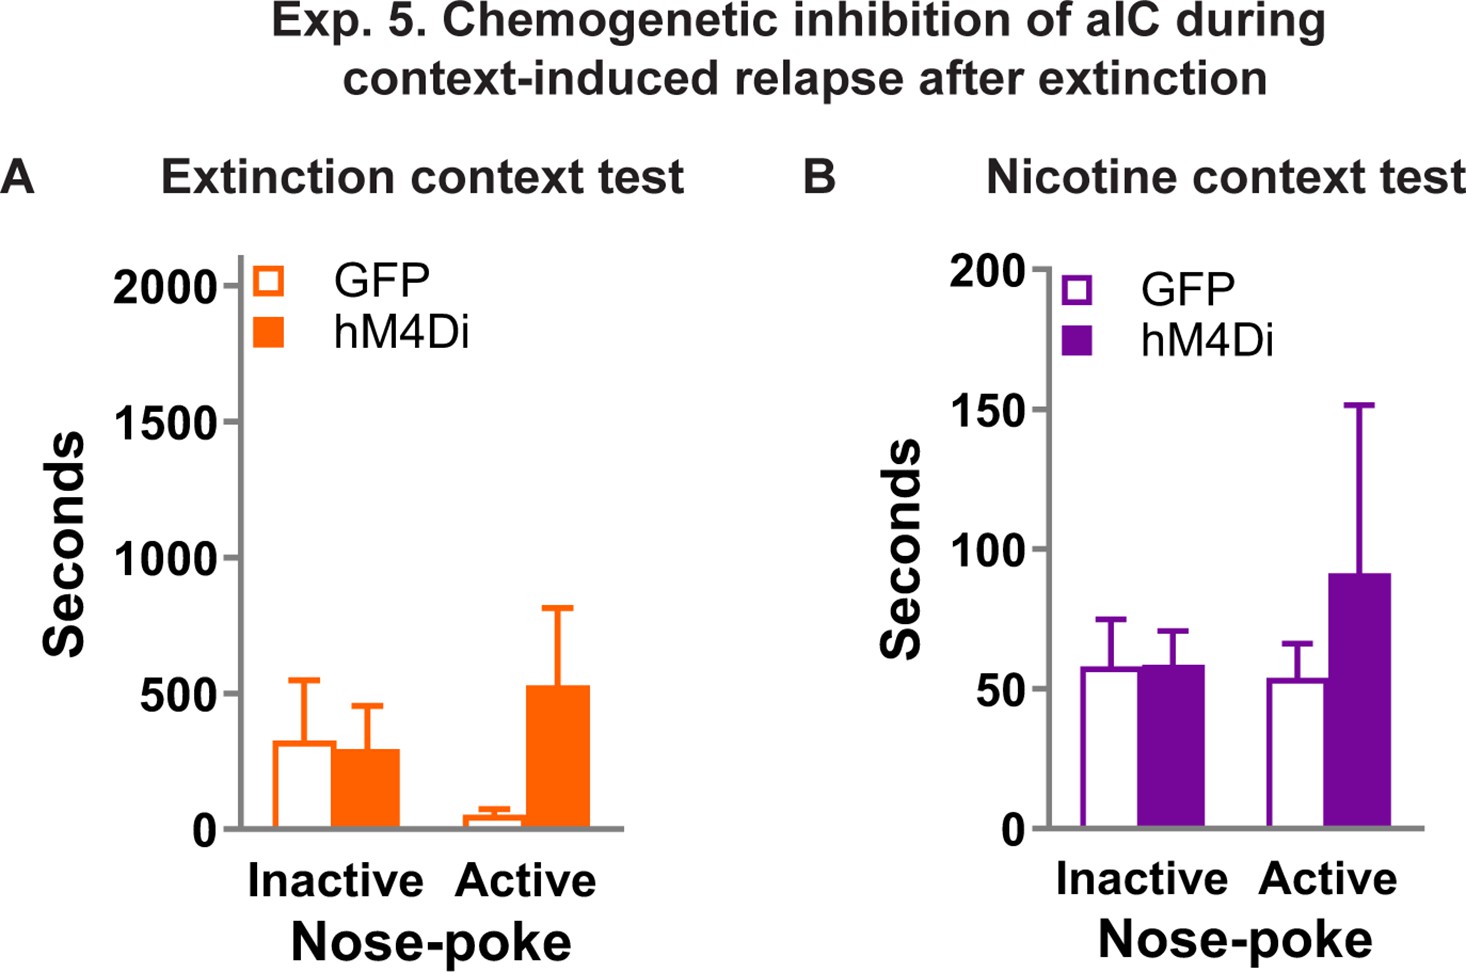
Effect of chemogenetic inhibition of anterior insula cortex (aIC) on latency to the first nose-poke during context-induced relapse tests.
Mean ± standard error of the mean (SEM) time (in seconds) for the first response to be made both the active and inactive nose-pokes during the test sessions of experiment 5. (A) Test in the extinction context (context B); (B) test in the nicotine context (context A).
-
Figure 5—figure supplement 1—source data 1
Figure 5 - figure supplement 1 raw data.
- https://cdn.elifesciences.org/articles/75609/elife-75609-fig5-figsupp1-data1-v2.xlsx
Additional files
Download links
A two-part list of links to download the article, or parts of the article, in various formats.
Downloads (link to download the article as PDF)
Open citations (links to open the citations from this article in various online reference manager services)
Cite this article (links to download the citations from this article in formats compatible with various reference manager tools)
Role of anterior insula cortex in context-induced relapse of nicotine-seeking
eLife 11:e75609.
https://doi.org/10.7554/eLife.75609


