Nanoscale architecture and coordination of actin cores within the sealing zone of human osteoclasts
- Institut de Pharmacologie et de Biologie Structurale, Université de Toulouse, CNRS, UPS, France
- LITC Core Facility, Centre de Biologie Intégrative, Université de Toulouse, CNRS, UPS, France
- LAAS-CNRS, Université de Toulouse, CNRS, INSA, France
Figures
Figure 1 with 2 supplements
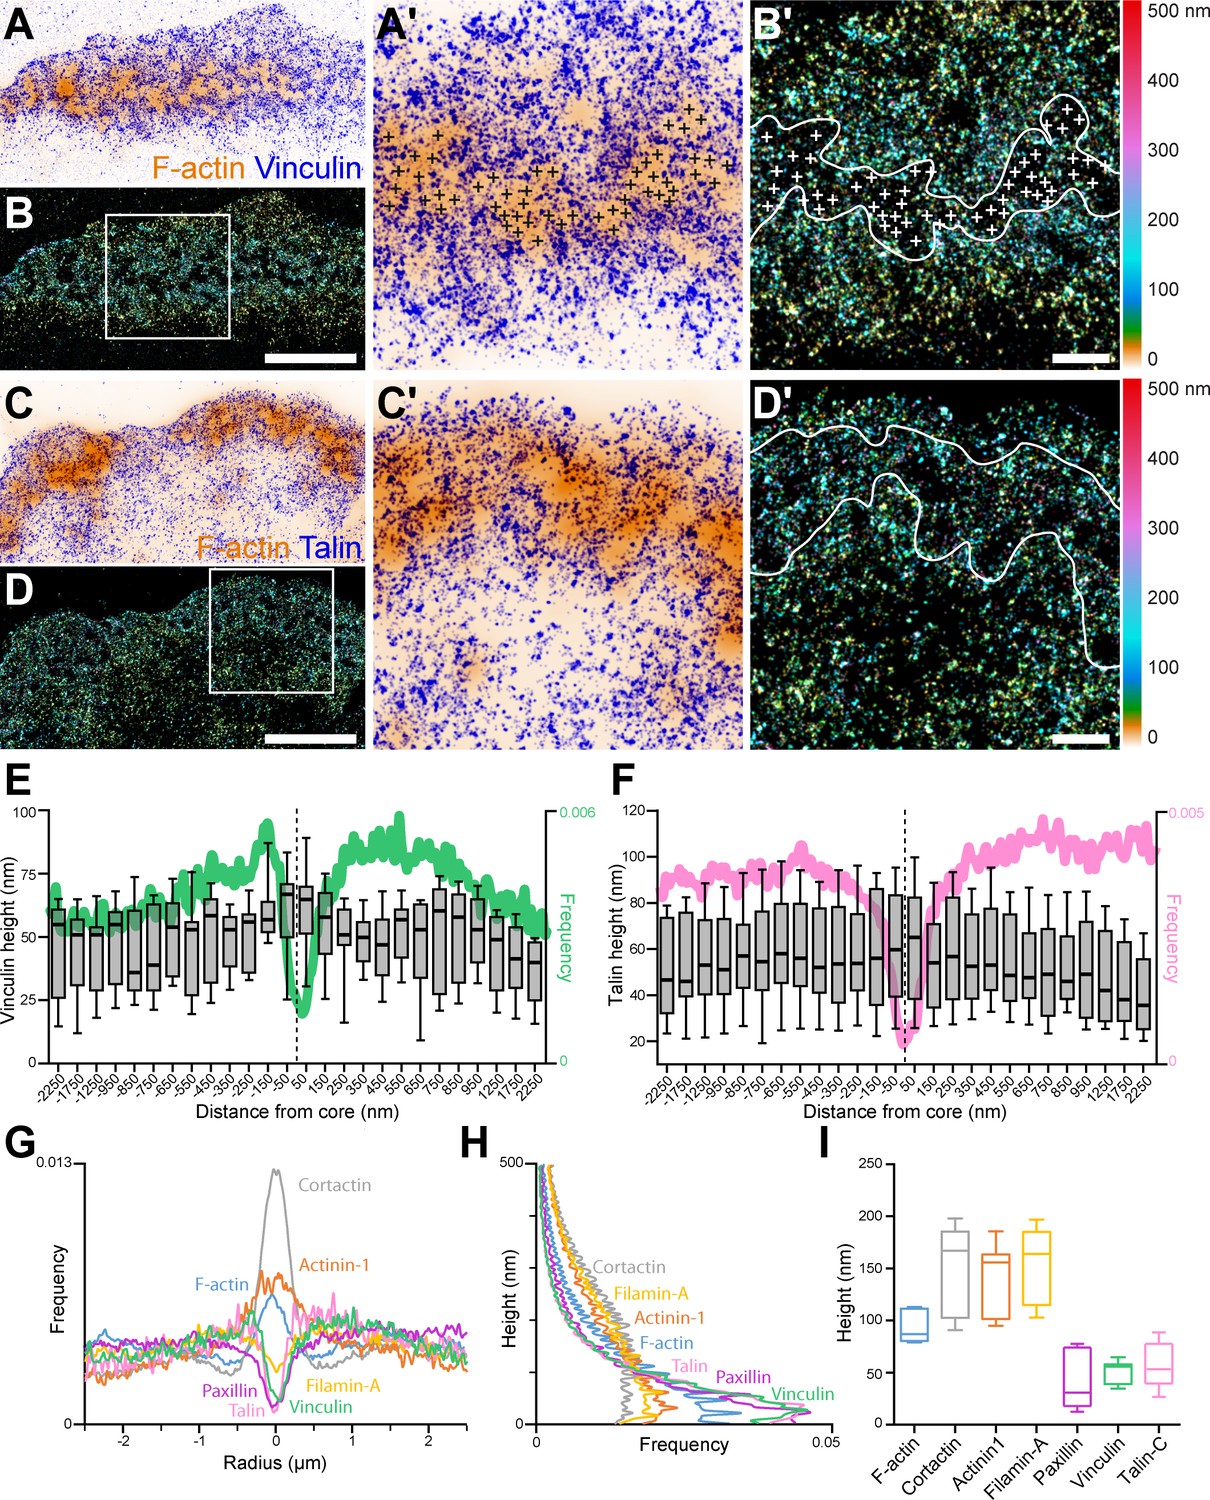
3D nanoscopy of vinculin and talin-C in the osteoclast podosome belt.
(A) Representative dSTORM images of vinculin (blue) merged with the corresponding epifluorescence images of the F-actin cores (ochre). (A’) Enlarged view of (A). The white crosses indicate the localization of actin cores. (B) DONALD images corresponding to (A) where the height is represented in false color (scale shown in B’). (B’) Enlarged view of (B). The white crosses indicate the localization of actin cores. (C) Representative dSTORM images of talin-C (blue) merged with the corresponding epifluorescence images of the F-actin cores (ochre). (C’) Enlarged view of (C). (D) DONALD images corresponding to (A) where the height is represented in false color (scale shown in (D’)). (D’) Enlarged view of (D). (E–F) Height profiles for vinculin (E) and talin-C (F) and radial distributions (in green and pink, respectively) with respect to the distance to the center of the podosome belt. Data from 465 cores and 1235 cores were quantified for vinculin and talin-C graphs, respectively. (G–H) Radial (G) and vertical (H) distributions of cortactin, α-actinin1, filamin A, paxillin, vinculin, and talin-C in podosome belts. (I) Median axial positions of F-actin, cortactin, α-actinin1, filamin A, paxillin, vinculin, and talin-C in podosome belts. Box-and-whisker plots show the median, lower and upper quartiles (box) and the 10th and 90th percentiles (whiskers). Scale bars: 5 µm (A–D), 1 µm (B’, D’).
-
Figure 1—source data 1
Figure 1 source data for all protein height profiles.
- https://cdn.elifesciences.org/articles/75610/elife-75610-fig1-data1-v3.xlsx
-
Figure 1—source data 2
Figure 1 - source data for all protein radial and vertical distributions.
- https://cdn.elifesciences.org/articles/75610/elife-75610-fig1-data2-v3.xlsx
Figure 1—figure supplement 1
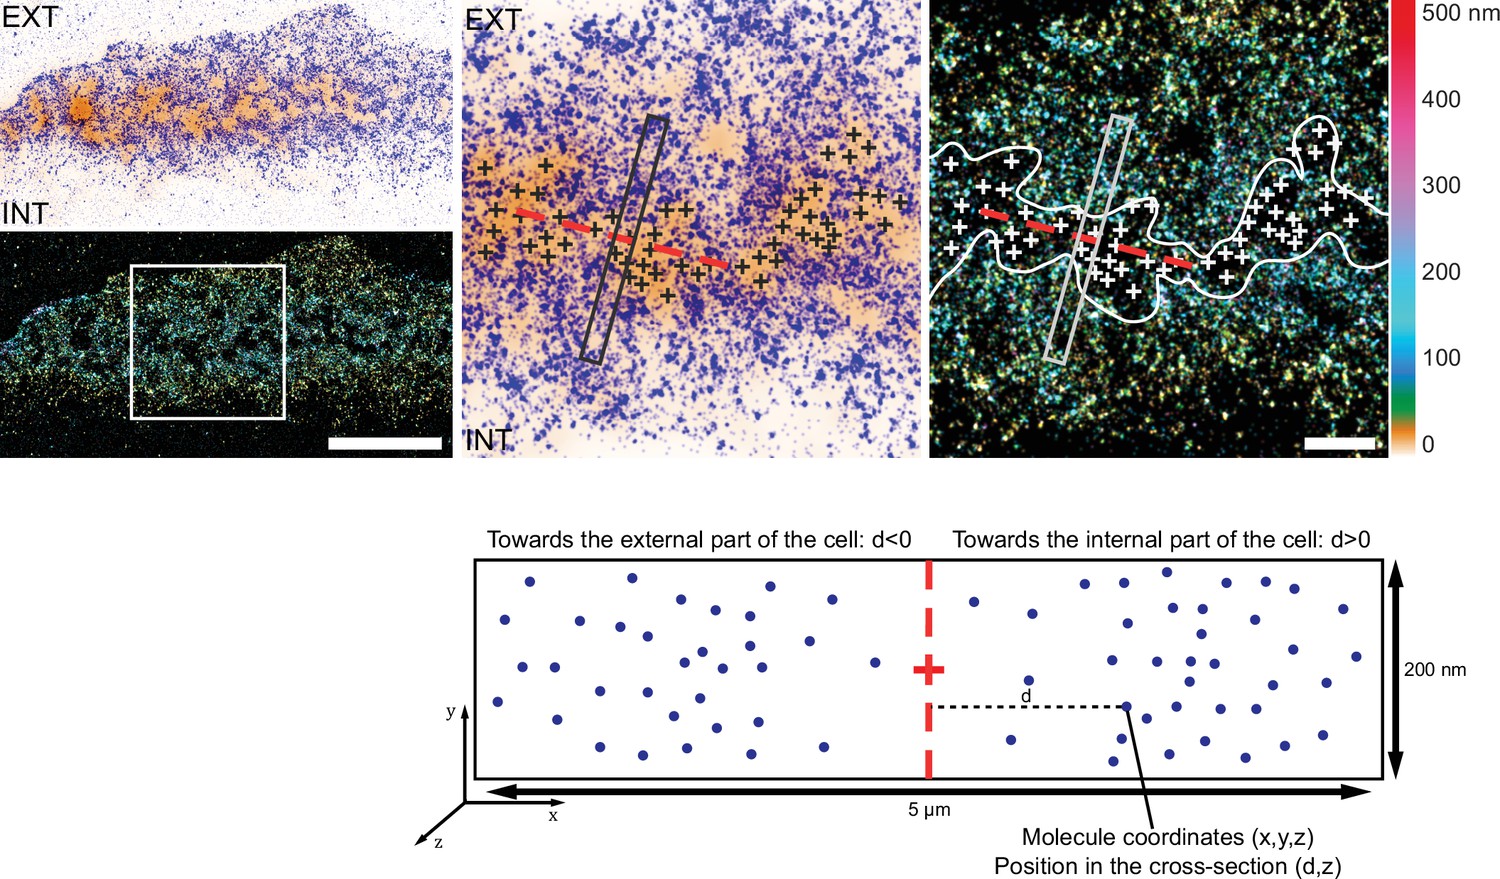
Analysis workflow for the 3D localization of proteins relative to actin cores with DONALD.
dSTORM image merged with the corresponding epifluorescence image of the F-actin cores (ochre). In DONALD images, the height is represented in false color. The white crosses indicate the localization of actin cores. When zooming in on a region of the belt, each of the actin cores (crosses) in the different clusters were located by the user. Then, the general orientation of the cluster was evaluated, and rectangular regions were delimited and centered on each actin core composing the podosome belt, transverse to the direction of the cluster (dashed red line). Within these cross-sections, molecules were automatically localized depending on their distance to the central axis of the cross-section and their height. Importantly, all molecules situated towards the cell edge were represented on the left, while those towards the interior of the cell are on the right in the associated charts. EXT: exterior of the cell. INT: interior of the cell. Scale bars: 5 µm (left panel), 1 µm (right panel).
Figure 1—figure supplement 2
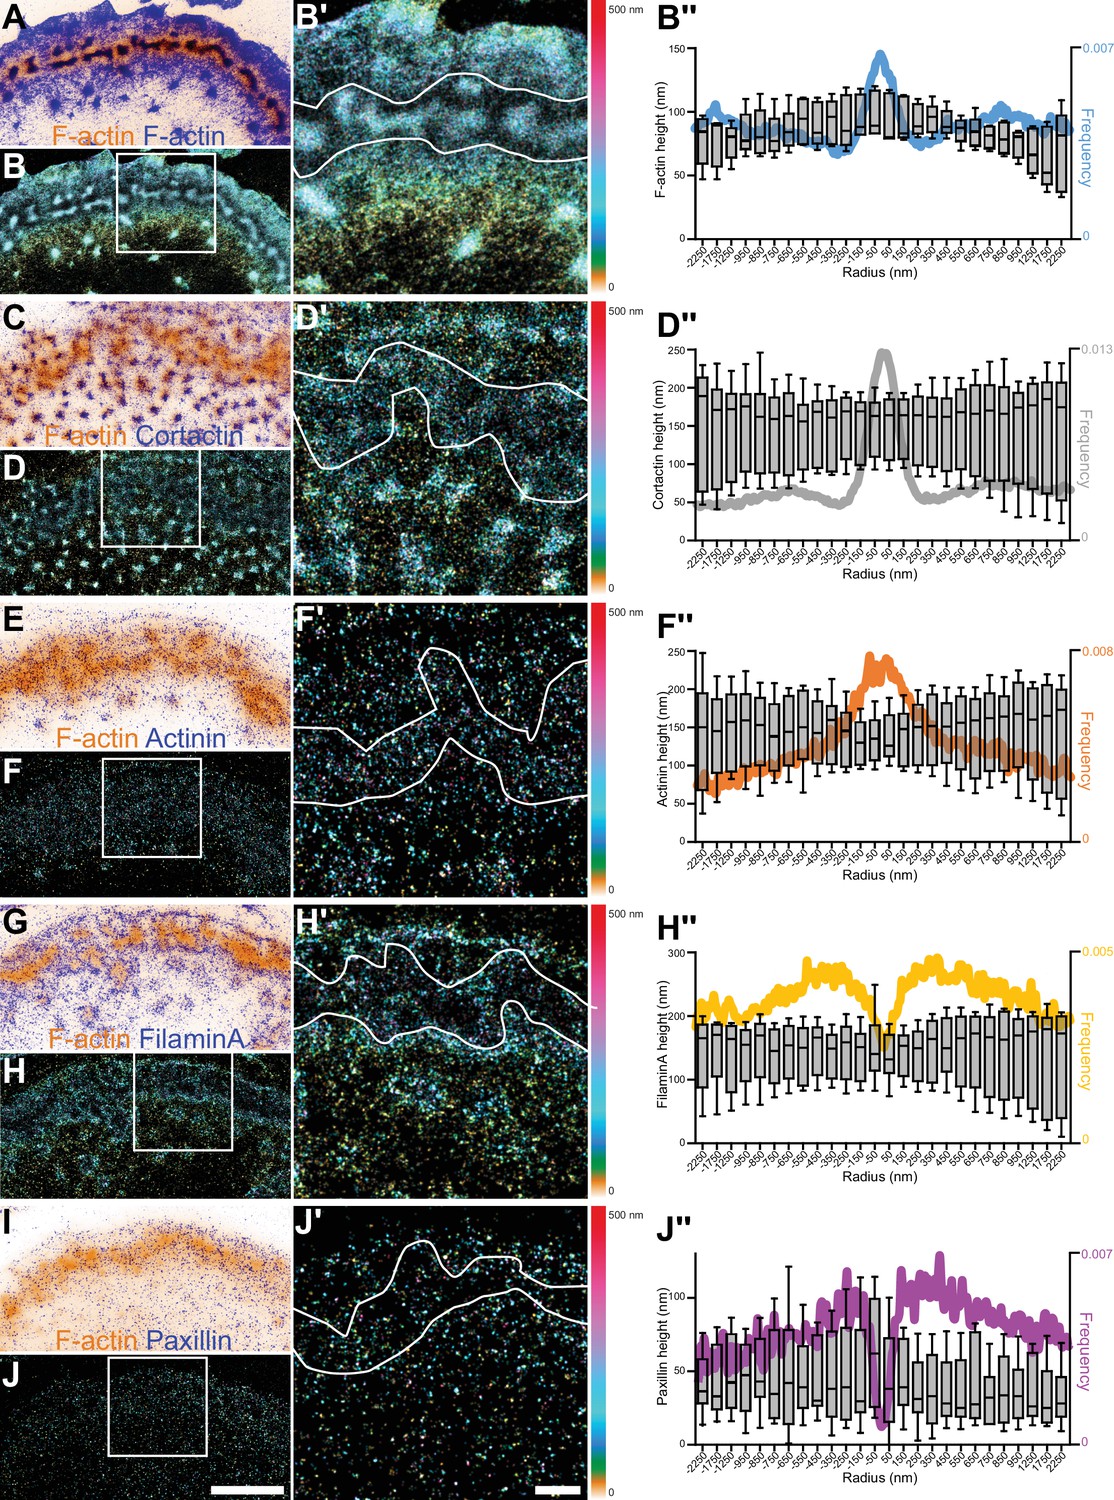
3D nanoscopy of F-actin, cortactin, α-actinin1, filamin A, and paxillin in the osteoclast podosome belt.
(A) Representative dSTORM images of F-actin (blue) merged with the corresponding epifluorescence images of the F-actin cores (ochre). (B) DONALD images corresponding to (A) where the height is represented in false color (scale shown in (B’)). (B’) Enlarged view of (B). (B’’) Height profiles and radial distributions (color) of F-actin with respect to the distance to the center of the sealing zone. Data from 168 cores were quantified. (C) Representative dSTORM images of cortactin (blue) merged with the corresponding epifluorescence images of the F-actin cores (ochre). (D) DONALD images corresponding to (C) where the height is represented in false color (scale shown in (D’)). (D’) Enlarged view of (D). (D’’) Height profiles and radial distributions (color) of cortactin with respect to the distance to the center of the sealing zone. Data from 1100 cores were quantified. (E) Representative dSTORM images of α-actinin1 (blue) merged with the corresponding epifluorescence images of the F-actin cores (ochre). (F) DONALD images corresponding to (E) where the height is represented in false color (scale shown in (F’)). (F’) Enlarged view of (F). (F’’) Height profiles and radial distributions (color) of α-actinin1 with respect to the distance to the center of the sealing zone. Data from 844 cores were quantified. (G) Representative dSTORM images of filamin A (blue) merged with the corresponding epifluorescence images of the F-actin cores (ochre). (H) DONALD images corresponding to (G) where the height is represented in false color (scale shown in (H’)). (H’) Enlarged view of (H). (H’’) Height profiles and radial distributions (color) of filamin A with respect to the distance to the center of the sealing zone. Data from 798 cores were quantified. (I) Representative dSTORM images of paxillin (blue) merged with the corresponding epifluorescence images of the F-actin cores (ochre). (J) DONALD images corresponding to (I) where the height is represented in false color (scale shown in (J’)). (J’) Enlarged view of (J). (J’’) Height profiles and radial distributions (color) of paxillin with respect to the distance to the center of the sealing zone. Data from 722 cores were quantified. Box-and-whisker plots show the median, lower and upper quartiles (box) and the 10th and 90th percentiles (whiskers). Scale bars: 5 µm (A–J), 1 µm (A’-J’).
Figure 2 with 3 supplements
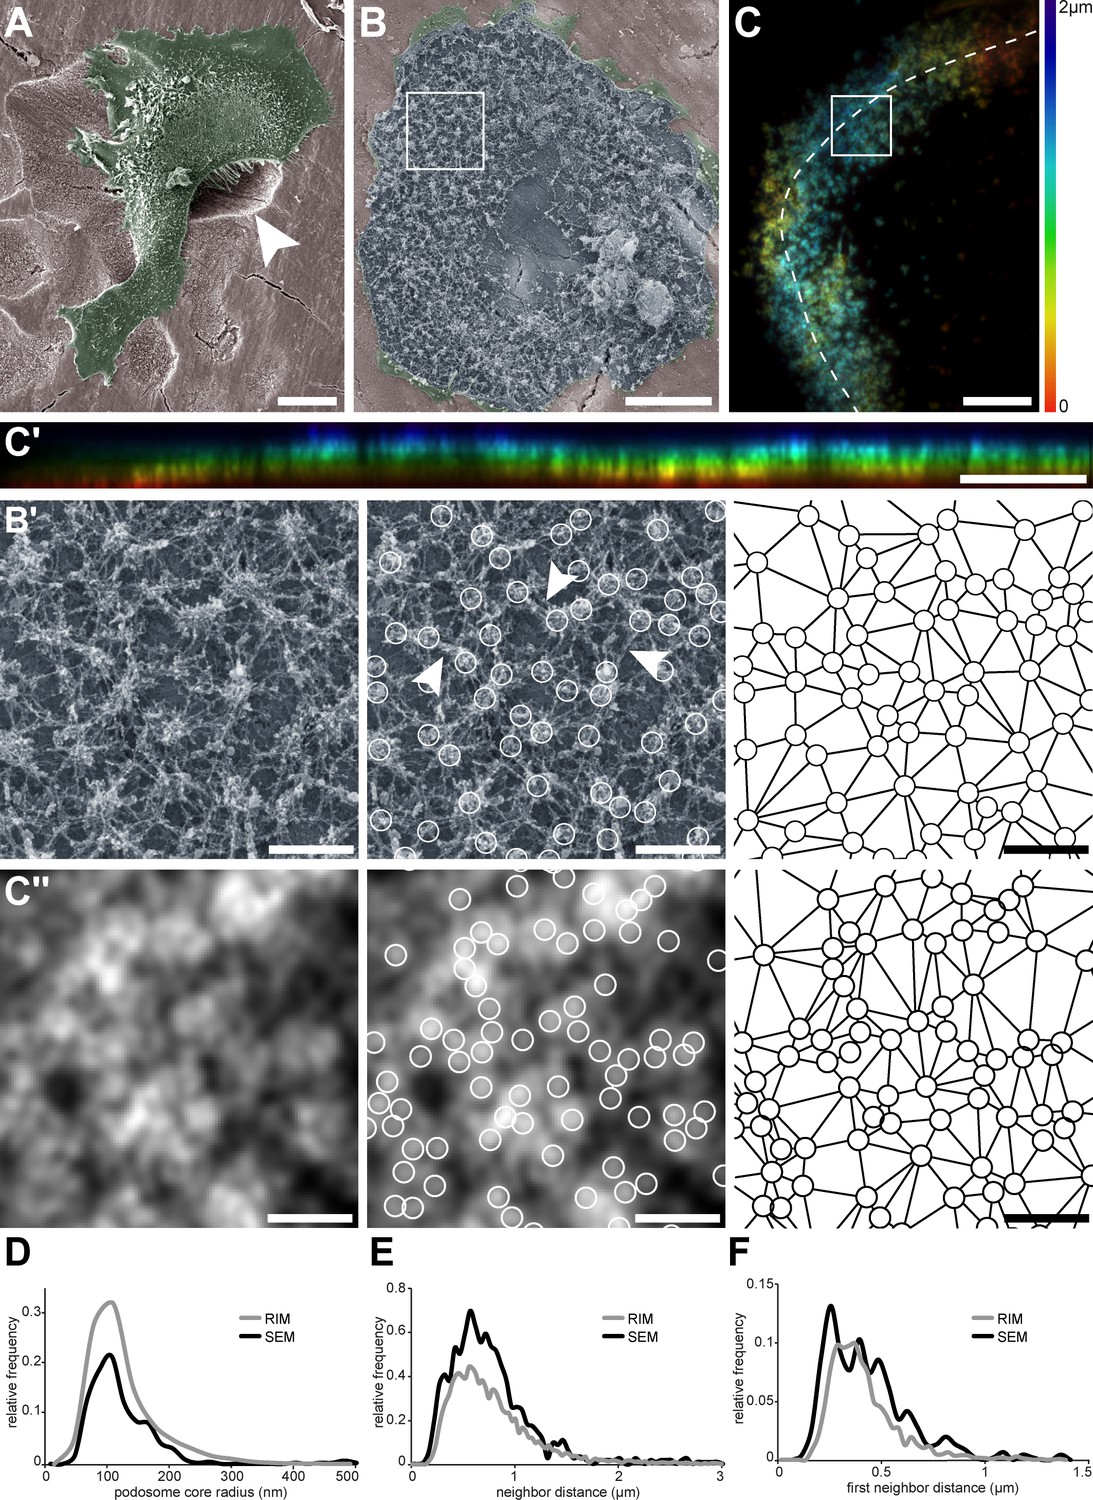
Nanoscale organization of actin cores in the sealing zones formed by human osteoclasts.
(A) Pseudo-colored scanning electron micrograph of a human monocyte-derived osteoclast degrading bone. Arrowhead shows bone degradation. (B) Scanning electron microscopy image of an unroofed osteoclast. Of note, the ruffled border could not be preserved by the unroofing procedure. (B’, left) Enlarged view of (B). (B’, middle) Localization of actin cores (circles). Arrowheads point to lateral actin filaments linking actin cores together. (B’, right) Delaunay triangulation from the cores. (C) Projection of a z-stack of an osteoclast stained for F-actin and adhering on bone, acquired every 200 nm and reconstructed by RIM. Color codes for height using a rainbow scale. (C’) Orthogonal projection along the line marked in (C). The same color code for height was used. (C’’, left) Enlarged view of (C). (C’’, middle) Localization of actin cores (circles). (C’’, right) Delaunay triangulation from the cores in (C’’). (D) Histogram of the core radii, as measured by SEM (black) and RIM (grey). (E) Histogram of the average distances to direct neighbors measured as Delaunay edges, as measured by SEM (black) and RIM (grey). (F) Histogram of the average distances to first neighbors, as measured by SEM (black) and RIM (grey). In (D–F), 457 and 2781 cores were quantified for SEM and RIM, respectively. Scale bars: 20 µm (A), 5 µm (B, C, C'), 1 µm (B', C'').
-
Figure 2—source data 1
Figure 2 - source data for SEM and RIM morphometric histograms.
- https://cdn.elifesciences.org/articles/75610/elife-75610-fig2-data1-v3.xlsx
Figure 2—figure supplement 1
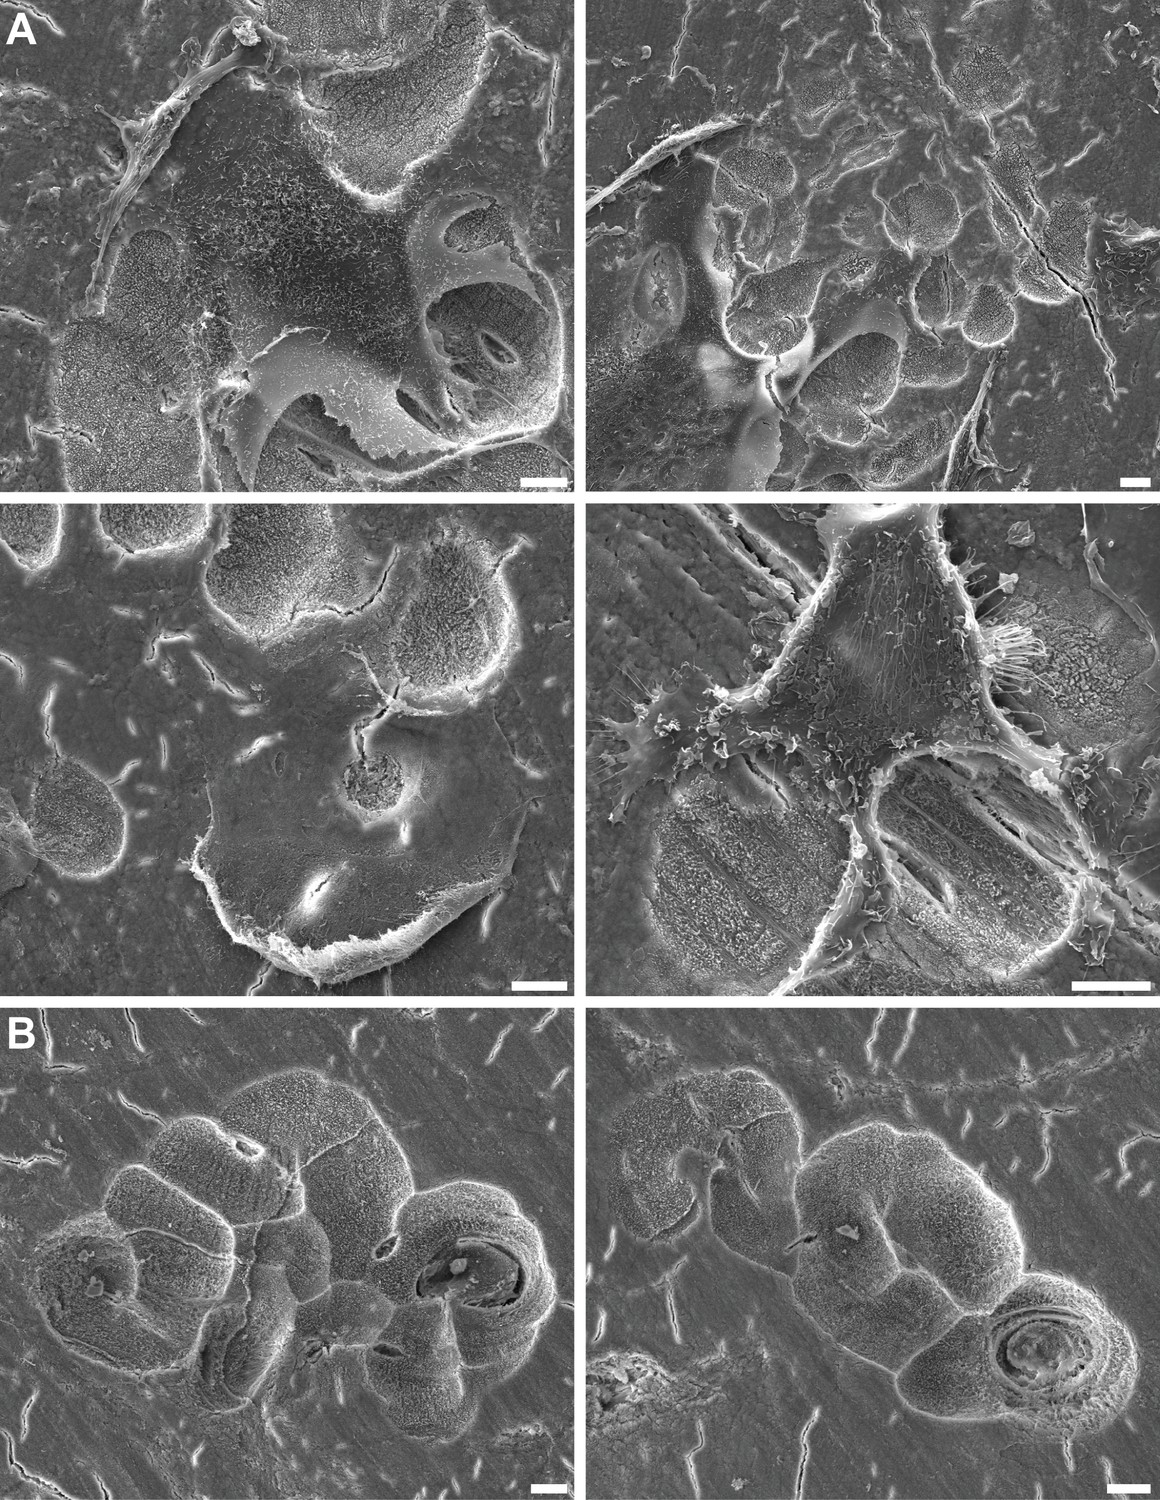
Bone degradation by human osteoclasts.
(A) Scanning electron microscopy images of human monocyte-derived osteoclasts degrading bone. (B) Scanning electron microscopy images of bone resorption pits created by osteoclasts. Scale bars: 10 µm.
Figure 2—figure supplement 2
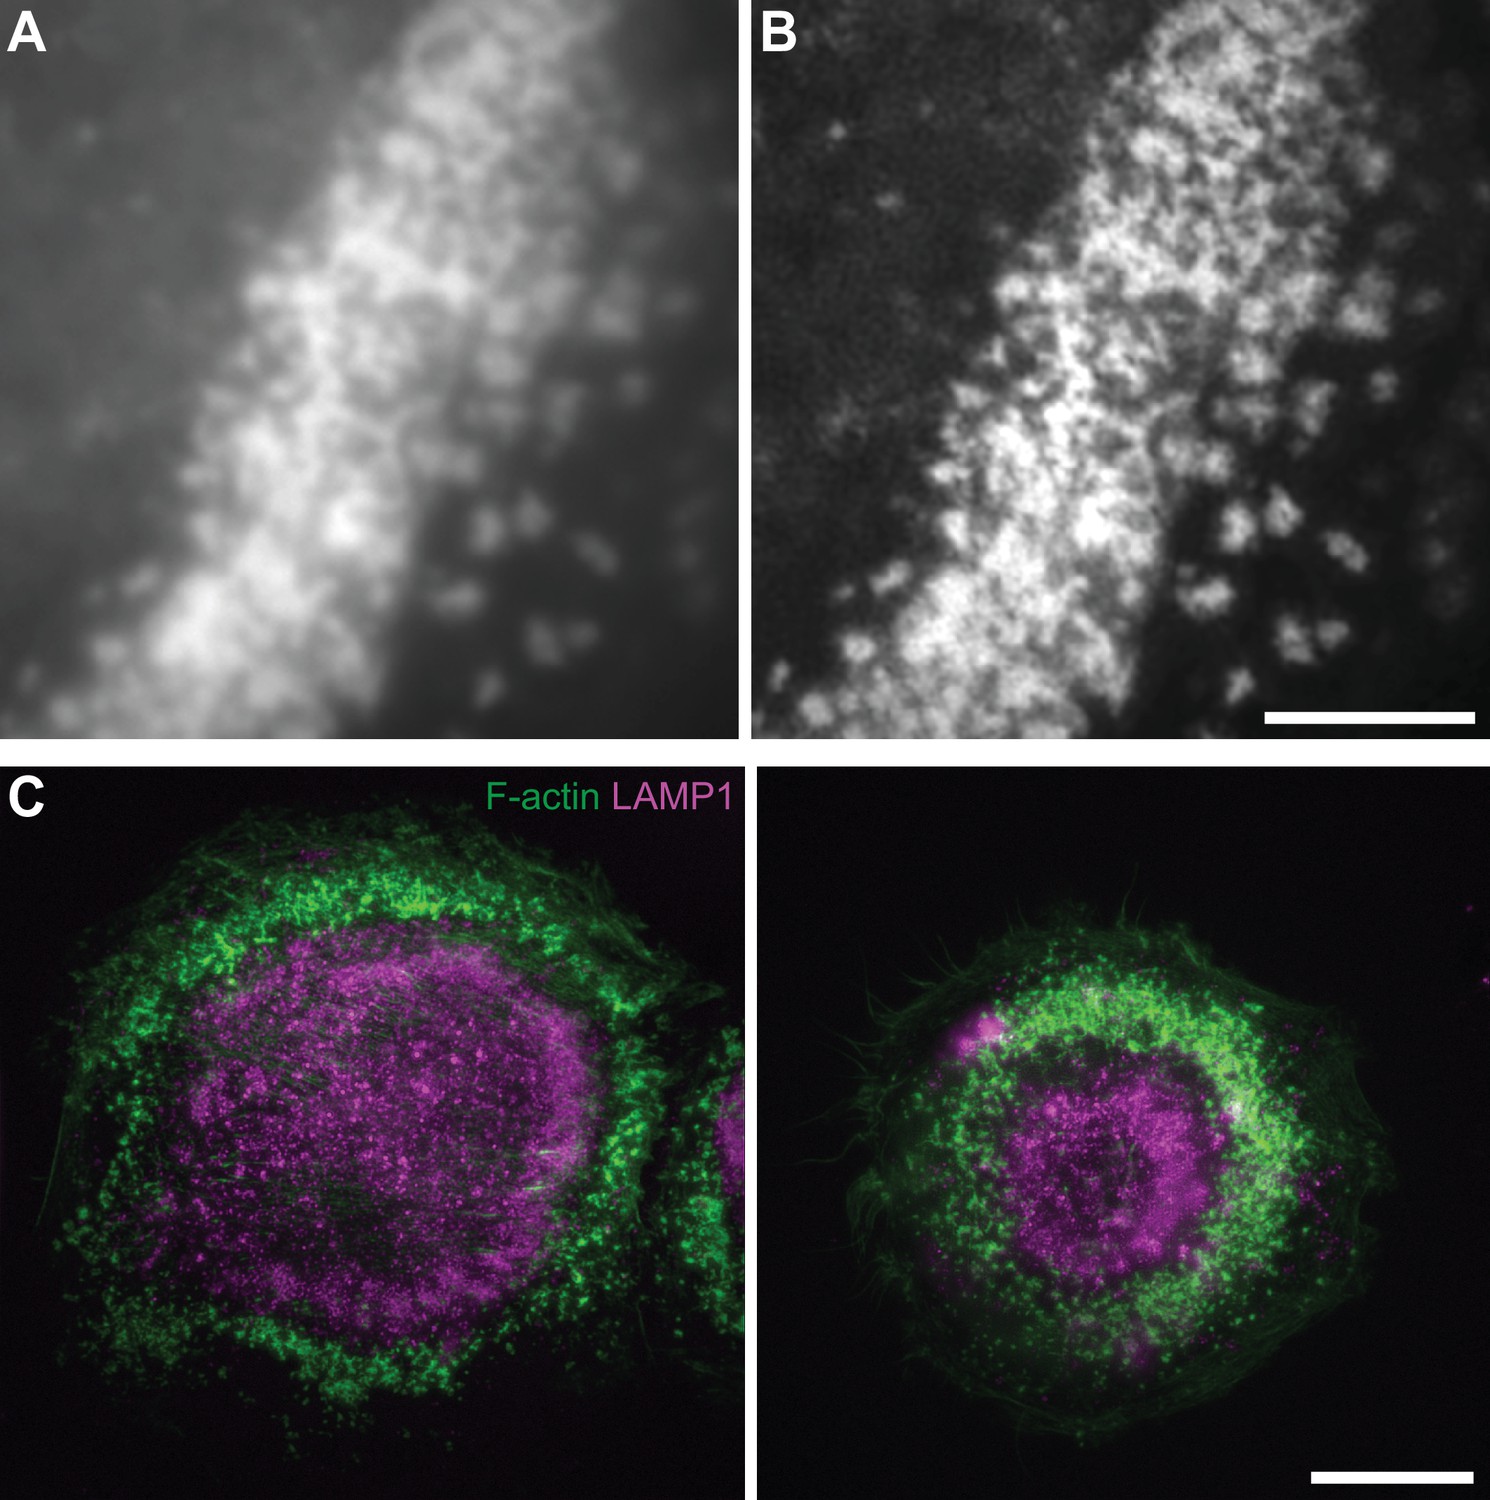
Comparison between epi-fluorescence and RIM super-resolution microscopy and localization of LAMP1.
Figure 2—figure supplement 3
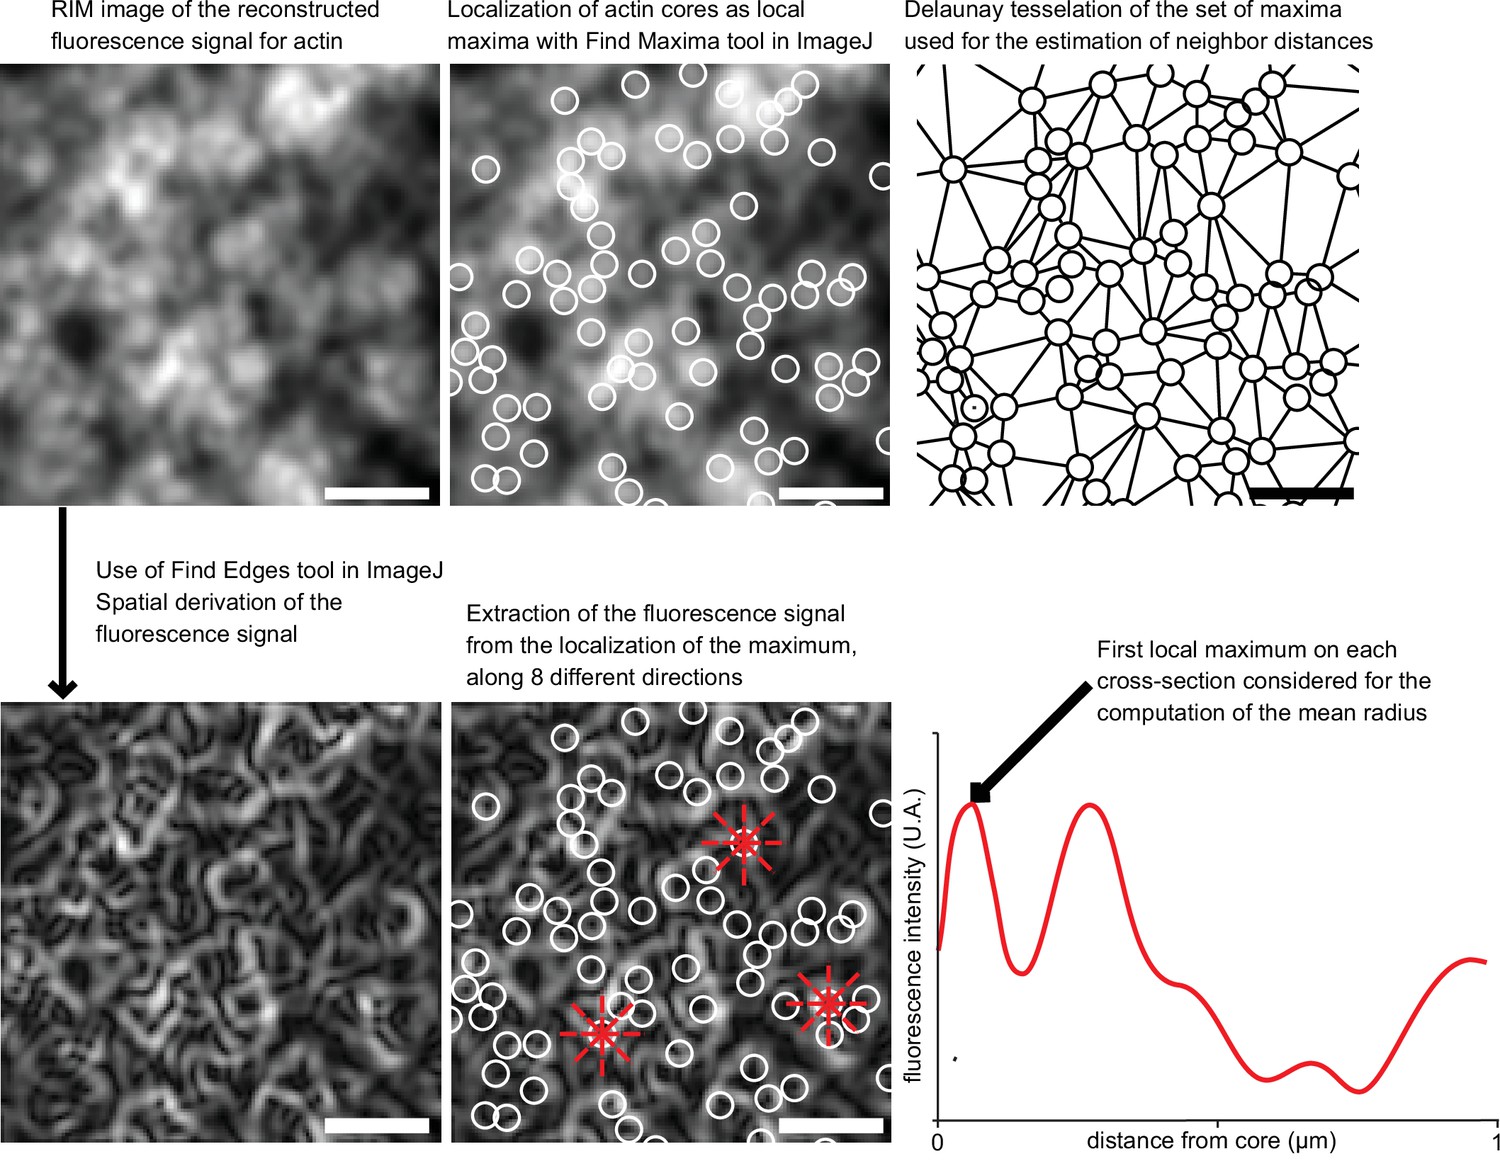
Analysis workflow for the geometric characterization of actin cores with RIM technique.
Analysis workflow for RIM images of the sealing zone stained for F-actin. When zooming in on a region of a sealing zone, it is observed that actin signal displays numerous local maxima that were localized. The corresponding coordinates were used to estimate the distance between two neighboring maxima, based on Delaunay’s tessellation. Then, in order to assess the size of the actin dots, a spatial derivation of the signal was applied and the derived signal was extracted along 8 radii from the center of each dot. On these curves, the first local maximum corresponded to the edge of the actin spot and helped to compute the mean radius for all of them. Scale bars: 1 µm.
Figure 3
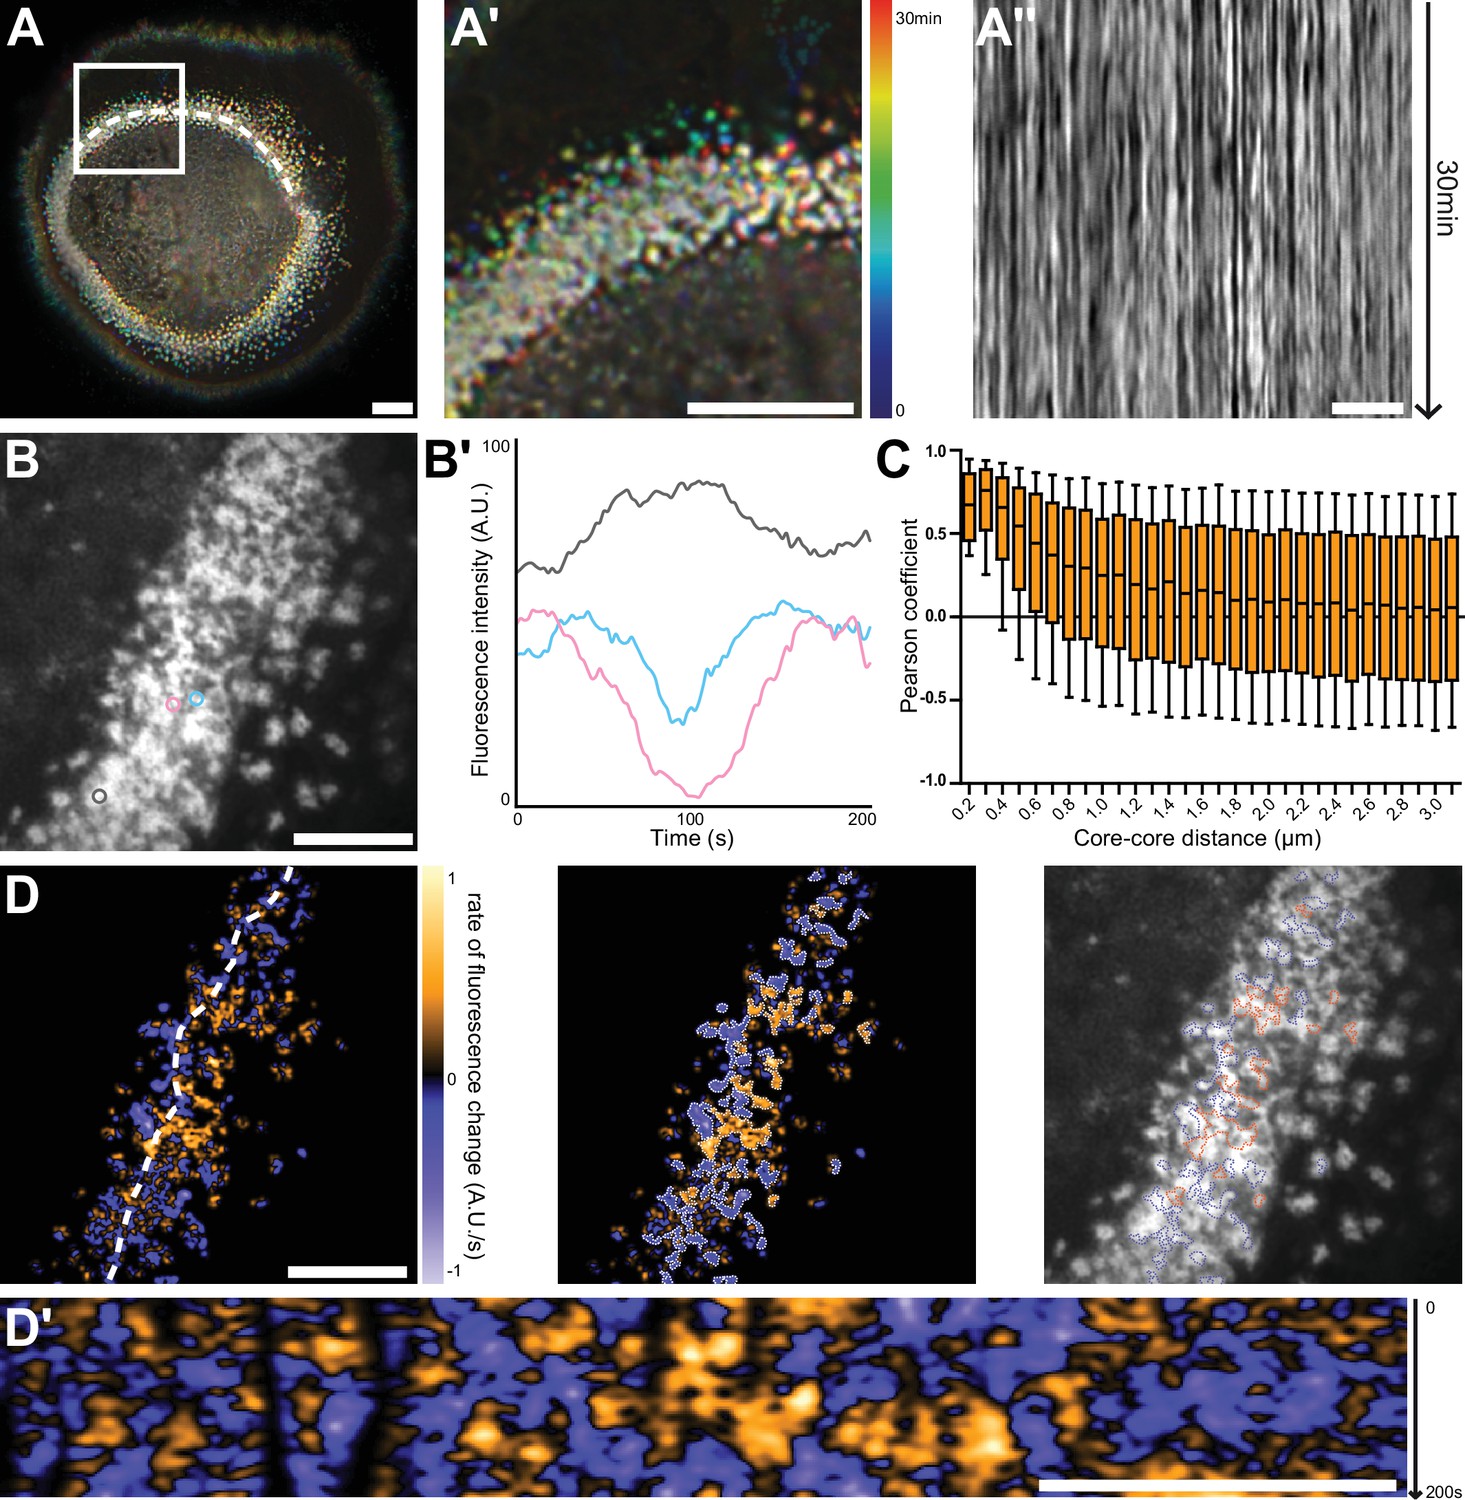
Nanoscale analysis of the dynamics of the sealing zone.
(A) Temporal projection of deconvolution images of a sealing zone acquired over 30 min, color-coded for time using a rainbow scale. Thus, the structures that remain at the same spot tend to appear whiter, whereas short-lived or mobile podosomes remain colored. (A’) Enlarged view of (A). (A’’) Kymograph along the line marked in (A). (B) RIM image of a sealing zone stained for F-actin with LifeAct-GFP. (B’) Measurements of LifeAct-GFP intensity variations of the 3 actin cores marked in (B). (C) Pearson coefficients of actin intensity fluctuations of podosome pairs as a function of distance between pairs. Data for a total of 2839 cores were quantified. (D, left) Image of the rate of fluorescence change corresponding to the cell shown in (B). (D, middle) Segmentation of the growing and decreasing clusters of actin cores. (D, right) Superimposition of the RIM image with the segmented regions of coordinated actin clusters shown in (D’’). (D’) Kymograph along the line marked in (D). Box-and-whisker plots show the median, lower and upper quartiles (box) and the 10th and 90th percentiles (whiskers). Scale bars: 10 µm (A), 5 µm (A’-D’).
-
Figure 3—source data 1
Figure 3 - source data for LifeAct intensity variations of 3 cores.
- https://cdn.elifesciences.org/articles/75610/elife-75610-fig3-data1-v3.xlsx
-
Figure 3—source data 2
Figure 3 - source data for LifeAct intensity variations of 3 cores.
- https://cdn.elifesciences.org/articles/75610/elife-75610-fig3-data2-v3.xlsx
Figure 4 with 3 supplements
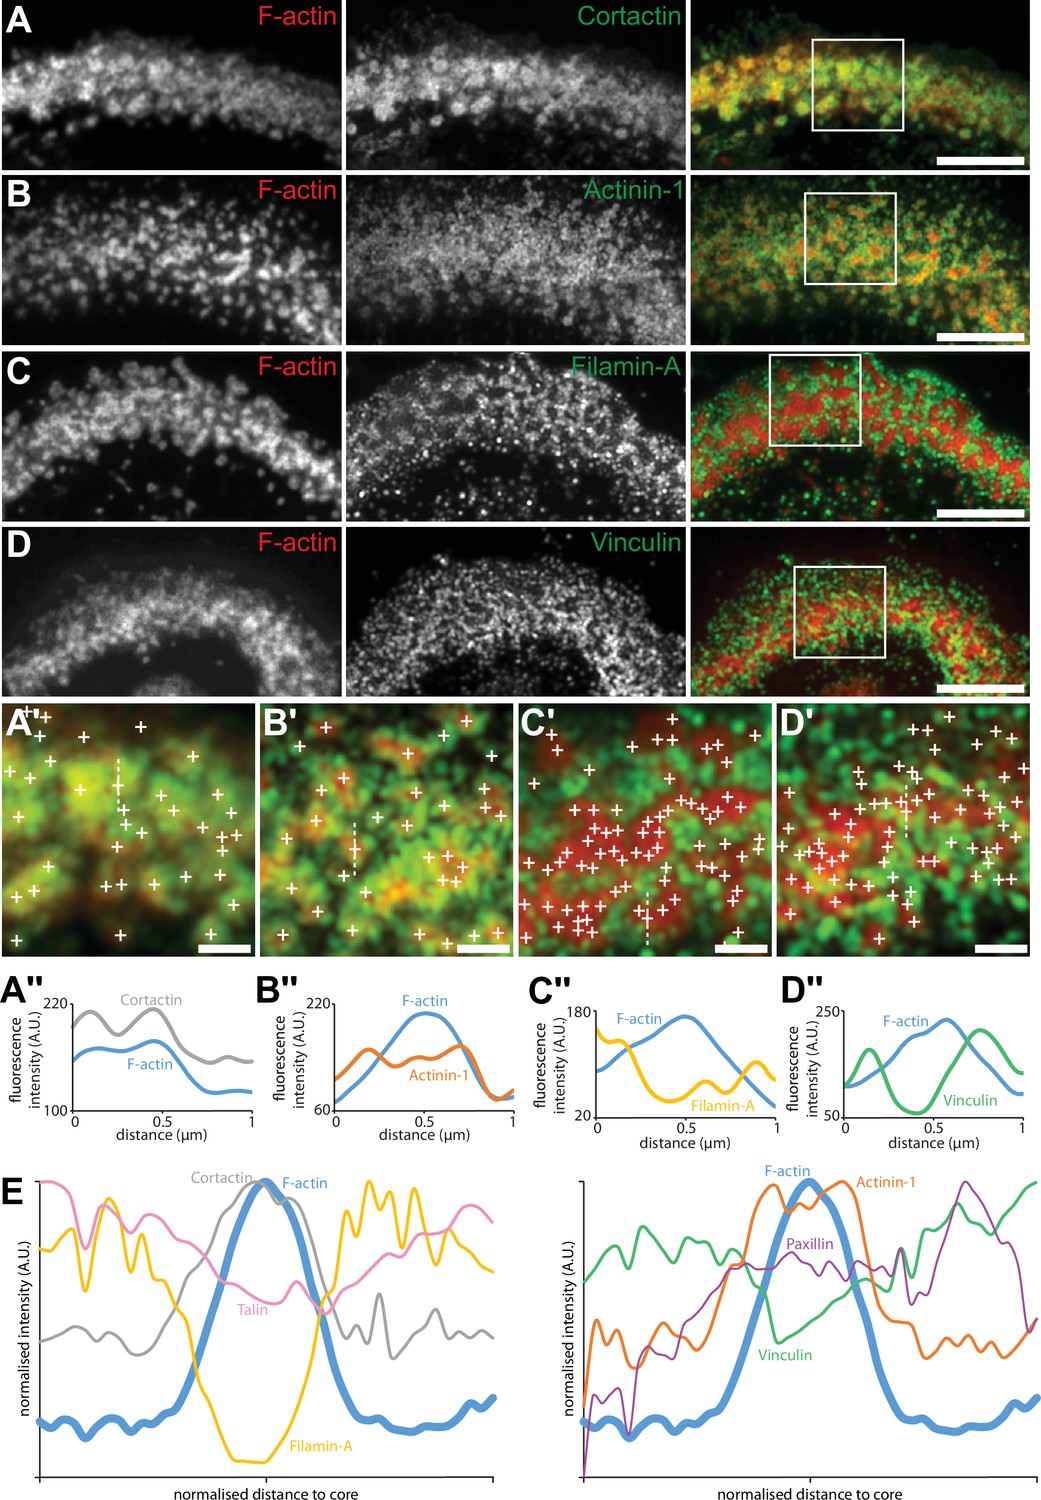
Localization in the sealing zone of actin core and ring proteins.
(A) Representative RIM images of sealing zones co-stained for F-actin (red) and cortactin (green). (A’) Enlarged view of (A) where white crosses indicate the localization of actin cores. (A’’) Intensity profiles along the dotted line marked in (A’). (B) Representative RIM images of sealing zones co-stained for F-actin (red) and α-actinin1 (green). (B’) Enlarged view of (B) where white crosses indicate the localization of actin cores. (B’’) Intensity profiles along the dotted line marked in (B’). (C) Representative RIM images of sealing zones co-stained for F-actin (red) and filamin A (green). (C’) Enlarged view of (C) where white crosses indicate the localization of actin cores. (C’’) Intensity profiles along the dotted line marked in (C’). (D) Representative RIM images of sealing zones co-stained for F-actin (red) and vinculin (green). (D’) Enlarged view of (D) where white crosses indicate the localization of actin cores. (D’’) Intensity profiles along the dotted line marked in (D’). (E) Normalized intensity profiles of F-actin, cortactin, α-actinin1, filamin A, vinculin, paxillin, and talin (medians of 1080, 239, 265, 277, 299, 197 and 988 cores for each staining, respectively). Scale bars: 5 µm (A, B, C, D), 1 µm (A’, B’, C’, D’).
-
Figure 4—source data 1
Figure 4 - source data for all protein intensity profiles.
- https://cdn.elifesciences.org/articles/75610/elife-75610-fig4-data1-v3.xlsx
Figure 4—figure supplement 1
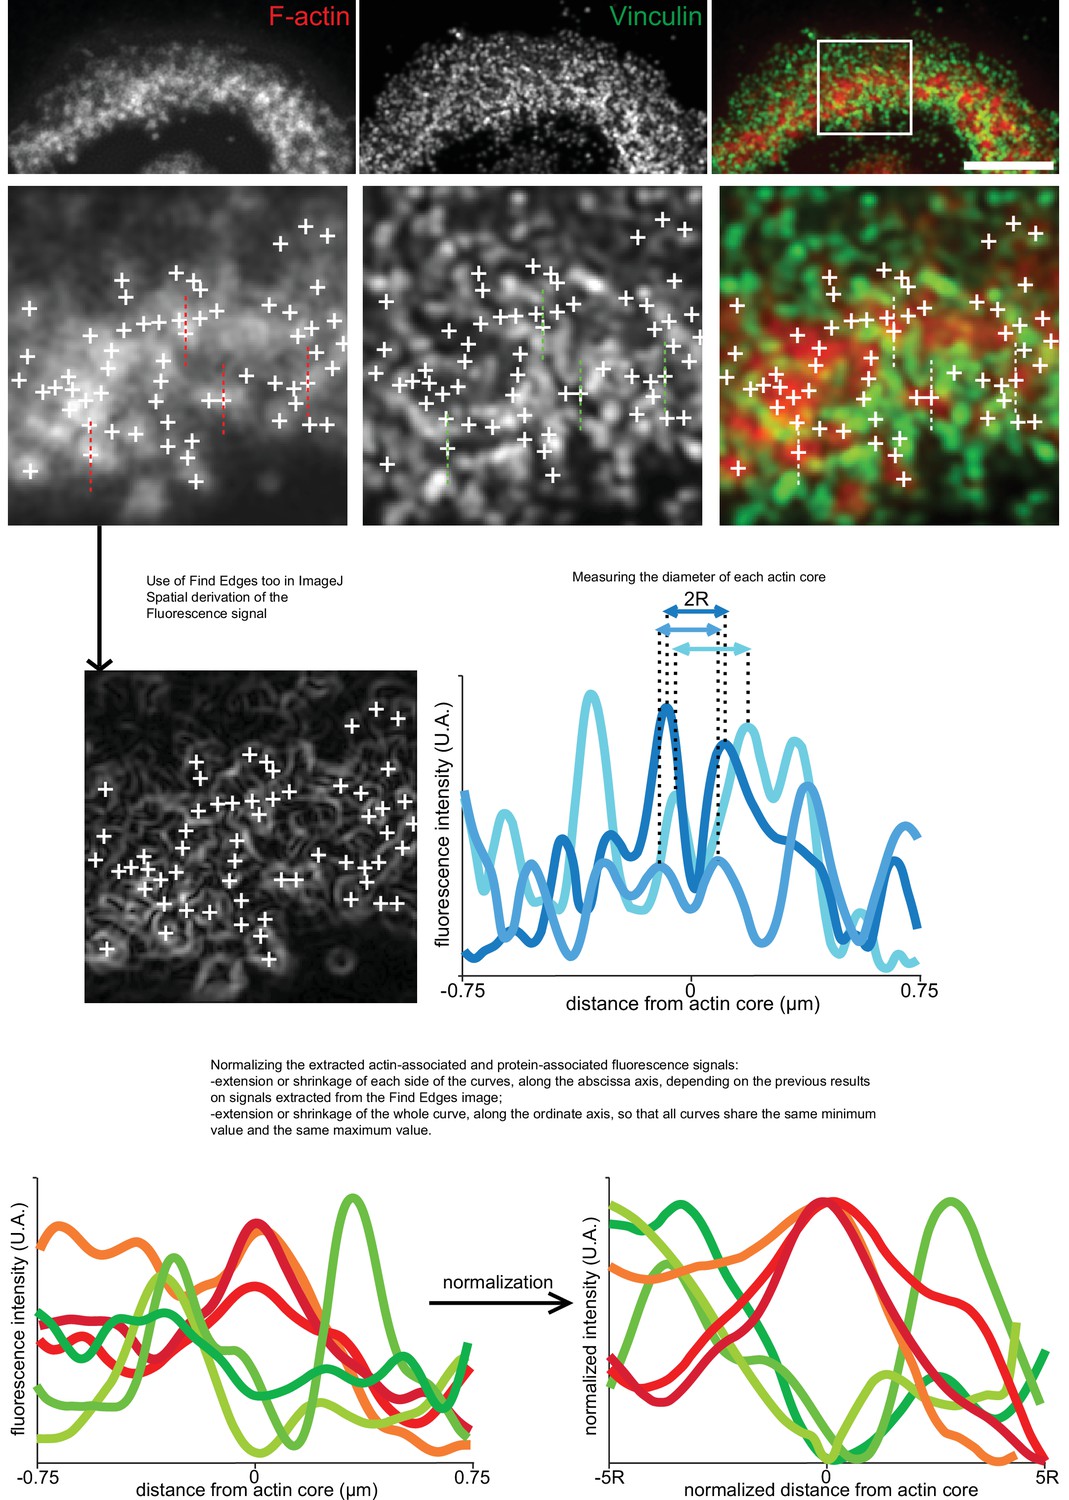
Analysis workflow for the 2D localization of proteins relative to actin cores with RIM technique.
Analysis workflow for RIM images of the sealing zone co-stained for F-actin (red) and vinculin (green). White crosses indicate the localization of actin cores. Intensity profiles along the marked dotted lines were analyzed. Similarly to the evaluation of the size of actin cores, the first step was to extract the coordinates of the cores thanks to the actin staining image. And in the same way, data was also extracted in order to assess the diameter of each core. Then, the local orientation of the sealing zone was evaluated by the user, in order to extract both actin and protein associated signals in the transverse direction. But these curves are not comparable as such, so thanks to the size-related data a normalization protocol was performed on the signals so that they were ready for statistical analysis. Scale bar: 5 µm.
Figure 4—figure supplement 2
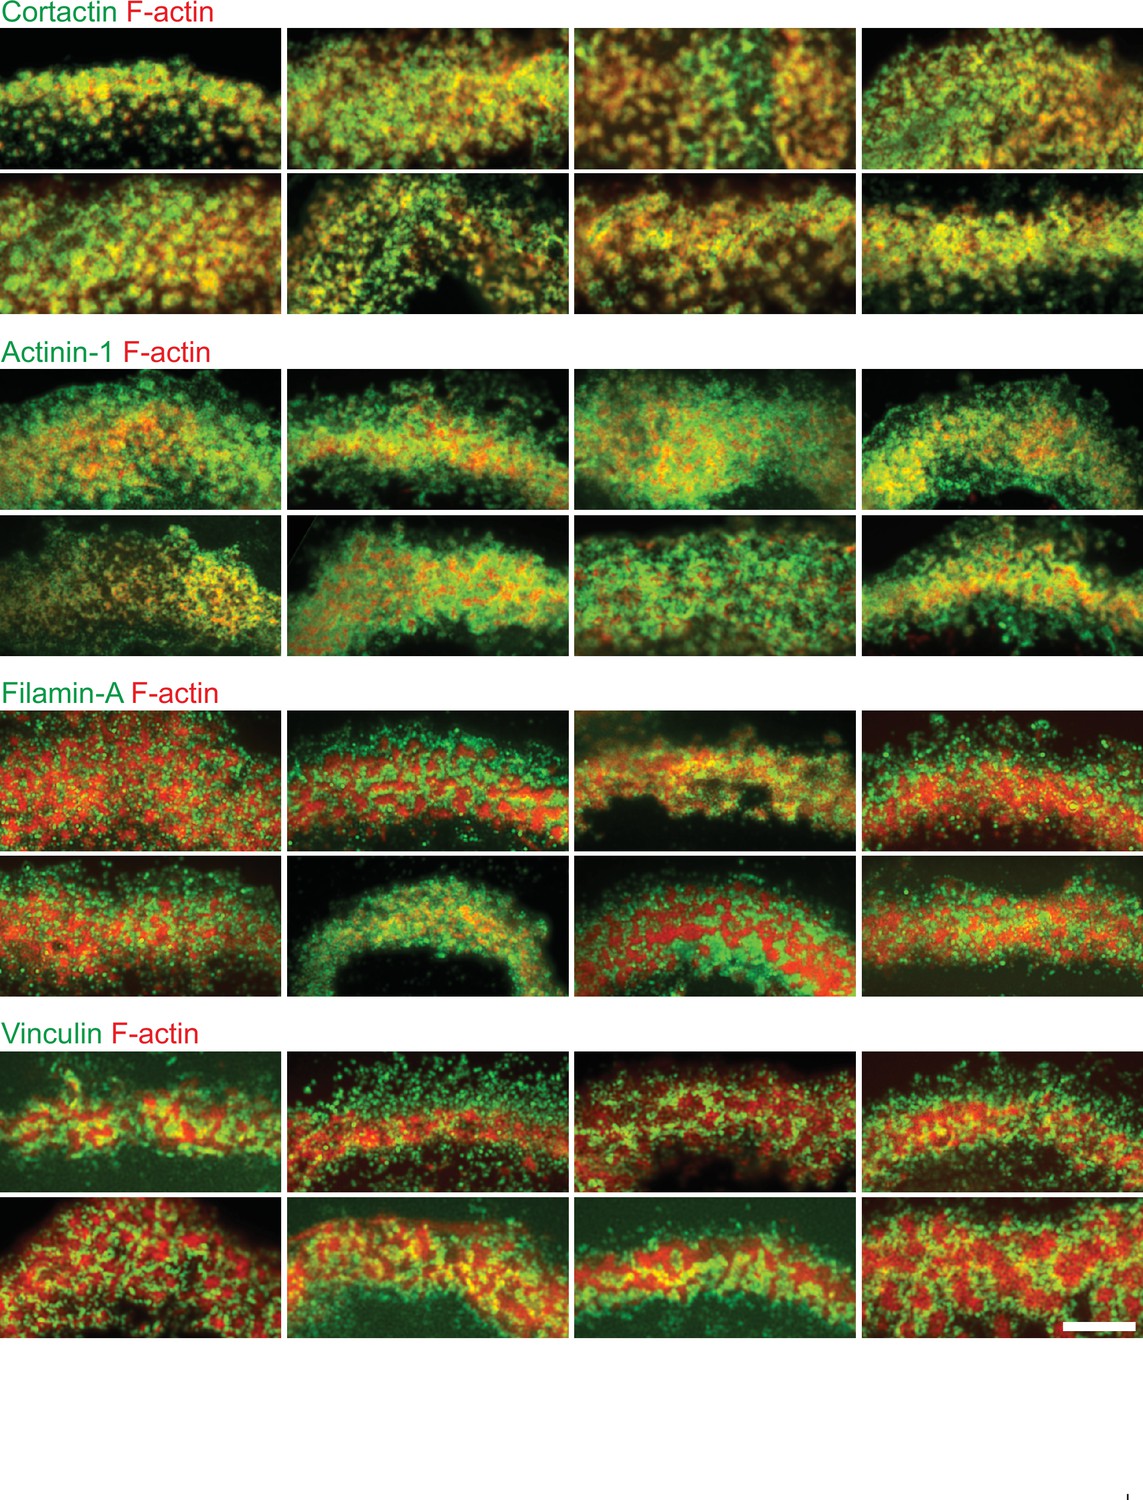
Localization in the sealing zone of cortactin, α-actinin 1, filamin A and vinculin.
Gallery of RIM images of sealing zones co-stained for F-actin (red) and cortactin, α-actinin 1, filamin A, or vinculin (green). Scale bar: 5 µm.
Figure 4—figure supplement 3
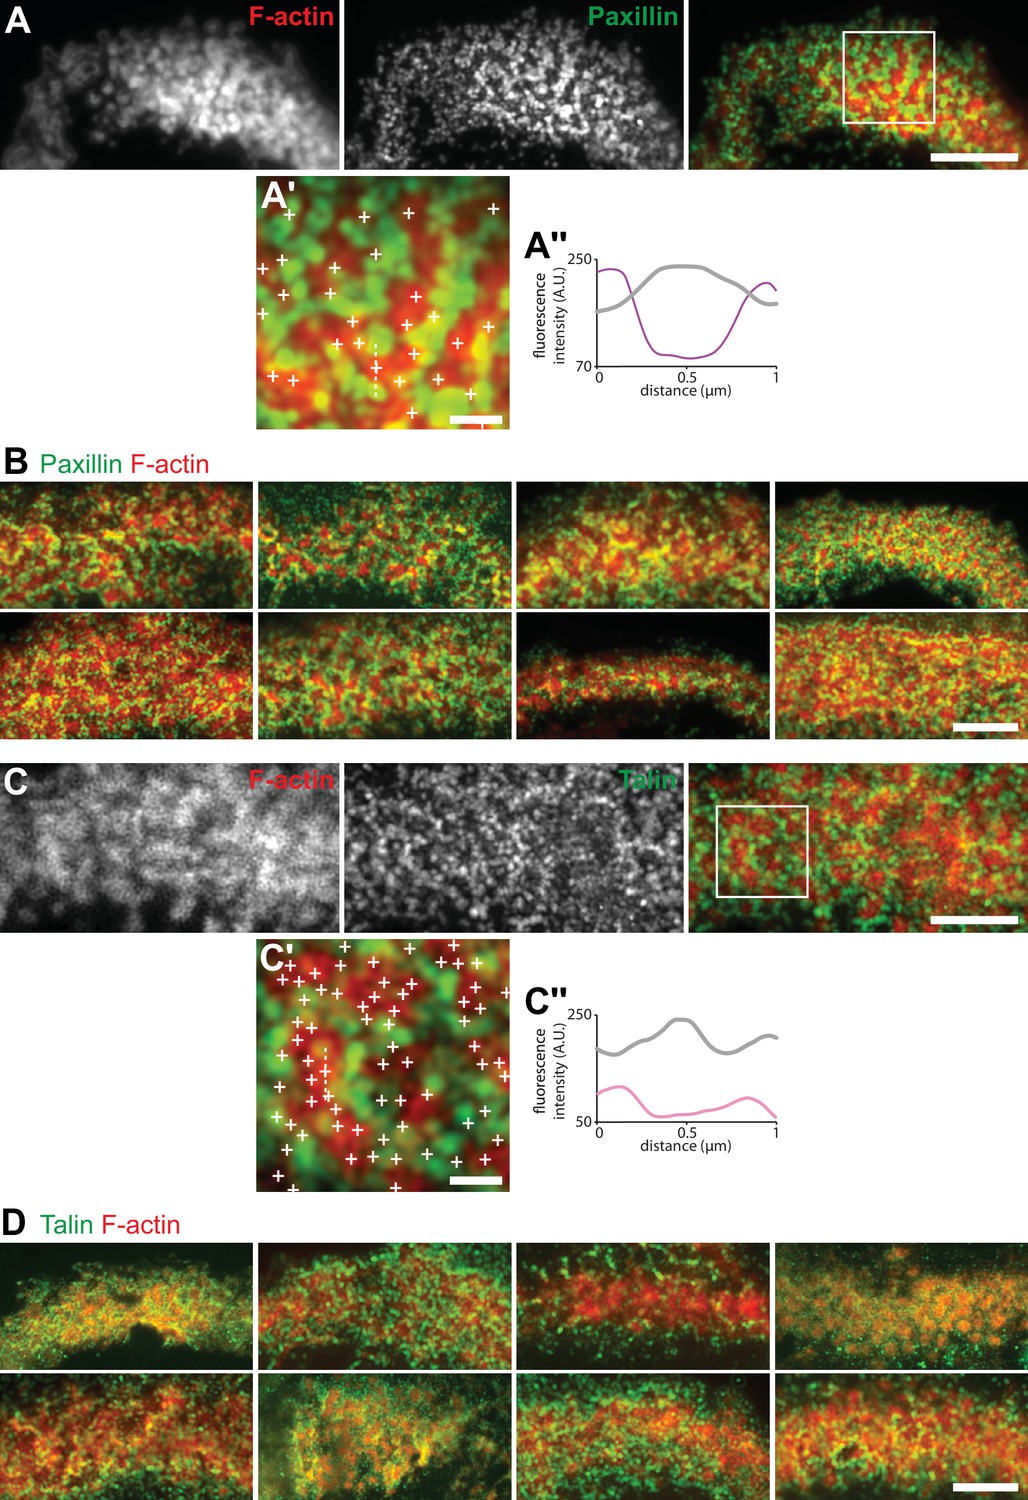
Localization in the sealing zone of paxillin and talin.
(A) Representative RIM image of sealing zones co-stained for F-actin (red) and paxillin (green). (A’) Enlarged view of (A). (A’’) Intensity profiles along the dotted line marked in (A’). (B) Gallery of RIM images of sealing zones co-stained for F-actin (red) and paxillin (green). (C) Representative RIM image of sealing zones co-stained for F-actin (red) and talin (green). (C’) Enlarged view of (C). (C’’) Intensity profiles along the dotted line marked in (C’). (D) Gallery of RIM images of sealing zones co-stained for F-actin (red) and talin (green). Scale bars: 5 µm (A, B, C, D), 1 µm (A’, C’).
Figure 5
Quantification of the dynamics of the sealing zone.
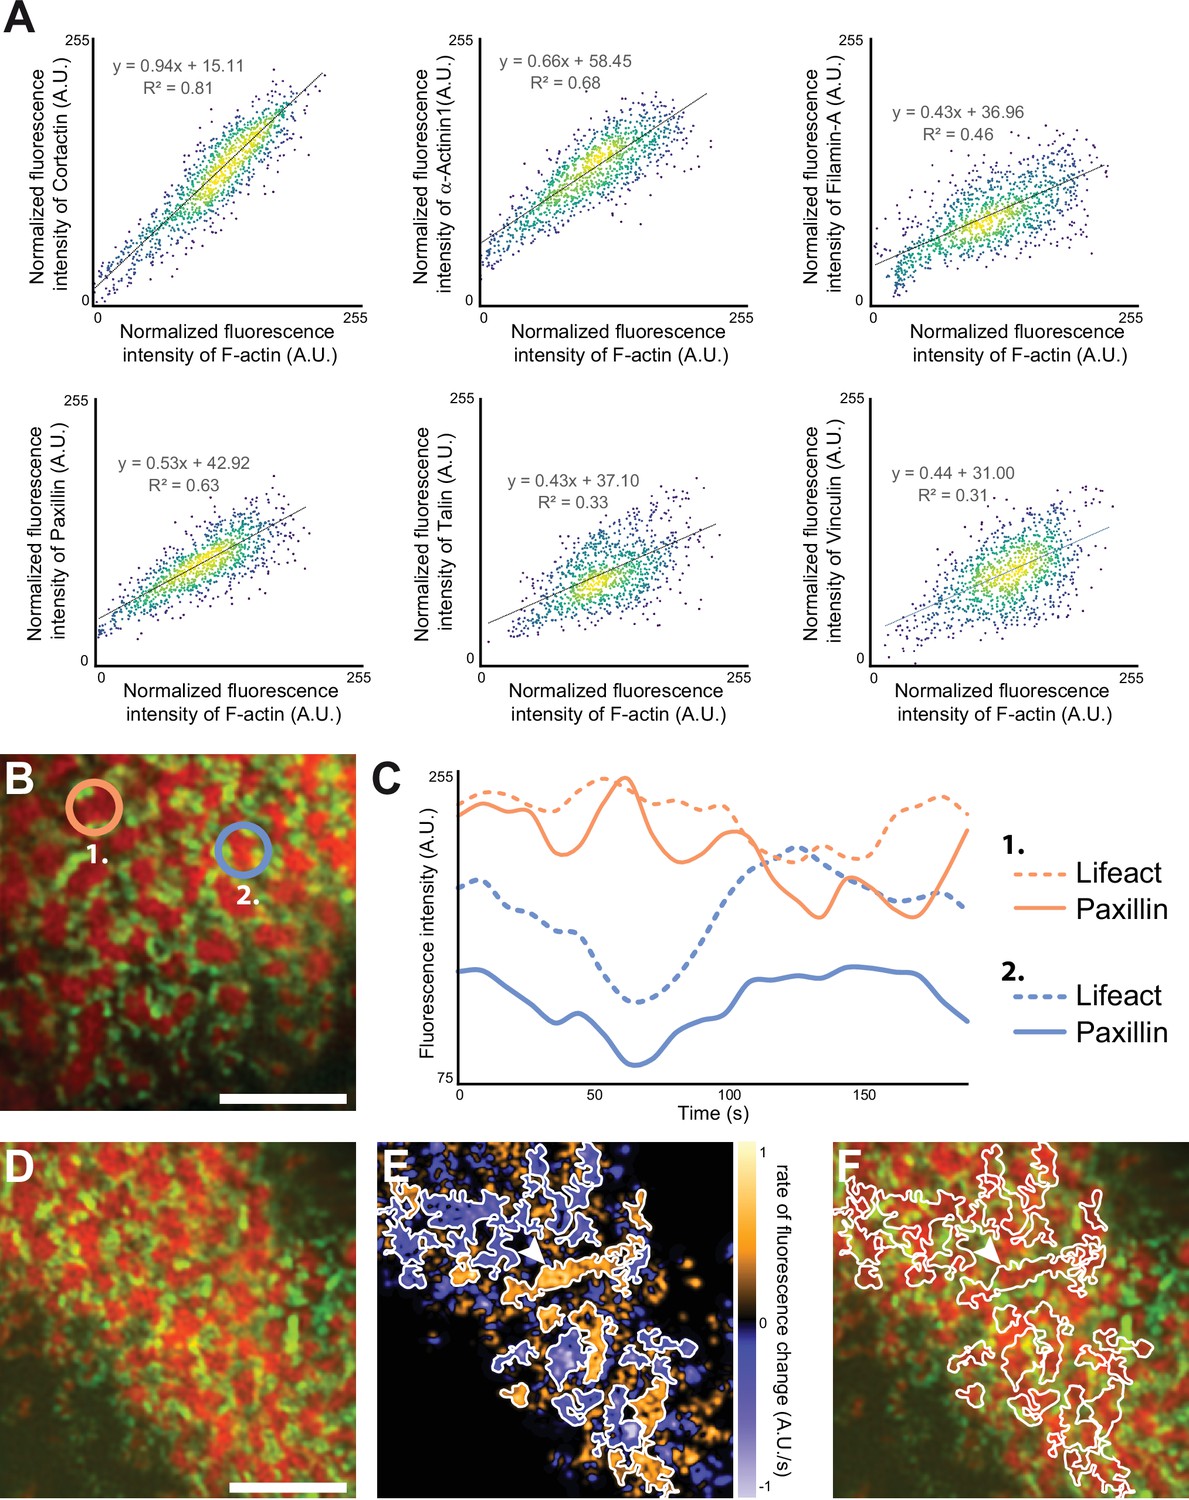
(A) Osteoclasts adhering to bone were stained for both F-actin and cortactin, α-actinin1, filamin A, vinculin, talin, or vinculin, respectively. The intensity of each fluorescent marker in 1 µm radius circles around F-actin cores were quantified for at least 1000 cores (in five cells from different donors), and correlated to the fluorescence intensity of F-actin. Data were normalized with respect to the maximum intensity. (B–C) Time-lapse RIM imaging of F-actin and paxillin in a living osteoclast expressing LifeAct-mCh and paxillin-GFP and adhering to bone. (C) The intensity variations of LifeAct-mCh and paxillin-GFP from two cores marked in (B) are shown. Note that the variations of the two podosome markers are correlated locally, but that the two cores, which are 5 µm apart, are not synchronized (C). (D) Time-lapse RIM imaging of F-actin and paxillin in a living osteoclast expressing LifeAct-mCh and paxillin-GFP and adhering to bone. A single RIM image of paxillin was acquired, followed by a stream acquisition of LifeAct-GFP, for a higher temporal resolution. (E) Image of the rate of fluorescence change corresponding to the cell shown in (D). (F) The superposition of the fluorescence image and the segmentation of clusters of synchronized areas in the sealing zone shows that there is a synchrony within zones corresponding to multiple cores encircled by paxillin. The arrowheads in (E–F) indicate a large cluster of actin cores. Note that all the different cores in this group are synchronized (in orange, E). Scale bars: 5 µm.
-
Figure 5—source data 1
Figure 5 - source data for intensity correlation analysis between actin and all adhesion proteins.
- https://cdn.elifesciences.org/articles/75610/elife-75610-fig5-data1-v3.xlsx
-
Figure 5—source data 2
Figure 5 - source data for LifeAct-mCh and paxillin-GFP intensity variations for 2 cores.
- https://cdn.elifesciences.org/articles/75610/elife-75610-fig5-data2-v3.xlsx
Figure 6

Model of the organization of the sealing zone into islets.
(A-A’) Osteoclast form an actin-rich superstructure called the sealing zone, in order to confine bone degradation. (A’’) Enlarged view of (A) to reveal the 3D organization into islets of coordinated actin cores, represented using different colors (upper panel). Actin cores that are localized within the same cluster tend to display synchronized actin fluctuations, which result from the respective rates of actin polymerisation at the plasma membrane and depolymerisation at the top of the structure, whereas there does not seem to be much correlation between clusters (lower panel). See legends for the different proteins.
Videos
Video 1
Z-stack by RIM of a human osteoclast adhering on bone and stained for F-actin.
The movie shows a z-stack of an osteoclast stained for F-actin and adhering on bone acquired by RIM microscopy at 200 nm intervals. Each plane of this z-stack has been colored with a different color. Color-coded for height using a rainbow scale.
Video 2
Deconvolution time-series of a sealing zone over 30 min.
Time-series movie of a human osteoclast expressing LifeAct-GFP and adhering on bone. The video was acquired by wide-field fluorescence microscopy at 2 s intervals during 30 min and deconvoluted.
Video 3
RIM time-series and rate of fluorescence change of the F-actin content of a sealing zone.
Reconstruction at 2.4 s intervals during 160 s of a time-series acquired by RIM microscopy. Left panel: RIM images of a sealing zone stained for F-actin with LifeAct-GFP. Right panel: images of the rate of fluorescence change. Orange stands for a positive gradient, that is local actin polymerization, and blue represents a negative gradient, that is local actin depolymerization.
Video 4
Dynamics of F-actin and paxillin in a sealing zone.
Time-series movie by RIM microscopy of an osteoclast on bone expressing LifeAct-mCh and paxillin-GFP, reconstructed at 9 s intervals during 160 s.
Video 5
RIM time-series and rate of fluorescence change of the F-actin content of a sealing zone, relative to the location of paxillin.
Left panel: time-series movie by RIM microscopy of an osteoclast on bone expressing LifeAct-mCh and paxillin-GFP. A single RIM image of paxillin-GFP at the starting point of the movie was reconstructed and superimposed on a time series of LifeAct-GFP reconstructed at 2.4 s intervals during 88 s. Right panel: images of the rate of fluorescence change of LifeAct-GFP.
Additional files
Download links
A two-part list of links to download the article, or parts of the article, in various formats.
Downloads (link to download the article as PDF)
Open citations (links to open the citations from this article in various online reference manager services)
Cite this article (links to download the citations from this article in formats compatible with various reference manager tools)
Nanoscale architecture and coordination of actin cores within the sealing zone of human osteoclasts
eLife 11:e75610.
https://doi.org/10.7554/eLife.75610


