An incentive circuit for memory dynamics in the mushroom body of Drosophila melanogaster
- Institute of Perception Action and Behaviour, School of Informatics, University of Edinburgh, United Kingdom
- Department of Cellular and Molecular Physiology, Yale University, United States
- Department of Genetics, Yale University, United States
- Department of Neuroscience, Yale University, United States
Figures
Figure 1
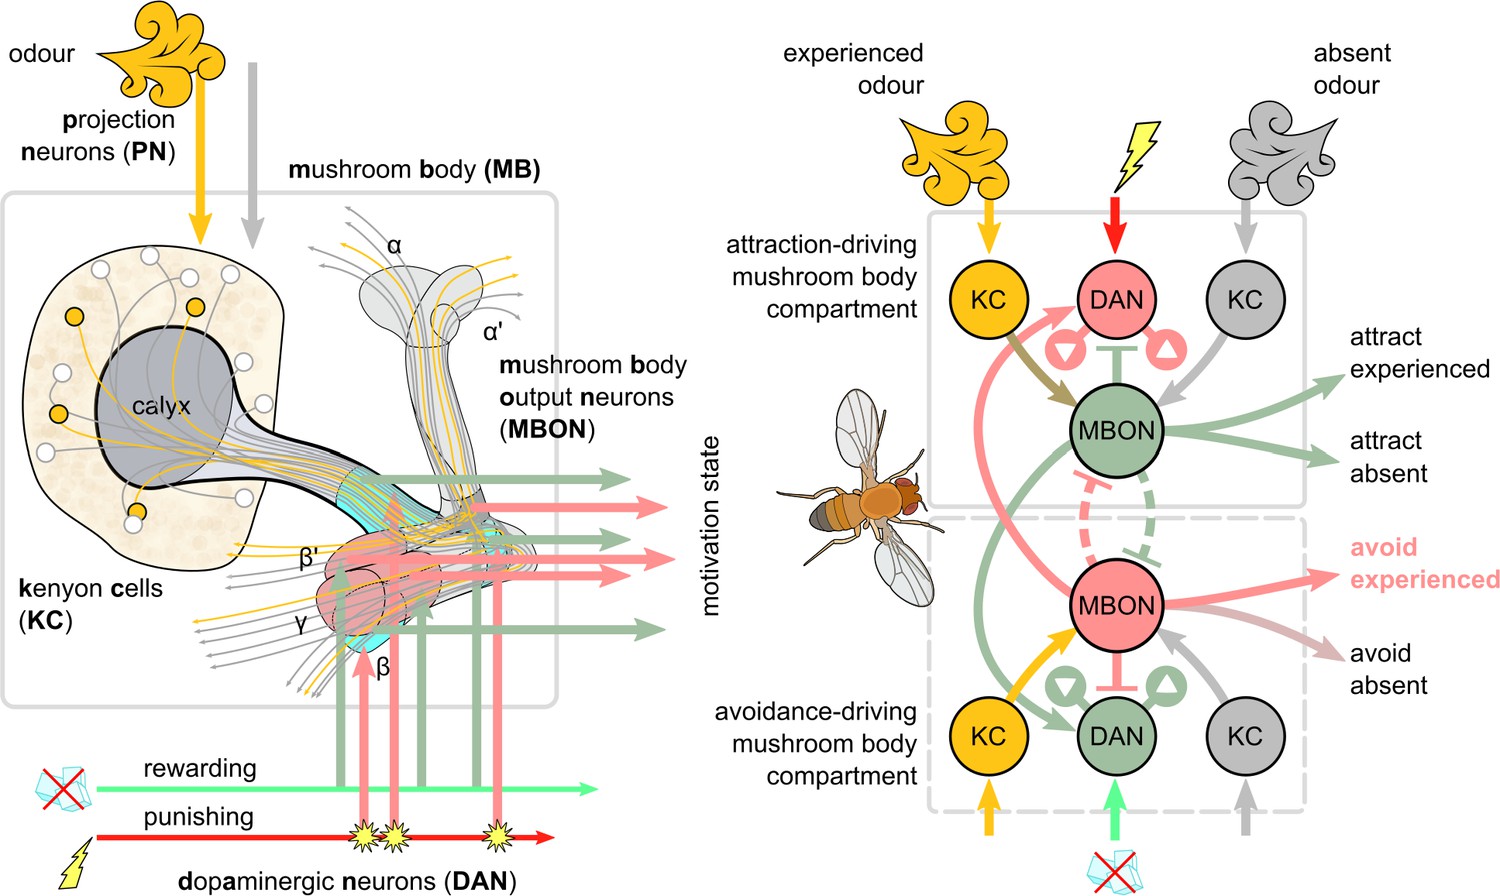
Overview of the mushroom body circuit.
Left: the main anatomical pathways. In the illustration, the presented odour activates the Kenyon cells (KCs) through the projection neurons (PNs). The parallel axons of KCs propagate this signal to the lobes of the mushroom body. The mushroom body output neurons (MBONs) extend their dendrites in the mushroom body lobes, receiving input from the KCs. Electric shock creates a punishing signal that excites some dopaminergic neurons (DANs), whose axons terminate in the lobes and modulate the synaptic weights between KCs and MBONs. Right: schematic of potential connections between punishment/reward DANs and approach/avoidance MBONs. Note that although DANs transferring punishing signals modulate the KC activation of MBONs that encode positive motivations (decreasing attraction to the presented odour and increasing attraction to odours not present [the dopaminergic plasticity rule]), MBONs that encode negative motivations will also gain higher responses due to release of inhibition between MBONs, and the feedback connections from MBONs to other DANs. In our model, we further decompose these functions using three DANs and three MBONs for each motivation (positive or negative) and map these units to specific identified neurons and microcircuits in the brain of Drosophila. These circuits include some direct (but not mutual) MBON-MBON connections (dashed inhibitory connections).
Figure 2
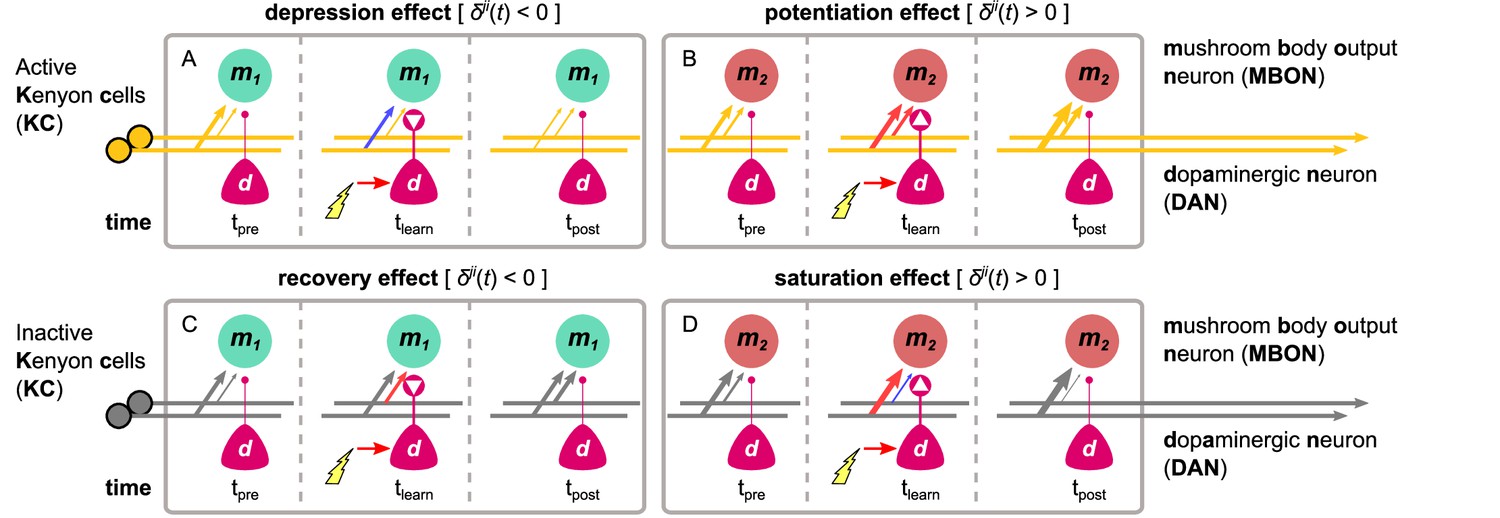
The different effects of the dopaminergic plasticity rule, depending on the activity of the Kenyon cell (KC) (orange indicates active) and the sign of the dopaminergic factor (white arrowheads in dots).
The dopaminergic plasticity rule (DPR) can cause four different effects that work in harmony or discord to maximise the information captured in each experience and allow different types of memories to be formed for each KC→MBON synapse. In each box, time-step shows the initial KC→MBON synaptic weights (thickness of the arrows); electric shock activates the DAN in time-step causing modulation of the synaptic weights (red: increase; blue: decrease), while time-step shows the synaptic weights after the shock delivery. (A) Example of the depression effect – the synaptic weight decreases when and the KC is active. (B) Example of the potentiation effect – the synaptic weight increases when and the KC is active. (C) Example of the recovery effect – the synaptic weight increases when and the KC is inactive. (D) Example of the saturation effect – the synaptic weight increases further (when ) or decreases further (when ) when and the KC is inactive. MBON: mushroom body output neuron.
Figure 3 with 1 supplement

The incentive circuit (IC) integrates the different microcircuits of the mushroom body into a unified model allowing the expression of more complicated behaviours and memory dynamics.
It combines the susceptible, restrained, reciprocal short- and long-term memories and the memory assimilation mechanism microcircuits in one circuit that is able to form, consolidate, and forget different types of memories that motivate the animal to take actions. and : avoidance- and attraction-driving discharging dopaminergic neurons (DANs); and : avoidance- and attraction-driving charging DANs; and : avoidance- and attraction-driving forgetting DANs; and : avoidance- and attraction-driving susceptible mushroom body output neurons (MBONs); and : avoidance- and attraction-driving restrained MBONs; and : avoidance- and attraction-driving long-term memory MBONs.
-
Figure 3—source data 1
Experimental data from Bennett et al., 2021 modified to include the predicted neuron types.
- https://cdn.elifesciences.org/articles/75611/elife-75611-fig3-data1-v1.xlsx
Figure 3—figure supplement 1
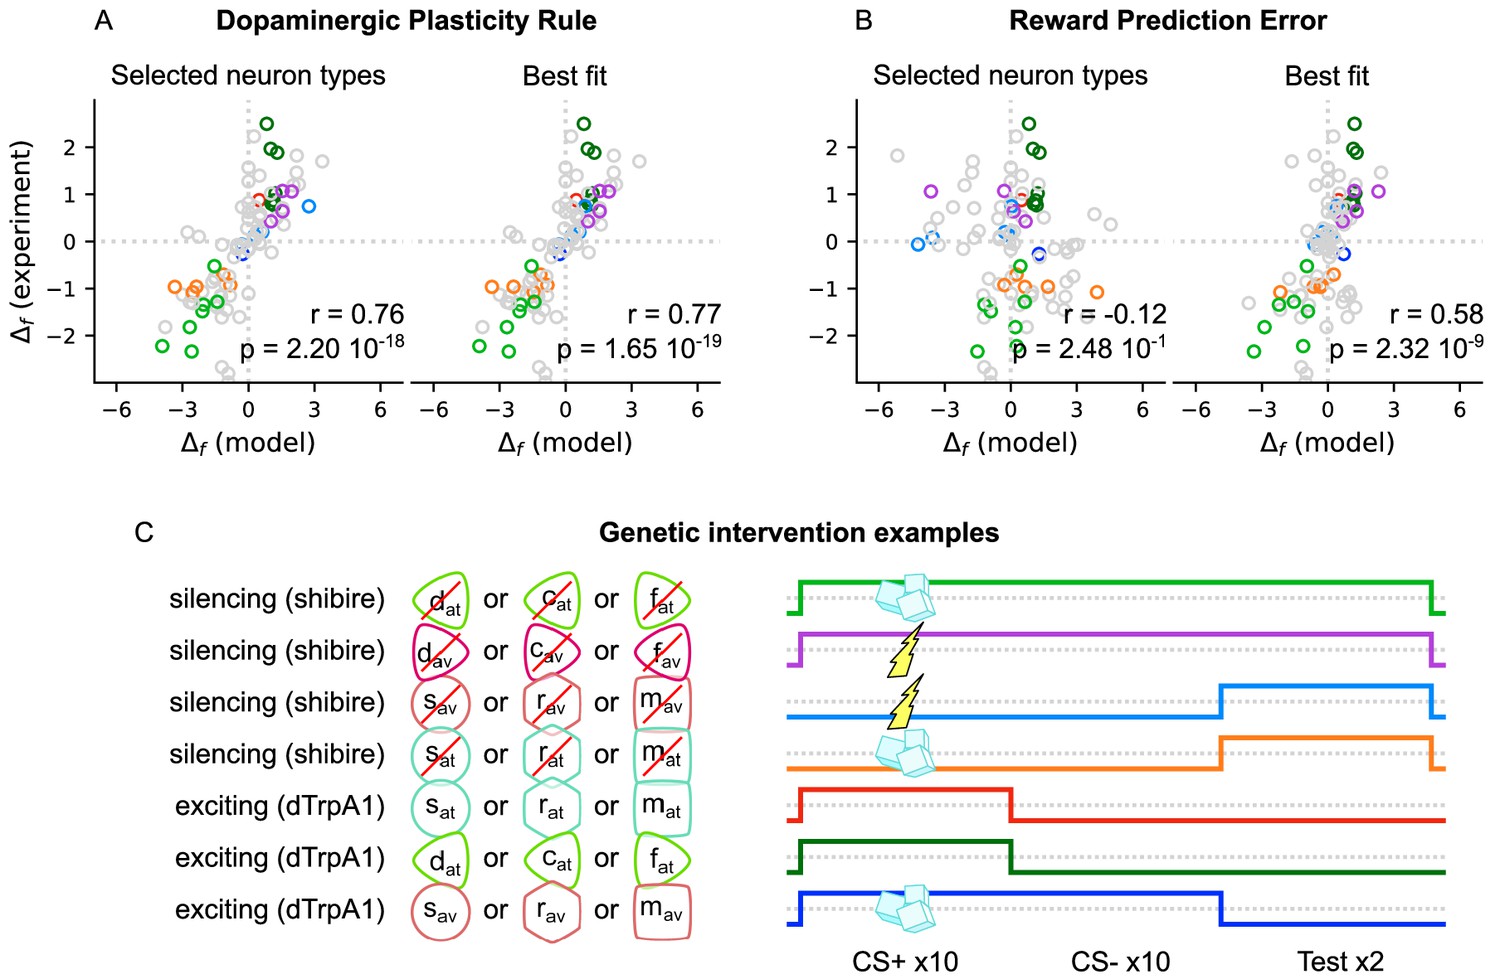
Behaviour generated by the model correlates with 92 experiments reported in Bennett et al., 2021.
Testing the performance of the incentive circuit in the experiments of Bennett et al., 2021, Figure 5, Bennett et al., 2021 collected behavioural data ( measure) from 92 experiments, summarised in Figure 3—source data 1, and calculated their correlation coefficient to the behaviour produced by their model (VSλmodel: , ; MV model: , ). The behavioural data involve intervention (e.g., activation or silencing) in different mushroom body output neurons (MBONs) or dopaminergic neurons (DANs), which are grouped by colour codes. Here we use the same colour codes as in the original paper for convenience. For the details of this analysis, please refer to Bennett et al., 2021. We test the behaviour of the incentive circuit when using two different learning rules: (A) the dopaminergic plasticity rule (DPR) and (B) the reward prediction error (RPE). As we do not know what type the intervened MBON or DAN is, we test for all the types (and groups of them) and report the ones with the highest correlation under the ‘Best fit’ plot. We also try to guess the type by the identity of the neuron (or group of neurons) intervened and report the correlation coefficient under the ‘Selected neuron types’ plot. The types selected for each experiment can also be found in Figure 3—source data 1. (C) Examples of the genetic intervention as coloured in (A) and (B). We run 10 trials of odour A + shock or sugar (indicated with a thunder or cubes, respectively) or without reinforcement (absence of thunder and sugar cubes), followed by 10 trials of odour B without reinforcement (acquisition phase). Then we proceed with two trials of testing odour A vs. odour B (extinction phase). In addition, we model genetic intervention by targeting selected neurons of our model and silence them via the shibire blockage or excite them through the dTrpA1 channel (timing of the intervention is shown by the coloured lines). The colours of the lines correspond to the different examples of the coloured samples of (A) and (B).
Figure 4 with 1 supplement
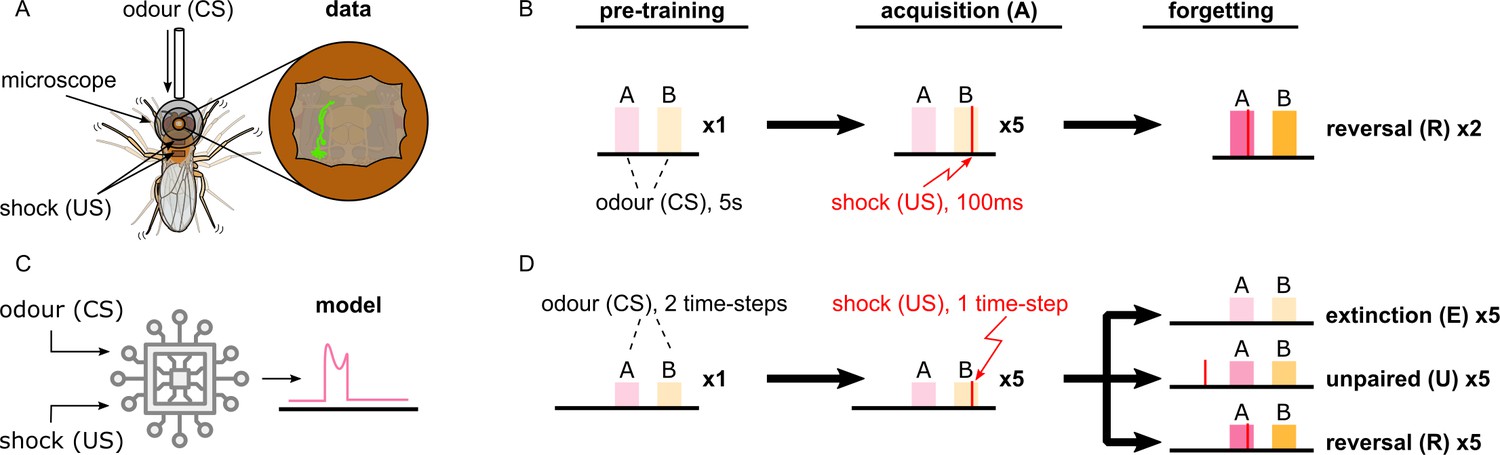
Description of the experimental setup and the aversive olfactory conditioning paradigms.
(A) Setup for visualising neural activity via Ca2+ imaging during aversive olfactory memory acquisition and reversal. Flies are head-fixed and cuticle dissected for ratiometric imaging of Ca2+-sensitive GCaMP6f and Ca2+-insensitive tdTomato. (B) The aversive olfactory conditioning experimental paradigm. 5 s presentations of odours A (3-octanol [OCT]; coloured pink) and B (4-methylcyclohexanol [MCH]; coloured yellow) continuously alternate, separated by fresh air, while the shock input (100 ms of 120 V) forms the different phases: one repeat of pre-training, where no shock is delivered; five repeats of acquisition, where shock (thin red line) is delivered in the last second of odour B; two repeats of reversal where shock is paired with odour A. (C) Abstract representation of the computational model as an electronic chip. The model receives the conditional (odour) and unconditional stimuli (electric shock) and produces the dopaminergic neuron (DAN) and mushroom body output neuron (MBON) responses using the incentive circuit and the dopaminergic plasticity rule. (D) The aversive olfactory conditioning experimental paradigm modified for testing the model. Odours A (coloured pink) and B (coloured yellow) are presented for two time-steps each, in alternation, separated by one time-step fresh air, while the shock input forms the different phases and forgetting conditions: one repeat of pre-training, where no shock is delivered; five repeats of acquisition, where shock is delivered in the second time-step of odour B; five repeats of forgetting that can be either extinction (lightest shade of odour colour) where shock is not presented, unpaired (mid shade of odour colour) where shock (thin red line) is paired with the fresh air ‘break’, or reversal (dark shade of odour colour) where shock is paired with odour A.
-
Figure 4—source data 1
Imaging data of all the recorded neurons in the Drosophila melanogaster mushroom body.
- https://cdn.elifesciences.org/articles/75611/elife-75611-fig4-data1-v1.zip
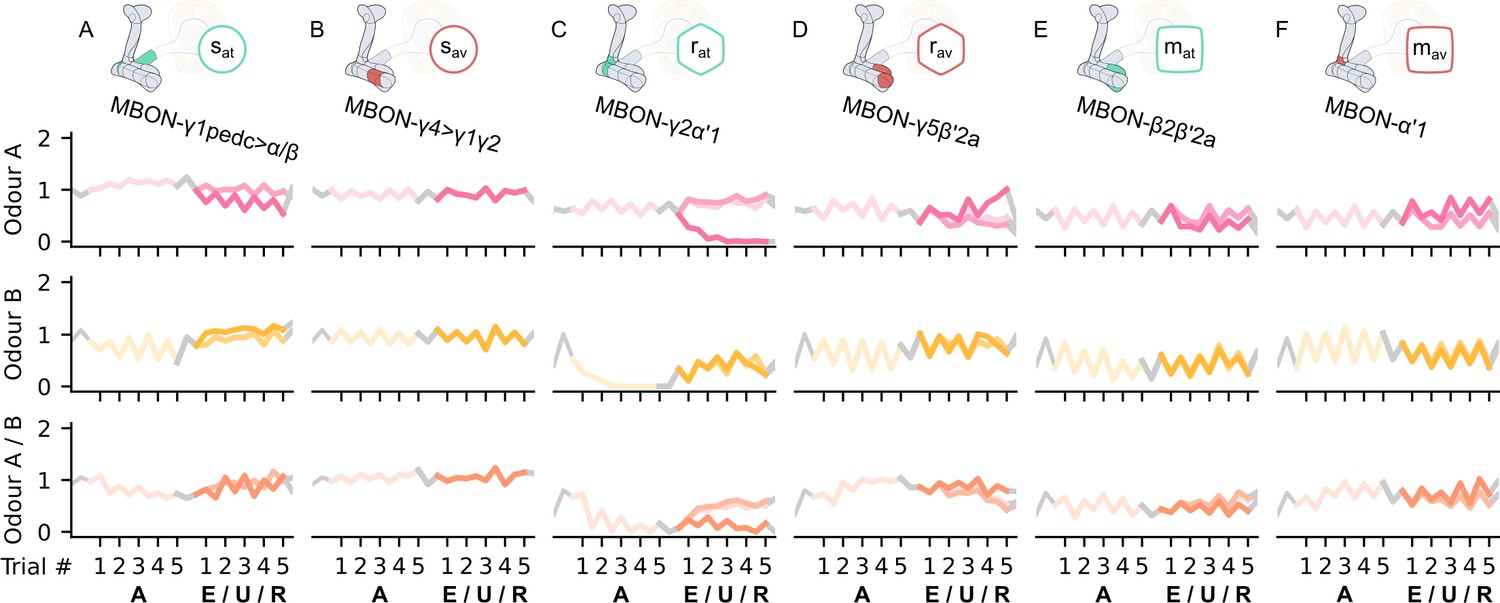
Figure 4—figure supplement 1
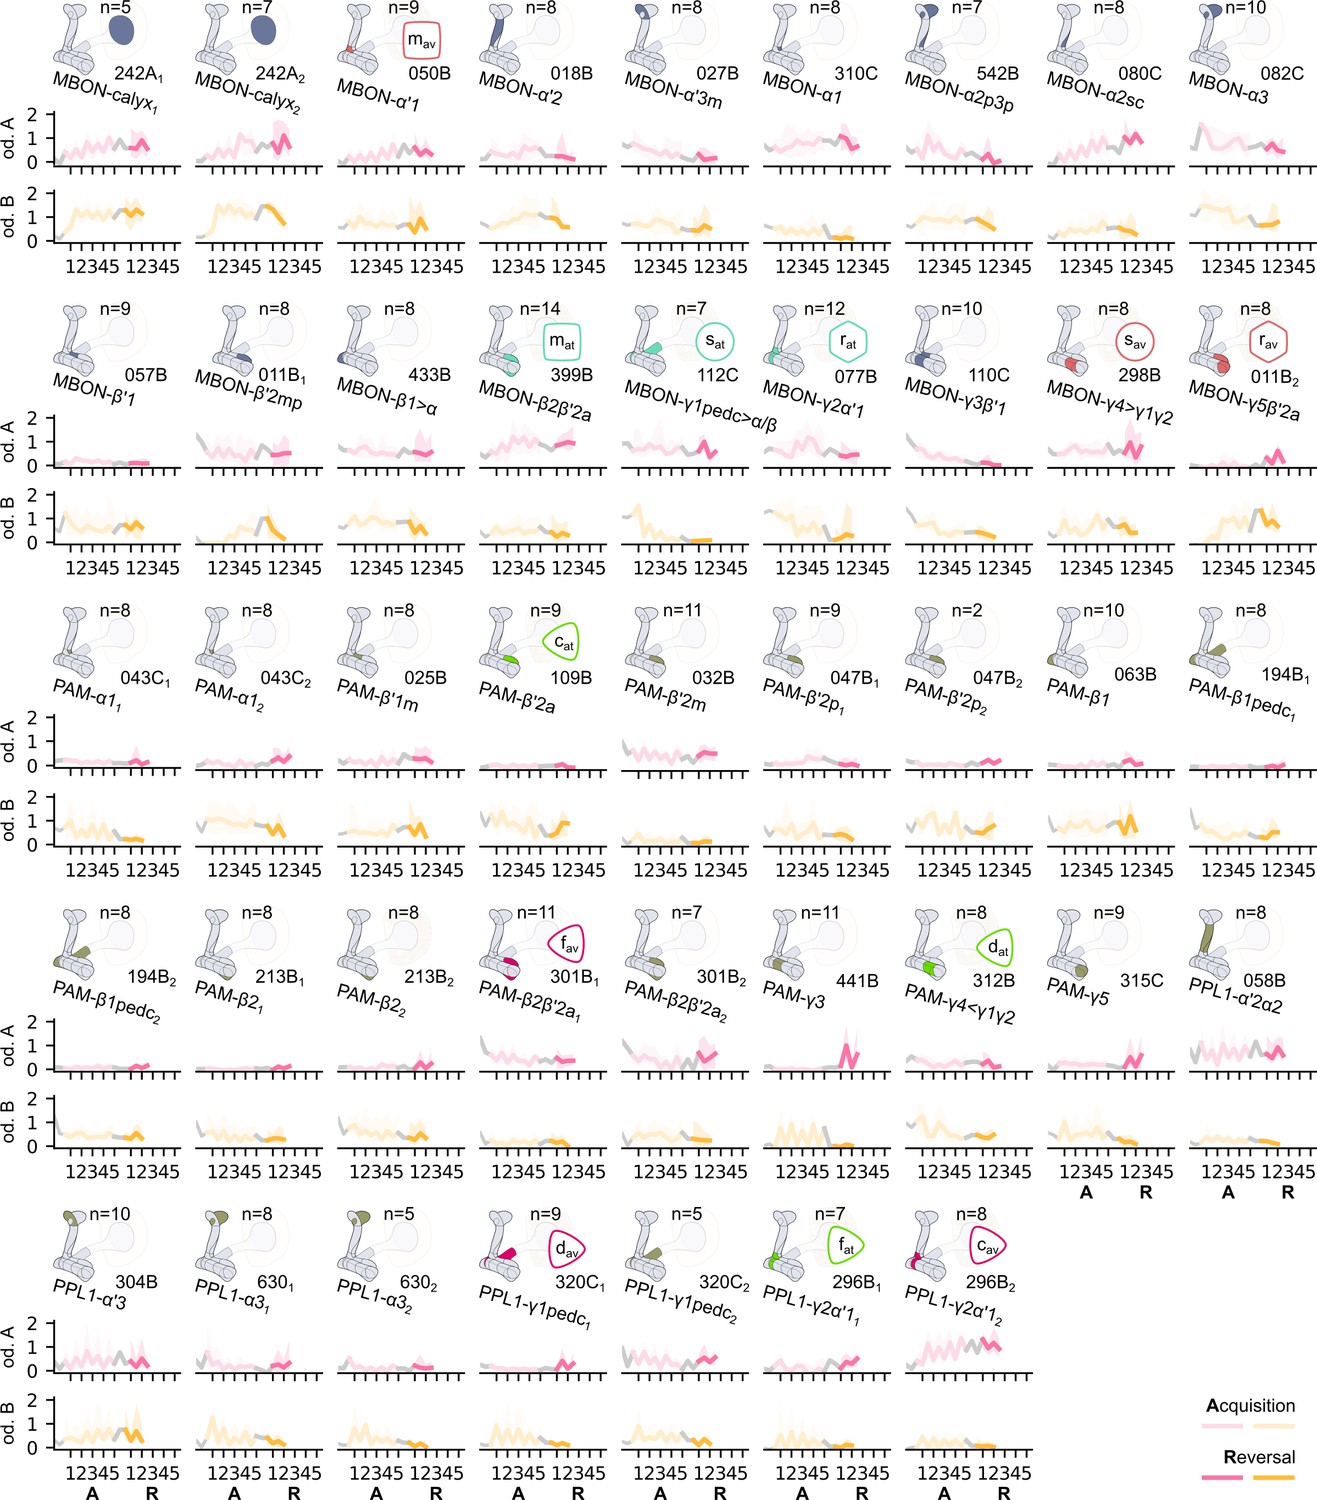
The responses from all the recorded neurons in the Drosophila melanogaster mushroom body during the experiment described in Figure 4B.
In each row, we present the driver of the recorded neurons and a schematic representation of where they innervate the mushroom body; the median responses of the neuron for each odour (coloured as pink for odour A or yellow for odour B) over a number of flies, denoted as , and the 25% and 75% quantiles marked by the coloured region.
Figure 5 with 3 supplements
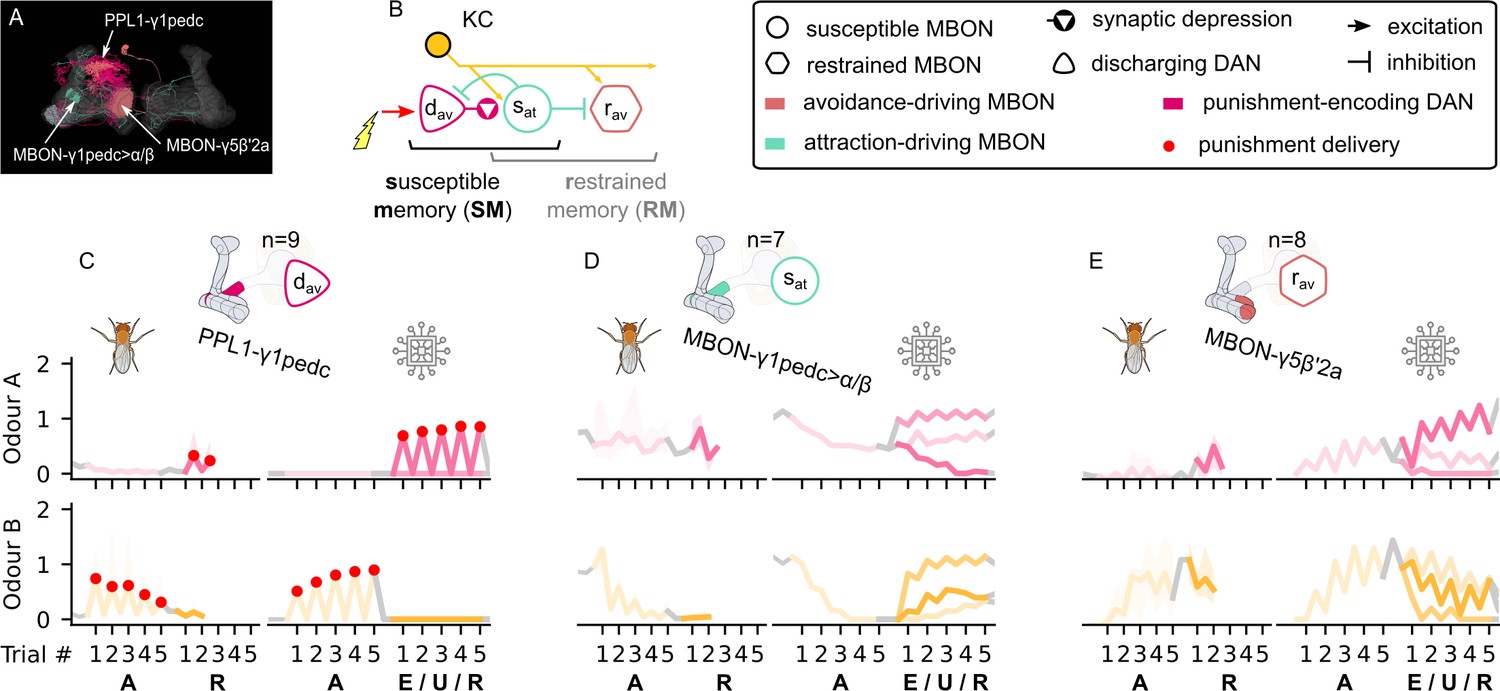
The susceptible and restrained microcircuits of the mushroom body.
(A) Image of the attraction-driving susceptible and avoidance-driving restrained memory microcircuits made of the PPL1-γ1pedc, MBON-γ1pedc, and MBON-γ5β′2a neurons – created using the Virtual Fly Brain software (Milyaev et al., 2012). (B) Schematic representation of the susceptible and restrained memories microcircuits connected via the susceptible mushroom body output neuron (MBON). The responses of (C) the punishment-encoding discharging dopaminergic neuron (DAN), , (D) the attraction-driving susceptible MBON, , and (E) the avoidance-driving restrained MBON, , generated by experimental data (left) and the model (right) during the olfactory conditioning paradigms of Figure 4D. Lightest shades denote the extinction, mid shades the unpaired, and dark shades the reversal phase. For each trial, we report two consecutive time-steps: the off-shock (i.e., odour only) followed by the on-shock (i.e., paired odour and shock) when available (i.e., odour B in acquisition and odour A in reversal phase); otherwise, a second off-shock time-step (i.e., all the other phases).
Figure 5—figure supplement 1
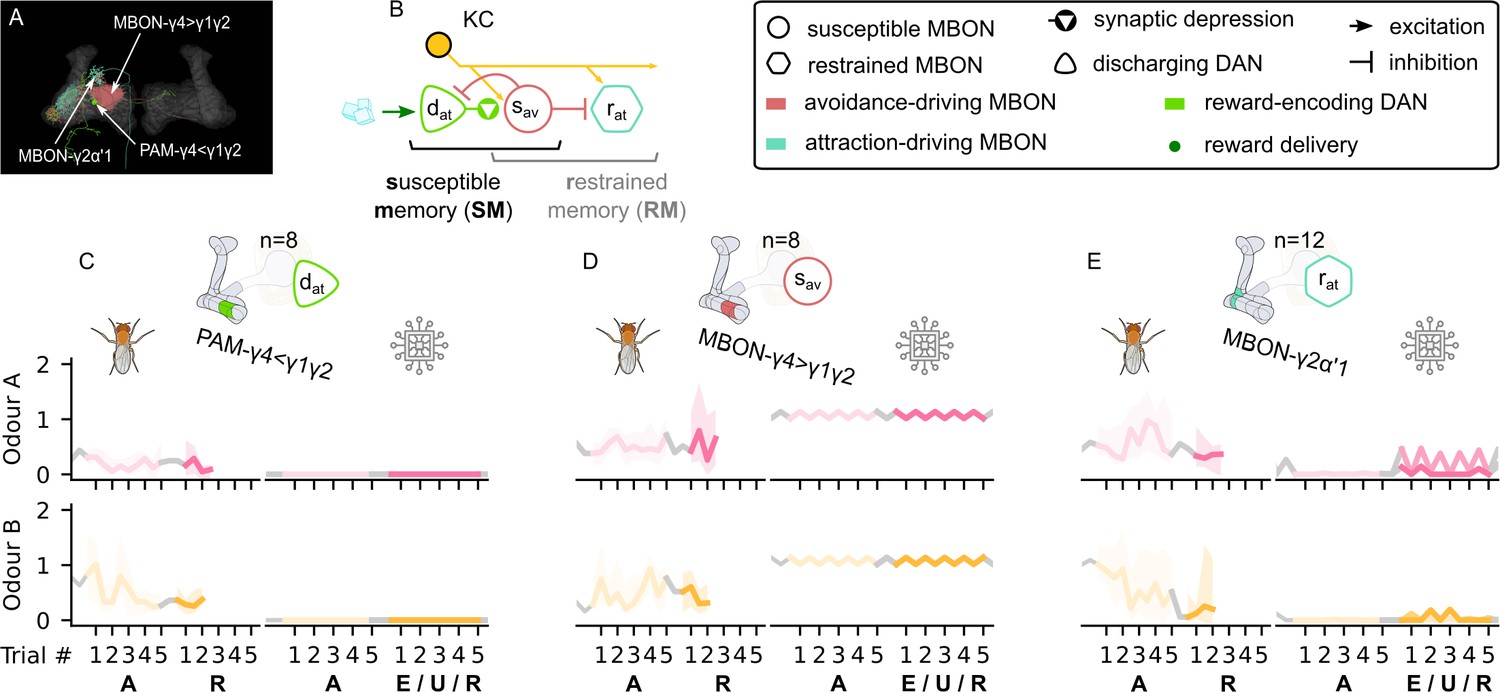
The avoidance-driving susceptible memory, attraction-driving restrained memory, and their responses.
The susceptible and restrained microcircuits of the mushroom body. (A) Image of the avoidance-driving susceptible and attraction-driving restrained memory microcircuits made of the PAM-γ4γ1γ2 and MBON-γ2α′1 neurons – created using the Virtual Fly Brain software (Milyaev et al., 2012). (B) Schematic representation of the susceptible and restrained memories microcircuits connected via the susceptible mushroom body output neuron (MBON). The responses of (C) the reward-encoding discharging dopaminergic neuron (DAN), , (D) the avoidance-driving susceptible MBON, , and (E) the attraction-driving restrained MBON, , generated by experimental data (left) and the model (right) during the olfactory conditioning paradigms of Figure 4D. Lightest shades denote the extinction, mid shades the unpaired, and dark shades the reversal phase. For each trial, we report two consecutive time-steps: the off-shock (i.e., odour only) followed by the on-shock (i.e., paired odour and shock) when available (i.e., odour B in acquisition and odour A in reversal phase); otherwise, a second off-shock time-step (i.e., all the other phases).
Figure 5—figure supplement 2
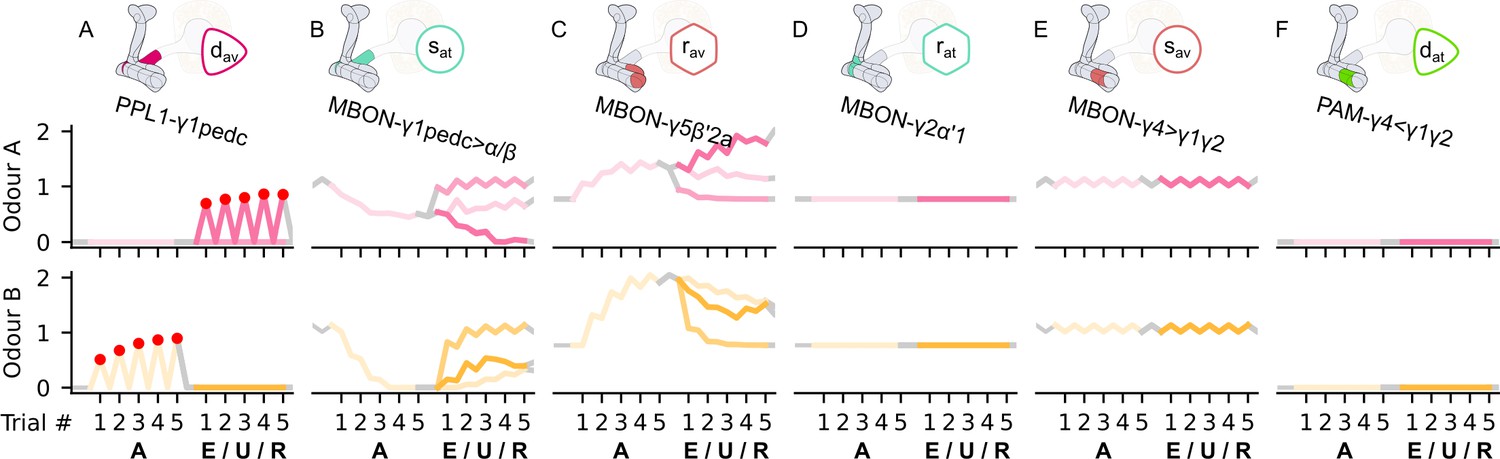
The responses of the neurons of the incentive circuit using the connections introduced so far of the susceptible memory (SM) and restrained memory (RM) microcircuits.
The responses of (A) the punishment-encoding discharging dopaminergic neuron (DAN), , (B) the attraction-driving susceptible mushroom body output neuron (MBON), , (C) the avoidance-driving restrained MBON, , (D) the attraction-driving restrained MBON, , (E) the avoidance-driving susceptible MBON, , and (F) the reward-encoding discharging DAN, , generated by experimental data (left) and the model (right) during the olfactory conditioning paradigms of Figure 4D. Lightest shades denote the extinction, mid shades the unpaired, and dark shades the reversal phase. The first row of responses (coloured pink) corresponds to responses associated with odour A, and the second (coloured yellow) to those associated with odour B. For each trial, we report two consecutive time-steps: the off-shock (i.e., odour only) followed by the on-shock (i.e., paired odour and shock) when available (i.e., odour B in acquisition and odour A in reversal phase); otherwise, a second off-shock time-step (i.e., all the other phases).
Figure 5—figure supplement 3
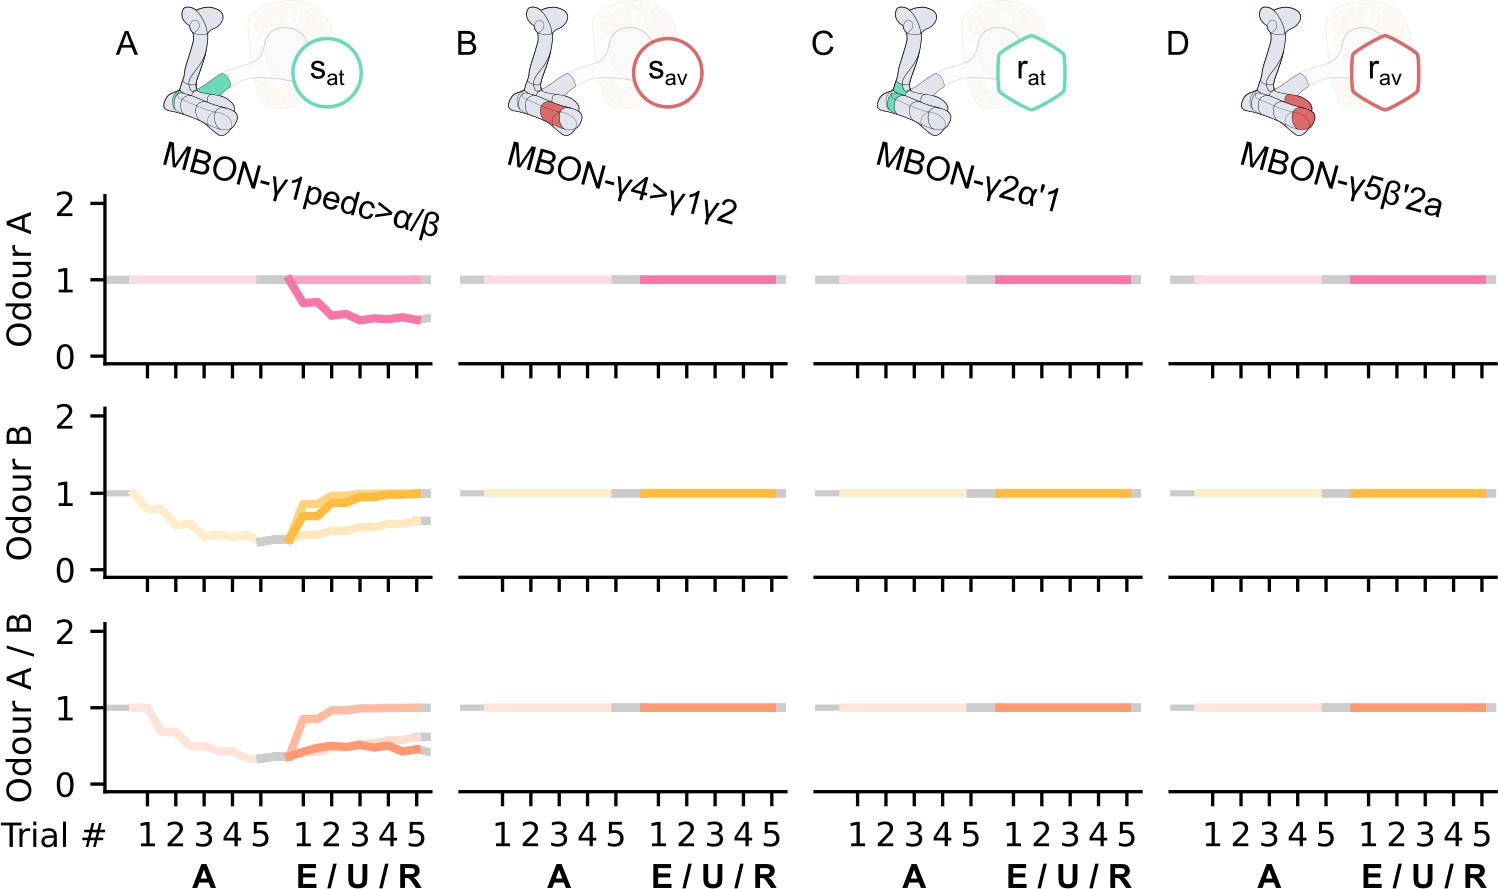
The KC→MBON synaptic weights of the neurons of the incentive circuit using the connections introduced so far of the susceptible memory (SM) and restrained memory (RM) microcircuits.
The synaptic weights of (A) the attraction-driving susceptible mushroom body output neuron (MBON), , (B) the avoidance-driving susceptible MBON, , (C) the attraction-driving restrained MBON, , and (D) the avoidance-driving restrained MBON, , generated by experimental data (left) and the model (right) during the olfactory conditioning paradigms of Figure 4D. Lightest shades denote the extinction, mid shades the unpaired, and dark shades the reversal phase. The first row of weights (coloured pink) corresponds to Kenyon cells (KCs) associated with odour A, the second (coloured yellow) to KCs associated with odour B, and the third (coloured orange) to KCs associated with both odours. For each trial, we report two consecutive time-steps: the off-shock (i.e., odour only) followed by the on-shock (i.e., paired odour and shock) when available (i.e., odour B in acquisition and odour A in reversal phase); otherwise, a second off-shock time-step (i.e., all the other phases).
Figure 6 with 2 supplements
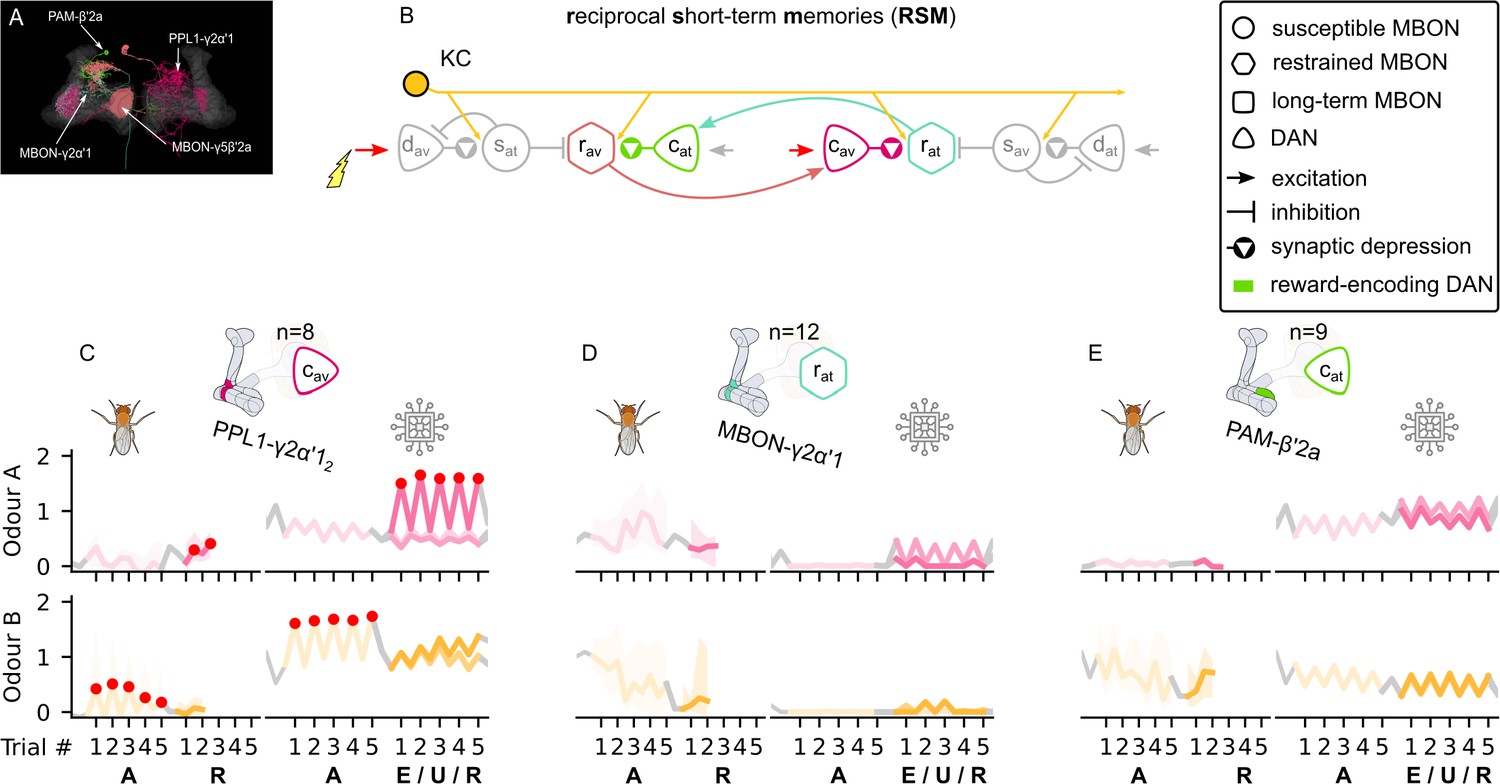
The reciprocal short-term memories microcircuit of the mushroom body.
(A) Image of the reciprocal short-term memories microcircuit made of the MBON-γ5β′2a, PAM-β′2a, PPL1-γ2α′1, and MBON-γ2α′1 neurons – created using the Virtual Fly Brain software (Milyaev et al., 2012). (B) Schematic representation of the reciprocal short-term memories microcircuit (coloured) connected to the susceptible memories via the restrained mushroom body output neurons (MBONs). The responses of (C) the punishment-encoding charging dopaminergic neuron (DAN), , the (D) attraction-driving restrained MBON, , and (E) the reward-encoding charging DAN, , generated by experimental data (left) and the model (right) during the olfactory conditioning paradigms of Figure 4D. Lightest shades denote the extinction, mid shades the unpaired, and dark shades the reversal phase. For each trial, we report two consecutive time-steps: the off-shock (i.e., odour only) followed by the on-shock (i.e., paired odour and shock) when available (i.e., odour B in acquisition and odour A in reversal phase); otherwise, a second off-shock time-step (i.e., all the other phases).
Figure 6—figure supplement 1
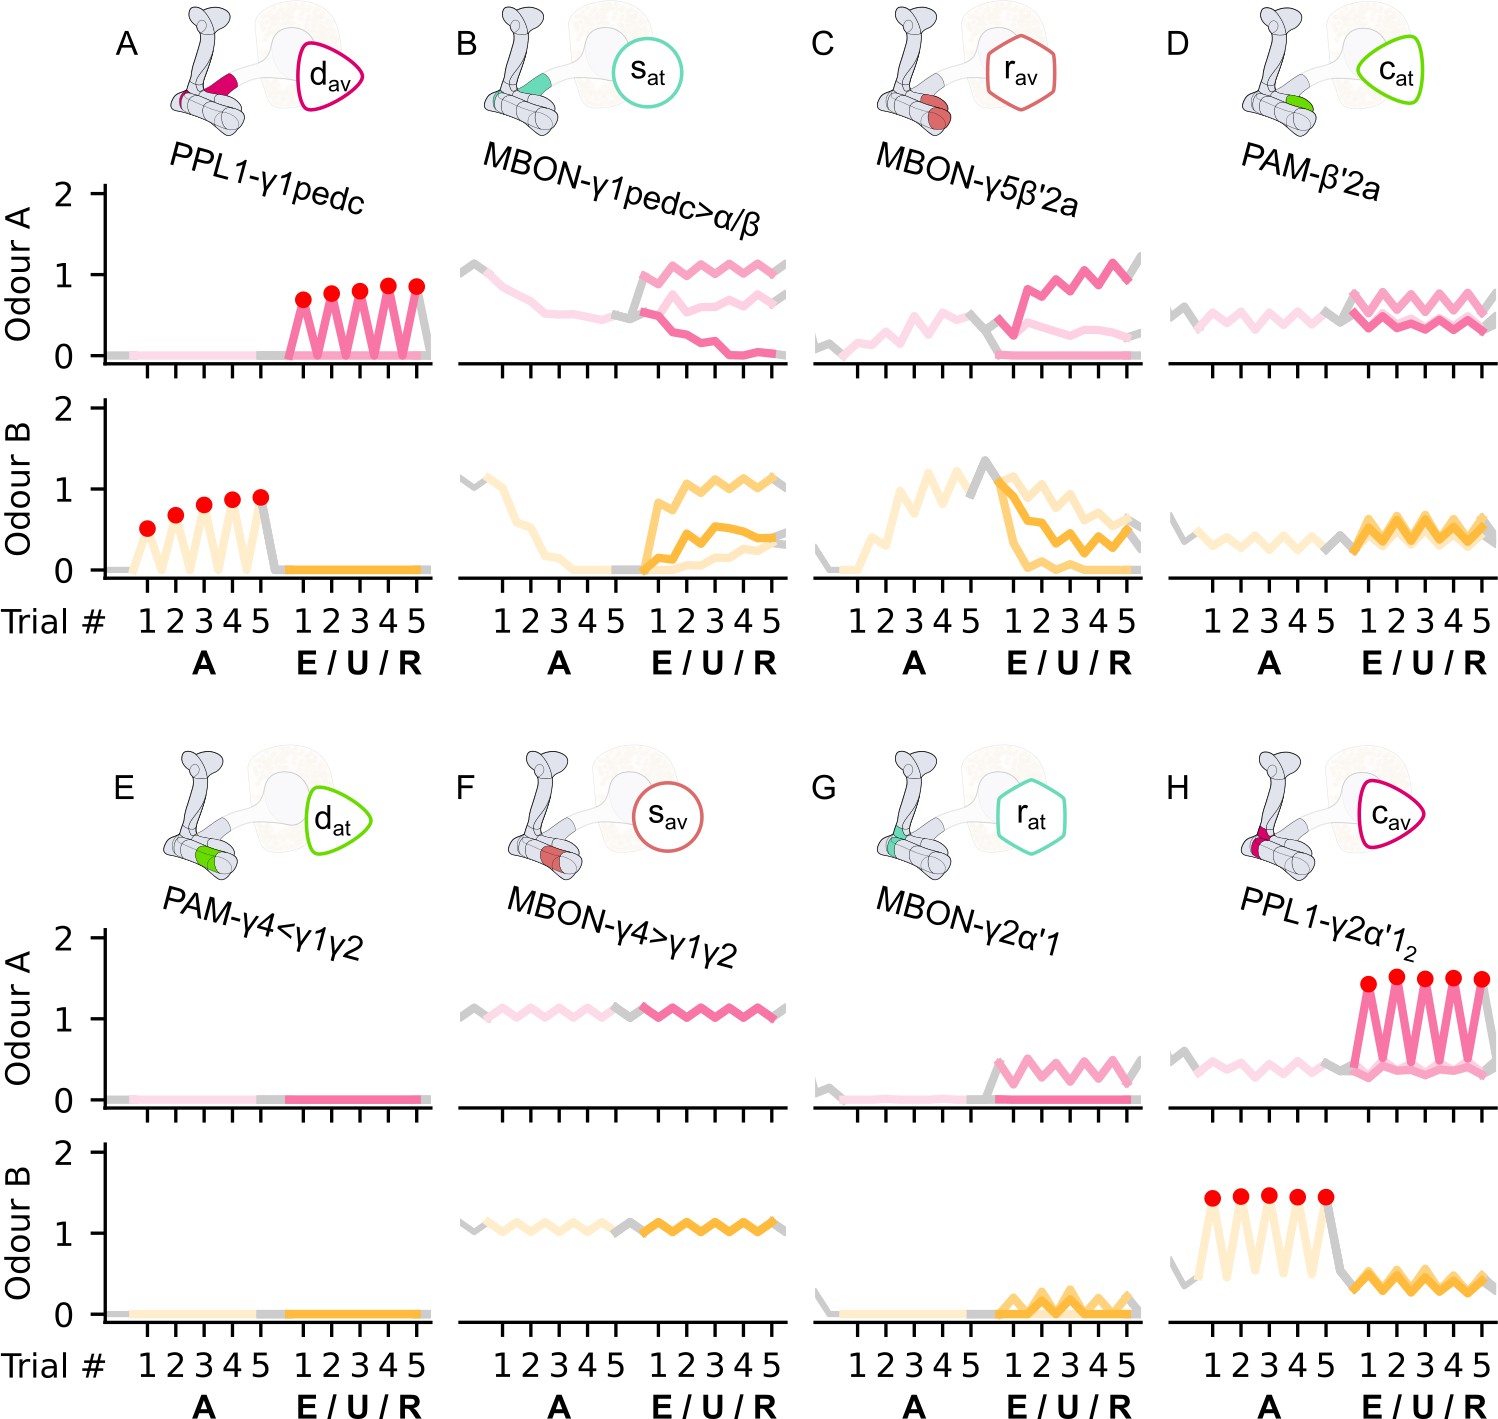
The responses of the neurons of the incentive circuit using the connections introduced so far of the susceptible memory (SM), restrained memory (RM), and reciprocal short-term memory (RSM) microcircuits.
The responses of (A) the punishment-encoding discharging dopaminergic neuron (DAN), , (B) the attraction-driving susceptible mushroom body output neuron (MBON), , (C) the avoidance-driving restrained MBON, , (D) the reward-encoding charging DAN, , (E) the reward-encoding discharging DAN, , (F) the avoidance-driving susceptible MBON, , (G) the attraction-driving restrained MBON, , and (H) the punishment-encoding charging DAN, , generated by experimental data (left) and the model (right) during the olfactory conditioning paradigms of Figure 4D. Lightest shades denote the extinction, mid shades the unpaired, and dark shades the reversal phase. The first row of responses (coloured pink) corresponds to responses associated with odour A, and the second (coloured yellow) to those associated with odour B. For each trial, we report two consecutive time-steps: the off-shock (i.e., odour only) followed by the on-shock (i.e., paired odour and shock) when available (i.e., odour B in acquisition and odour A in reversal phase); otherwise, a second off-shock time-step (i.e., all the other phases).
Figure 6—figure supplement 2
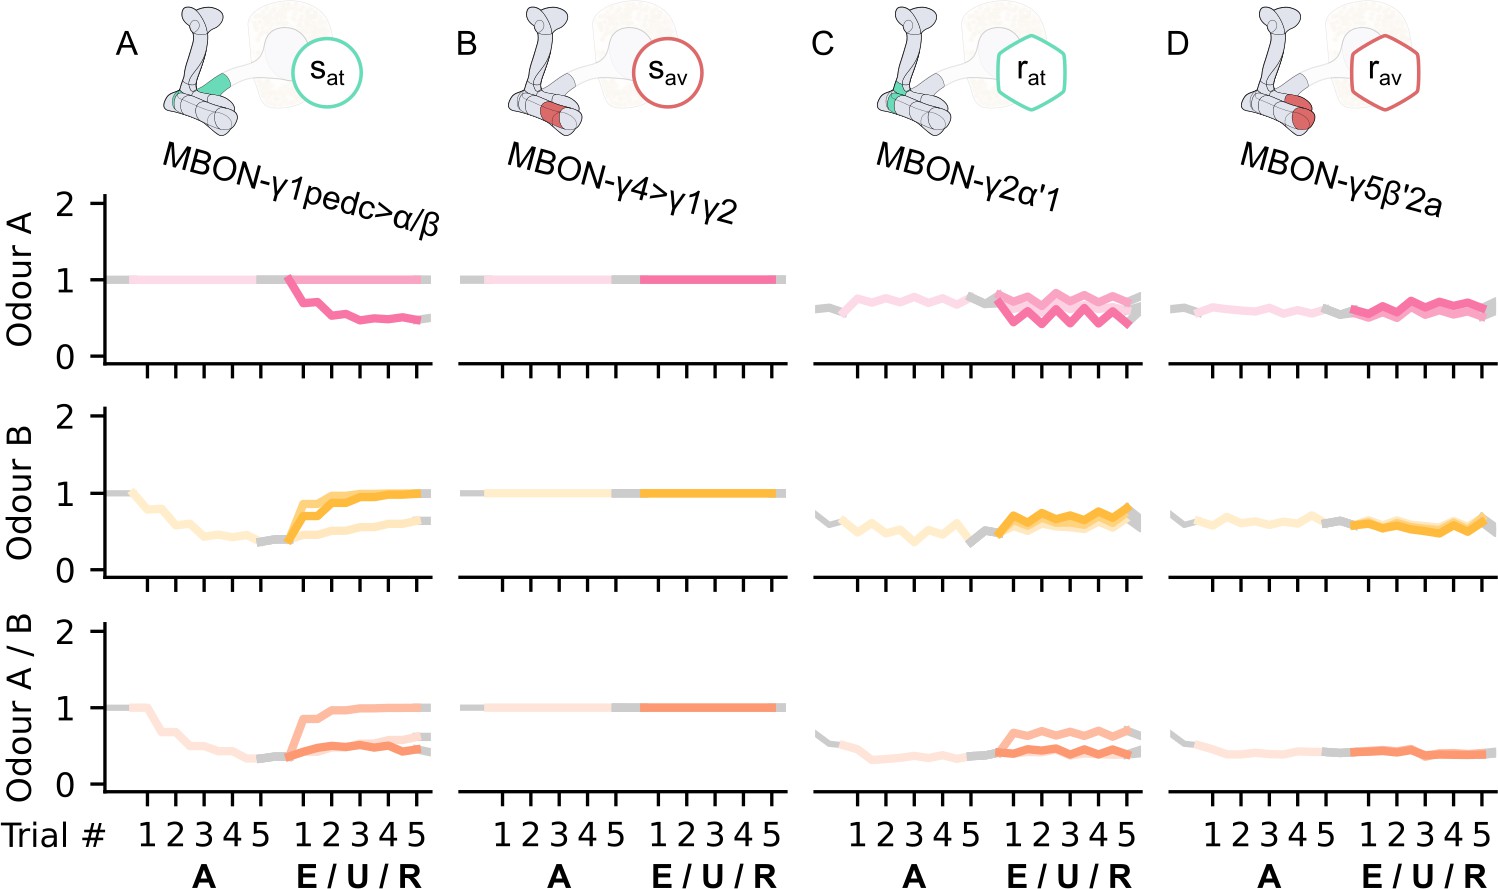
The KC→MBON synaptic weights of the neurons of the incentive circuit using the connections introduced so far of the susceptible memory (SM), restrained memory (RM), and reciprocal short-term memory (RSM) microcircuits.
The synaptic weights of (A) the attraction-driving susceptible mushroom body output neuron (MBON), , (B) the avoidance-driving susceptible MBON, , (C) the attraction-driving restrained MBON, , and (D) the avoidance-driving restrained MBON, , generated by experimental data (left) and the model (right) during the olfactory conditioning paradigms of Figure 4D. Lightest shades denote the extinction, mid shades the unpaired, and dark shades the reversal phase. The first row of weights (coloured pink) corresponds to Kenyon cells (KCs) associated with odour A, the second (coloured yellow) to KCs associated with odour B, and the third (coloured orange) to KCs associated with both odours. For each trial, we report two consecutive time-steps: the off-shock (i.e., odour only) followed by the on-shock (i.e., paired odour and shock) when available (i.e., odour B in acquisition and odour A in reversal phase); otherwise, a second off-shock time-step (i.e., all the other phases).
Figure 7 with 2 supplements
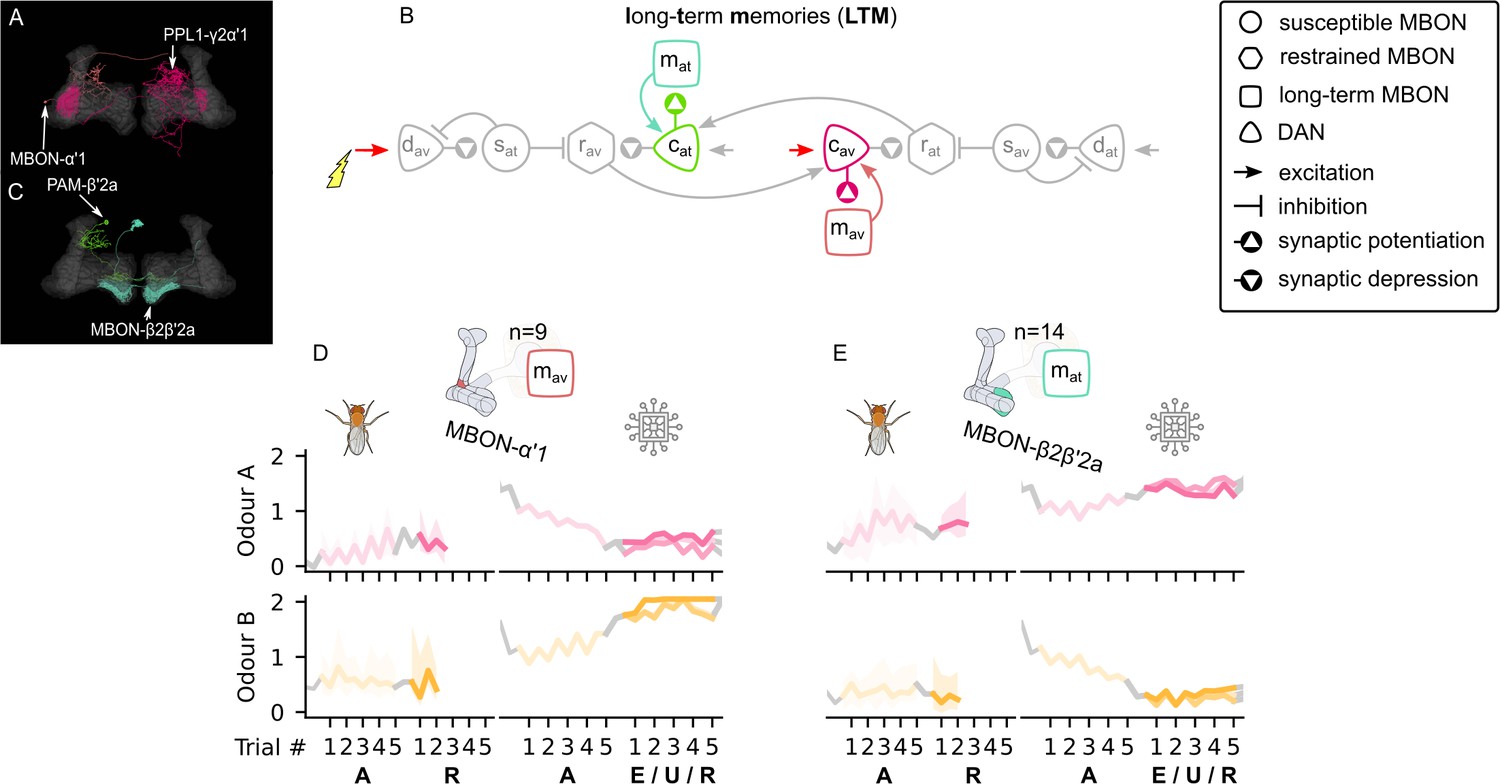
The long-term memory microcircuits of the mushroom body.
(A) Image of the avoidance-encoding long-term memory microcircuit made of the MBON-α′1 and PPL1-γ2α′1 – created using the Virtual Fly Brain software (Milyaev et al., 2012). (B) Schematic representation of the long-term memory microcircuits (coloured) connected to the reciprocal short-term memory (RSM) via the charging dopaminergic neurons (DANs). (C) Image of the attraction-encoding long-term memory microcircuit made of the MBON-β2β′2a and PAM-β2a – created using the Virtual Fly Brain software (Milyaev et al., 2012). The responses of the (D) avoidance-driving long-term memory mushroom body output neuron (MBON), , and (E) the attraction-driving long-term memory MBON, , generated by experimental data (left) and the model (right) during the olfactory conditioning paradigms of Figure 4D. Lightest shades denote the extinction, mid shades the unpaired, and dark shades the reversal phase. For each trial, we report two consecutive time-steps: the off-shock (i.e., odour only) followed by the on-shock (i.e., paired odour and shock) when available (i.e., odour B in acquisition and odour A in reversal phase); otherwise, a second off-shock time-step (i.e., all the other phases).
Figure 7—figure supplement 1
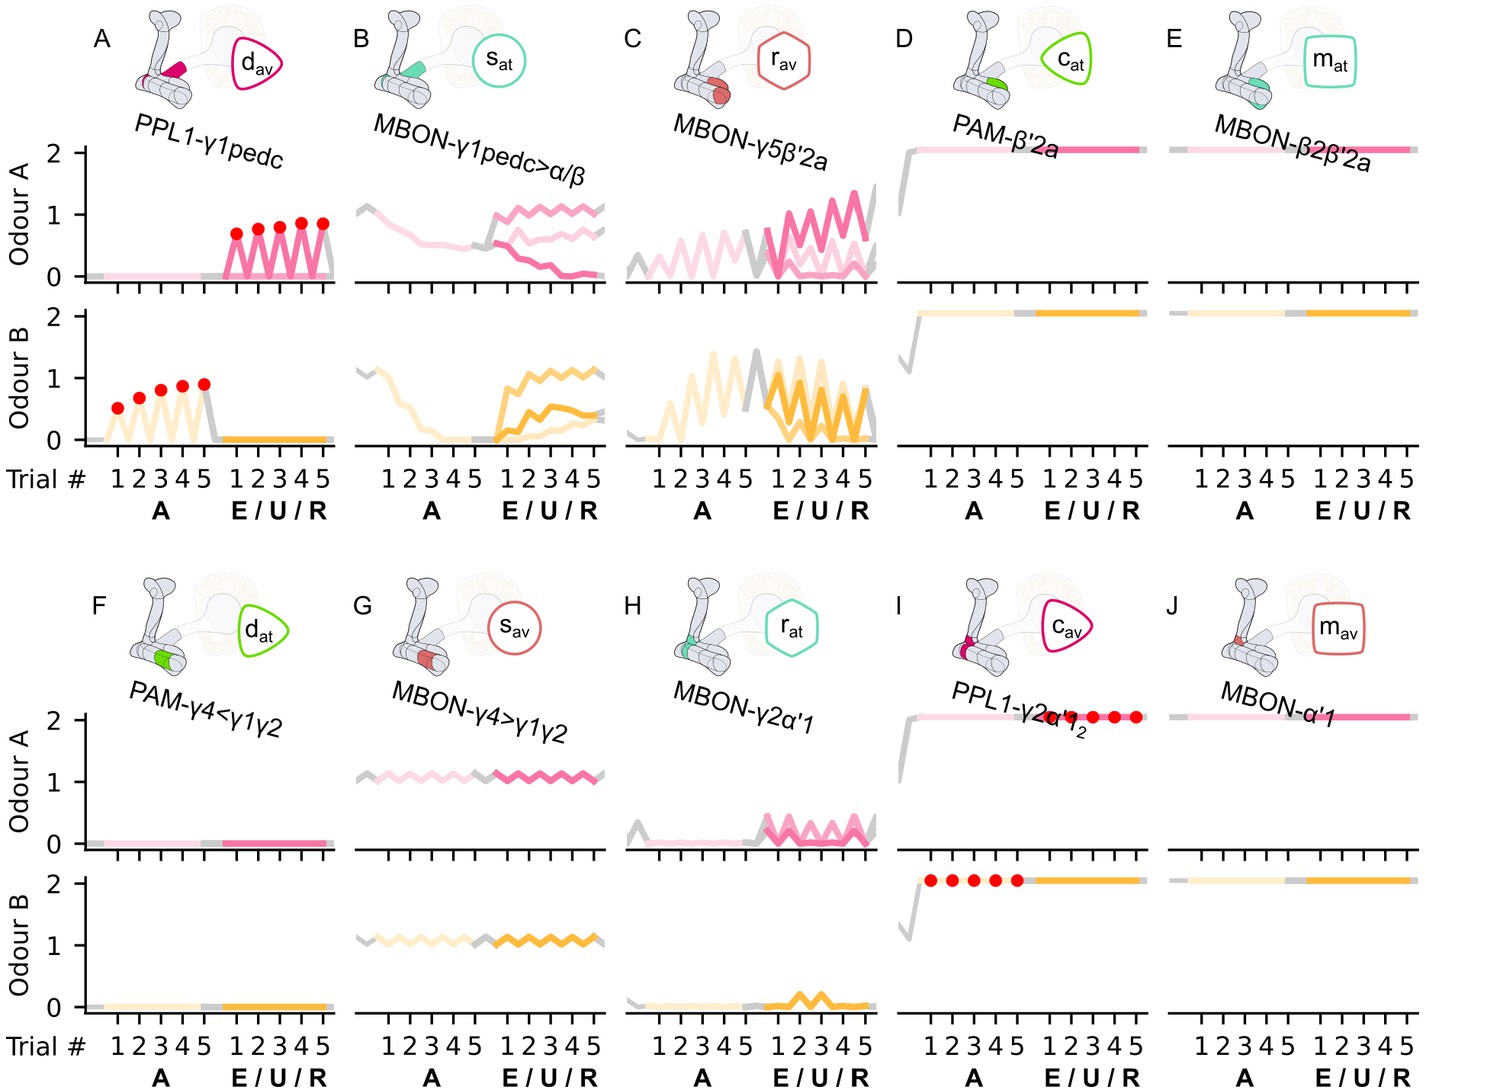
The responses of the neurons of the incentive circuit using the connections introduced so far of the susceptible memory (SM), restrained memory (RM), reciprocal short-term memory (RSM), and long-term memory (LTM) microcircuits.
The responses of (A) the punishment-encoding discharging dopaminergic neuron (DAN), , (B) the attraction-driving susceptible mushroom body output neuron (MBON), , (C) the avoidance-driving restrained MBON, , (D) the reward-encoding charging DAN, , (E) the attraction-driving LTM MBON, , (F) the reward-encoding discharging DAN, , (G) the avoidance-driving susceptible MBON, , (H) the attraction-driving restrained MBON, , (I) the punishment-encoding charging DAN, , and (J) the avoidance-driving LTM MBON, , generated by experimental data (left) and the model (right) during the olfactory conditioning paradigms of Figure 4D. Lightest shades denote the extinction, mid shades the unpaired, and dark shades the reversal phase. The first row of responses (coloured pink) corresponds to responses associated with odour A, and the second (coloured yellow) to those associated with odour B. For each trial, we report two consecutive time-steps: the off-shock (i.e., odour only) followed by the on-shock (i.e., paired odour and shock) when available (i.e., odour B in acquisition and odour A in reversal phase); otherwise, a second off-shock time-step (i.e., all the other phases).
Figure 7—figure supplement 2
The KC→MBON synaptic weights of the neurons of the incentive circuit using the connections introduced so far of the susceptible memory (SM), restrained memory (RM), reciprocal short-term memory (RSM), and long-term memory (LTM) microcircuits.
The synaptic weights of (A) the attraction-driving susceptible mushroom body output neuron (MBON), , (B) the avoidance-driving susceptible MBON, , (C) the attraction-driving restrained MBON, , (D) the avoidance-driving restrained MBON, , (E) the attraction-driving LTM MBON, , and (F) the avoidance-driving LTM MBON, , generated by experimental data (left) and the model (right) during the olfactory conditioning paradigms of Figure 4D. Lightest shades denote the extinction, mid shades the unpaired, and dark shades the reversal phase. The first row of weights (coloured pink) corresponds to Kenyon cells (KCs) associated with odour A, the second (coloured yellow) to KCs associated with odour B, and the third (coloured orange) to KCs associated with both odours. For each trial, we report two consecutive time-steps: the off-shock (i.e., odour only) followed by the on-shock (i.e., paired odour and shock) when available (i.e., odour B in acquisition and odour A in reversal phase); otherwise, a second off-shock time-step (i.e., all the other phases).
Figure 8 with 2 supplements
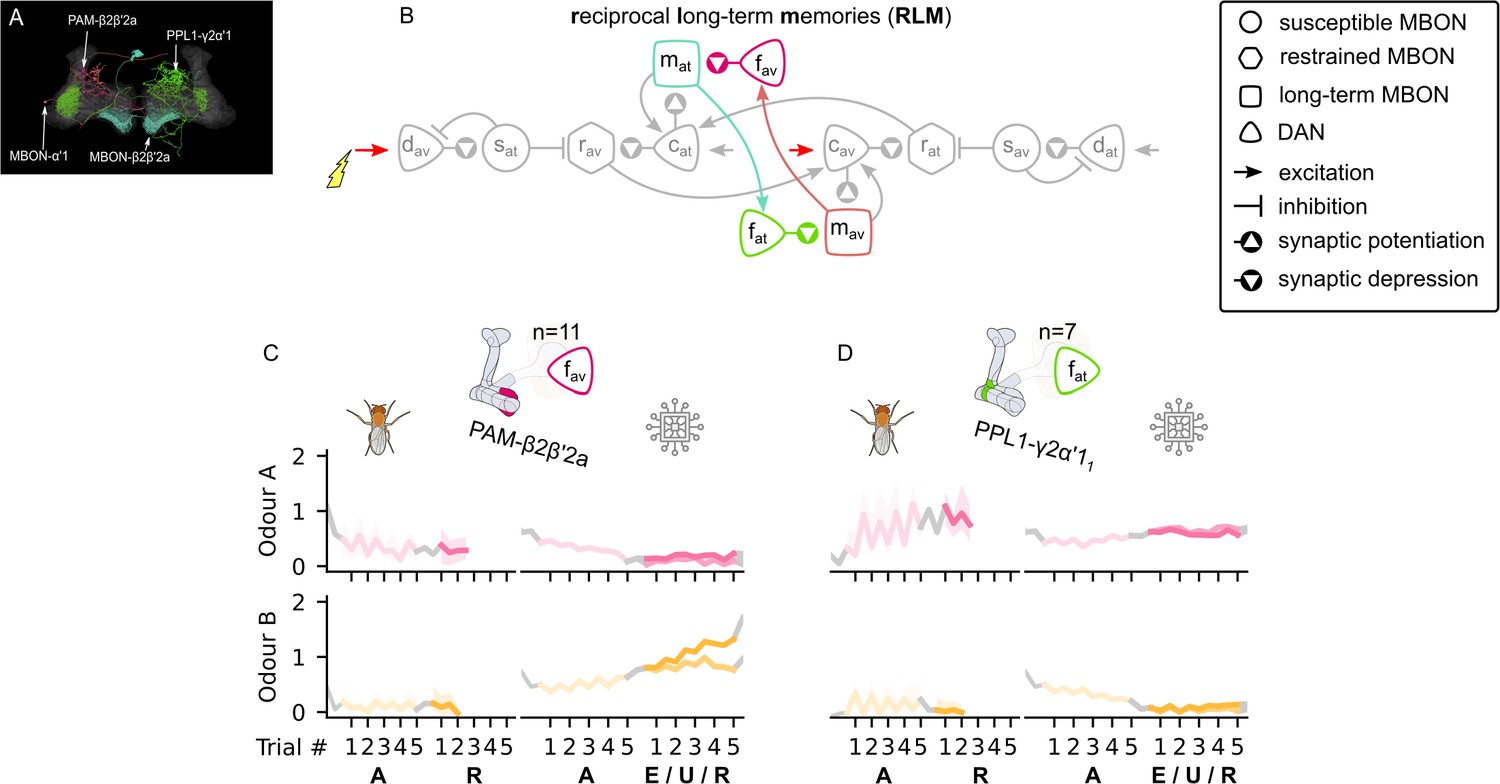
The reciprocal long-term memories microcircuit of the mushroom body.
(A) Image of the reciprocal long-term memory microcircuit in the mushroom body made of the MBON-α′1, PAM-β2β′2a, MBON-β2β′2a, and PPL1-γ2α′1 – created using the Virtual Fly Brain software (Milyaev et al., 2012). (B) Schematic representation of the reciprocal long-term memories microcircuit (coloured). The responses of (C) the punishment-encoding forgetting dopaminergic neuron (DAN), , the (D) reward-encoding forgetting DAN, , generated by experimental data (left) and the model (right) during the olfactory conditioning paradigms of Figure 4D. Lightest shades denote the extinction, mid shades the unpaired, and dark shades the reversal phase. For each trial, we report two consecutive time-steps: the off-shock (i.e., odour only) followed by the on-shock (i.e., paired odour and shock) when available (i.e., odour B in acquisition and odour A in reversal phase); otherwise, a second off-shock time-step (i.e., all the other phases).
Figure 8—figure supplement 1
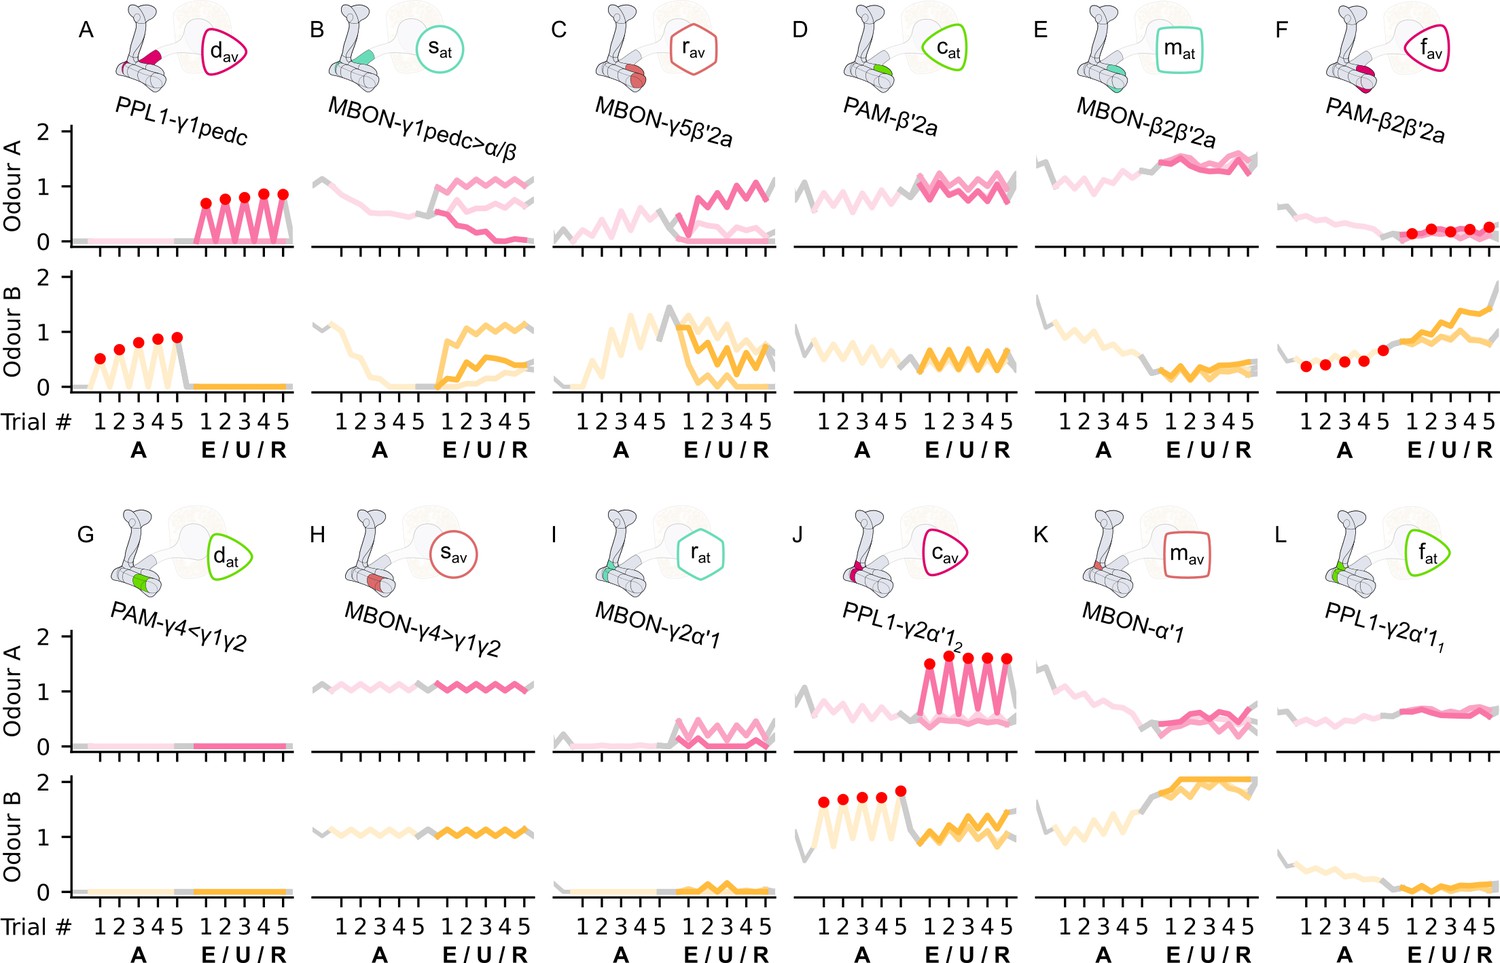
The responses of the neurons of the incentive circuit using the connections introduced so far of the susceptible memory (SM), restrained memory (RM), reciprocal short-term memory (RSM), long-term memory (LTM), and reciprocal long-term memory (RLM) microcircuits.
The responses of (A) the punishment-encoding discharging dopaminergic neuron (DAN), , (B) the attraction-driving susceptible mushroom body output neuron (MBON), , (C) the avoidance-driving restrained MBON, , (D) the reward-encoding charging DAN, , (E) the attraction-driving LTM MBON, , (F) the avoidance-driving forgetting DAN, , (G) the reward-encoding discharging DAN, , (H) the avoidance-driving susceptible MBON, , (I) the attraction-driving restrained MBON, , (J) the punishment-encoding charging DAN, , (K) the avoidance-driving LTM MBON, , and (L) the attraction-driving forgetting DAN, , generated by experimental data (left) and the model (right) during the olfactory conditioning paradigms of Figure 4D. Lightest shades denote the extinction, mid shades the unpaired, and dark shades the reversal phase. The first row of responses (coloured pink) corresponds to responses associated with odour A, and the second (coloured yellow) to those associated with odour B. For each trial, we report two consecutive time-steps: the off-shock (i.e., odour only) followed by the on-shock (i.e., paired odour and shock) when available (i.e., odour B in acquisition and odour A in reversal phase); otherwise, a second off-shock time-step (i.e., all the other phases).
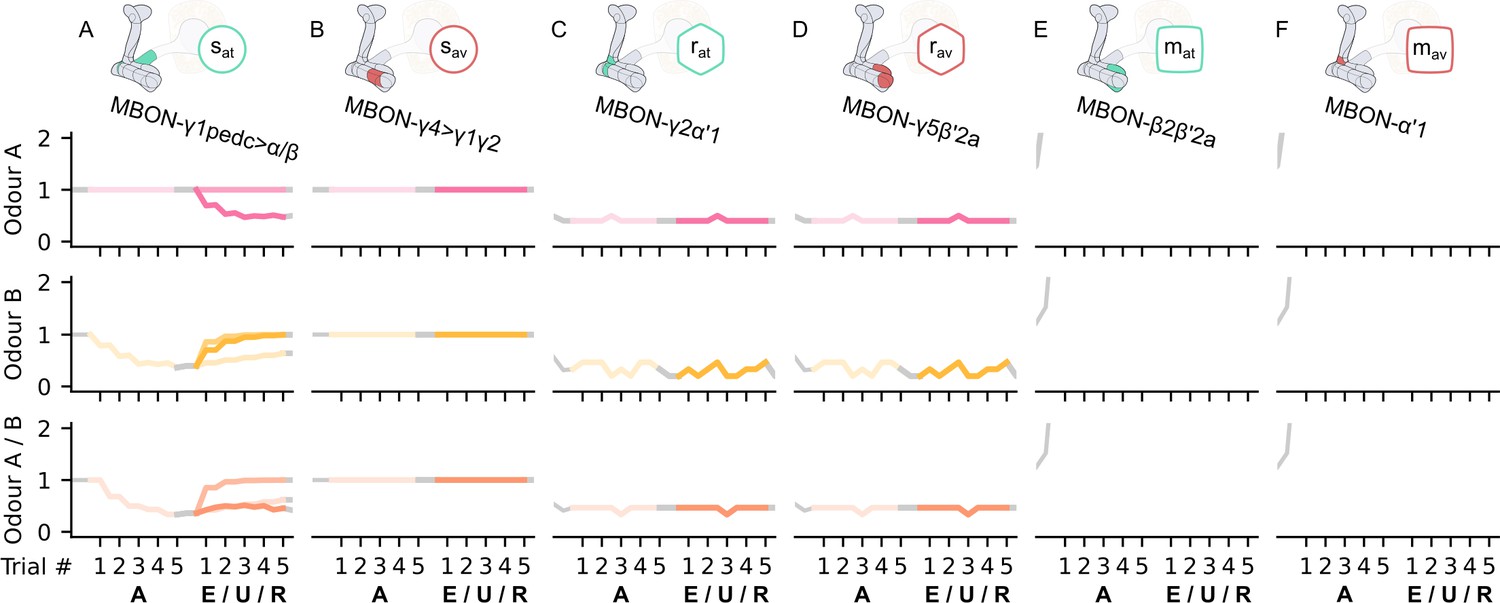
Figure 8—figure supplement 2
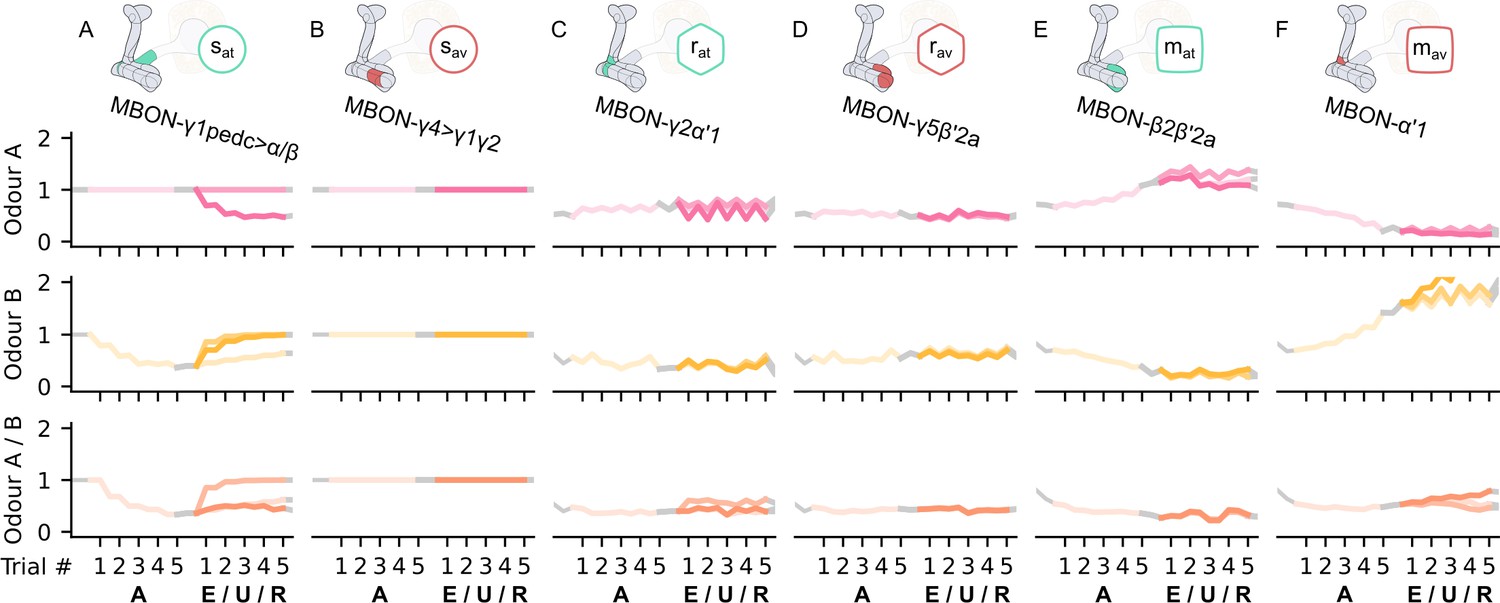
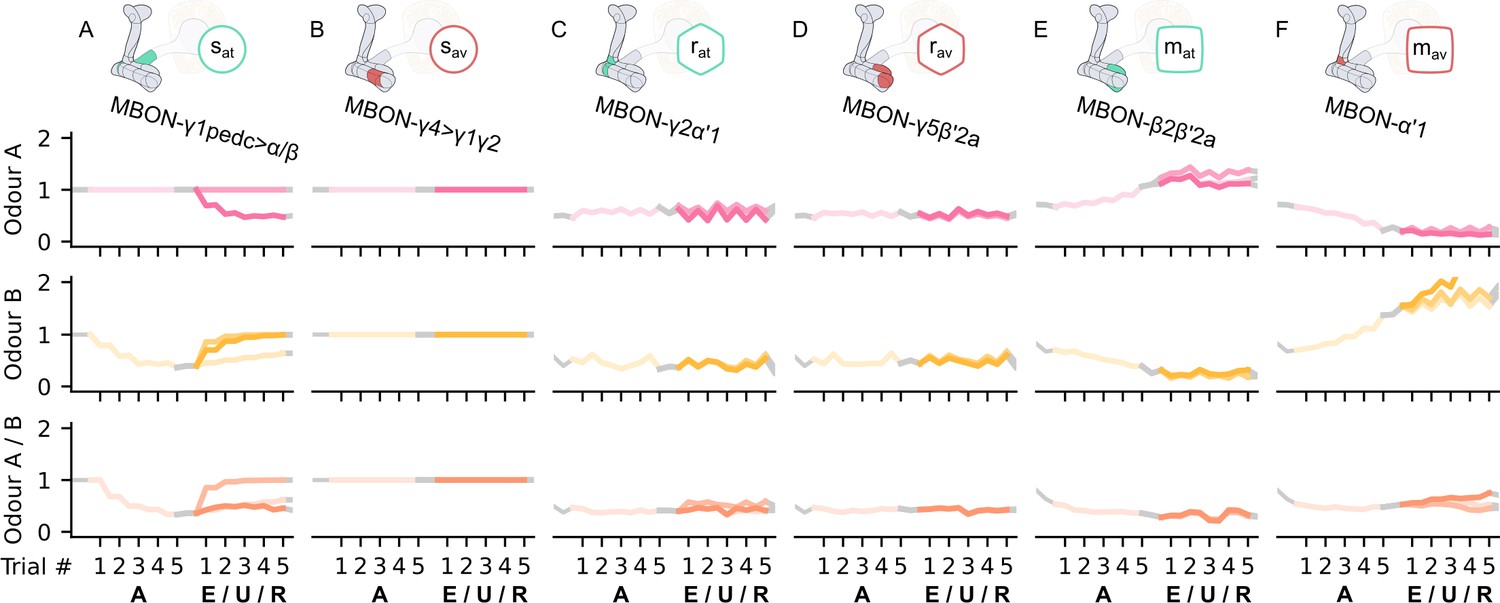
The KC→MBON synaptic weights of the neurons of the incentive circuit using the connections introduced so far of the susceptible memory (SM), restrained memory (RM), reciprocal short-term memory (RSM), long-term memory (LTM), and reciprocal long-term memory (RLM) microcircuits.
The synaptic weights of (A) the attraction-driving susceptible mushroom body output neuron (MBON), sat, (B) the avoidance-driving susceptible MBON, sav, (C) the attraction-driving restrained MBON, rat, (D) the avoidance-driving restrained MBON, sav, (E) the attraction-driving LTM MBON, mat, and (F) the avoidance-driving LTM MBON, mav, generated by experimental data (left) and the model (right) during the olfactory conditioning paradigms of Figure 4D. Lightest shades denote the extinction, mid shades the unpaired, and dark shades the reversal phase. The first row of weights (coloured pink) corresponds to Kenyon cells (KCs) associated with odour A, the second (coloured yellow) to KCs associated with odour B, and the third (coloured orange) to KCs associated with both odours. For each trial, we report two consecutive time-steps: the off-shock (i.e., odour only) followed by the on-shock (i.e., paired odour and shock) when available (i.e., odour B in acquisition and odour A in reversal phase); otherwise, a second off-shock time-step (i.e., all the other phases).
Figure 9 with 3 supplements

The memory assimilation mechanism (MAM) microcircuit of the mushroom body.
(A) Image of the avoidance-specific MAM microcircuit in the mushroom body made of the MBON-γ5β′2a, PPL1-γ2α′1, MBON-α′1, and PAM-β2β′2a – created using the Virtual Fly Brain software (Milyaev et al., 2012). (B) Image of the attraction-specific MAM microcircuit in the mushroom body made of the MBON-γ2α’1, PAM-β’2a, MBON-β2β′2a, and PPL1-γ2α’1 – created using the Virtual Fly Brain software (Milyaev et al., 2012). (B) Schematic representation of the MAM microcircuits (coloured). The forgetting dopaminergic neurons (DANs) connect to the restrained mushroom body output neurons (MBONs) of the same valence, hence increasing long-term memory (LTM) strength reduces (assimilates) the restrained memory, constituting the MAM microcircuits.
Figure 9—figure supplement 1
The KC→MBON synaptic weights of the neurons of the incentive circuit using all its connections.
The synaptic weights of (A) the attraction-driving susceptible mushroom body output neuron (MBON), , (B) the avoidance-driving susceptible MBON, , (C) the attraction-driving restrained MBON, , (D) the avoidance-driving restrained MBON, , (E) the attraction-driving long-term memory MBON, , and (F) the avoidance-driving long-term memory MBON, , generated by experimental data (left) and the model (right) during the olfactory conditioning paradigms of Figure 4D. Lightest shades denote the extinction, mid shades the unpaired, and dark shades the reversal phase. The first row of weights (coloured pink) corresponds to Kenyon cells (KCs) associated with odour A, the second (coloured yellow) to KCs associated with odour B, and the third (coloured orange) to KCs associated with both odours.
Figure 9—figure supplement 2
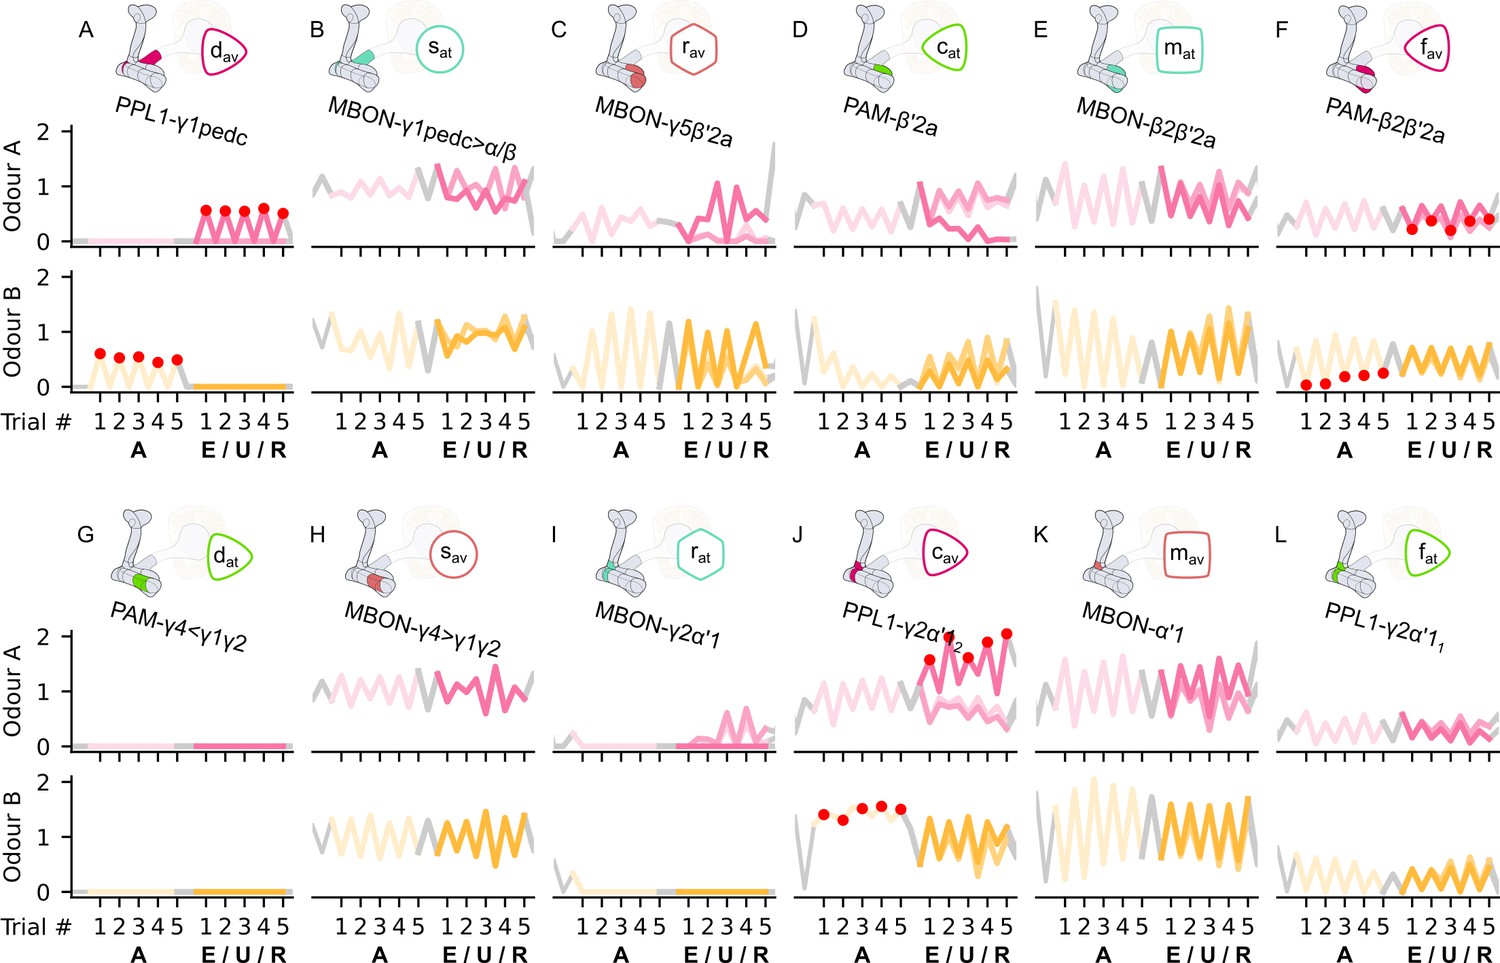
The reconstructed responses of the neurons of the incentive circuit using the reward prediction error (RPE) learning rule.
The reconstructed responses of (A) the punishment-encoding discharging dopaminergic neuron (DAN), , (B) the attraction-driving susceptible MBON, , (C) the avoidance-driving restrained mushroom body output neuron (MBON), , (D) the reward-encoding charging DAN, , (E) the attraction-driving long-term memory MBON, , (F) the punishment-encoding forgetting DAN, , (G) the reward-encoding discharging DAN, , (H) the avoidance-driving susceptible MBON, , (I) the attraction-driving restrained MBON, , (J) the punishment-encoding charging DAN, , (K) the avoidance-driving long-term memory MBON, , and (L) the reward-encoding forgetting DAN, , generated by experimental data (left) and the model (right) during the olfactory conditioning paradigms of Figure 4D. Lightest shades denote the extinction, mid shades the unpaired, and dark shades the reversal phase.
Figure 9—figure supplement 3
The KC→MBON synaptic weights of the neurons of the incentive circuit using the reward prediction error (RPE) learning rule.
The synaptic weights of (A) the attraction-driving susceptible mushroom body output neuron (MBON), , (B) the avoidance-driving susceptible MBON, , (C) the attraction-driving restrained MBON, , (D) the avoidance-driving restrained MBON, , (E) the attraction-driving long-term memory MBON, , and (F) the avoidance-driving long-term memory MBON, , generated by experimental data (left) and the model (right) during the olfactory conditioning paradigms of Figure 4D. Lightest shades denote the extinction, mid shades the unpaired, and dark shades the reversal phase. The first row of weights (coloured pink) corresponds to Kenyon cells (KCs) associated with odour A, the second (coloured yellow) to KCs associated with odour B, and the third (coloured orange) to KCs associated with both odours.
Figure 10
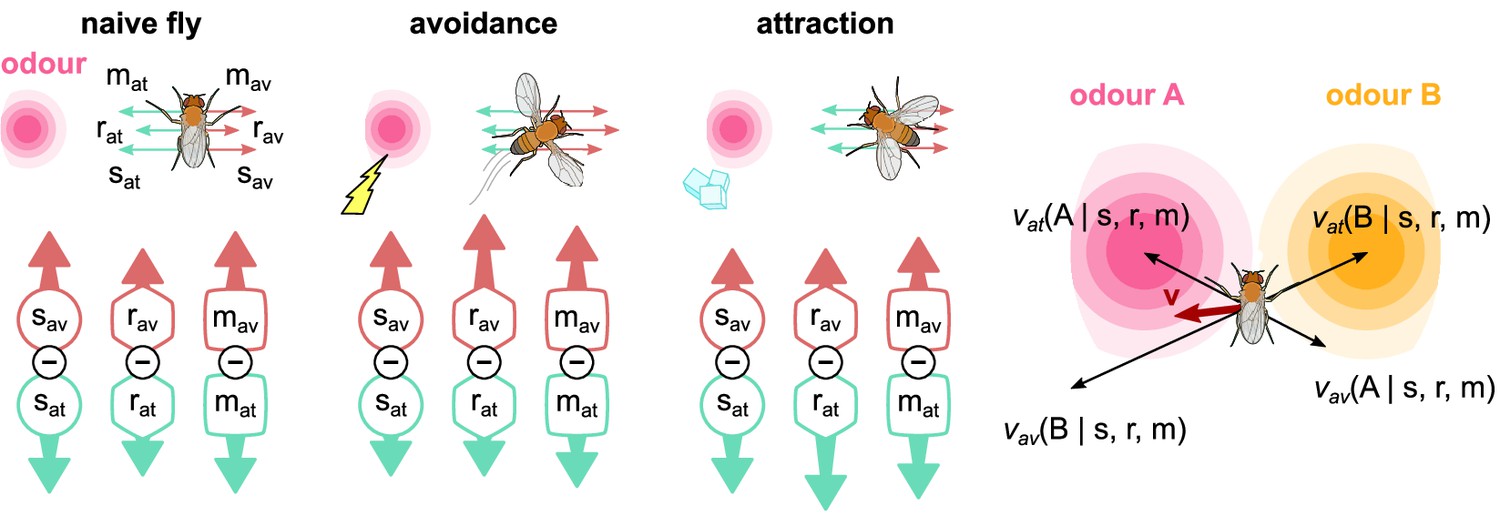
The activity of the six mushroom body output neurons (MBONs) is translated into forces that drive a simulated fly towards or away from odour sources.
For naive flies, the forces are balanced. When electric shock is paired with an odour, the balance changes towards the avoidance-driving MBONs, which drives the fly directly away from that odour. When sugar is paired with an odour, the balance changes to attraction, driving the fly towards that odour. Combining all attractive and repulsive forces for each odour source currently experienced by the fly produces an overall driving force, , which determines the fly’s behaviour.
Figure 11 with 7 supplements
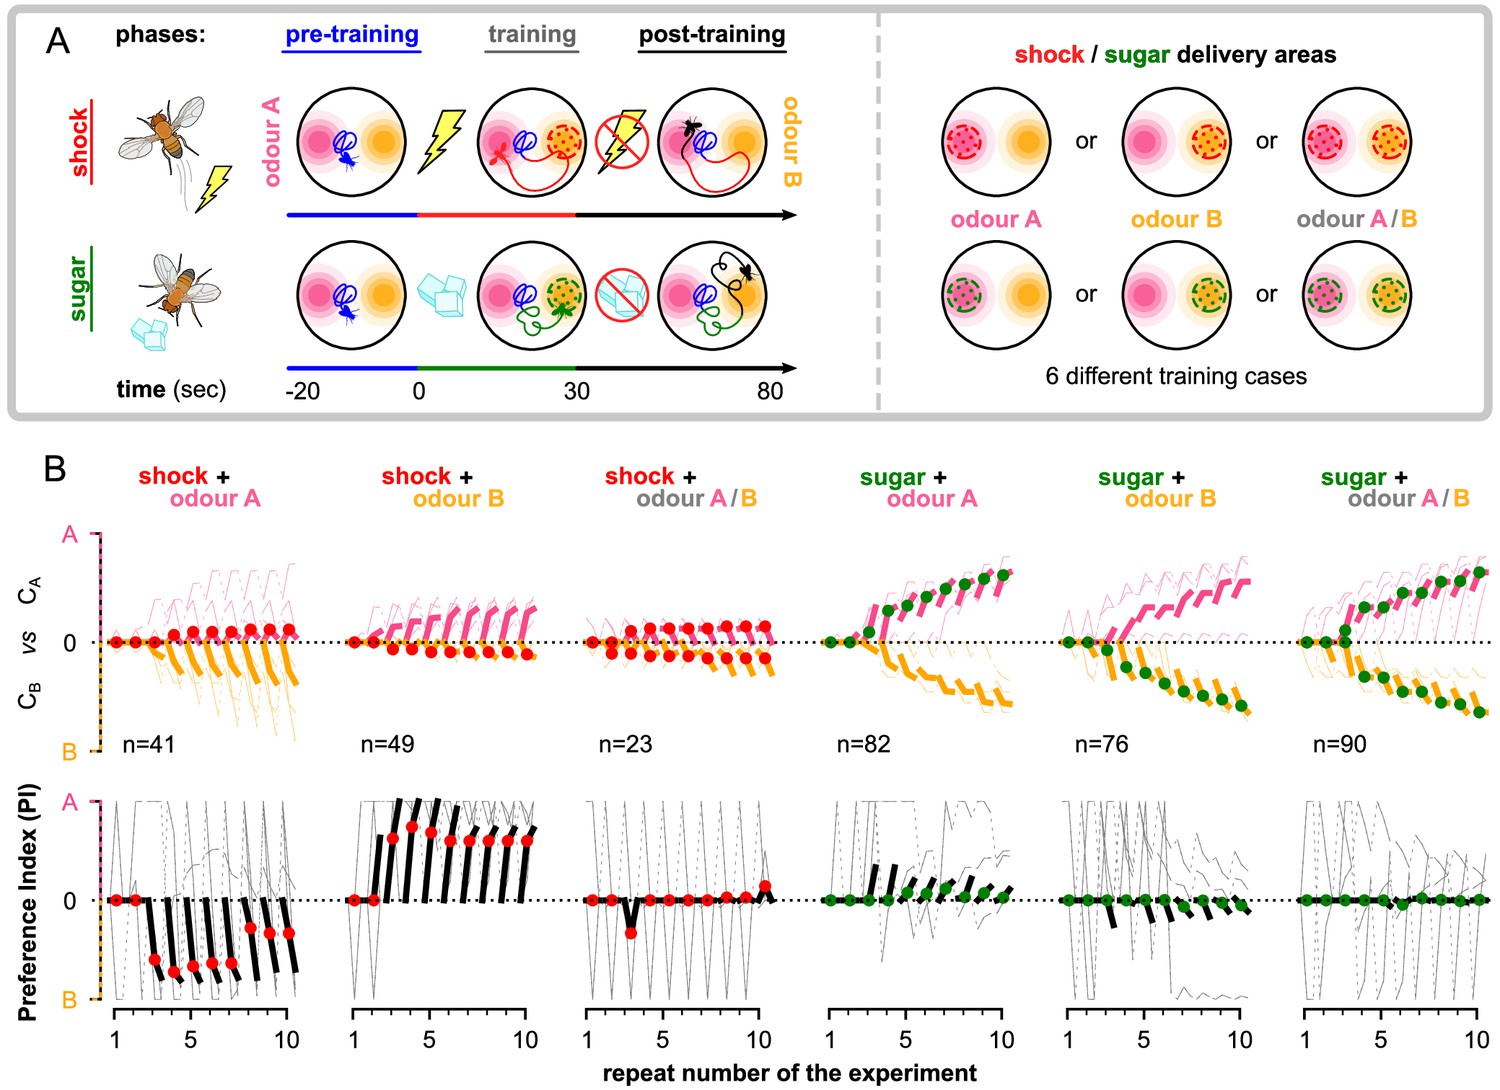
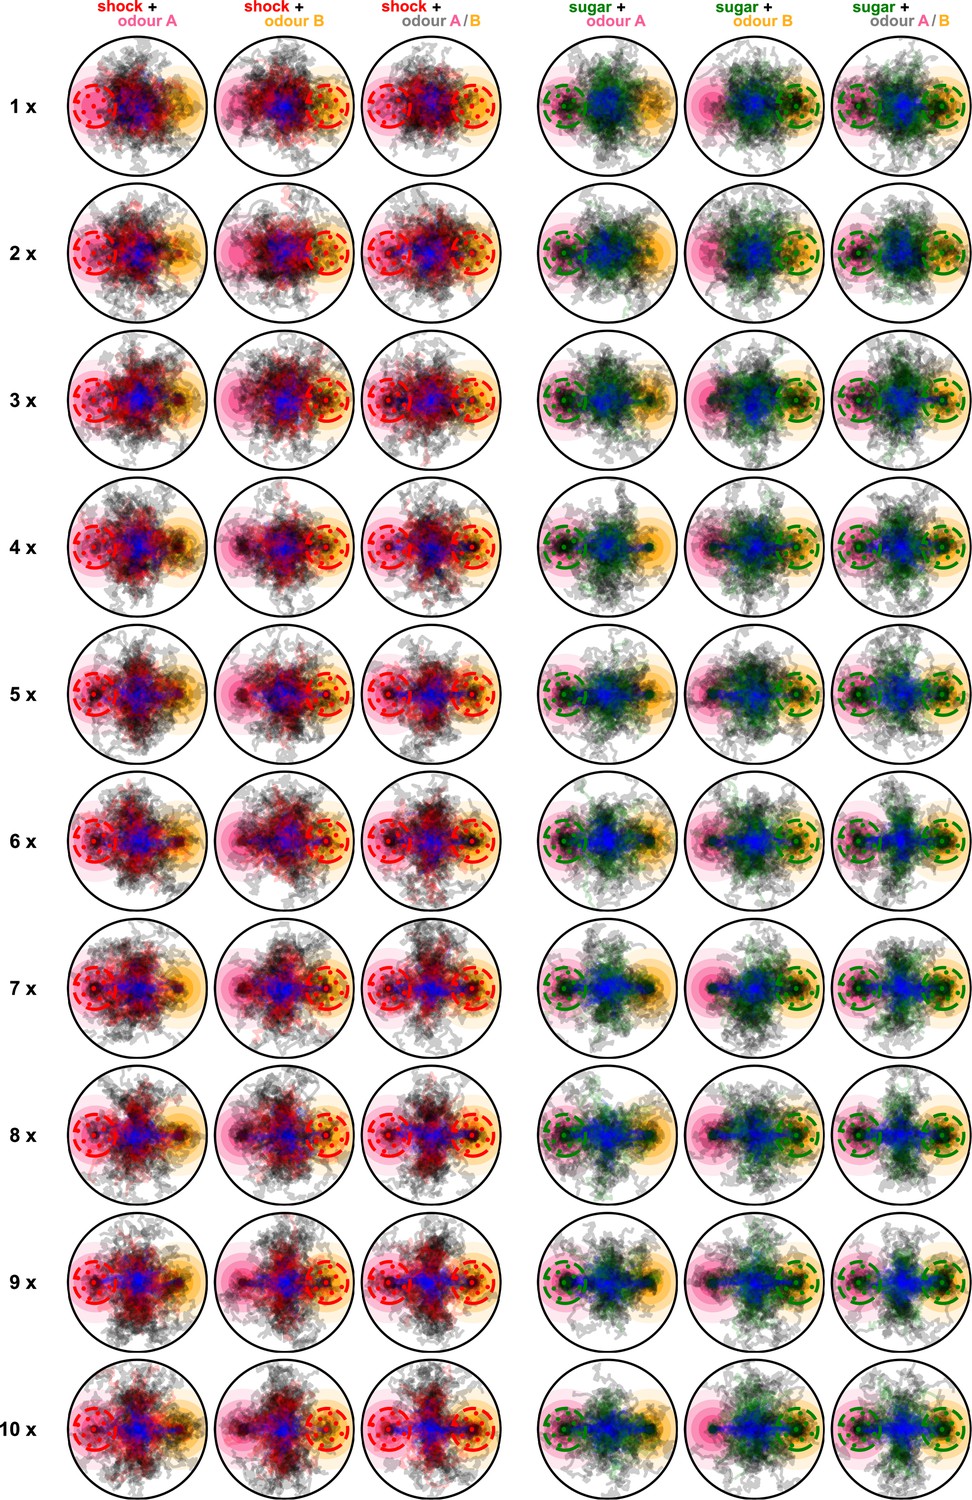
The behaviour of the animal controlled by its neurons during the freely moving flies simulation.
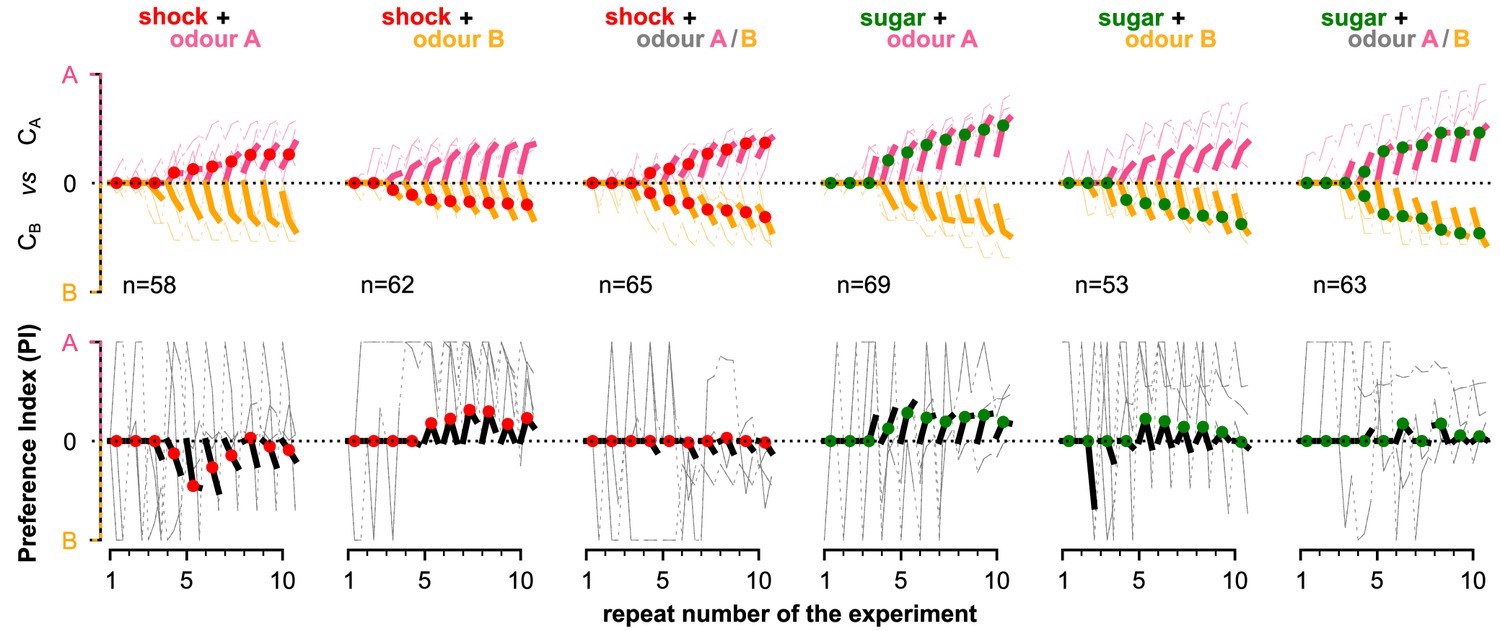
The simulated flies are exposed to a mixture of two odours, whose relative intensity depends on the position of the simulated flies in space. (A) Each experiment lasts for where: the flies are placed at the centre of the arena in time-step . During the first (pre-training phase, ), the flies explore the arena without any reinforcement (blue tracks). In the next (training phase, ), they conditionally receive reinforcement under one of the six training cases shown on the right: using sugar (green) or shock (red); and reinforcing around odour A (shock + odour A), odour B (shock + odour B), or both odours (shock + odour A/B). During the last (post-training phase ), they continue being exposed to the odours without receiving a reinforcement (black tracks). We repeat this experiment (including all its phases) 10 times in order to show the effects of the long-term memory in the behaviour. (B) Behavioural summary of a subset of simulated flies that visited both odours at any time during the 10 repeats. Columns show the different conditions and the population that was recorded visiting both odours. Top row: the normalised cumulative time spent exposed in odour A (pink lines) or odour B (yellow lines; note that this line is reversed). For each repeat, we present three values (average over all the pre-training, training, and post-training time-steps, respectively) where the values associated with the training phase are marked with red or green dots when punishment or reward has been delivered to that odour, respectively. Thin lines show three representative samples of individual flies. Thick lines show the median over the simulated flies that visited both odours. Bottom row: the preference index (PI) to each odour extracted by the above cumulative times.
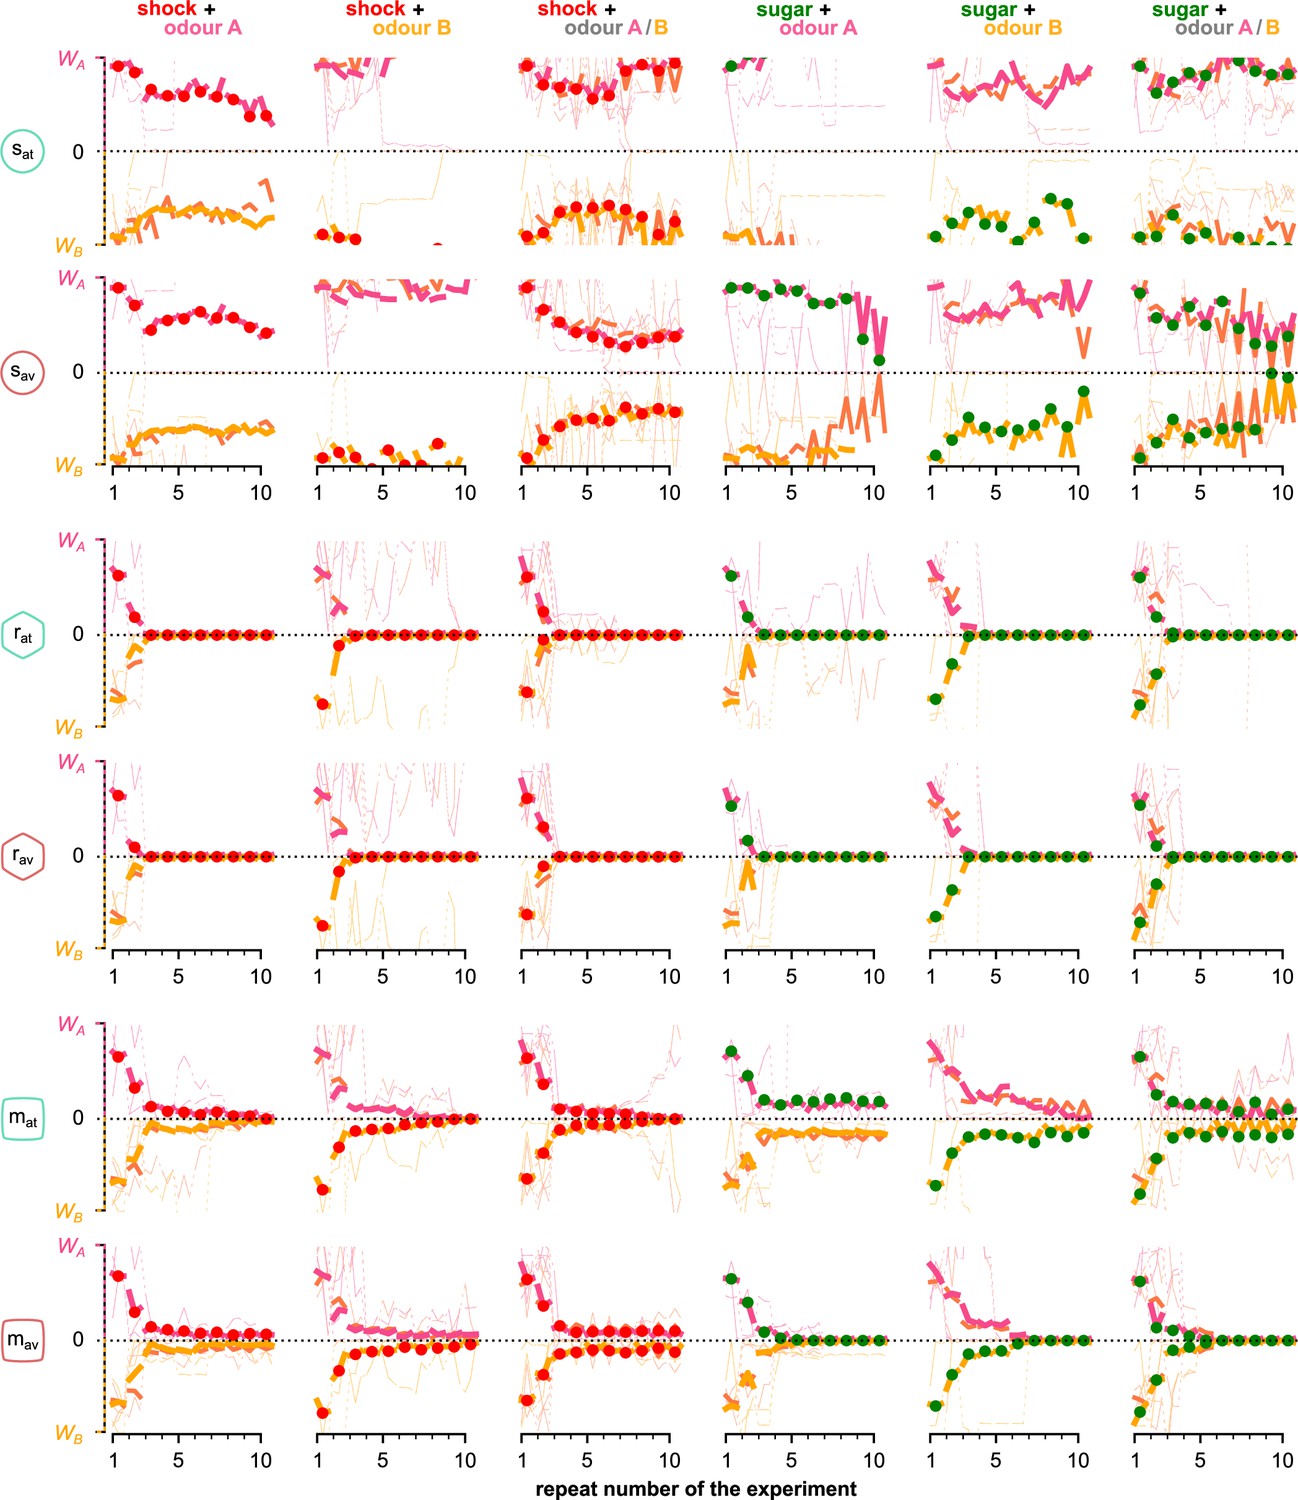
Figure 11—figure supplement 1
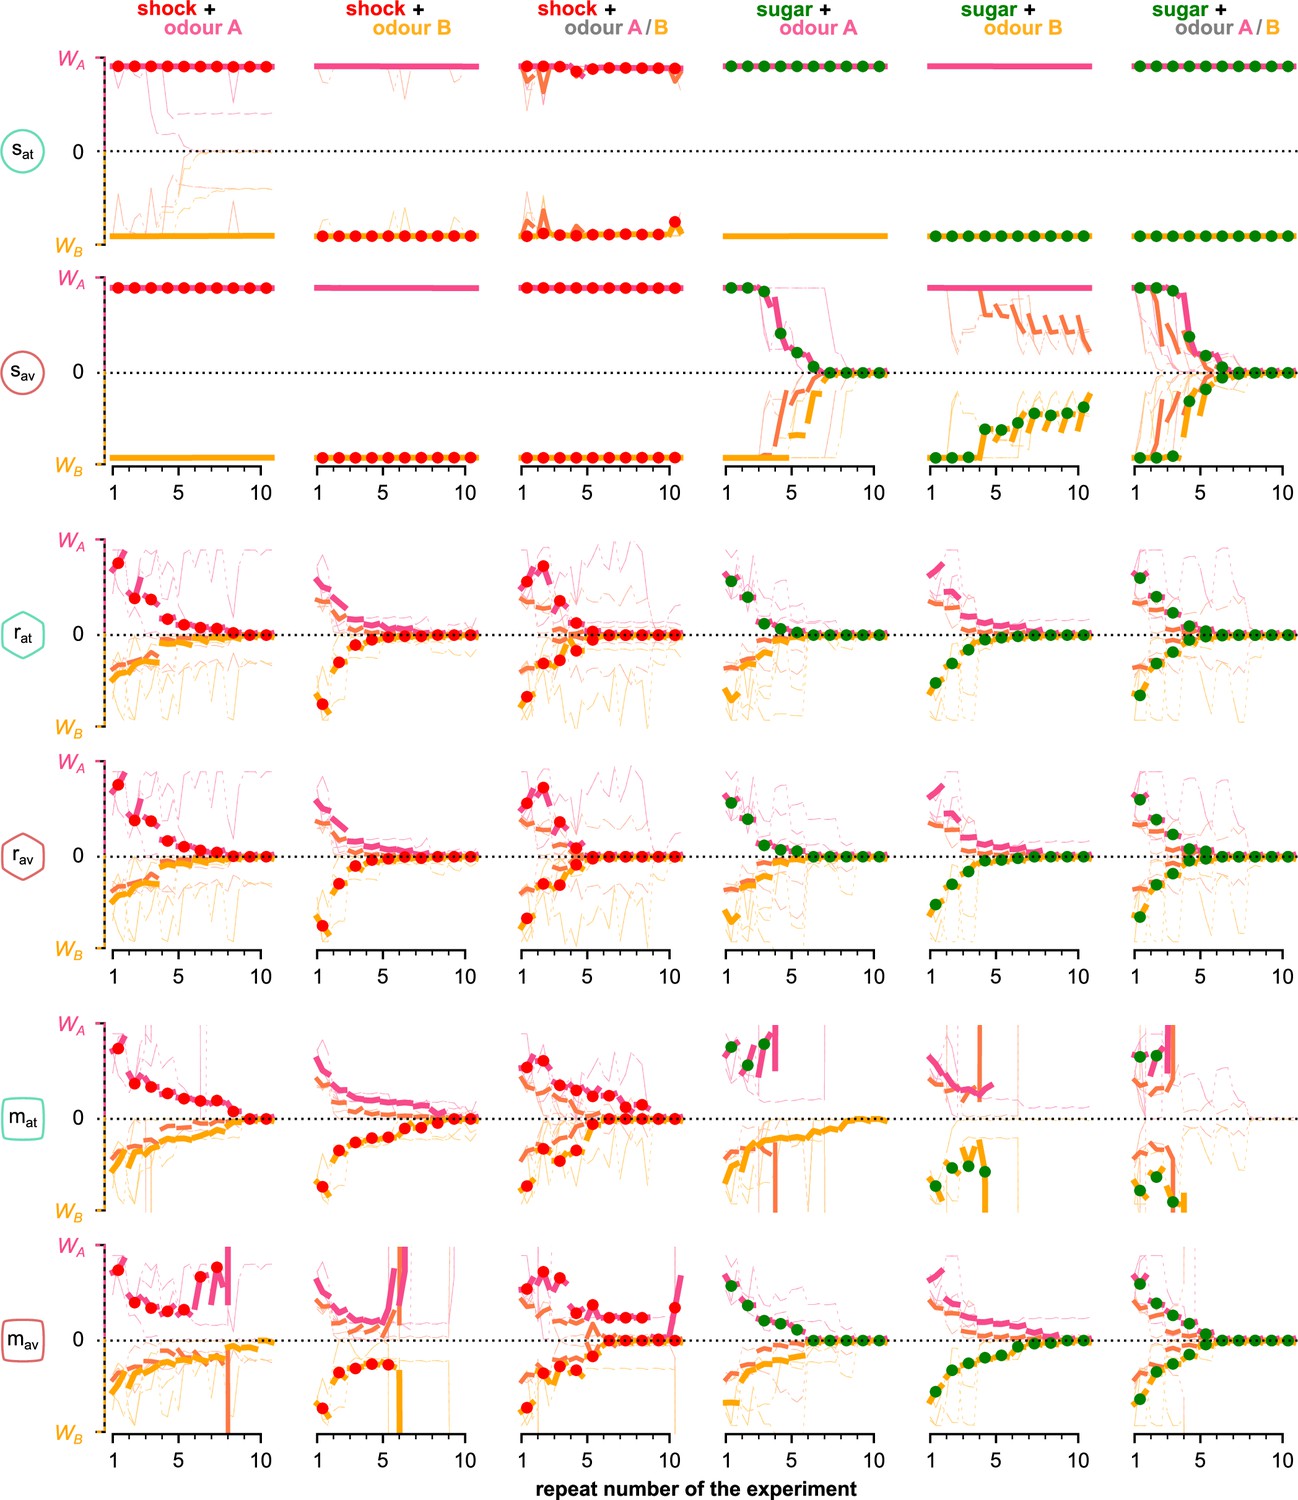
The mean KC→MBON synaptic weights over the simulated flies that visited both odours and for each neuron, phase, and repeat of the experiment.
Different rows correspond to KC→MBON weights associated with a different type of MBON, from top to bottom: attraction- and avoidance-driving susceptible, restrained and long-term memory MBONs. Pink and yellow lines show synaptic weights associated with odours A and B, respectively, dashed lines show weights associated with both odours. Thin lines show three representative examples of synaptic weights in single simulated flies. Thick lines show the median of the synaptic weight over all the simulated flies that visited both odours. KC: Kenyon cells; MBON: mushroom body output neuron.
Figure 11—figure supplement 2
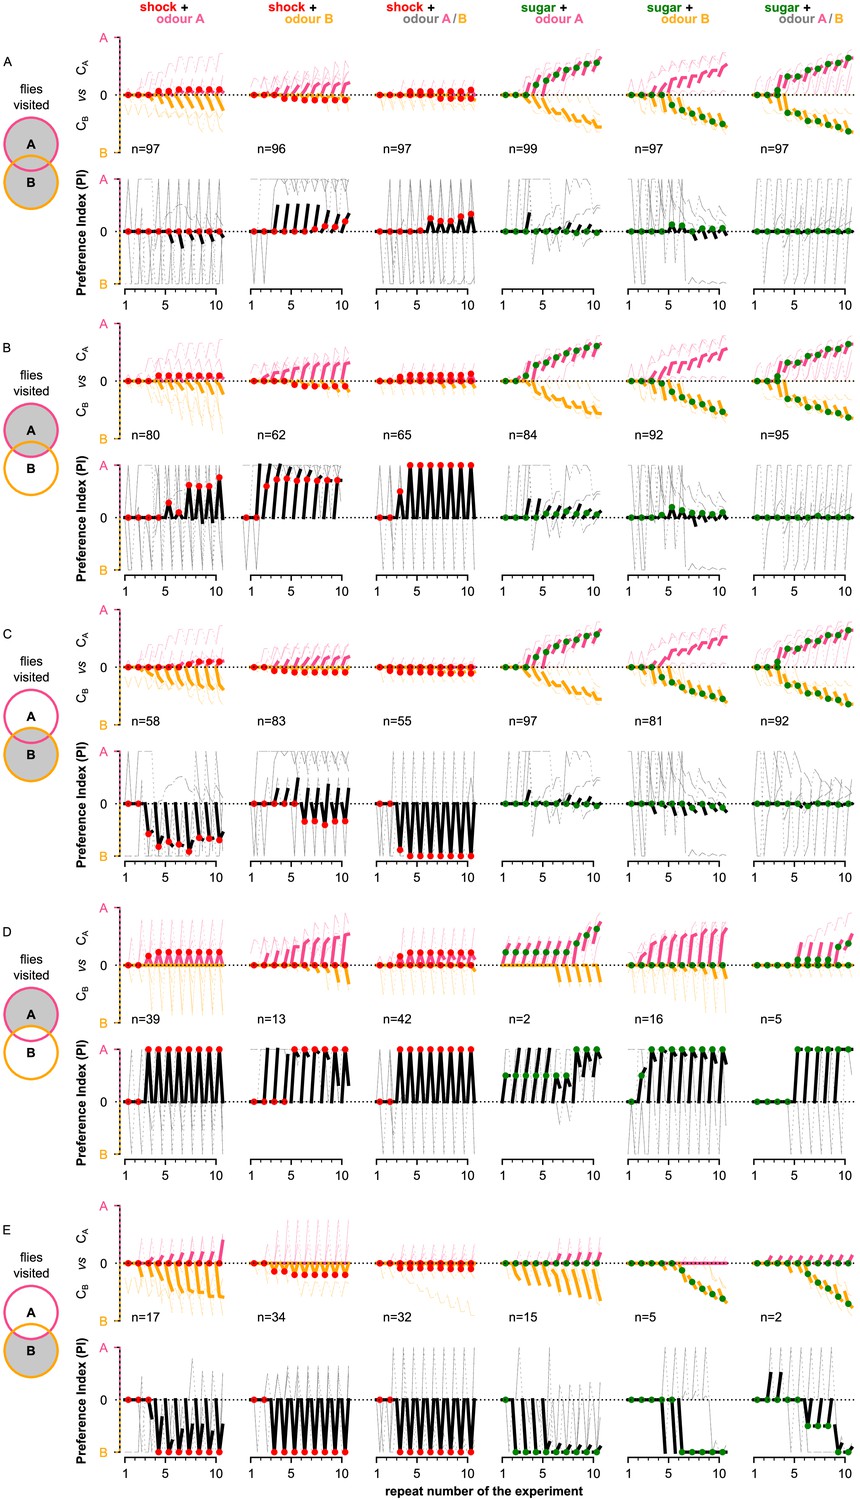
Behavioural summary of simulated flies grouped by the areas that they visited.
(A) At least one of the two odours, (B) odour A, (C) odour B, (D) only odour A, and (E) only odour B. In each panel, columns show the different conditions and the population for each group. Top row: the normalised cumulative time spent exposed in odour A (pink lines) or odour B (yellow lines; note that this line is reversed). For each repeat, we present three values (average over all the pre-training, training, and post-training time-steps, respectively) where the values associated with the training phase are marked with red or green dots when punishment or reward has been delivered to that odour, respectively. Thin lines show three representative samples of individual flies. Thick lines show the median over the simulated flies that visited both odours. Bottom row: the preference index (PI) to each odour extracted by the above cumulative times.
Figure 11—figure supplement 3
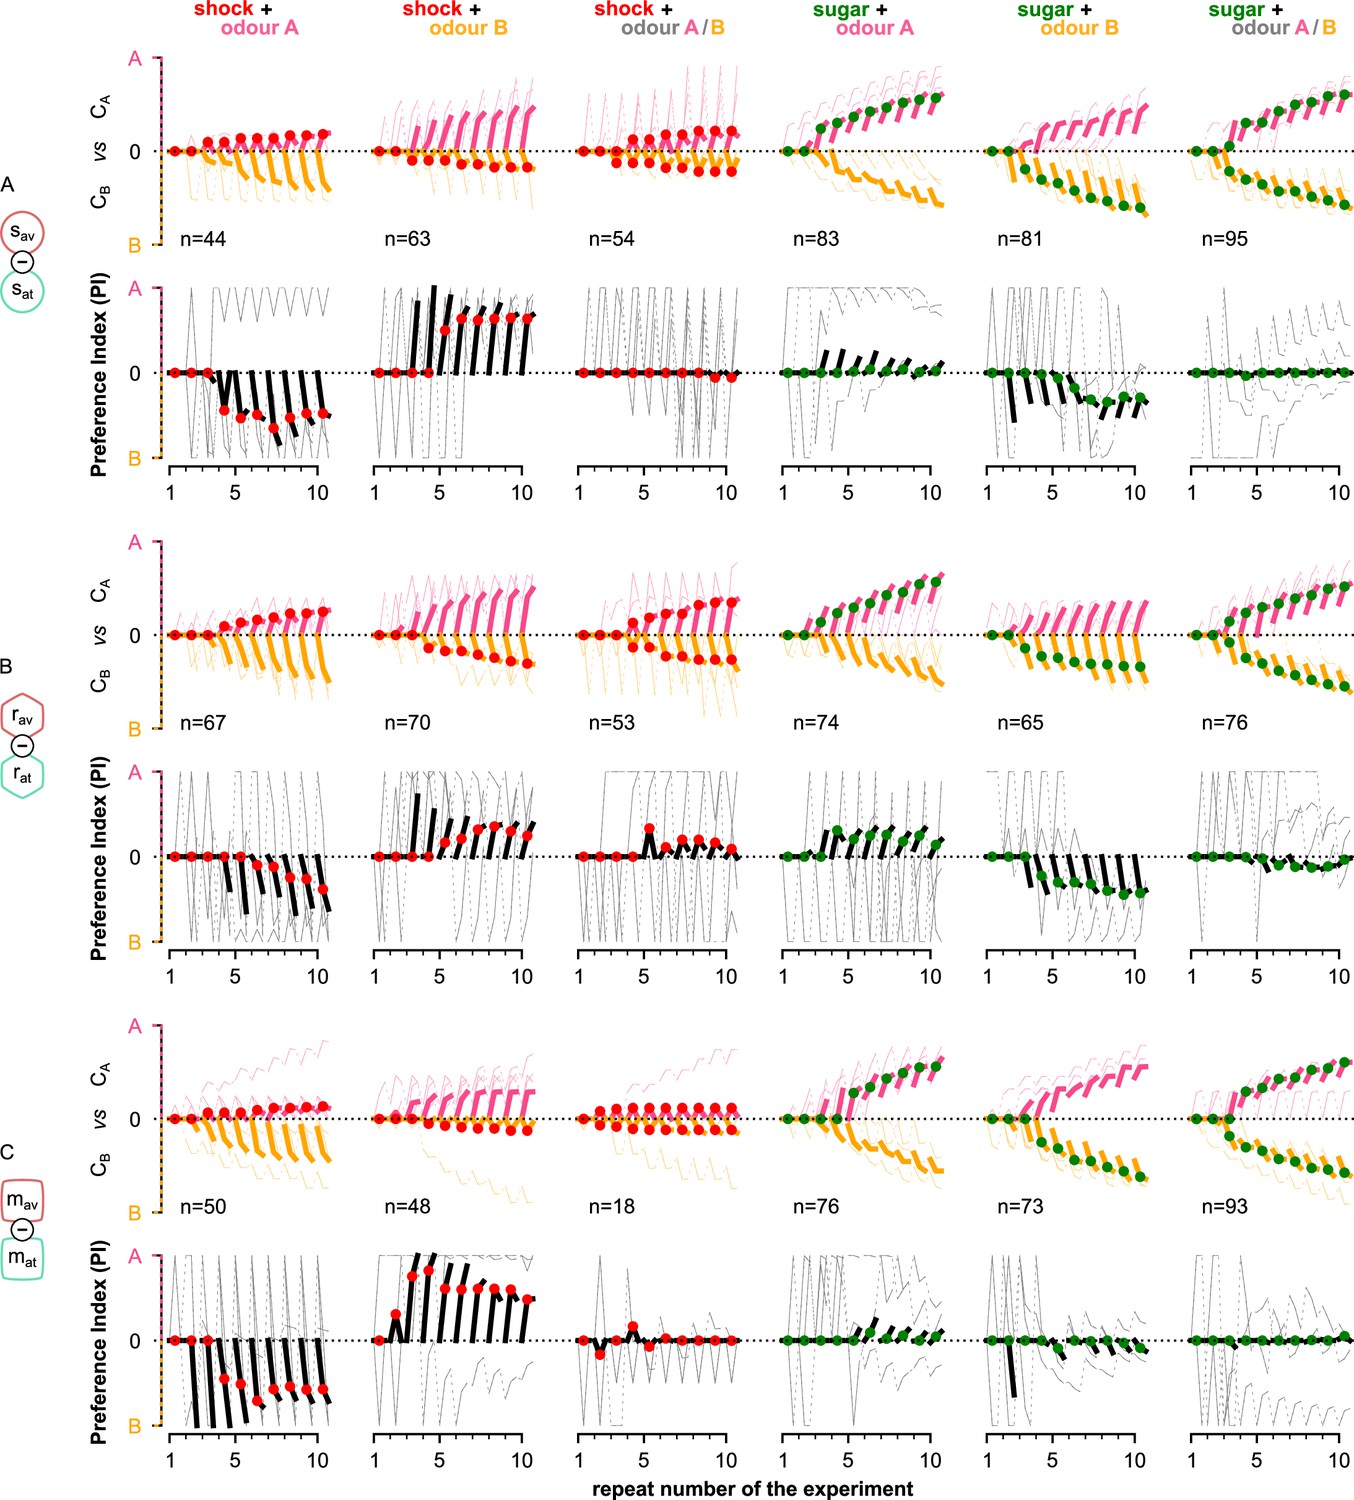
Behavioural summary of simulated flies when controlled by the different types of mushroom body output neurons (MBONs).
Behavioural summary of simulated flies when controlled by (A) the susceptible, (B) restrained, or (C) long-term memory (LTM) MBONs separately. In each panel, columns show the different conditions and the population for each group. Top row: the normalised cumulative time spent exposed in odour A (pink lines) or odour B (yellow lines; note that this line is reversed). For each repeat, we present three values (average over all the pre-training, training, and post-training time-steps, respectively) where the values associated with the training phase are marked with red or green dots when punishment or reward has been delivered to that odour, respectively. Thin lines show three representative samples of individual flies. Thick lines show the median over the simulated flies that visited both odours. Bottom row: the preference index (PI) to each odour extracted by the above cumulative times.
Figure 11—figure supplement 4
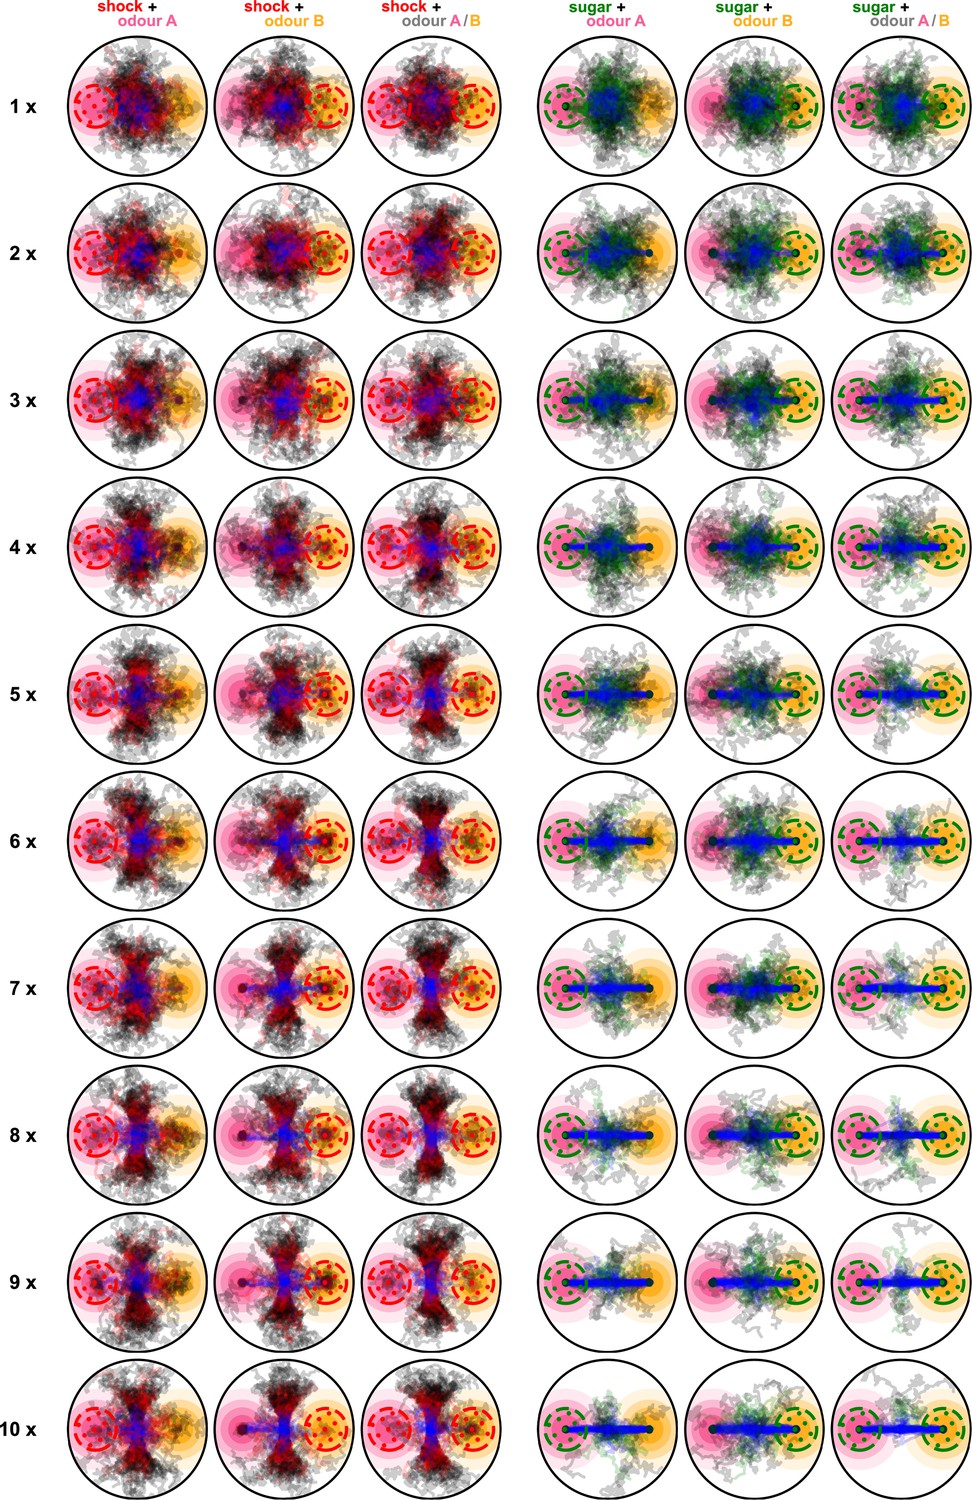
Paths of 100 simulated flies when using the dopaminergic plasticity rule and during all 10 repeats of the experiment.
Blue segments show the paths of the flies during the pre-training, red and green segments show the paths during the training phase for punishment and reward conditions, respectively, and black segments show the paths during the post-training phase. Rows are for the different repeats and columns for the different conditions.
Figure 11—figure supplement 5
Behavioural summary of a subset of simulated flies that visited both odours at any time during the 10 repeats, and the plasticity rule of their neurons was replaced by the reward prediction error plasticity rule.
Columns show the different conditions and the population that was recorded visiting both odours. Top row: the normalised cumulative time spent exposed in odour A (pink lines) or odour B (yellow lines; note that this line is reversed). For each repeat, we present three values (average over all the pre-training, training, and post-training time-steps, respectively) where the values associated with the training phase are marked with red or green dots when punishment or reward has been delivered to that odour, respectively. Thin lines show three representative samples of individual flies. Thick lines show the median over the simulated flies that visited both odours. Bottom row: the preference index (PI) to each odour extracted by the above cumulative times.
Figure 11—figure supplement 6
Paths of 100 simulated flies when using the reward prediction error (RPE) plasticity rule and during all 10 repeats of the experiment.
Blue segments show the paths of the flies during the pre-training, red and green segments show the paths during the training phase for punishment and reward conditions, respectively, and black segments show the paths during the post-training phase. Rows are for the different repeats and columns for the different conditions.
Figure 11—figure supplement 7
The mean KC→MBON synaptic weights when using the reward prediction error (RPE) plasticity rule over the simulated flies that visited both odours and for each neuron, phase, and repeat of the experiment.
Different rows correspond to KC→MBON weights associated with a different type of MBON, from top to bottom: attraction- and avoidance-driving susceptible, restrained and long-term memory MBONs. Pink and yellow lines show synaptic weights associated with odours A and B, respectively, dashed lines show weights associated with both odours. Thin lines show three representative examples of synaptic weights in single simulated flies. Thick lines show the median of the synaptic weight over all the simulated flies that visited both odours. KC: Kenyon cell; MBON: mushroom body output neuron.
Figure 12
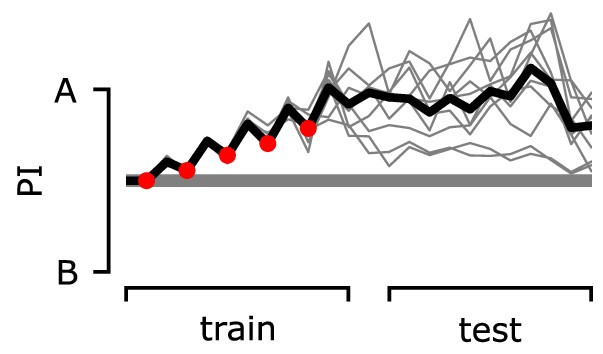
The preference index (PI) of the agent during the classic unpaired conditioning paradigm.
During the training phase, we deliver electric shock or odour A alternately. During the test phase, we deliver odours A and B alternately. The PI is calculated by using the mushroom body output neuron (MBON) responses for each odour.
Figure 13
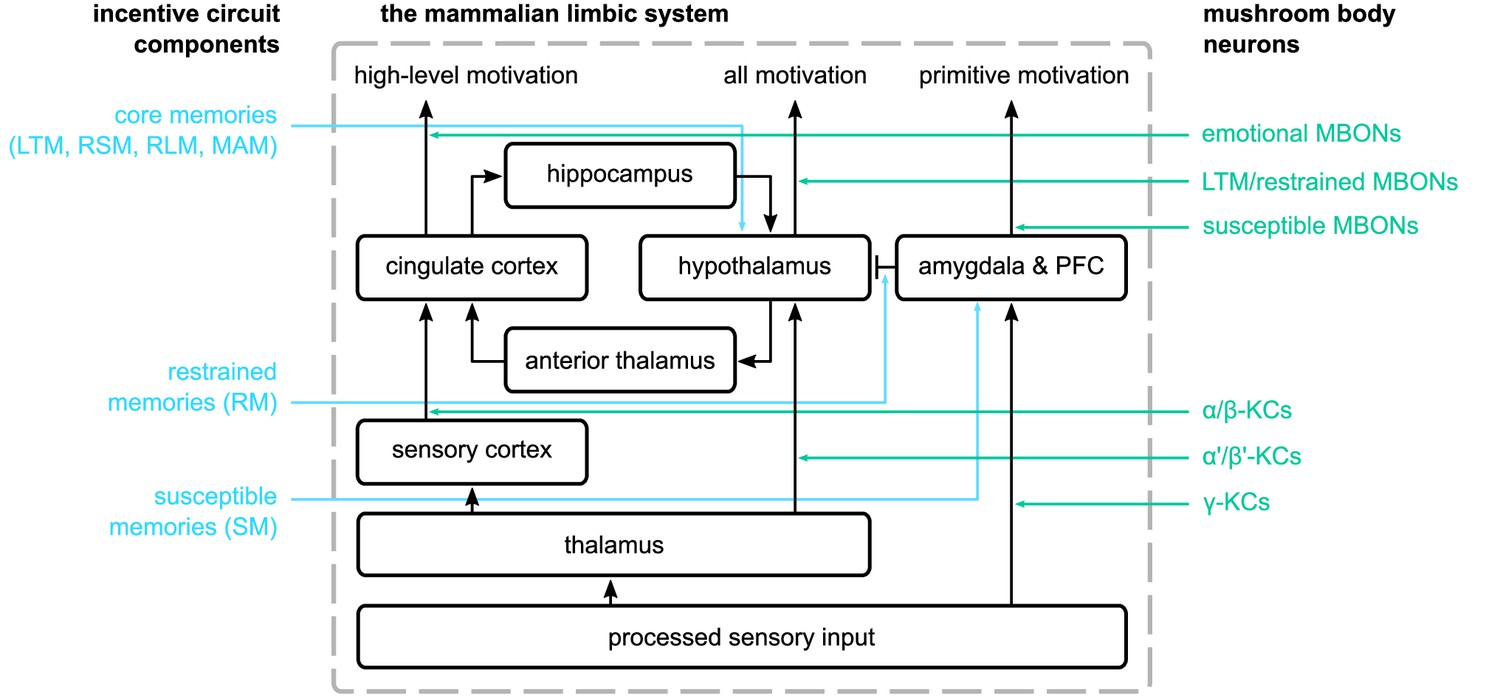
The mammalian limbic system as described by Papez, 1937 and Maclean, 1949 and the suggested parallels in the proposed incentive circuit.
On the left, we show the mushroom body microcircuits that correspond to the different structures in the mammalian limbic system. In the centre, we have the connections among the different structures of the limbic system. On the right, we show the groups of mushroom body neurons we suggest that have a similar function to the ones in the limbic system.
Figure 14 with 3 supplements

The synaptic weights and connections among the neurons of the incentive circuit (IC).
Each panel corresponds to a different synaptic weights matrix of the circuit. The size of the circles when the presynaptic axon crosses the postsynaptic dendrite shows how strong a connection is, and the colour shows the sign (blue for inhibition, red for excitation). Light-green stars show where the synaptic plasticity takes place and how the dopaminergic neurons (DANs) modulate the synaptic weights between Kenyon cells (KCs) and mushroom body output neurons (MBONs).
Figure 14—figure supplement 1
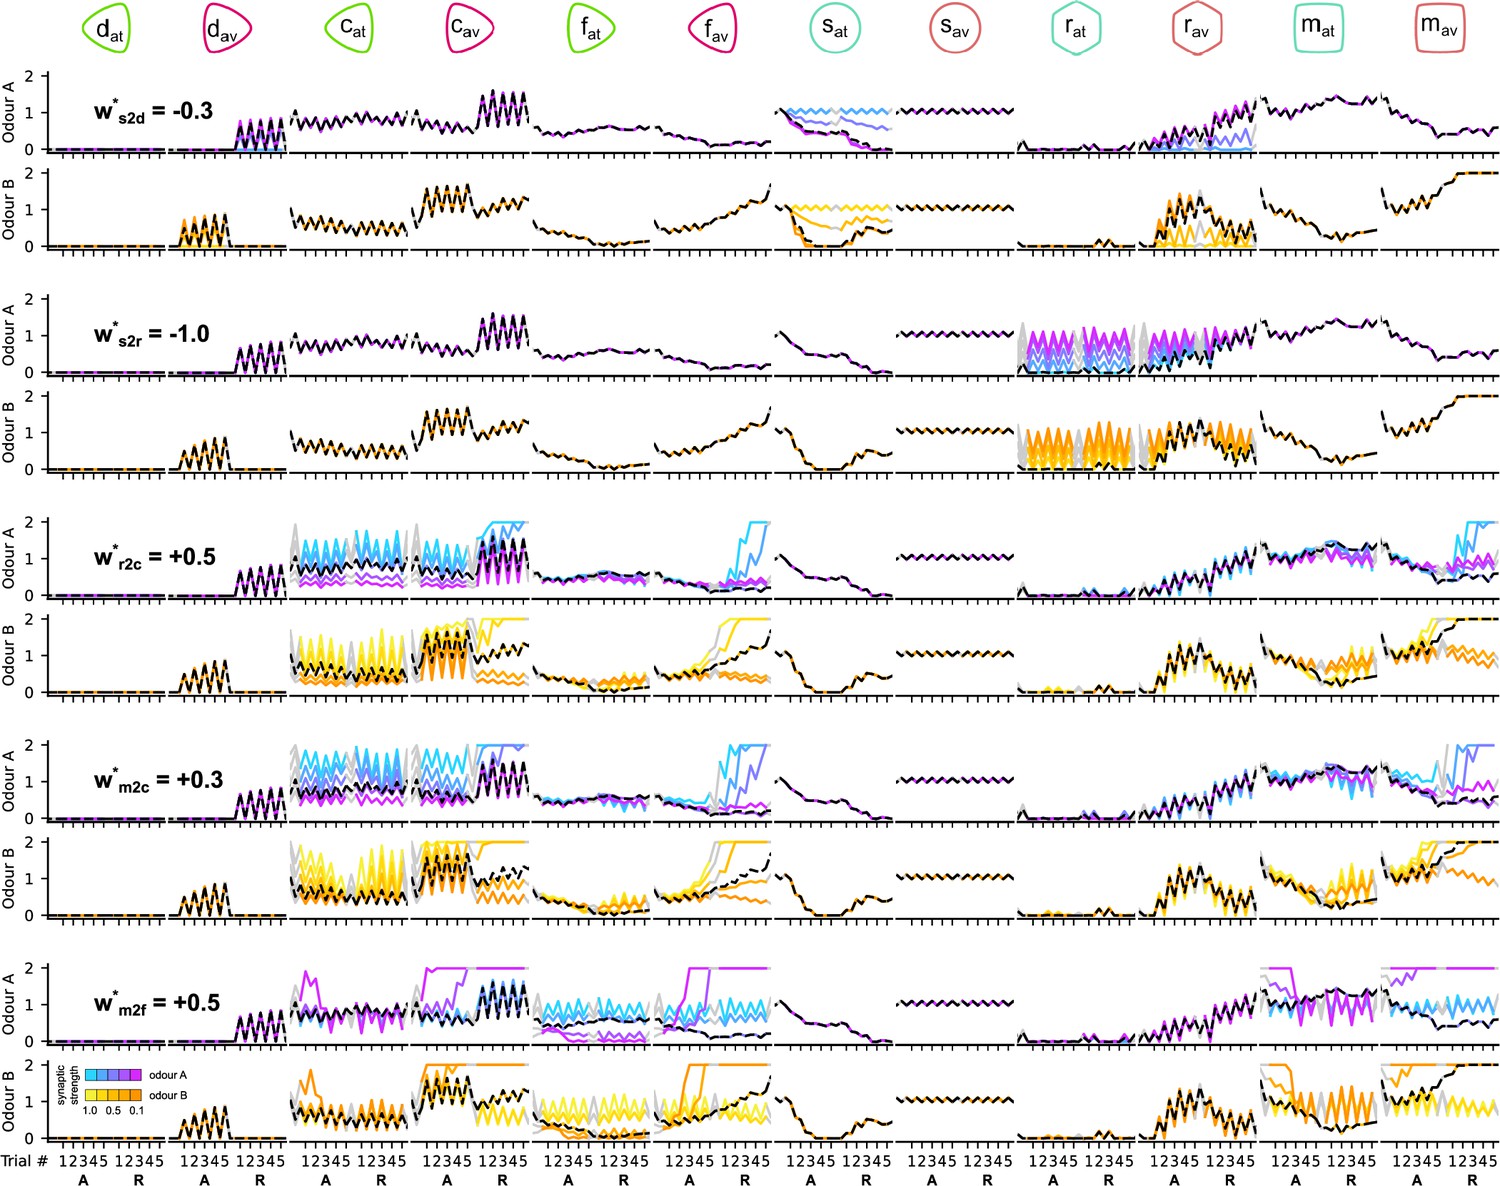
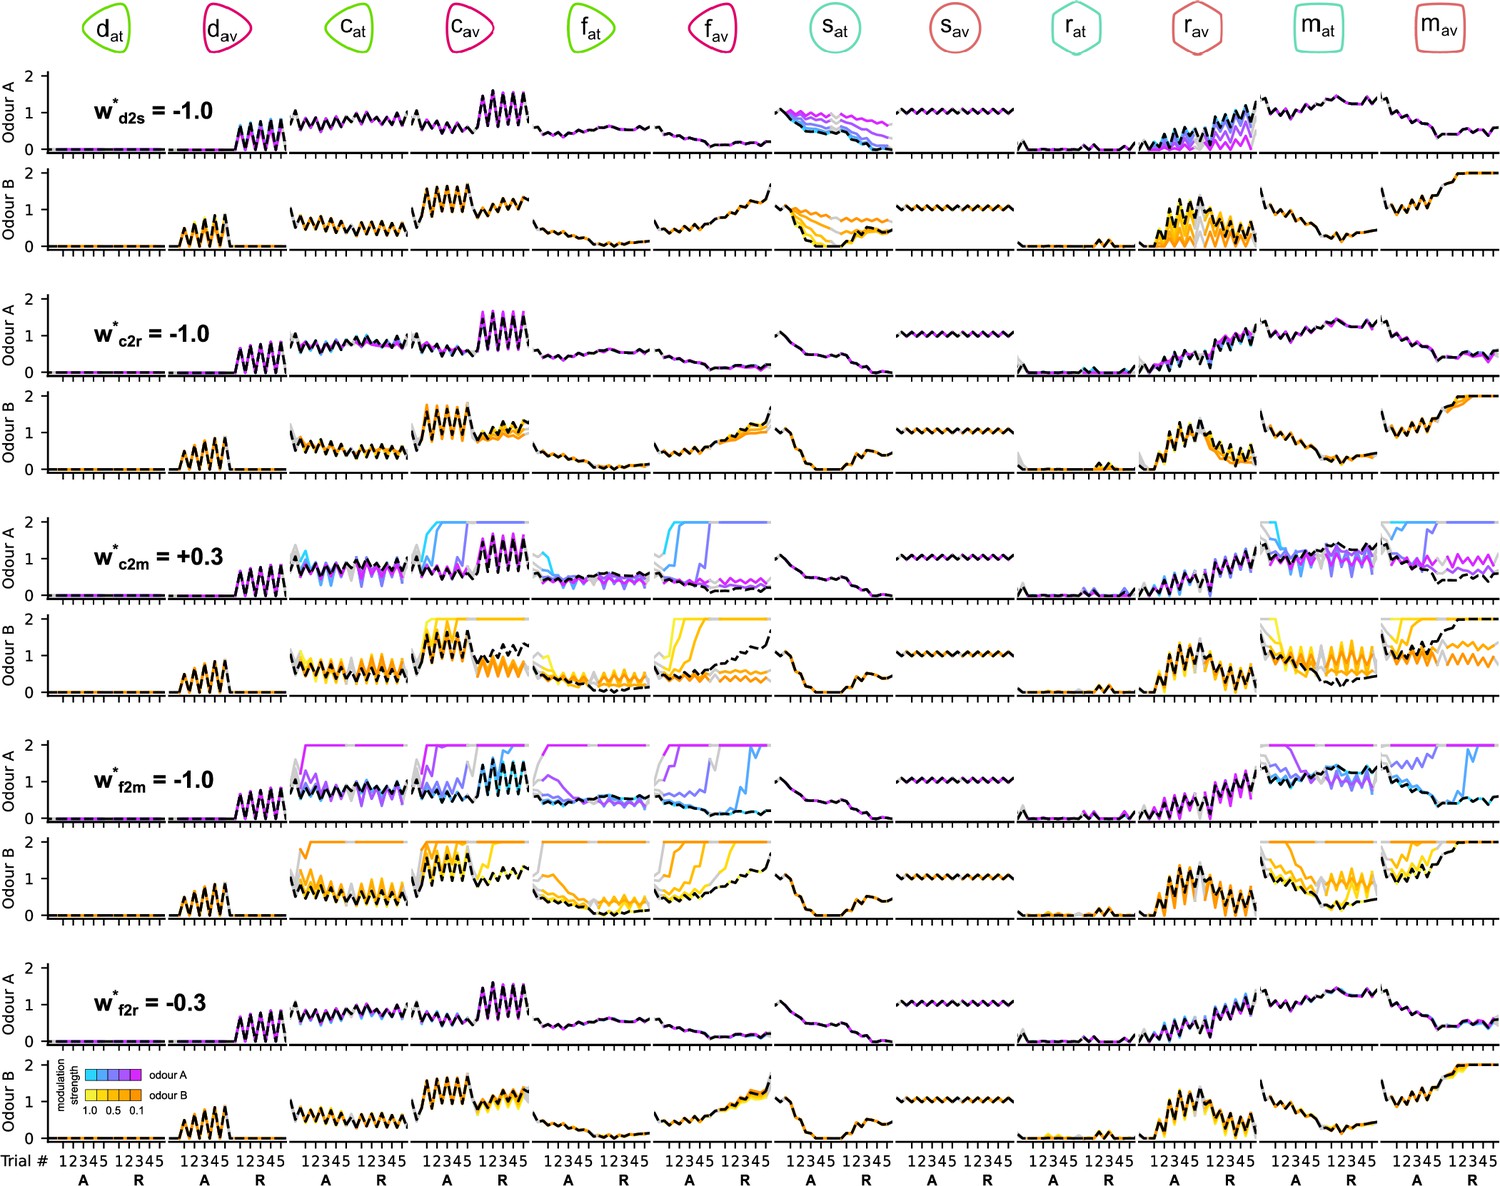
The responses of the dopaminergic neurons (DANs) and mushroom body output neuron (MBONs) of the circuit when altering the presynaptic strengths of MBONs during the reversal condition.
Each column corresponds to the responses of a different neuron. Odd and even rows show the responses of the neurons to odours A and B, respectively. Pairs of rows (consecutive odours A and B) show the responses of the neurons for the different values of the target parameter (indicated in the first column). Black dashed line shows the responses of the neurons for the chosen (*) parameter. The different colour codes show the responses of the neurons for the different (absolute) values of the target parameter as indicated in the colour bar on the bottom left.
Figure 14—figure supplement 2
The responses of the dopaminergic neurons (DANs) and mushroom body output neurons (MBONs) of the circuit when altering the DA modulation strengths during the reversal condition.
Each column corresponds to the responses of a different neuron. Odd and even rows show the responses of the neurons to odours A and B, respectively. Pairs of rows (consecutive odours A and B) show the responses of the neurons for the different values of the target parameter (indicated in the first column). Black dashed line shows the responses of the neurons for the chosen (*) parameter. The different colour codes show the responses of the neurons for the different values of the target parameter as indicated in the colour bar on the bottom left.
Figure 14—figure supplement 3
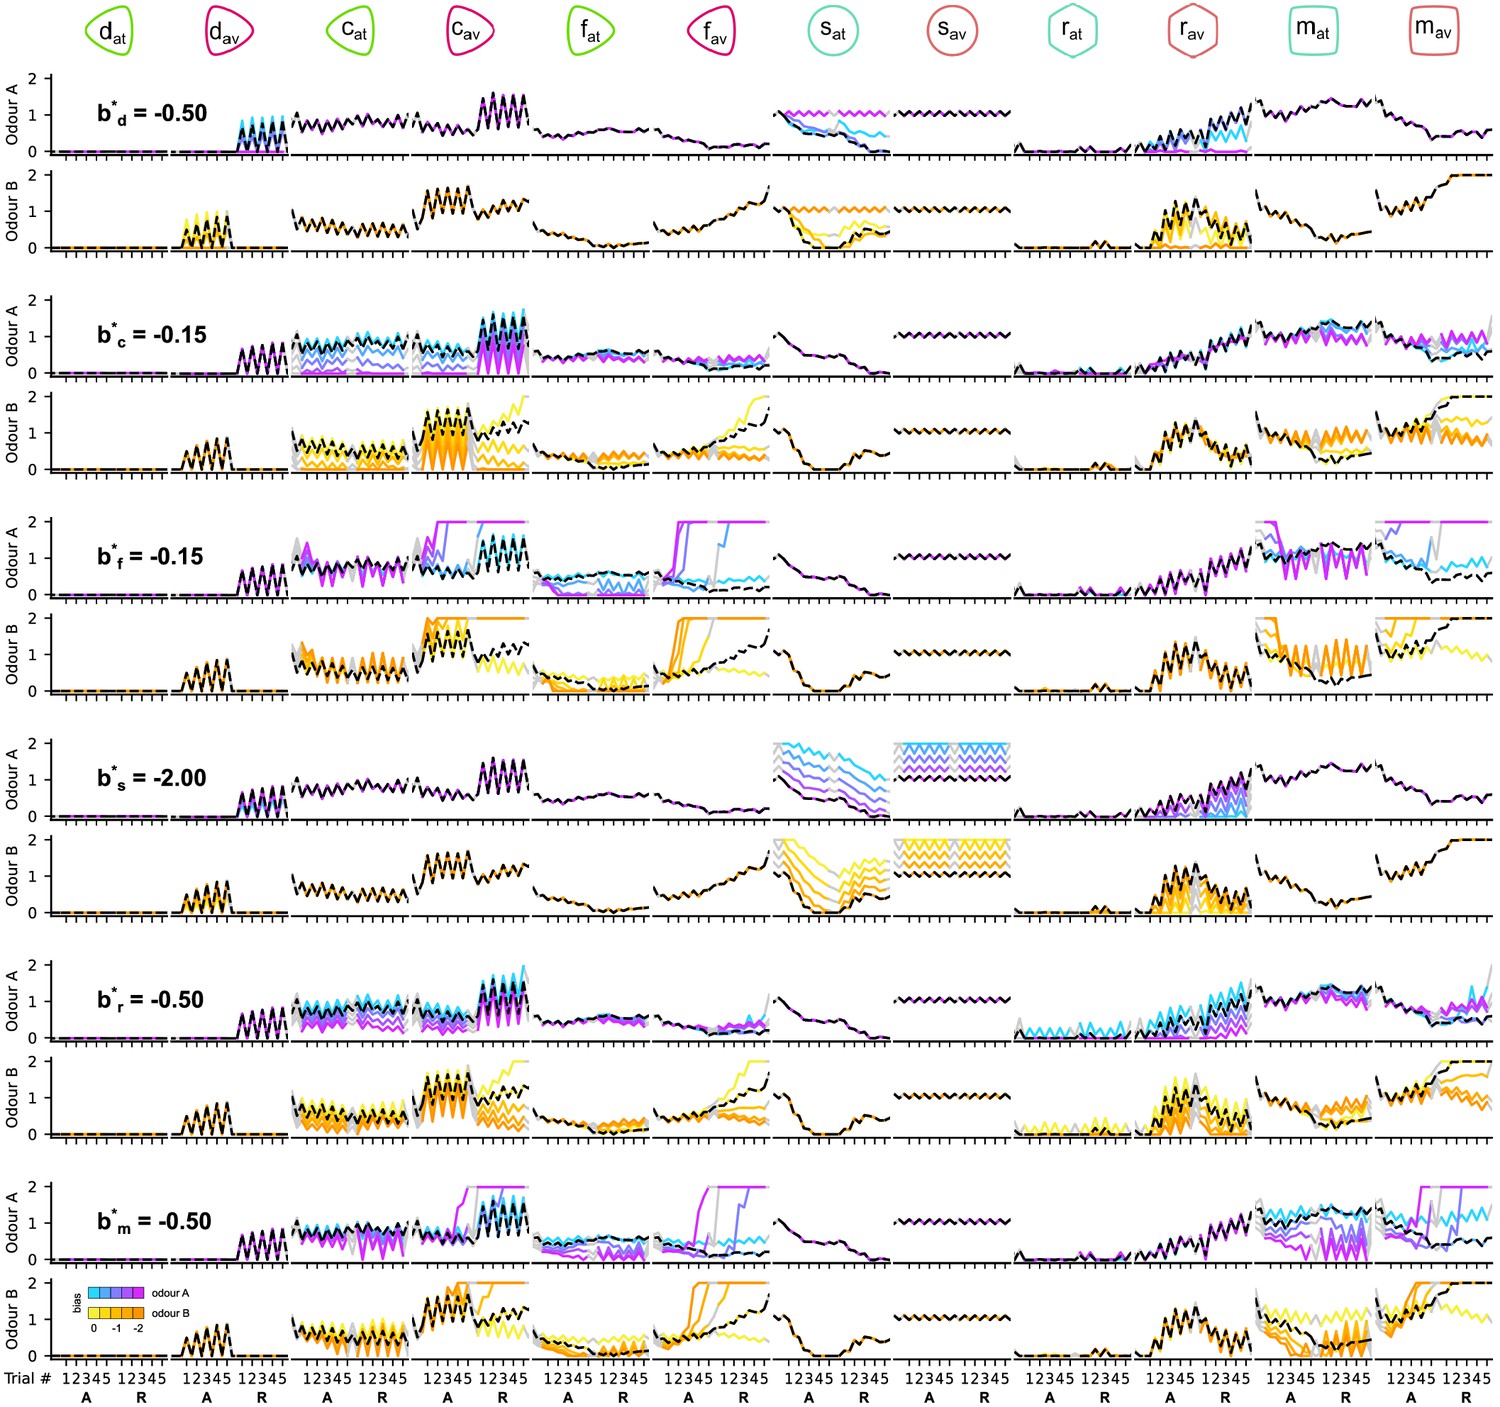
The responses of the dopaminergic neurons (DANs) and mushroom body output neurons (MBONs) of the circuit when altering the DAN and MBON biases during the reversal condition.
Each column corresponds to the responses of a different neuron. Odd and even rows show the responses of the neurons to odours A and B, respectively. Pairs of rows (consecutive odours A and B) show the responses of the neurons for the different values of the target parameter (indicated in the first column). Black dashed line shows the responses of the neurons for the chosen (*) parameter. The different colour codes show the responses of the neurons for the different values of the target parameter as indicated in the colour bar on the bottom left.
Figure 15
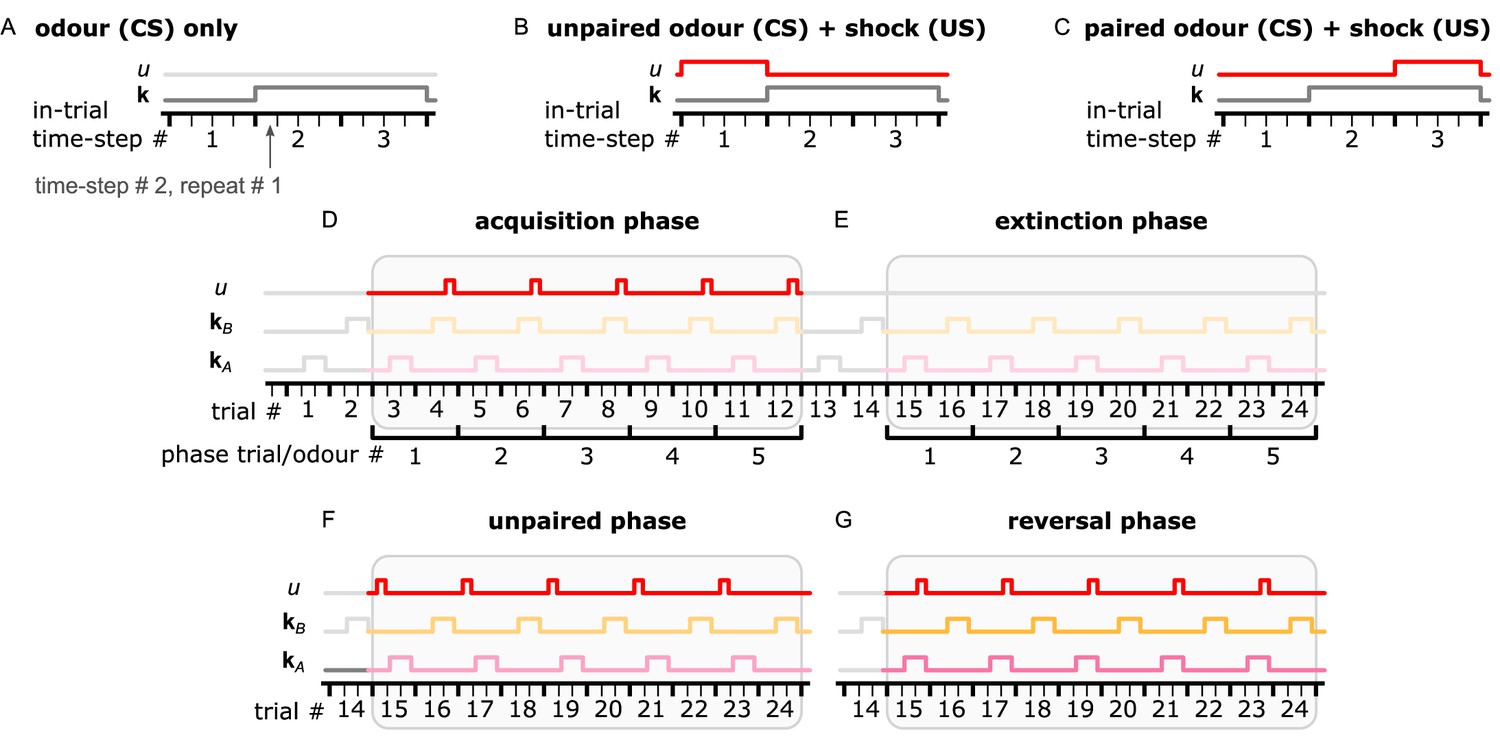
Description of the simulation process from our experiments.
A single trial is composed of three in-trial time-steps and each time-step by four repeats. Odour is provided only during the second and third in-trial time-steps, while shock delivery is optional. (A) In an extinction trial, only odour (CS) is delivered. (B) During an unpaired trial, shock is delivered during in-trail time-step 1. (C) During a paired trial, shock is delivered along with odour delivery and during in-trial time-step 3. (D) The acquisition phase has five odour A-only trials and five paired odour B trials alternating. (E) The extinction phase has five odour A-only trials and five odour B-only trials alternating. (F) The unpaired phase has five odour A unpaired trials and five odour B-only trials alternating. (G) The reversal phase has five odour A paired trials and five odour B-only trials alternating. The colours used in this figure match the ones in Figure 4.
Figure 16 with 2 supplements
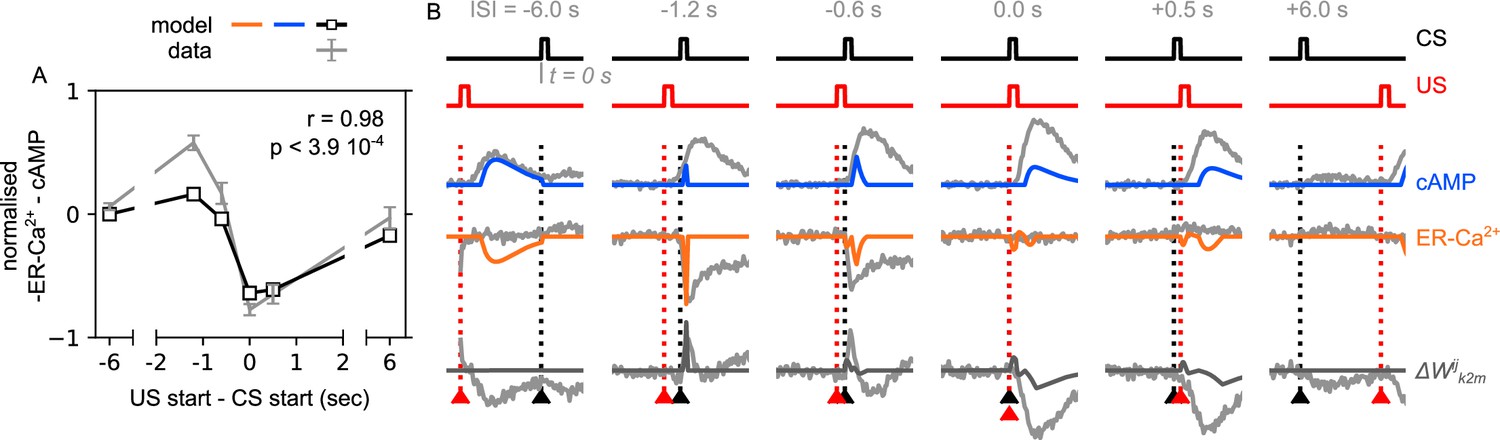
The effect of the ER-Ca2+ and cAMP based on the order of the conditional stimuli (CS) and unconditional stimuli (US).
(A) Normalised mean change of the synaptic weight plotted as a function of the (US start – CS start), similar to Handler et al., 2019, Figure 5F (blue line). For ease of comparison, the predicted mean values are drawn on the top of the data (mean ± SEM) from the original paper (Handler et al., 2019); grey lines and error bars. (B) Detailed ER-Ca2+ and cAMP responses reproduced for the different , and their result synaptic weight change. Black arrowhead marks the time of the CS (duration ); red arrowhead marks the time of the US (duration ), similar to Handler et al., 2019, Figure 5D. For ease of comparison, the predicted responses are drawn on the top of the data from the original paper (Handler et al., 2019); grey lines.
Figure 16—figure supplement 1
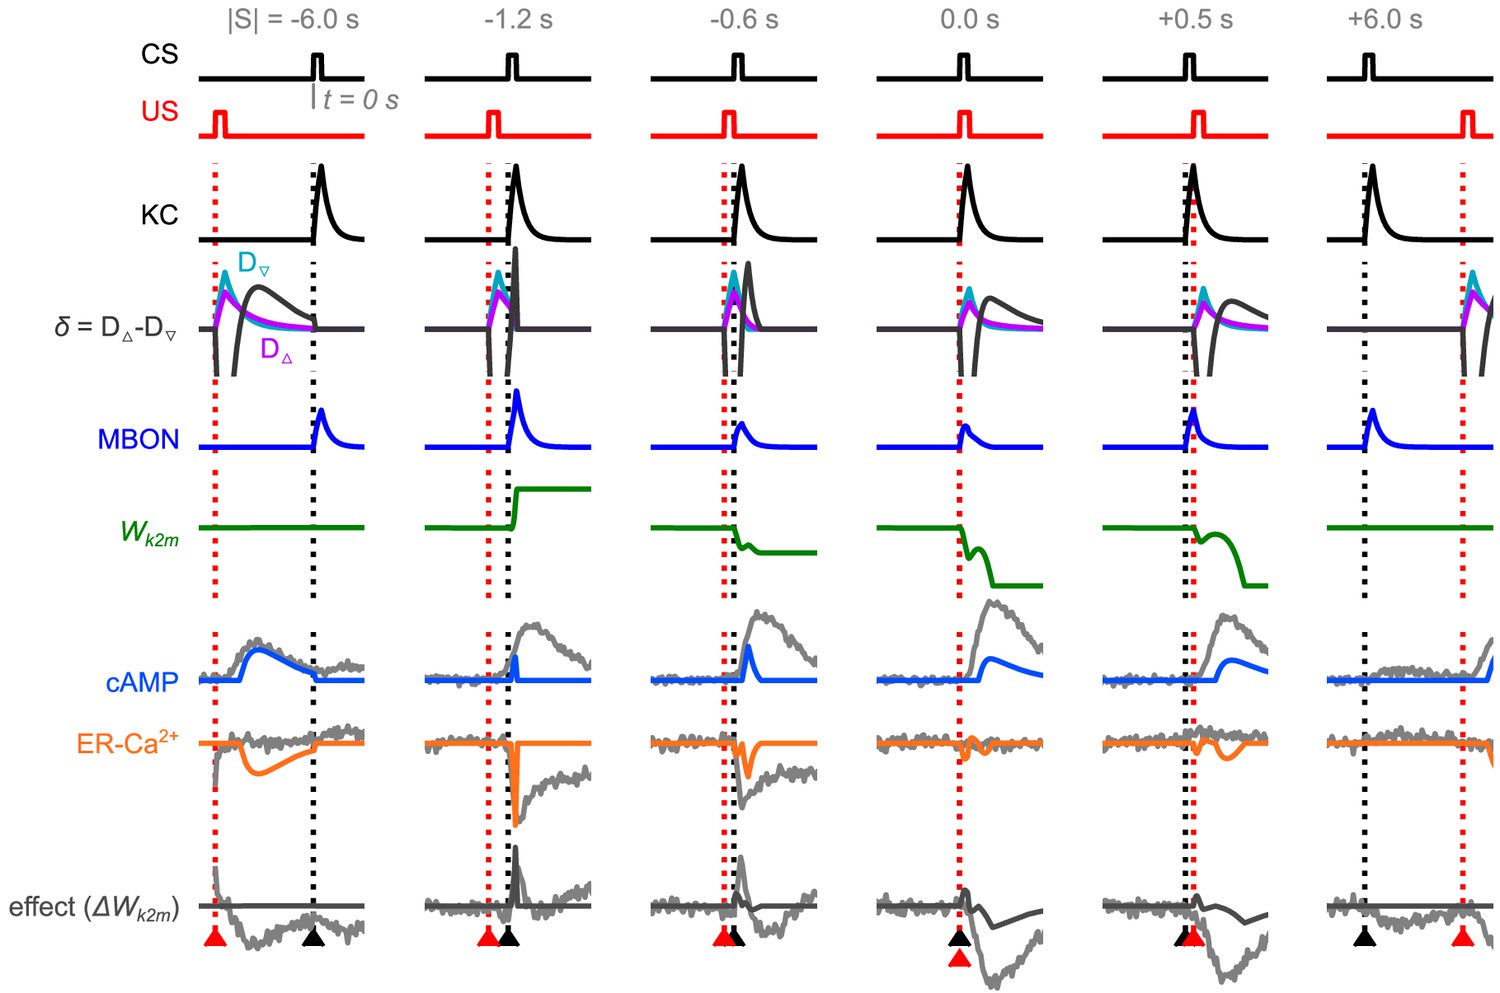
All the chemical levels and neural activities calculated based on the order of the conditional stimuli (CS) and unconditional stimuli (US).
Black arrowhead marks the time of the CS (duration ); red arrowhead marks the time of the US (duration ), similar to Handler et al., 2019, Figure 5D. Predicted ER-Ca2+, cAMP, and the plasticity effect responses are drawn on top of the data from the original paper (Handler et al., 2019), grey lines.
Figure 16—figure supplement 2
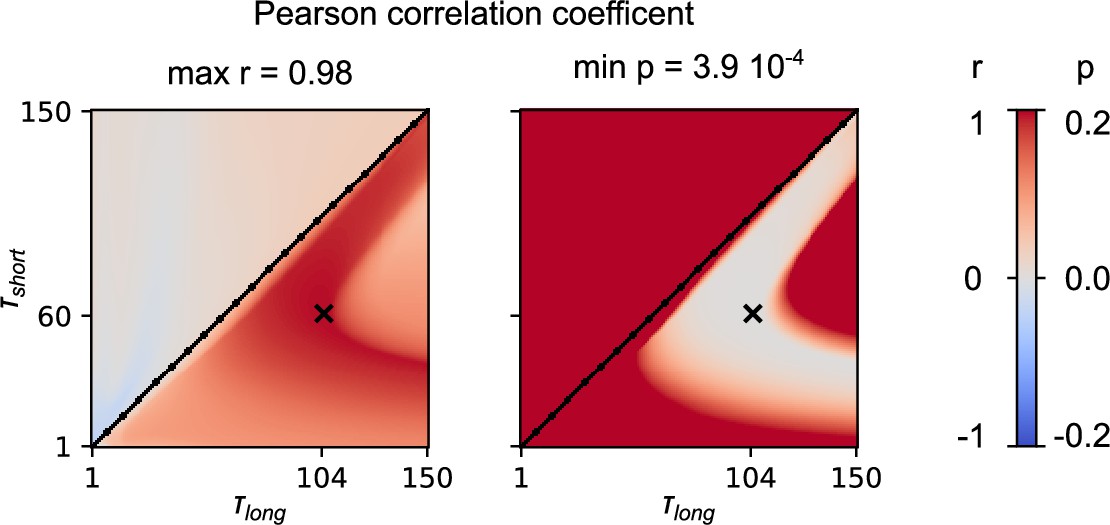
Parameter exploration of the and in Equation 35 and Equation 36.
For the combinations of and , we calculate the Pearson correlation coefficient between the predicted normalised mean change of the synaptic weight and the one extracted from the data of Handler et al., 2019, and we report the r and p values. With ‘x’ we mark the pair of parameters with the highest correlation.
Appendix 1—figure 1
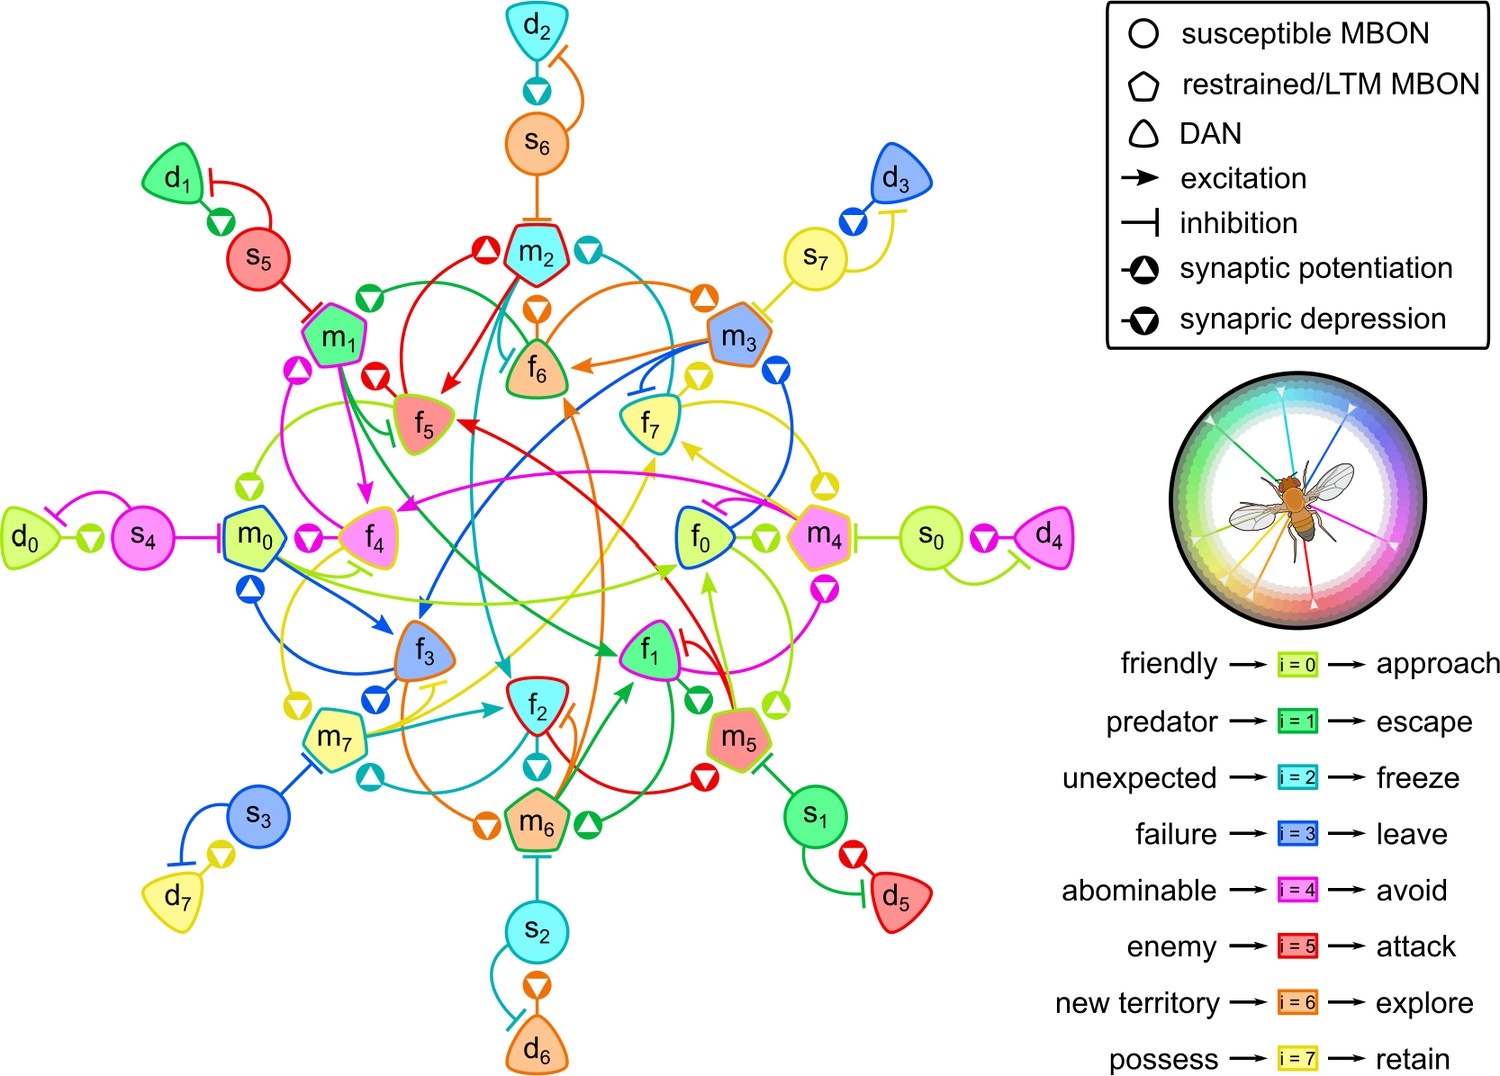
The ‘incentives wheel’ model.
This model supports that reinforcement is not binary but it draws its values from a spectrum. Different types of reinforcements trigger different dopaminergic neurons (DANs) that enable learning in different parts of the mushroom body. Colours show the variety of motivations that the model can encode associated with humans’ ‘wheel of emotions’ (Plutchik, 2001); e.g., light green: trust; green: fear; light blue: surprise; blue: sadness; pink: disgust; red: anger; orange: anticipation; yellow: joy. Neurons of more than one colours are part of multiple circuits that contribute to different motivations.
Tables
Table 1
Connections among neurons in the Drosophila mushroom body mapped to the connections of the incentive circuit.
Connection types: ‘⊸’, modulates the synaptic weights of the KC→MBON connections terminating in that MBON; ‘→’, excitatory connection; ‘⊣’, inhibitory connection. Microcircuit – SM: susceptible memory; RM: restrained memory; RSM: reciprocal short-term memories; LTM: long-term memory; RLM: reciprocal long-term memories; MAM: memory assimilation mechanism. Evidence – A: anatomical connection is known (i.e., using light or electron microscopy); F: functional connection is known (i.e., whether activating the presynaptic neuron leads to an excitatory or inhibitory effect on the postsynaptic neuron and/or the neurotransmitter released by the presynaptic neuron); KC: Kenyon cell; MBON: mushroom body output neuron; IC: incentive circuit.
| Connection in the MB | Connection in the IC | Microcircuit | Evidence | References |
|---|---|---|---|---|
| PPL1-γ1ped ⊸ MBON-γ1ped | SM | A, F | Aso et al., 2014a; Pavlowsky et al., 2018 | |
| MBON-γ1ped ⊣ PPL1-γ1ped | SM | A, F | Aso et al., 2014a; Pavlowsky et al., 2018 | |
| PAM-γ4<γ1γ2 ⊸ MBON-γ4>γ1γ2 | SM | A | Aso et al., 2014a | |
| MBON-γ4>γ1γ2 ⊣ PAM-γ4<γ1γ2 | SM | A, F | Aso et al., 2014a; Cohn et al., 2015 | |
| MBON-γ1ped ⊣ MBON-γ5β′2a | RM | A, F | Aso et al., 2014a; Felsenberg et al., 2018 | |
| MBON-γ4>γ1γ2 ⊣ MBON-γ2α′1 | RM | A | Aso et al., 2014a | |
| PPL1-γ2α’12 ⊸ MBON-γ2α′1 | RSM | A, F | Aso et al., 2014a; McCurdy et al., 2021 | |
| MBON-γ2α′1 → PAM-β′2a | RSM | A, F | Aso et al., 2014a; McCurdy et al., 2021 | |
| PAM-β′2a ⊸ MBON-γ5β′2a | RSM | A, F | Aso et al., 2014a; McCurdy et al., 2021 | |
| MBON-γ5β′2a → PPL1-γ2α’12 | RSM | A | Li et al., 2020 | |
| PPL1-γ2α’12 ⊸ MBON-α’1 | LTM | A | Aso et al., 2014a | |
| MBON-α’1 → PPL1-γ2α’12 | LTM | A | Aso et al., 2014a; Li et al., 2020 | |
| PAM-β’2a ⊸ MBON-β2β′2a | LTM | A | Aso et al., 2014a | |
| MBON-β2β′2 a → PAM-β′2a | LTM | A | Aso et al., 2014a; Li et al., 2020 | |
| PPL1-γ2α’11 ⊸ MBON-α’1 | RLM | A | Aso et al., 2014a | |
| MBON-α’1 → PAM-β2β′2a | RLM | A | Li et al., 2020 | |
| PAM-β2β′2a ⊸ MBON-β2β′2a | RLM | A | Aso et al., 2014a | |
| MBON-β2β′2a → PPL1-γ2α’11 | RLM | A | Li et al., 2020 | |
| PPL1-γ2α’11 ⊸ MBON-γ2α’1 | MAM | A | Aso et al., 2014a | |
| PAM-β2β′2a ⊸ MBON-γ5β′2a | MAM | A | Aso et al., 2014a |
Appendix 2—table 1
Additional information on the mushroom body neurons used for the incentive circuit, sorted by their short name.
Information about the neurons has been collected from McCurdy et al., 2021 and Aso et al., 2014a.
| Driver | Cluster | Neuron name | # cells | Short name | Alternative names |
|---|---|---|---|---|---|
| MB011B | M4/M6 | MBON-γ5β’2a | 1 | MBON-01 | MB-M6 |
| MB399B | M4/M6 | MBON-β2β′2a | 1 | MBON-02 | |
| MB298B | MV2 | MBON-γ4>γ1γ2 | 1 | MBON-05 | |
| MB112C | MBON-γ1pedc>α/β | 1 | MBON-11 | MB-MVP2 | |
| MB077B | V3/V4 | MBON-γ2α’1 | 2 | MBON-12 | |
| MB050B | V2 | MBON-α’1 | 3 | MBON-15 | |
| MB109B | PAM | PAM-β’2a | 6–9 | PAM-02 | |
| MB301B | PAM | PAM-β2β′2a | > 3 | PAM-04 | Subset of MB-M8 |
| MB312B | PAM | PAM-γ4<γ1γ2 | 13–17 | PAM-07 | Subset of MB-AIM? |
| MB320C | PPL1 | PPL1-γ1ped | 1 | PPL1-01 | MB-MP1, MP |
| MB296B1 | PPL1 | PPL1-γ2α′11 | 1 | PPL1-03 | MB-MV1 |
| MB296B2 | PPL1 | PPL1-γ2α′12 | 1 | PPL1-03 | MB-MV1 |
Additional files
Download links
A two-part list of links to download the article, or parts of the article, in various formats.
Downloads (link to download the article as PDF)
Open citations (links to open the citations from this article in various online reference manager services)
Cite this article (links to download the citations from this article in formats compatible with various reference manager tools)
An incentive circuit for memory dynamics in the mushroom body of Drosophila melanogaster
eLife 11:e75611.
https://doi.org/10.7554/eLife.75611


