The single-cell chromatin accessibility landscape in mouse perinatal testis development
- Developmental and Regenerative Biology Program, School of Biomedical Sciences, Faculty of Medicine, The Chinese University of Hong Kong, Shatin, Hong Kong
- School of Medical Technology and Engineering, Fujian Medical University, China
- Cancer Biology and Experimental Therapeutics Program, School of Biomedical Sciences, Faculty of Medicine, The Chinese University of Hong Kong, Shatin, China
- Guangzhou Regenerative Medicine and Health Bioland Laboratory, Guangzhou Institutes of Biomedicine and Health, China
- Germline Stem Cell Biology Laboratory, Centre for Reproductive Health, Hudson Institute of Medical Research, Australia
- Department of Chemical Pathology, The Chinese University of Hong Kong, Shatin, New Territories, China
Figures
Figure 1 with 2 supplements
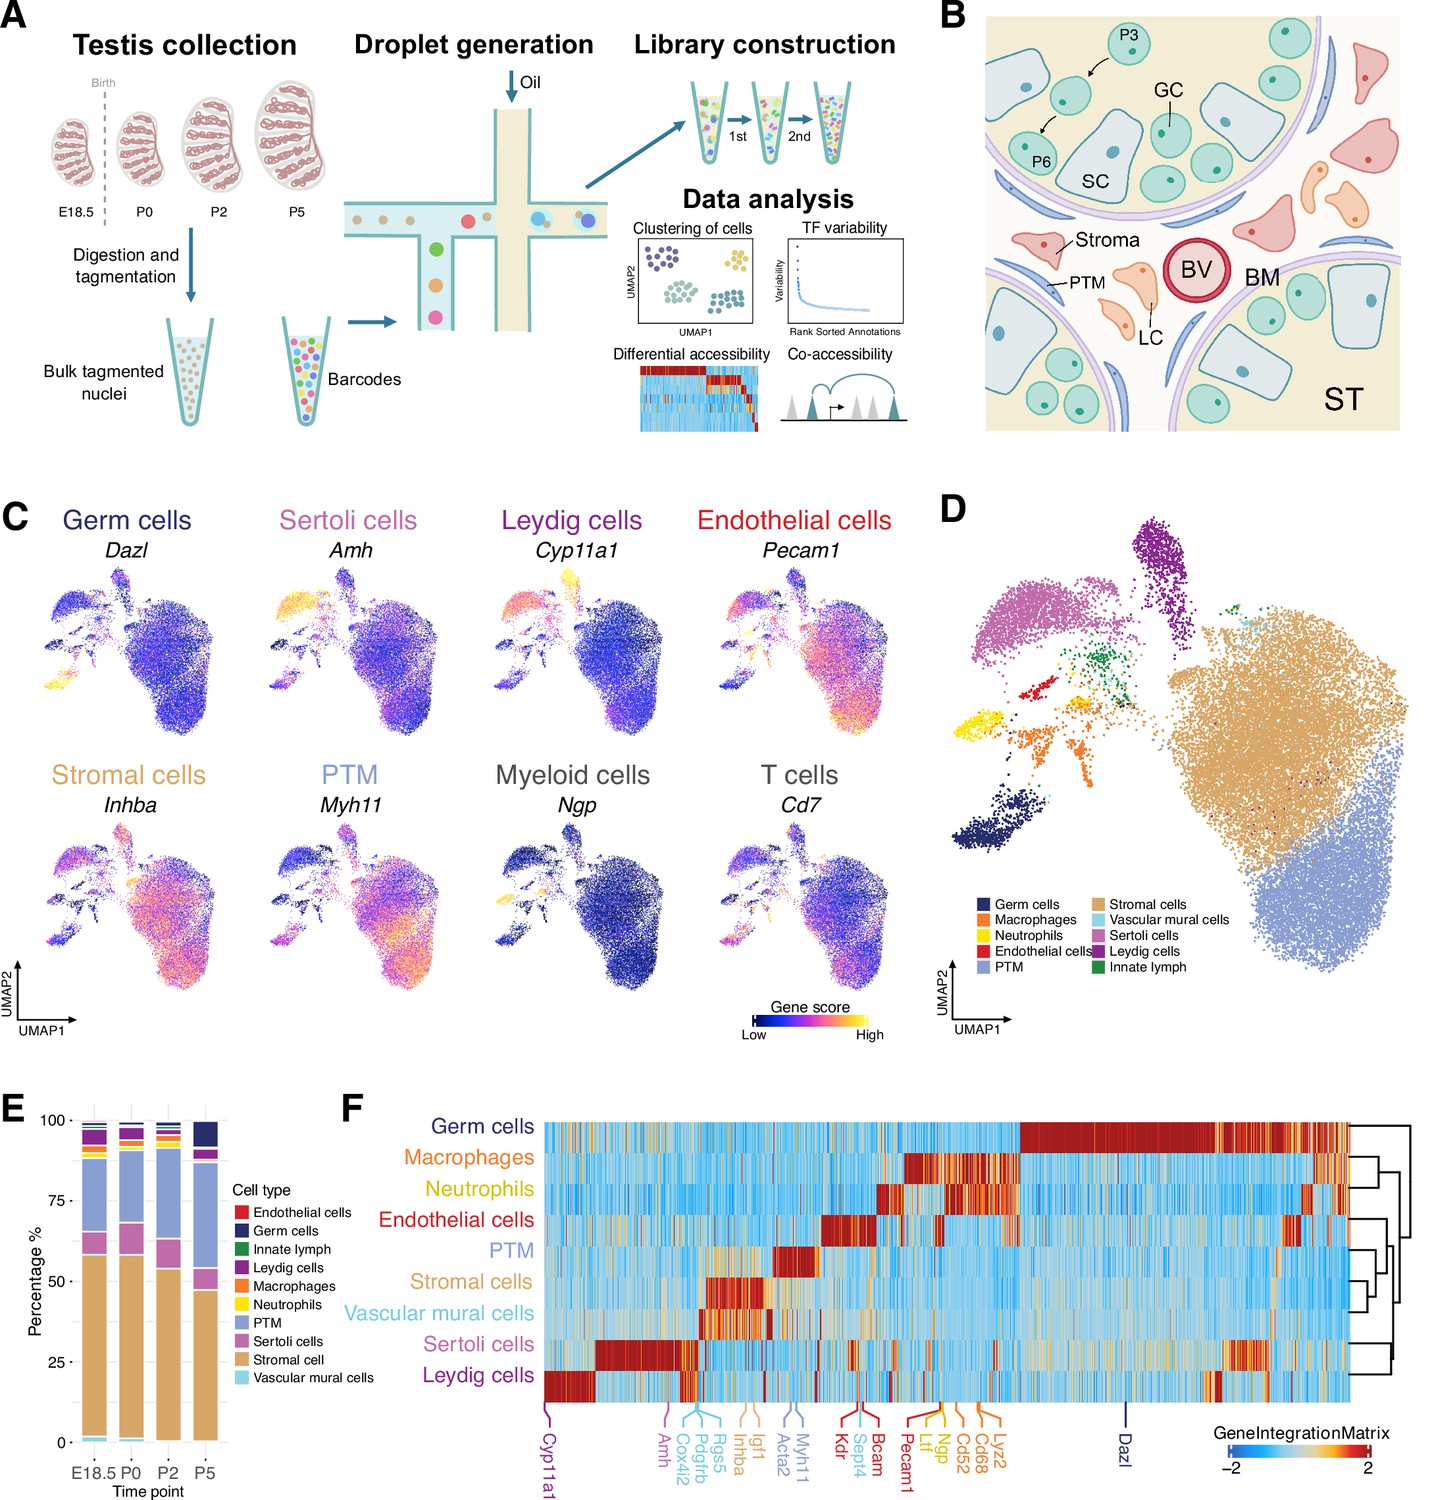
Classification and identification of germ cells and somatic cells during perinatal testicular development.
(A) Experimental design. The workflow of testis collection and single-cell sequencing assay for transposase-accessible chromatin (scATAC-Seq) to measure single nuclei accessibility on BioRad SureCell ATAC-Seq platform. (B) Illustration of the testicular microenvironment. GC: germ cell; SC: Sertoli cell; LC: Leydig cell; BV: blood vessel; BM: basement membrane; ST: seminiferous tubule; PTM: peritubular myoid cell. (C) Uniform manifold approximation and projection (UMAP) representations with cells colored by the gene score of marker genes for each cell type. (D) UMAP representation of cells captured from four time points. Cells are colored by predicted groups. (E) Bar chart showing the distribution of cells in each cluster for different time points. (F) Heatmap of 12,250 marker genes across cell types (FDR ≤ 0.05, Log2FC ≥ 0.2).
Figure 1—figure supplement 1
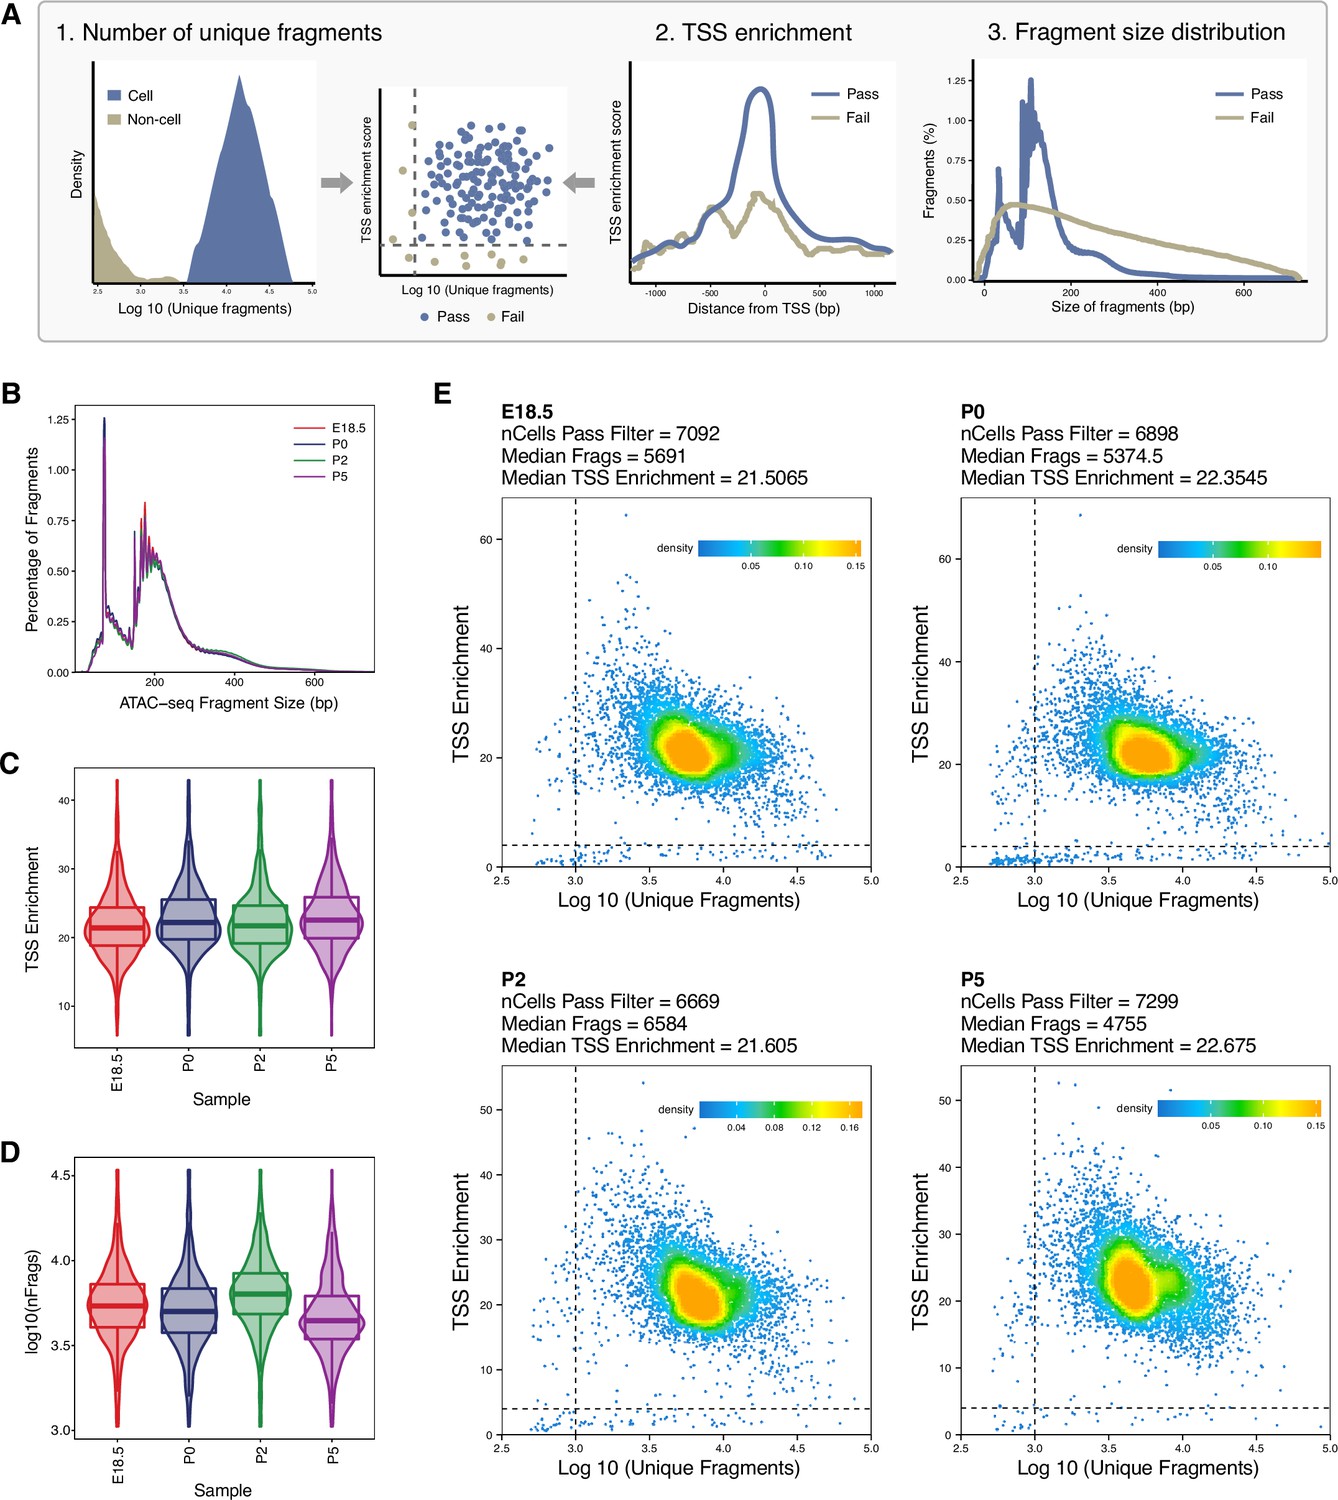
Quality assessment metrics for single-cell sequencing assay for transposase-accessible chromatin (scATAC-Seq) libraries, related to Figure 1.
(A) Schematic of the workflow of scATAC-Seq data quality control to remove the low-quality nuclei. The following three parameters are considered: (1) the number of unique nuclear fragments (indicating not mapping to mitochondrial DNA); (2) transcription start site (TSS) enrichment (a high signal-to-background ratio is expected in live cells); (3) the fragment size distribution (the length of DNA wrapped around a nucleosome is expected). (B) The fragment size distribution plot shows enrichment at around 100 and 200 bp, indicating nucleosome-free and mono-nucleosome-bound fragments. (C) Violin plot showing TSS enrichment across samples. (D) Violin plot showing number of fragments per cell across samples. (E) Plot of TSS enrichment score versus the total number of unique fragments of each sample. Only cells lying in the upper right quadrant (marked by dashed lines) are retained for heterotypic doublet removal and downstream analysis.
Figure 1—figure supplement 2
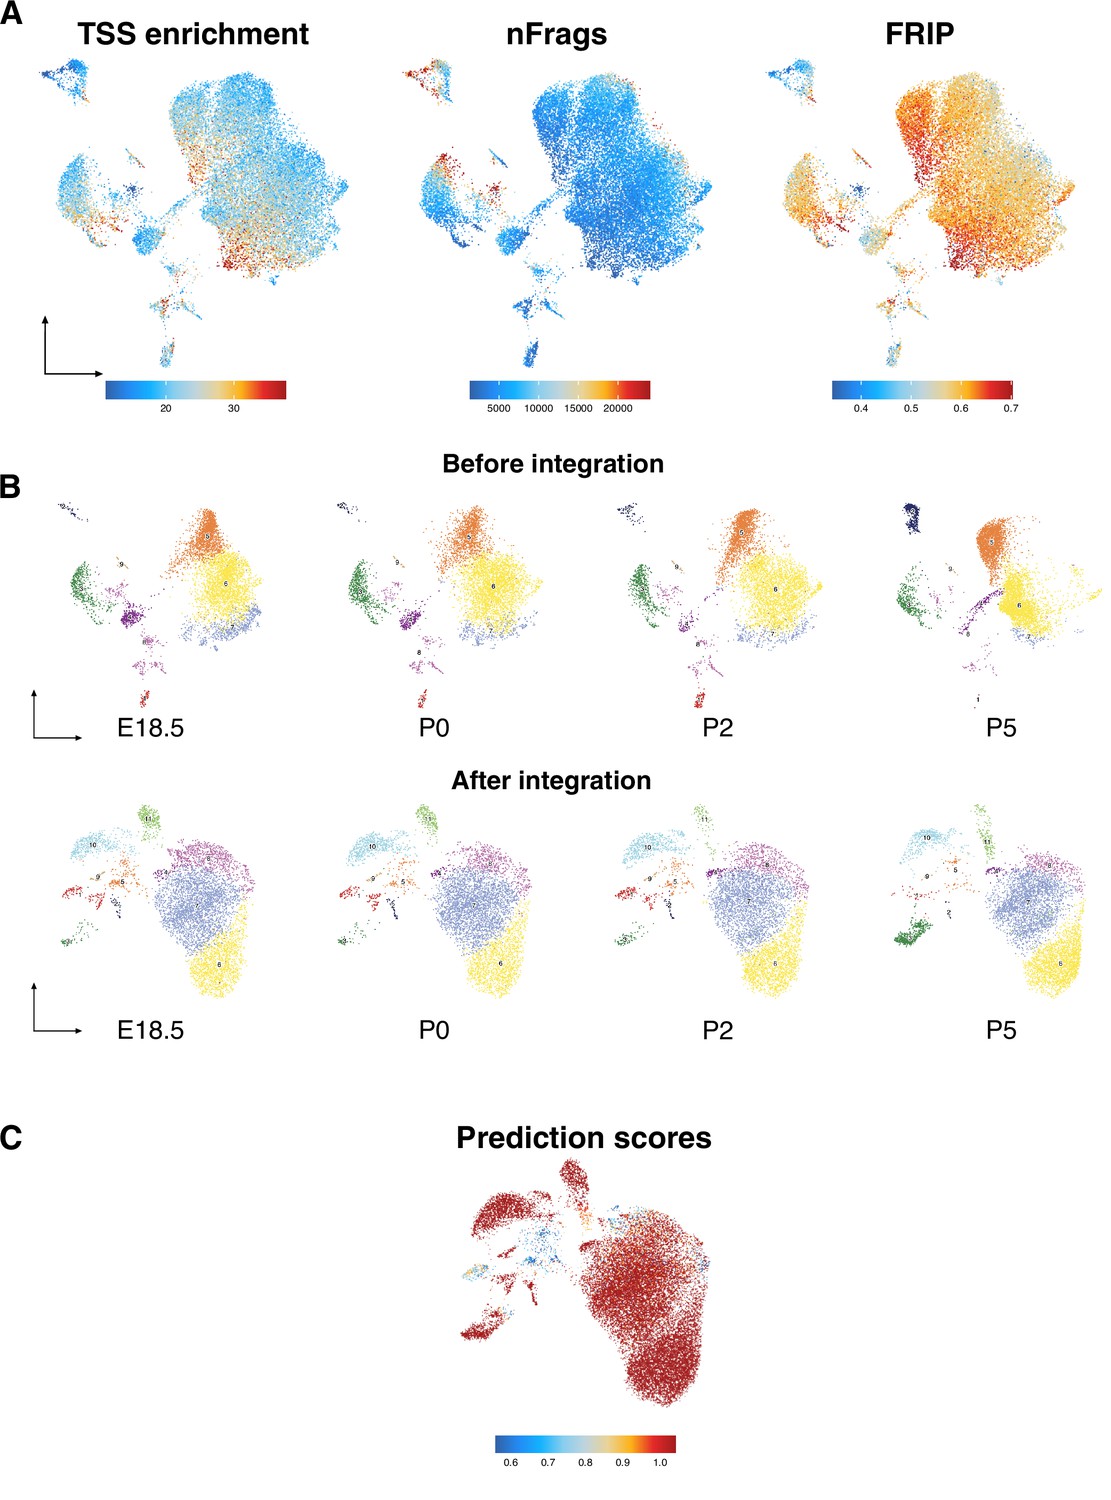
Testicular cell-type annotation and distribution, related to Figure 1.
(A) Transcription start site (TSS) enrichment, number of fragments (nFrags), and fraction of reads in peaks (FRIP) of all cells shown in uniform manifold approximation and projection (UMAP). (B) UMAP representation of testicular cells captured from all four time points. (C) Prediction scores of integration with scRNA-Seq data.
Figure 2 with 1 supplement
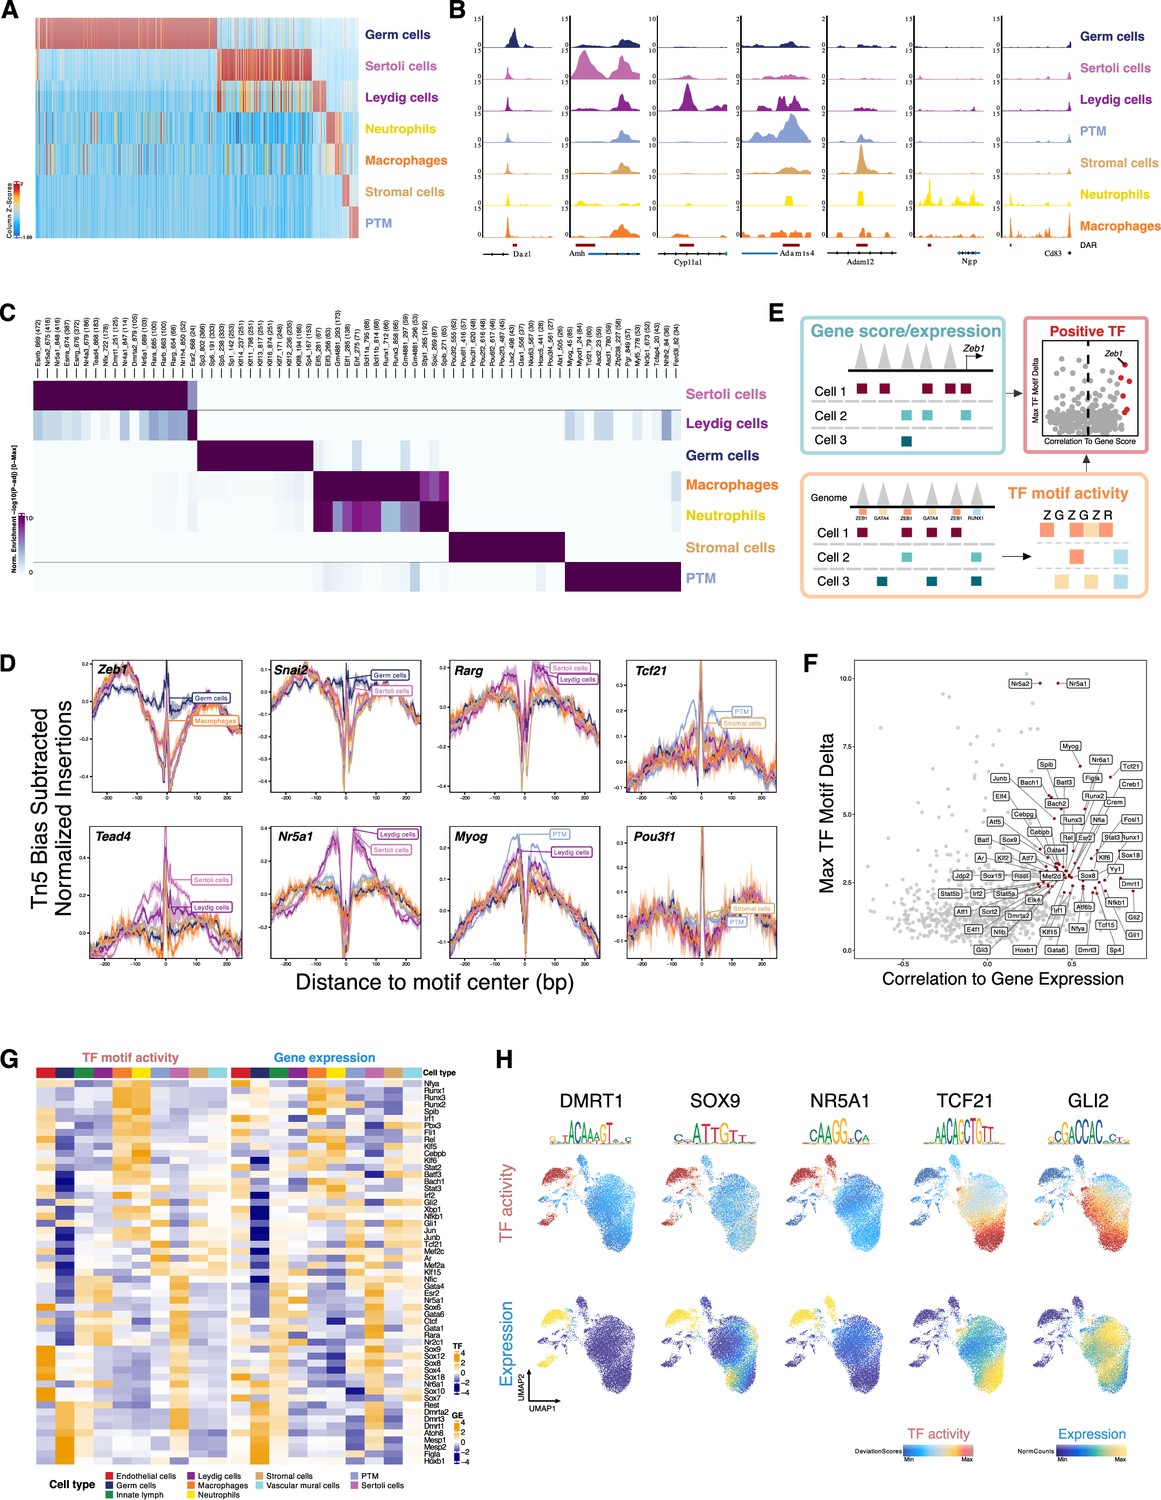
Characterization of differentially accessible regions and identification of cell type-specific transcription factors (TFs).
(A) Heatmap of 51,937 differentially upregulated accessible peaks (FDR ≤ 0.01, Log2FC ≥ 2) across cell types. (B) Aggregated single-cell sequencing assay for transposase-accessible chromatin (scATAC-Seq) profiles of selected markers. (C) Heatmap of enriched motifs (FDR ≤ 0.1, Log2FC ≥ 0.5) across cell types. (D) TF footprints (average ATAC-Seq signal around predicted binding sites) for selected TFs. (E) Schematic of identifying positive TF regulators through correlating gene score (scATAC-Seq data)/gene expression (integrating scATAC-Seq and scRNA-Seq data) with TF motif activity (scATAC-Seq data). (F) Scatter plot of positive TF regulators (correlation >0.5, adjusted p-value <0.01). (G) Heatmaps of differential TF motif activity (left) and gene expression (right) of positive TF regulators in F. (H) TF overlay on scATAC uniform manifold approximation and projection (UMAP) of TF chromVAR deviations (top) and gene expression (bottom).
Figure 2—figure supplement 1
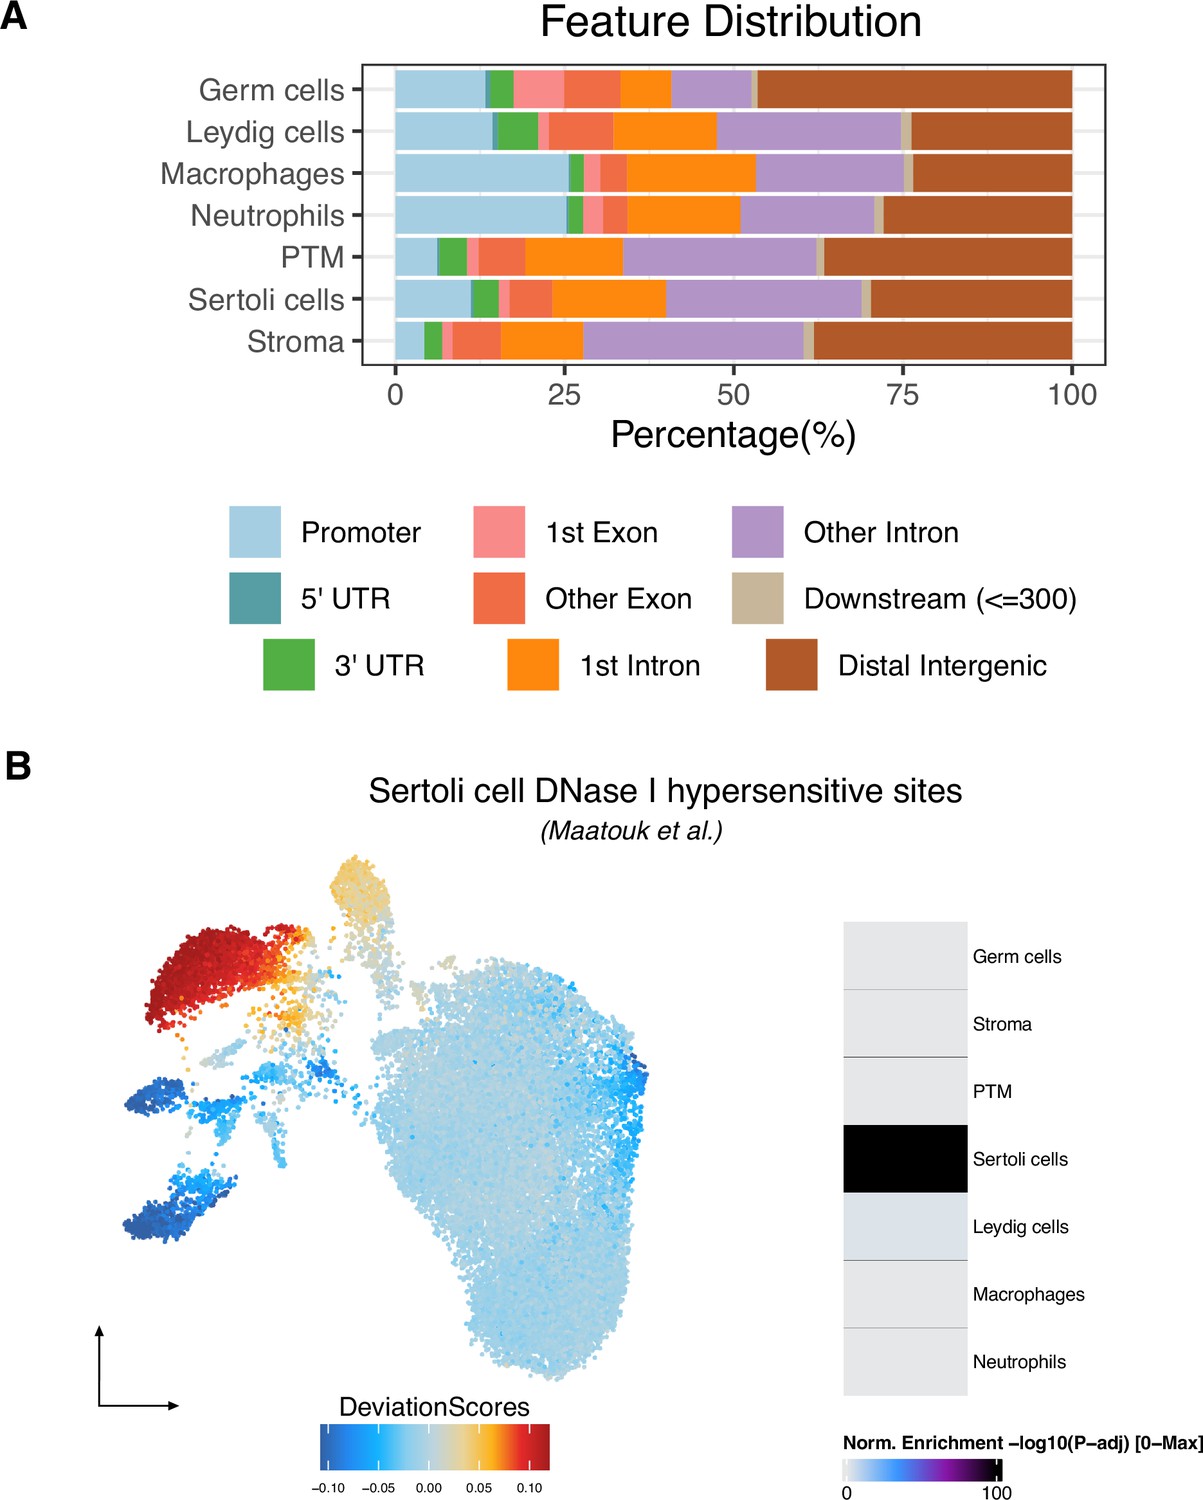
Characterization of cell type-specific differentially accessible chromatin regions (DARs), related to Figure 2.
(A) Genomic distributions of DARs across cell types. (B) chromVAR deviation score of Sertoli cell DHSs shown in uniform manifold approximation and projection (UMAP) (left). DARs for the Sertoli cell cluster are significantly enriched for Sertoli cell DHSs compared to other clusters (right).
Figure 3 with 2 supplements
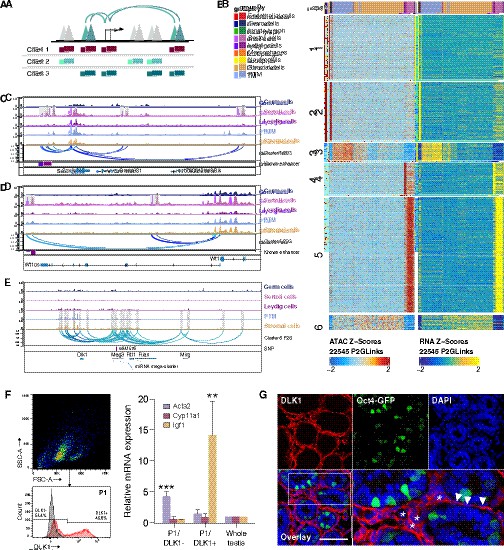
Chromatin interaction networks in different cell types.
(A) Schematic for identifying significant peak-to-gene links by correlating accessible peaks (single-cell sequencing assay for transposase-accessible chromatin [scATAC-Seq] data) to gene expression (integrating scATAC-Seq data and scRNA-Seq data). (B) Heatmaps of peak accessibility (left) and gene expression (right) of 22,545 peak-to-gene linkages across cell types. (C) Aggregated scATAC-Seq profiles showing peak-to-gene links to the Sox9 locus overlapped with known enhancer regions. (D) Aggregated scATAC-Seq profiles showing peak-to-gene links to the Wt1 locus overlapped with known enhancer regions. (E) Aggregated scATAC-Seq profiles showing peak-to-gene links to the Dlk1 locus overlapped with SNP. (F) Sorting strategy for isolation of DLK1- and DLK1+ cells from P6 whole testis. The majority of DLK1+ cells are located in P1 (upper left). The DLK1-/+ population was gated using Red-X-labeled sample compared with unstained control (lower left). RT-PCR analysis (right) of relative expression of peritubular myoid cell (PTM) marker (Acta2), Leydig cell marker (Cyp11a1), and stromal cell marker (Igf1) of DLK1-/+ cells compared with whole testis sample (p<0.001, n=3, one-way ANOVA). Gapdh was used as endogenous control. Error bars are plotted with SD. (G) Representative confocal images of testis sections from Oct4-GFP transgenic mice at P6. Stromal cells (asterisks) and some PTMs (arrowheads) are positive for DLK1 (red). Oct4-GFP indicated germ cells. Cell nuclei were stained with DAPI. Scale bar = 50 μm.
Figure 3—figure supplement 1
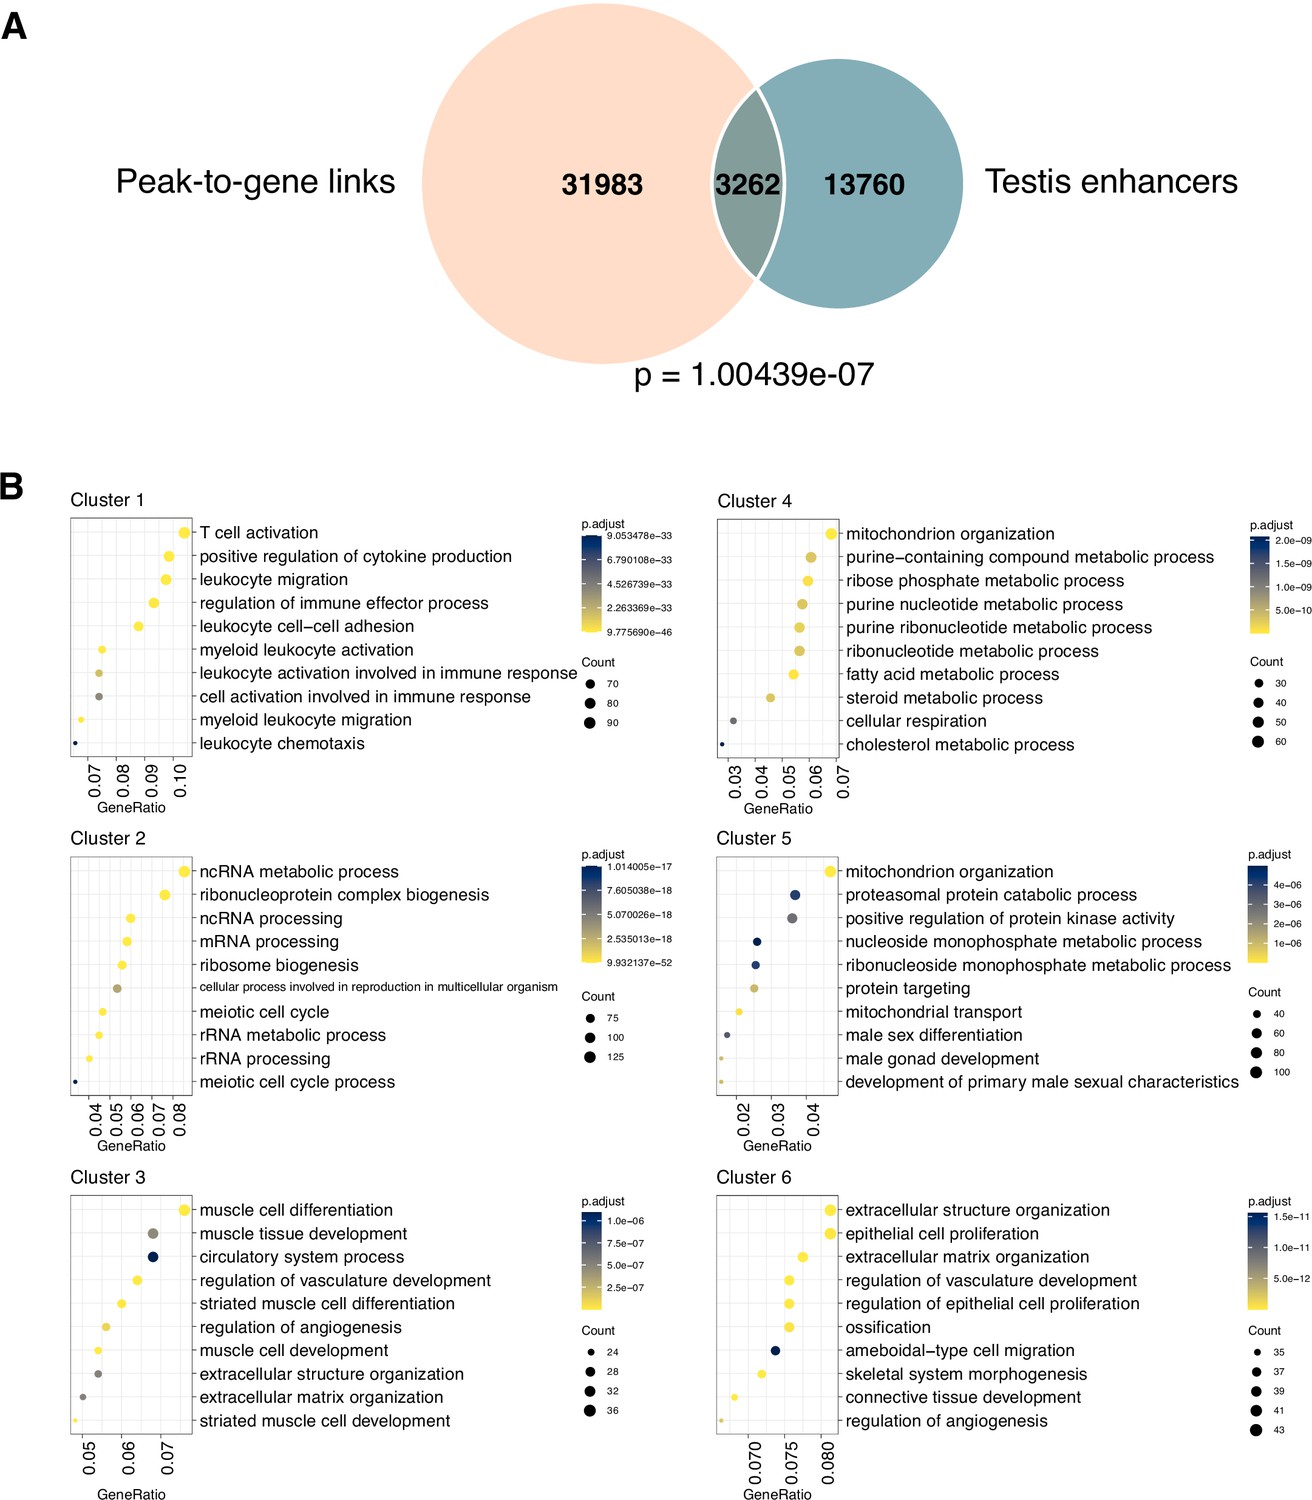
Characterization of peak-to-gene links across cell types, related to Figure 3.
(A) Venn diagram showing significant overlapping of peak-to-gene links and known testis enhancers. p-Value was calculated by the hypergeometric test using ChIPpeakAnno. (B) Top results from the Gene Ontology (GO) enrichment test showing the terms associated with peak-to-gene links in each cluster identified in Figure 3B.
Figure 3—figure supplement 2
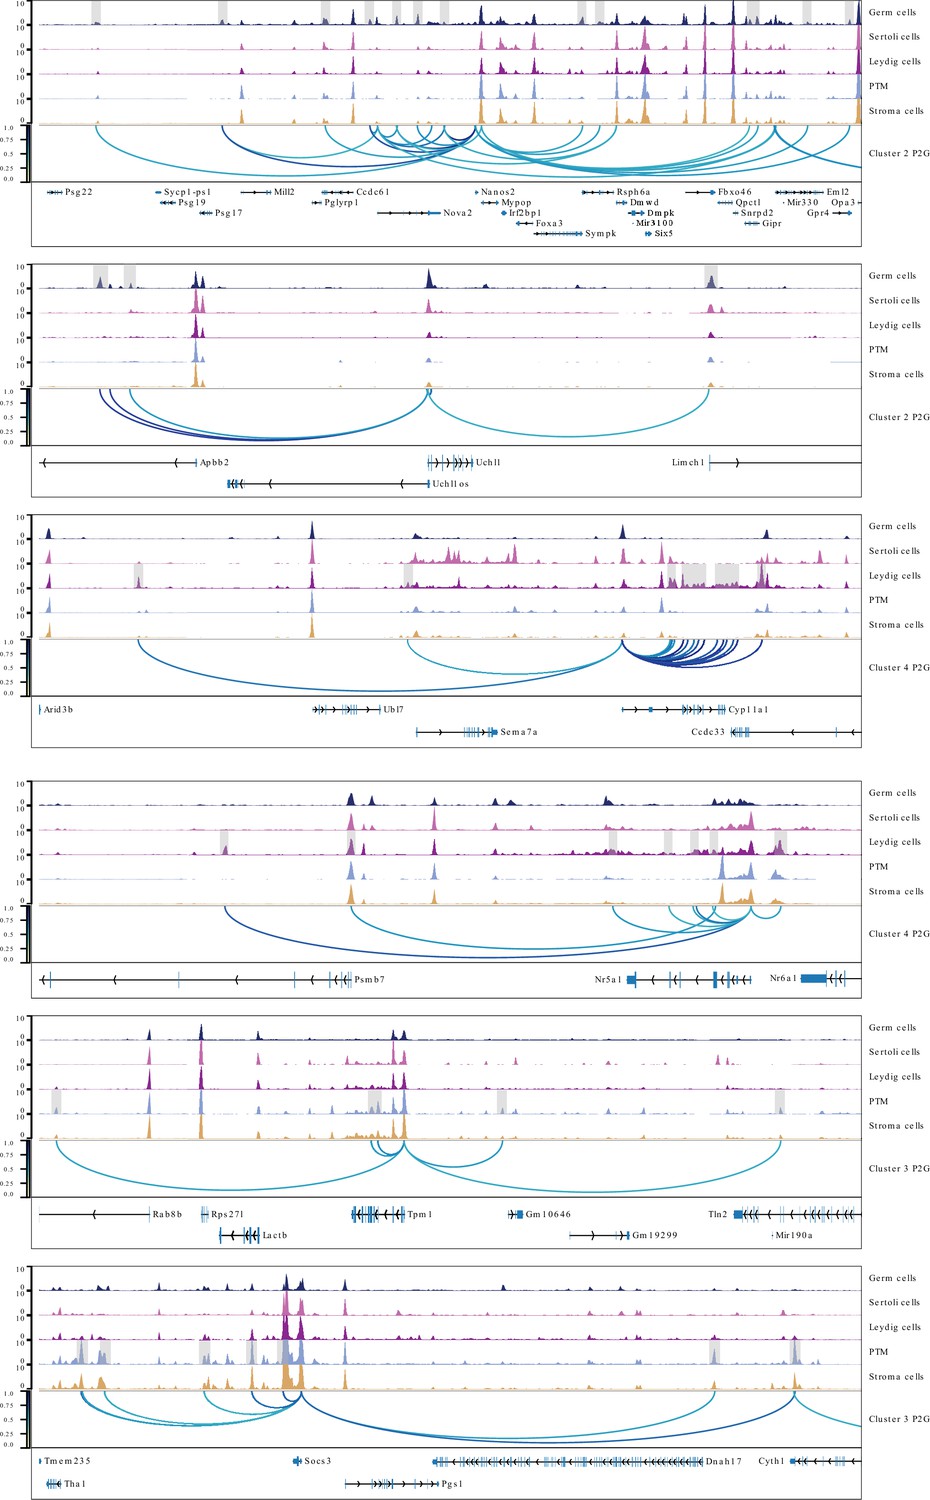
Aggregated single-cell sequencing assay for transposase-accessible chromatin (scATAC-Seq) profiles showing peak-to-gene links to the selected gene examples, related to Figure 3.
Figure 4 with 4 supplements
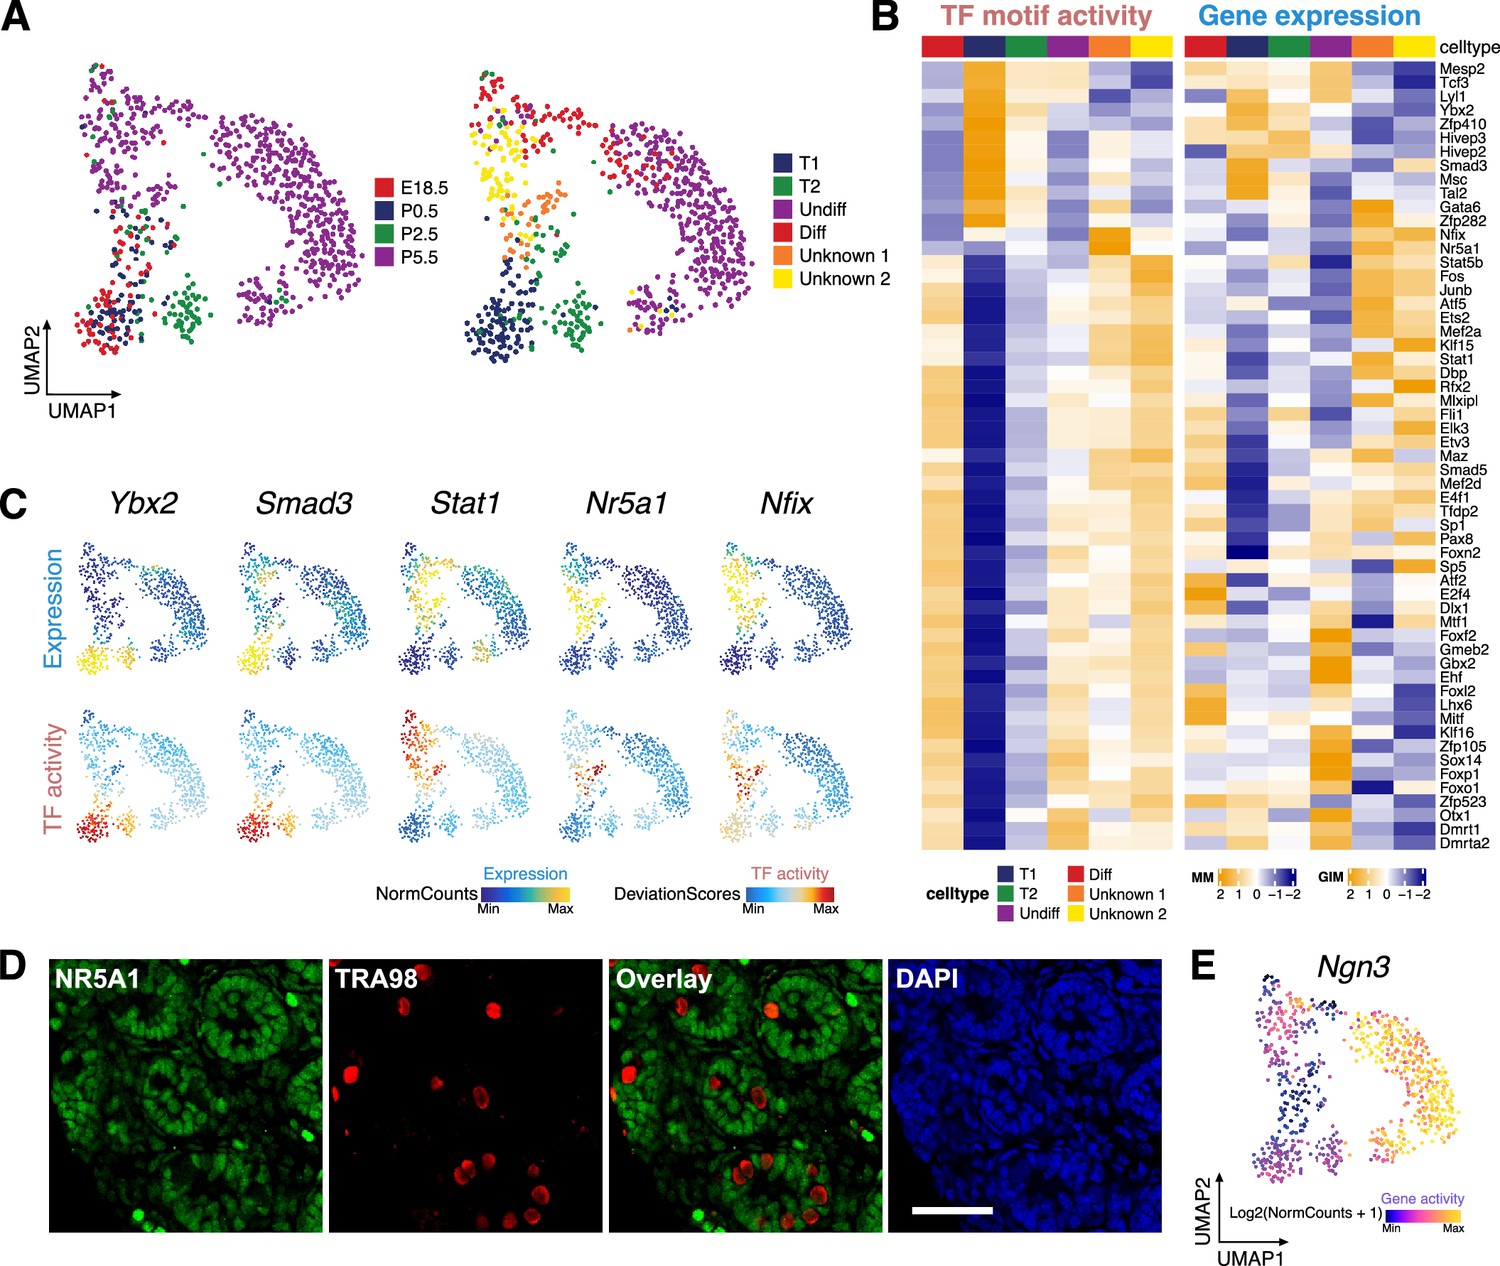
Identification of germ cell clusters during the perinatal period.
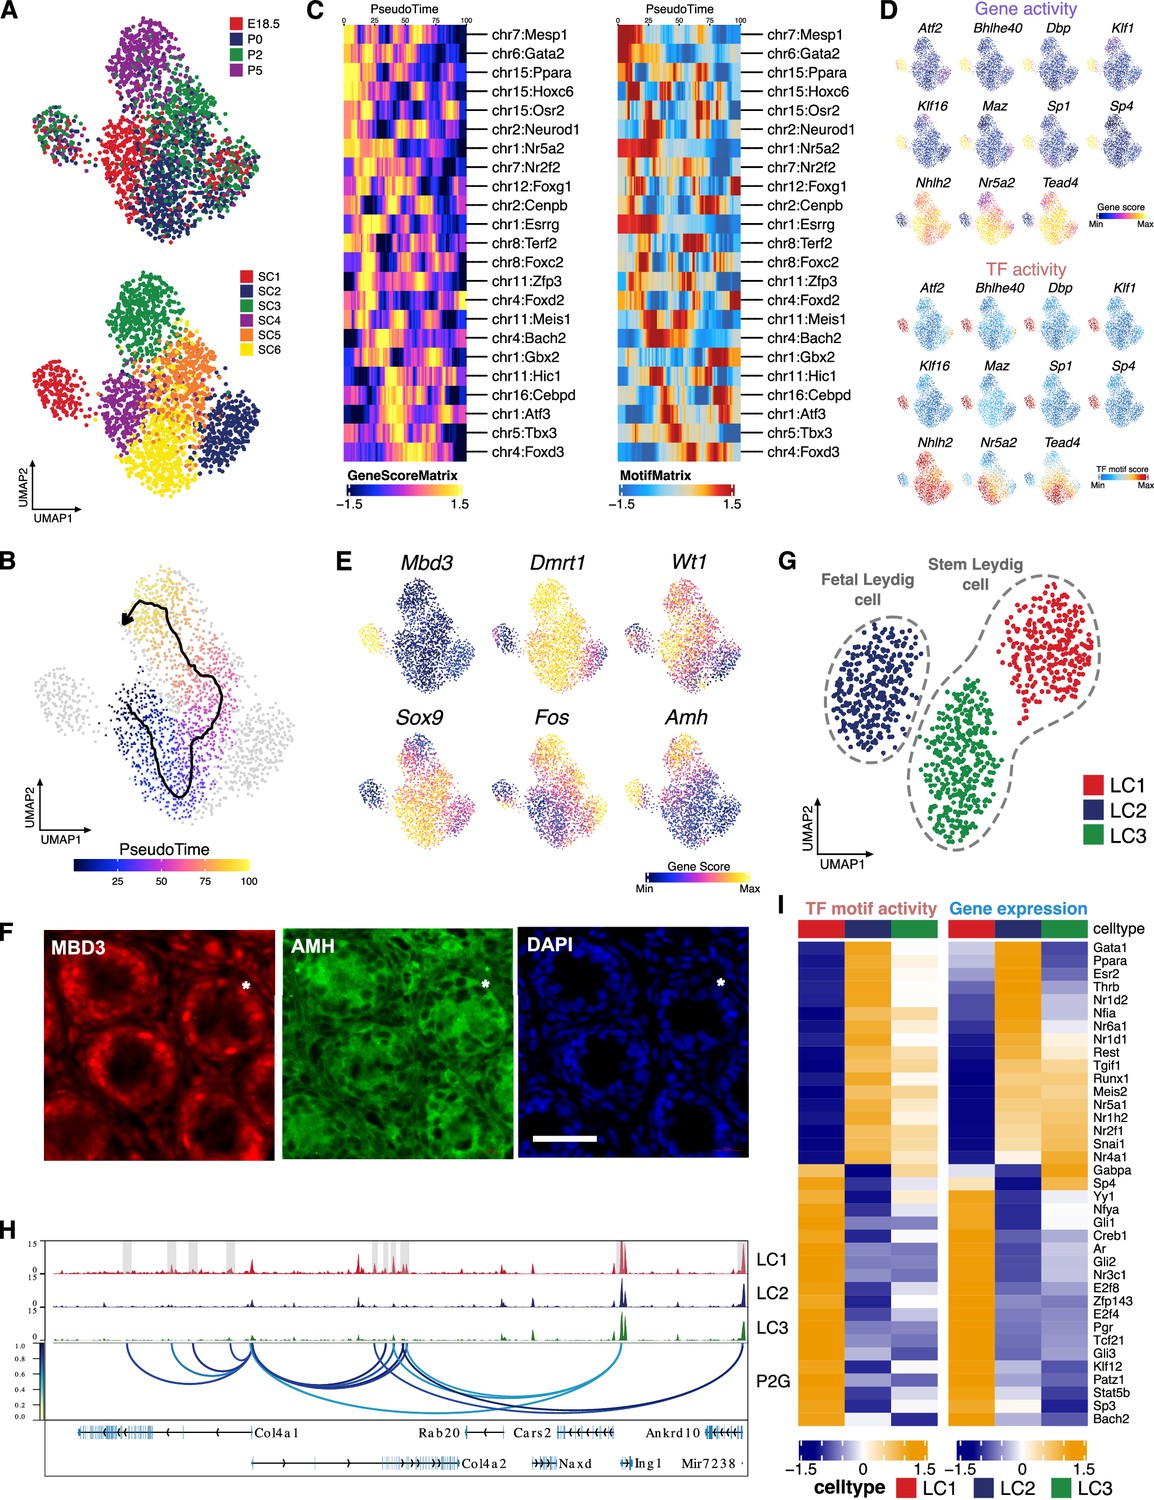
(A) Uniform manifold approximation and projection (UMAP) representation of germ cells. Cells are colored by time points (left) and clustering based on constrained integration with scRNA-Seq data (right). (B) Heatmaps of differential transcription factor (TF) motif activity (left) and gene activity (right) of positive TF regulators across cell clusters (correlation >0.5, adjusted p-value <0.01). (C) TF overlay on scATAC UMAP of gene expression (top) and TF chromVAR deviations (bottom) for positive TF regulator examples in B. (D) Representative confocal images of immunostaining on sections from P6 testis demonstrate that a subset of germ cells (TRA98+) express the Sertoli cell marker NR5A1 (arrowhead), while the majority of germ cells are NR5A1-negative (arrow). Scale bar = 50 μm. (E) Gene activity of Ngn3 shown in UMAP.
Figure 4—figure supplement 1
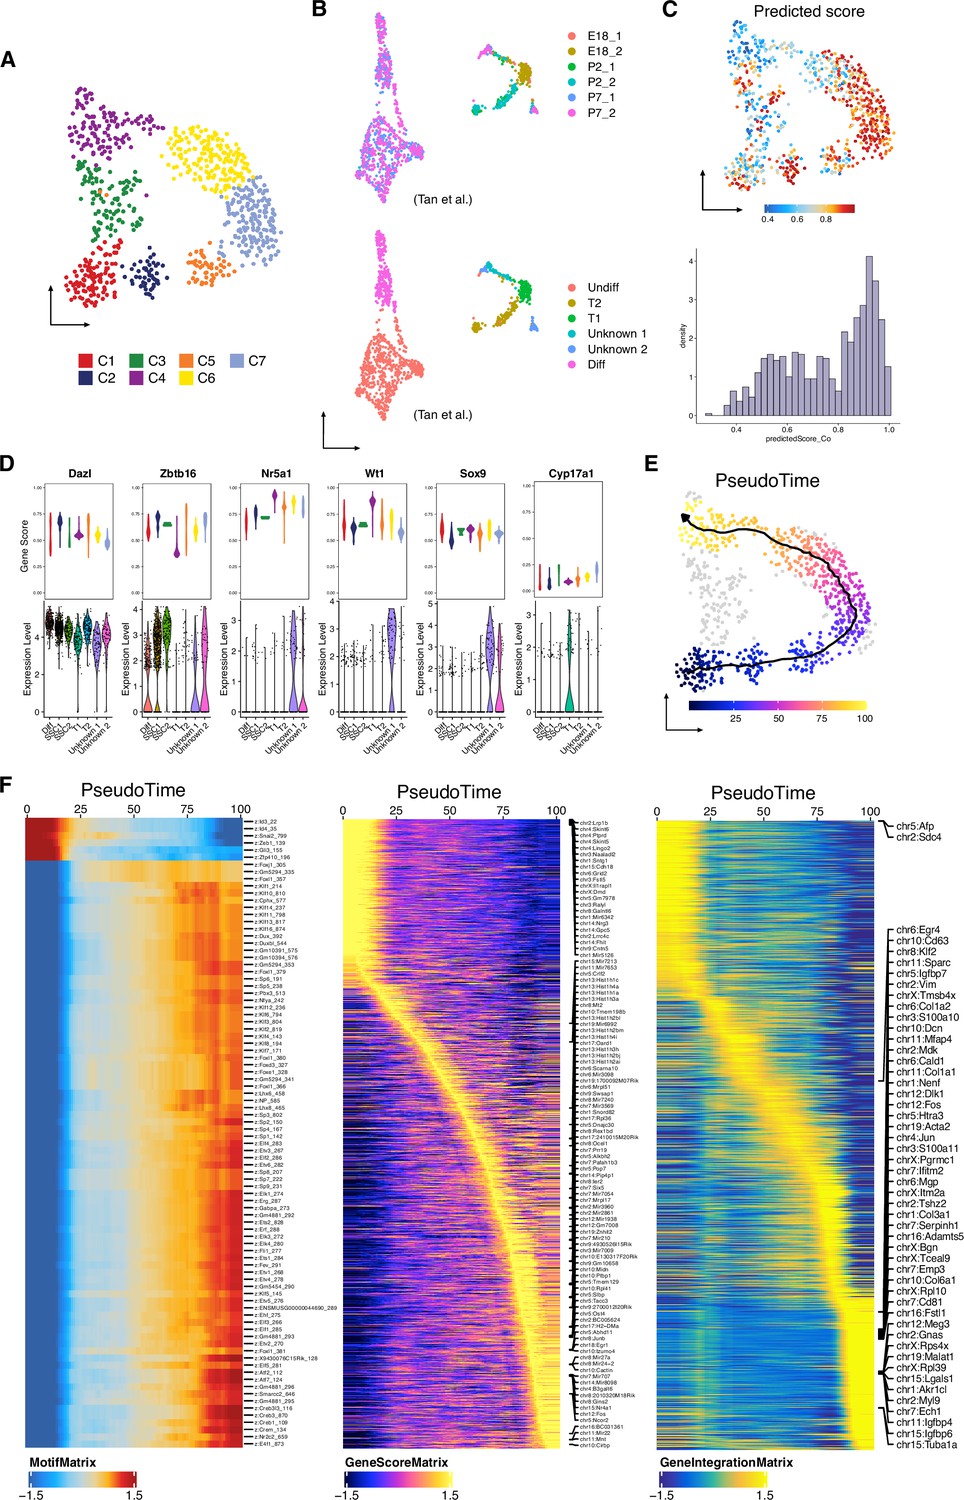
Identification of germ cells during the perinatal period, related to Figure 4.
(A) Uniform manifold approximation and projection (UMAP) representation of the germ cells. Cells are colored by cell clusters. (B) UMAP representation of the germ cells from scRNA-Seq dataset after re-clustering. Cells are colored by time points (top) and by cell clusters (bottom). (C) Predicted score of constrained integration with scRNA-Seq data shown in UMAP (top). Histogram of predicted score of constrained integration with scRNA-Seq data (bottom). (D) Violin plots showing gene score (single-cell sequencing assay for transposase-accessible chromatin [scATAC-Seq]) and mRNA expression (scRNA-Seq) of germ cell and Sertoli cell marker genes. (E) scATAC-Seq profiles are ordered by pseudotime, corresponding to the perinatal developmental trajectory. (F) Smoothened heatmap showing dynamic motif accessibility (left), gene score (middle), and gene expression (right) of indicated TFs along pseudotime.
Figure 4—figure supplement 2
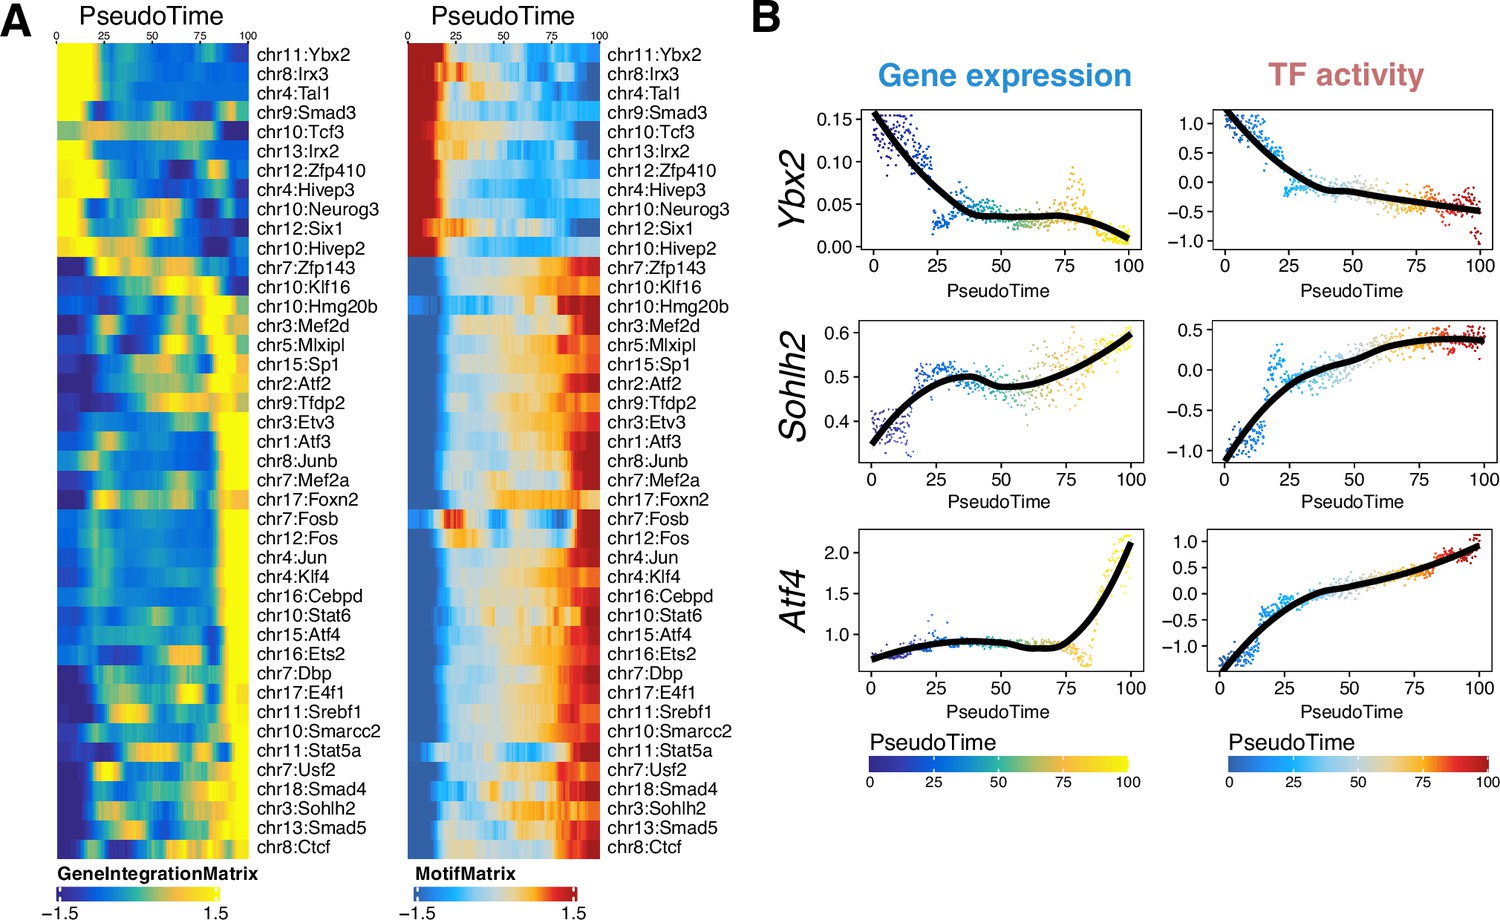
Reconstruction of germ cell developmental trajectory, related to Figure 4.
(A) Smoothened heatmaps showing dynamic gene expression (left) and motif accessibility (right) of indicated transcription factors (TFs) along pseudotime for gene-motif pairs of the trajectory in Figure 6C. (B) Gene expression (left) and motif accessibility (right) of selected TFs ordered by pseudotime.
Figure 4—figure supplement 3
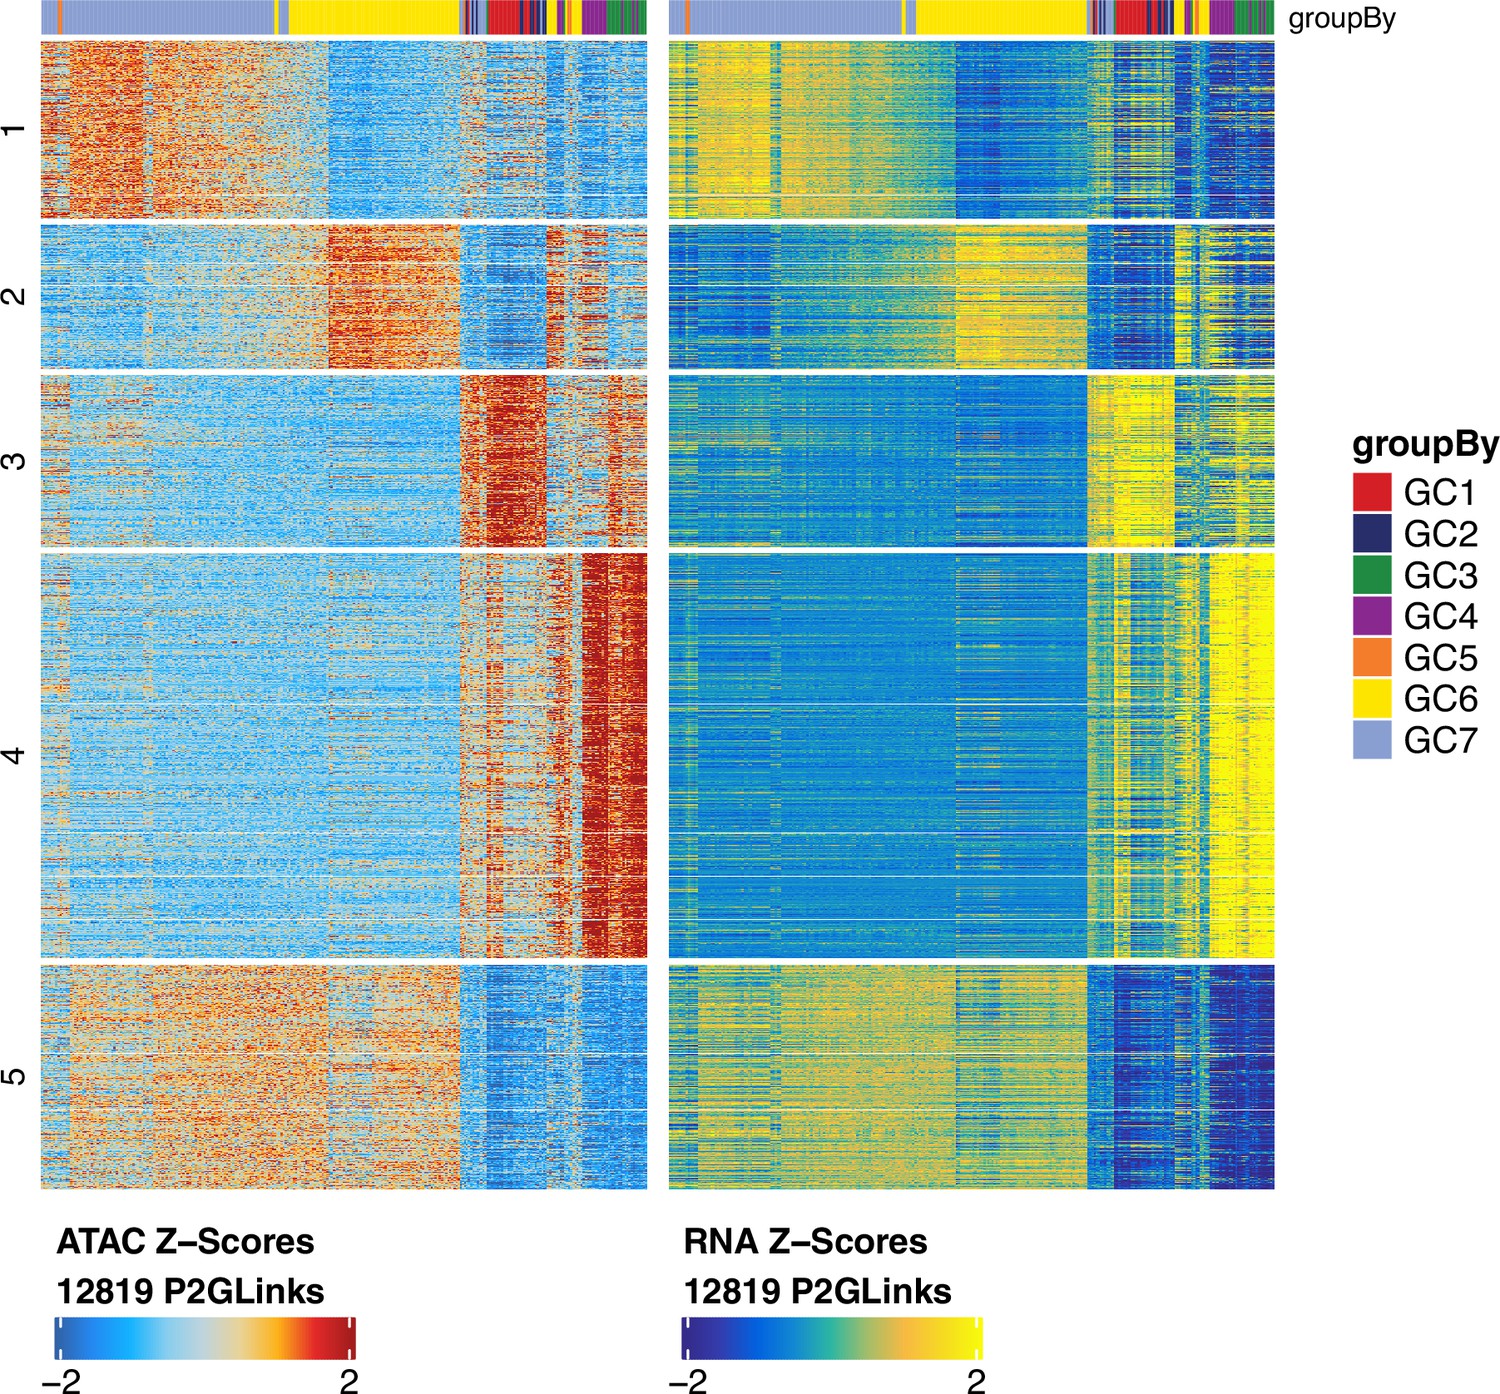
Heatmaps showing peak accessibility (left) and gene expression (right) of 12,819 peak-to-gene linkages across germ cell clusters, related to Figure 4.
Figure 4—figure supplement 4
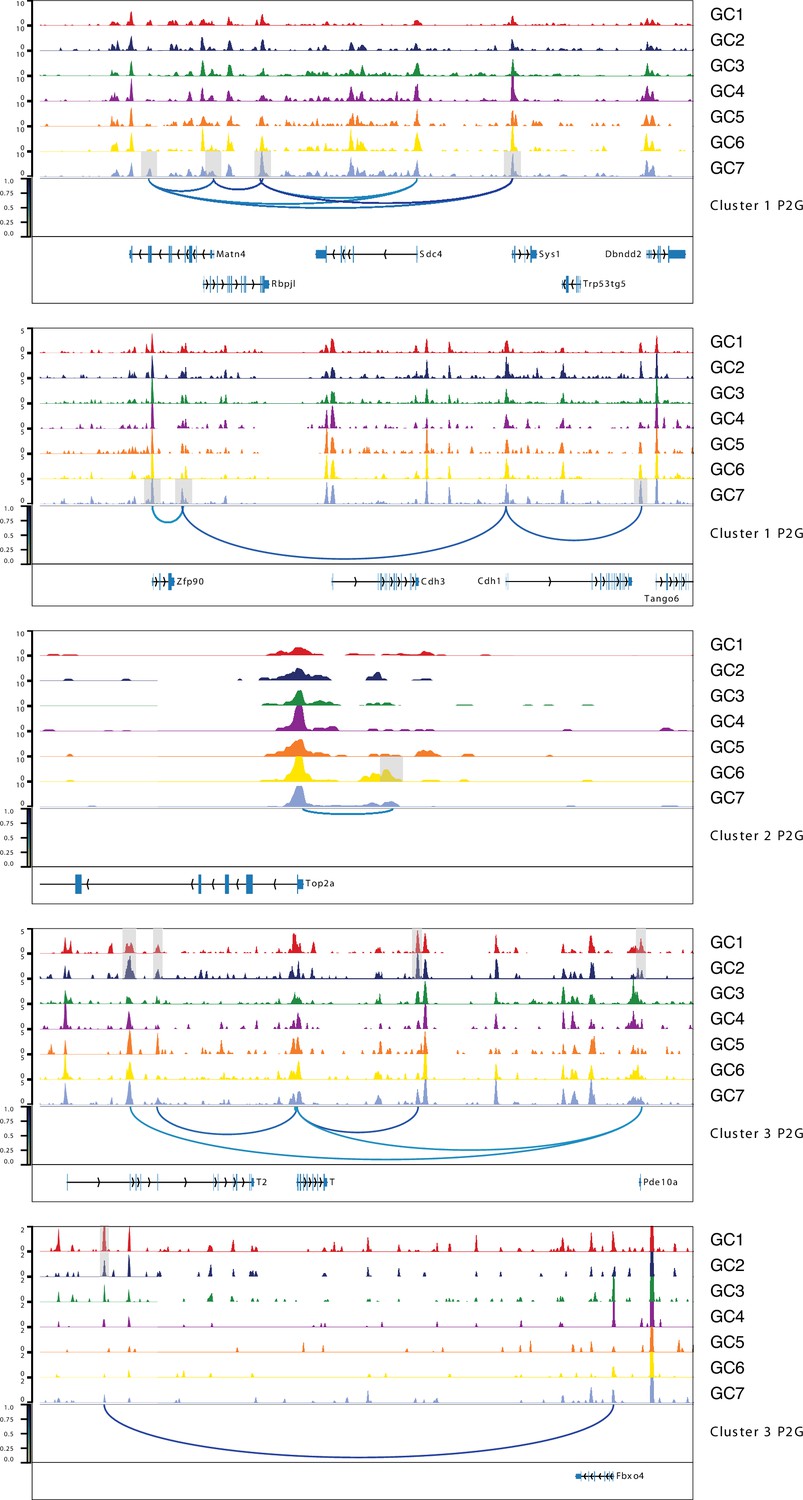
Aggregated single-cell sequencing assay for transposase-accessible chromatin (scATAC-Seq) profiles showing germ cell peak-to-gene links to the selected gene examples from Figure 4—figure supplement 3, related to Figure 4.
Figure 5 with 3 supplements
Identification of Sertoli and Leydig cell clusters during the perinatal period.
(A) Uniform manifold approximation and projection (UMAP) representation of Sertoli cells. Cells are colored by time points (upper panel) and cell clusters (lower panel). (B) Single-cell sequencing assay for transposase-accessible chromatin (scATAC-Seq) profiles are ordered by pseudotime, corresponding to the perinatal development trajectory. (C) Smoothened heatmaps showing dynamic gene score (left) and motif accessibility (right) of indicated transcription factors (TFs) along pseudotime for gene-motif pairs of the trajectory in B. (D) TF overlay on scATAC UMAP of gene activity scores (top) and TF chromVAR deviations (bottom) for positive TF regulators in C. (E) Gene activity scores of Mbd3, Fos, and Sertoli cell marker genes (Dmrt1, Wt1, Amh, and Sox9) shown in UMAP. (F) Representative confocal images of immunostaining on sections from P6 testis reveal that Sertoli cells exhibit diverse expression patterns of MBD3 and AMH, such as MBD3-high/AMH-high (arrowhead), MBD3-low/AMH-low (arrow), and MBD3-low/AMH-high (asterisk). Cell nuclei were stained with DAPI. Scale bar = 50 μm. (G) UMAP representation of Leydig cells. Cells are colored by cell clusters. (H) Aggregated scATAC-Seq profiles showing peak-to-gene links to the Col4a1 and Col4a2 loci in C1 cluster. (I) Heatmaps of differential TF motif activity (left) and gene expression (right) of positive TF regulators (correlation >0.5, adjusted p-value <0.01).
Figure 5—figure supplement 1
Identification of Sertoli and Leydig cell clusters during the perinatal period, related to Figure 5.
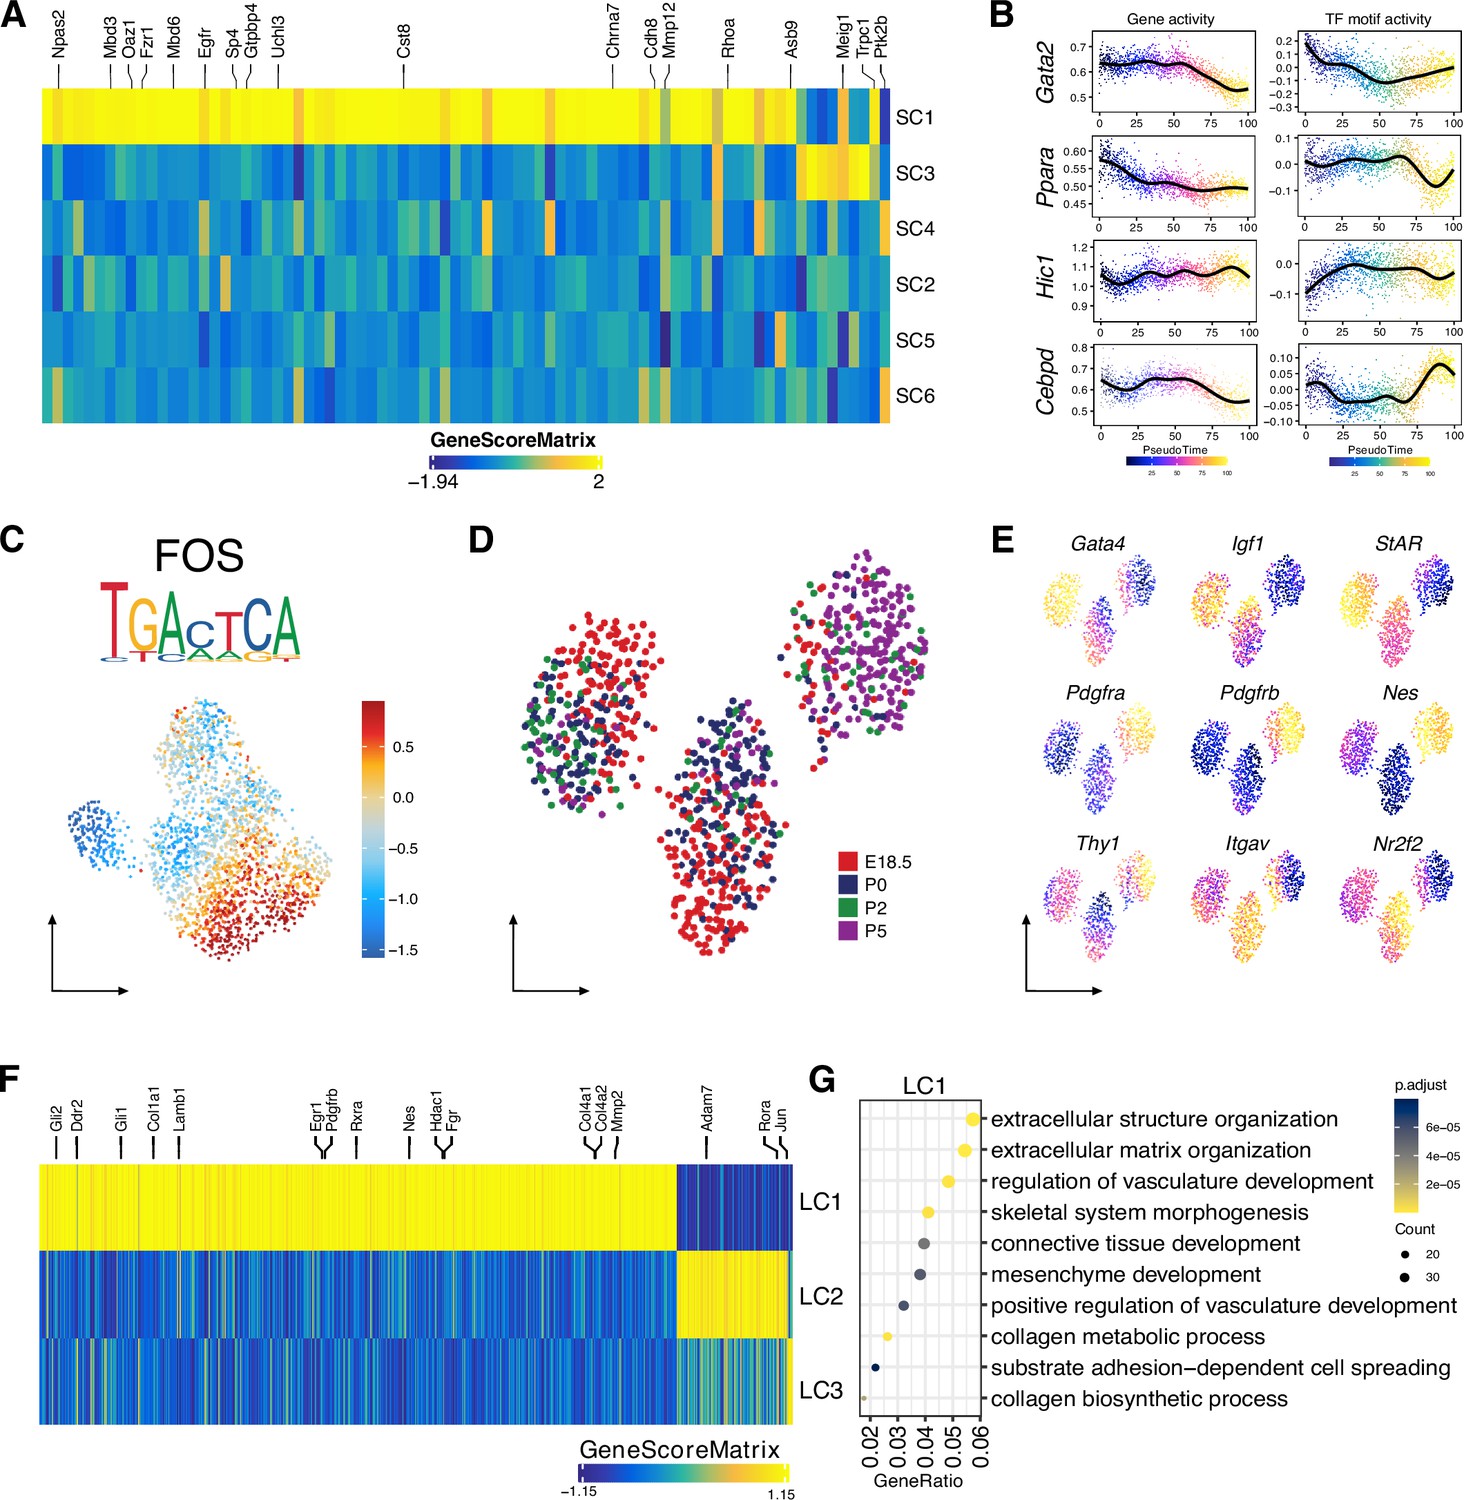
(A) Heatmap of 81 marker genes across cell clusters (FDR <0.1, log2FC >0.5). (B) Gene score (left) and motif accessibility (right) of selected transcription factors (TFs) ordered by pseudotime. (C) Uniform manifold approximation and projection (UMAP) showing the motif accessibility of FOS across cell clusters. Logo of underlying sequences is shown above. (D) UMAP representation of Leydig cells. Cells are colored by time points. (E) Gene activity scores of Leydig cell marker genes (fetal Leydig cell [FLC]: Gata4, Igf1, StAR; stem Leydig cell [SLC]: Itgav, Nr2f2, Pdgfra, Pdgfrb, Nes, Thy1) shown in UMAP. (F) Heatmap of 761 marker genes across cell clusters (FDR <0.1, log2FC >0.5). (G) Top results from the Gene Ontology (GO) enrichment test showing the terms associated with marker genes in cluster LC1 as shown in F.
Figure 5—figure supplement 2
Identification of peritubular myoid cell (PTM) and stromal cell clusters during the perinatal period.
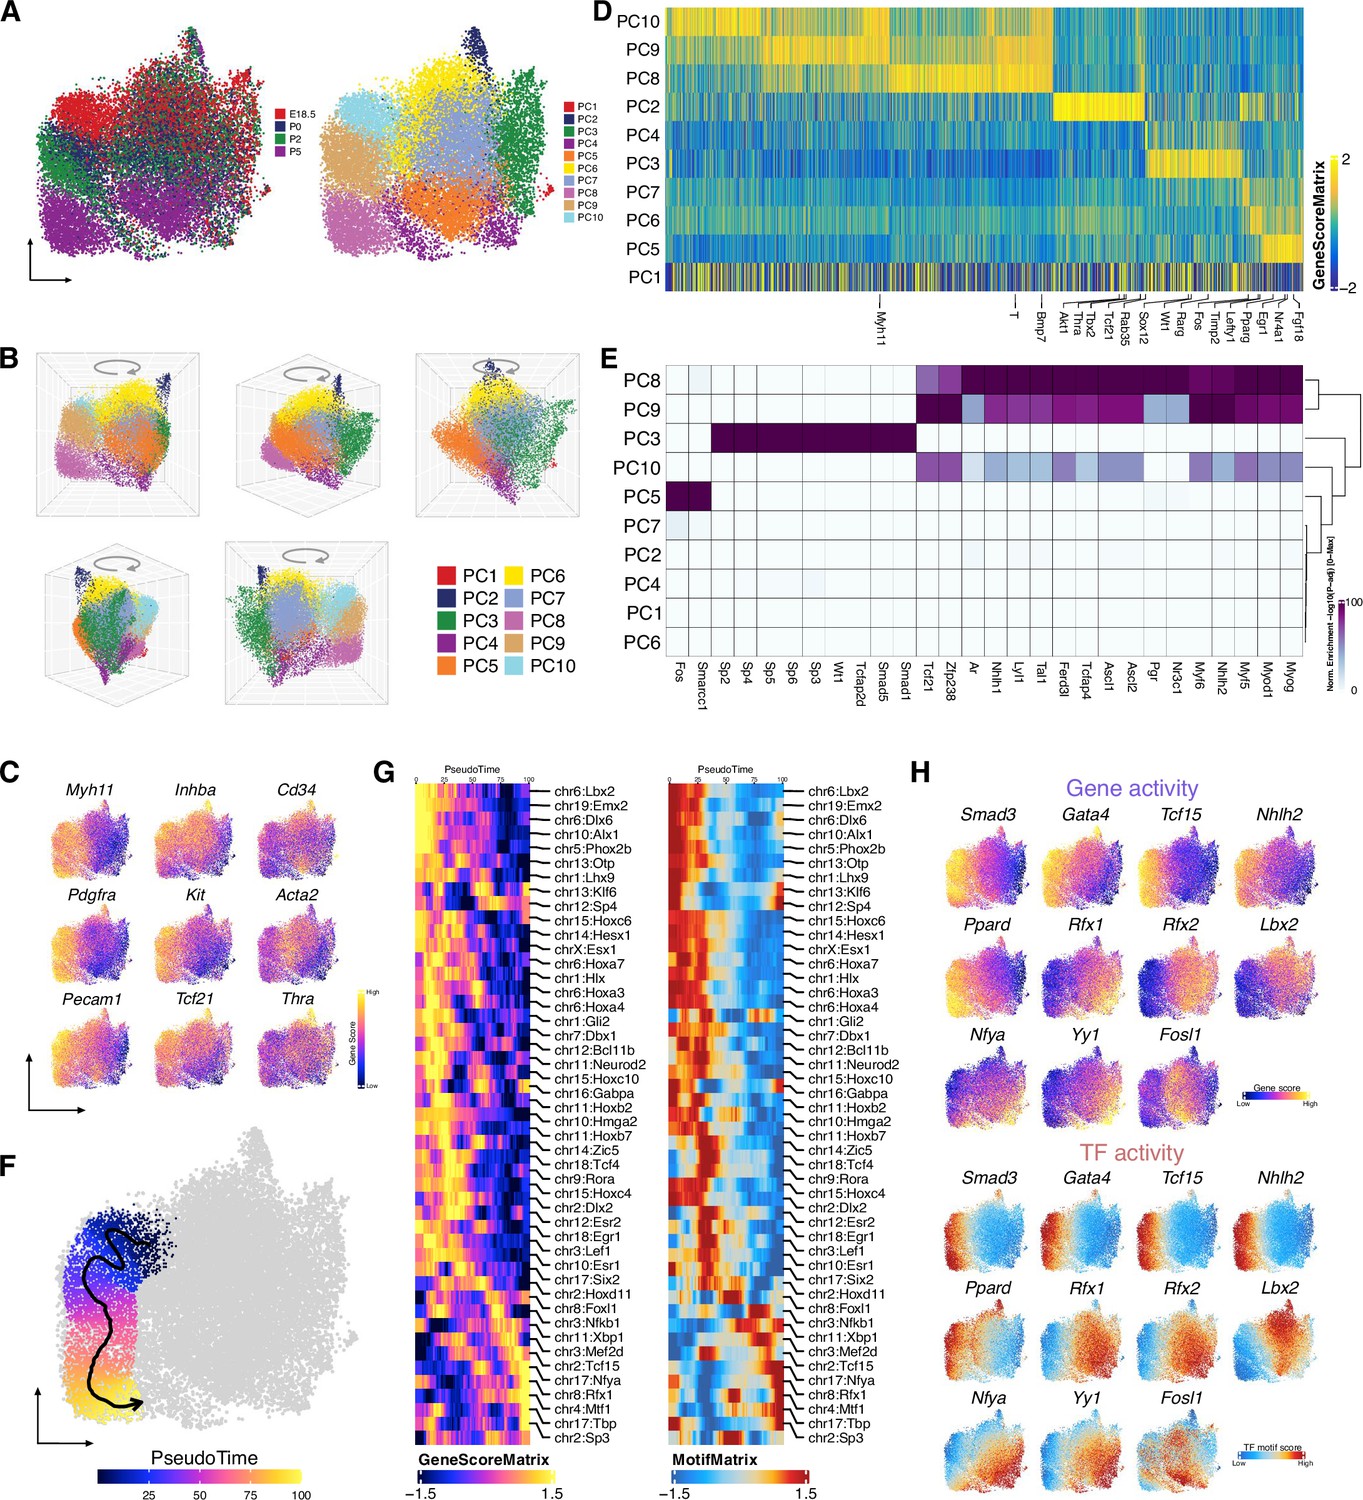
(A) Uniform manifold approximation and projection (UMAP) representation of PTMs and stromal cells. Cells are colored by time points (left) and by cell clusters (right). (B) Cell clusters visualized by UMAP in 3D. (C) Gene activity scores of selected genes shown in UMAP. (D) Heatmap showing the gene score of 1927 marker genes across cell clusters (FDR <0.1, log2FC >0). (E) Heatmap of enriched motifs (FDR ≤ 0.1, log2FC ≥ 0.05) across cell clusters. (F) Single-cell sequencing assay for transposase-accessible chromatin (scATAC-Seq) profiles are ordered by pseudotime, corresponding to the perinatal development trajectory based on time points. (G) Smoothened heatmap showing dynamic gene score (left) and motif accessibility (right) of indicated transcription factors (TFs) along pseudotime for gene-motif pairs of the trajectory in F. (H) TF overlay on scATAC UMAP of gene activity scores (top) and TF chromVAR deviations (bottom) for positive TF regulators across cell clusters (correlation >0.5, adjusted p-value <0.01).
Figure 5—figure supplement 3
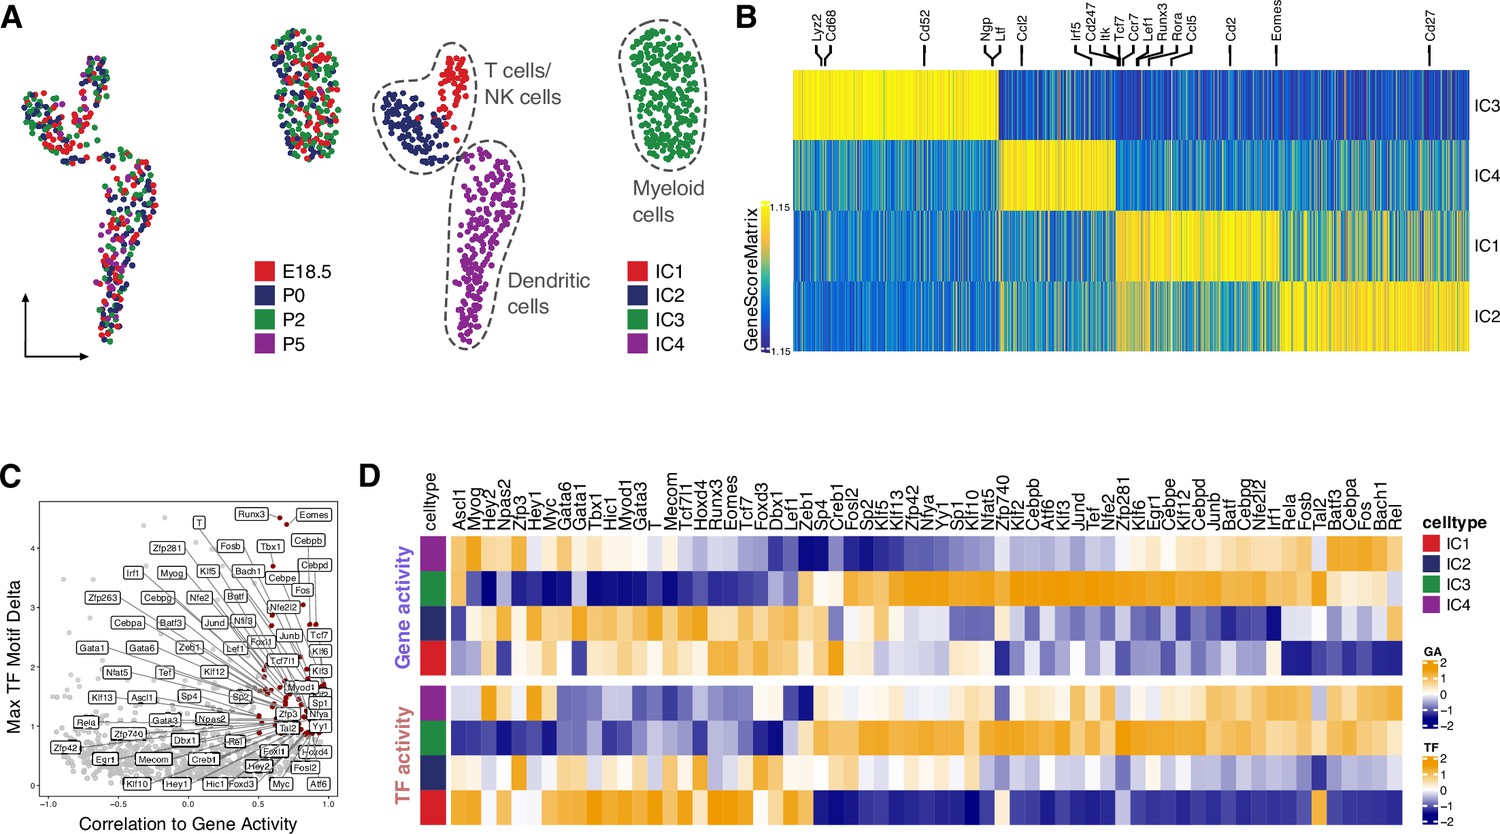
Identification of blood cell clusters during the perinatal period.
(A) Uniform manifold approximation and projection (UMAP) representation of the Leydig cells. Cells are colored by time points (left) and by cell clusters (right). (B) Heatmap showing the gene score of 3427 marker genes across cell clusters (FDR <0.1, log2FC >0.5). (C) Scatter plot of positive transcription factor (TF) regulators in blood cells identified by correlation between gene expression and TF motif activity (correlation >0.5, adjusted p-value <0.01). (D) Heatmaps showing differential gene activity (top) and TF motif activity (bottom) of positive TF regulators in C across cell clusters.
Figure 6
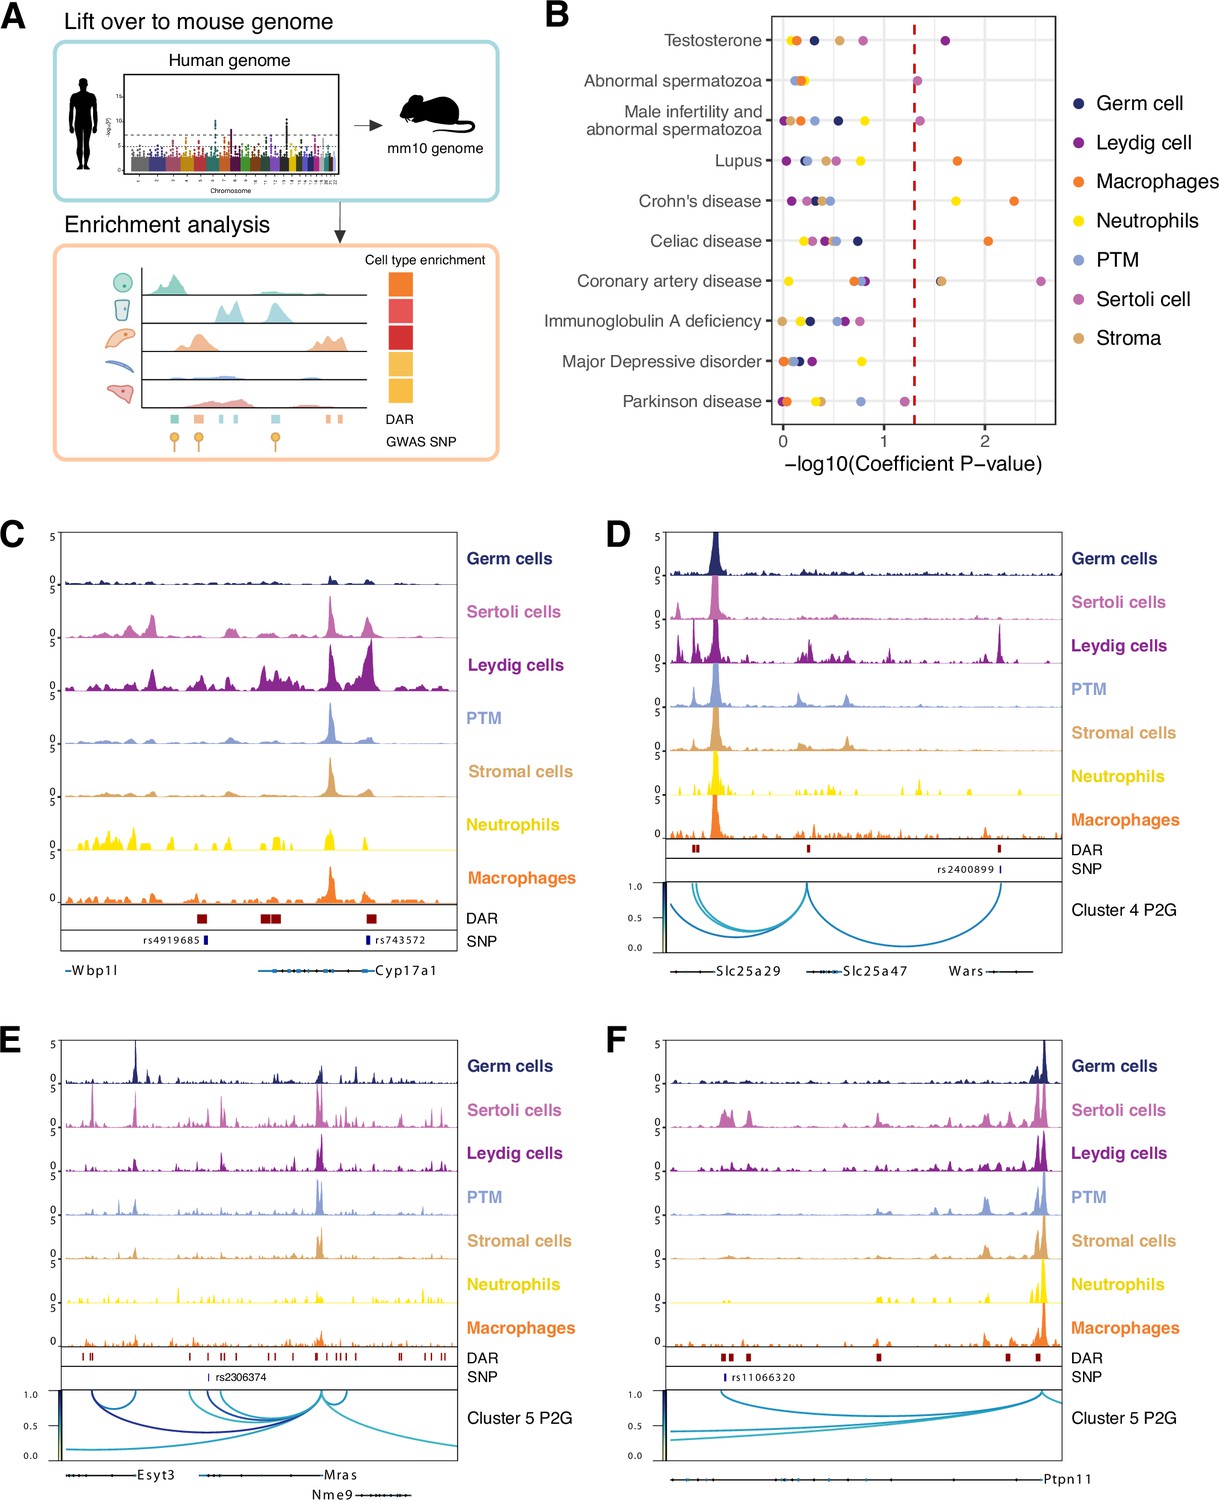
Single-cell chromatin accessibility identified human genome-wide association study (GWAS) targets in mouse testis.
(A) Illustration of heritability enrichment analysis. (B) Enrichment of heritability for the selected traits within the cell type-specific differentially accessible chromatin regions (DARs). (C) Aggregated single-cell sequencing assay for transposase-accessible chromatin (scATAC-Seq) profiles showing genetic variants (SNPs) overlapped with Leydig cell-specific DARs located at Cyp17a1 locus. (D) Aggregated scATAC-Seq profiles showing SNPs overlapped with Leydig cell-specific DARs and peak-to-gene links to the Slc25a47 locus. (E) Aggregated scATAC-Seq profiles showing SNPs overlapped with Sertoli cell-specific DARs and peak-to-gene links to the Mras locus. (F) Aggregated scATAC-Seq profiles showing SNPs overlapped with Sertoli cell-specific DARs and peak-to-gene links to the Ptpn11 locus.
Additional files
-
Supplementary file 1
List of top 2000 variable genes identified from scRNA-Seq data used in the integration analysis.
- https://cdn.elifesciences.org/articles/75624/elife-75624-supp1-v3.xlsx
-
Supplementary file 2
List of all peaks (accessible chromatin regions) identified from all cells.
- https://cdn.elifesciences.org/articles/75624/elife-75624-supp2-v3.zip
-
Supplementary file 3
Sequencing metrics of single-cell sequencing assay for transposase-accessible chromatin (scATAC-Seq) libraries.
- https://cdn.elifesciences.org/articles/75624/elife-75624-supp3-v3.xlsx
-
Supplementary file 4
List of differentially chromatin accessible regions (DARs) of each cell type.
- https://cdn.elifesciences.org/articles/75624/elife-75624-supp4-v3.xlsx
-
Supplementary file 5
List of peak-to-gene links identified across cell types.
- https://cdn.elifesciences.org/articles/75624/elife-75624-supp5-v3.xlsx
-
Supplementary file 6
List of antibodies and dilutions.
- https://cdn.elifesciences.org/articles/75624/elife-75624-supp6-v3.xlsx
-
MDAR checklist
- https://cdn.elifesciences.org/articles/75624/elife-75624-mdarchecklist1-v3.pdf
Download links
A two-part list of links to download the article, or parts of the article, in various formats.
Downloads (link to download the article as PDF)
Open citations (links to open the citations from this article in various online reference manager services)
Cite this article (links to download the citations from this article in formats compatible with various reference manager tools)
The single-cell chromatin accessibility landscape in mouse perinatal testis development
eLife 12:e75624.
https://doi.org/10.7554/eLife.75624


