Repressing PTBP1 fails to convert reactive astrocytes to dopaminergic neurons in a 6-hydroxydopamine mouse model of Parkinson’s disease
- Guangdong Provincial Key Laboratory of Brain Function and Disease, Zhongshan School of Medicine, Sun Yat-sen University, China
- Department of Pharmacology, Zhongshan School of Medicine, Sun Yat-sen University, China
Figures
Figure 1 with 1 supplement
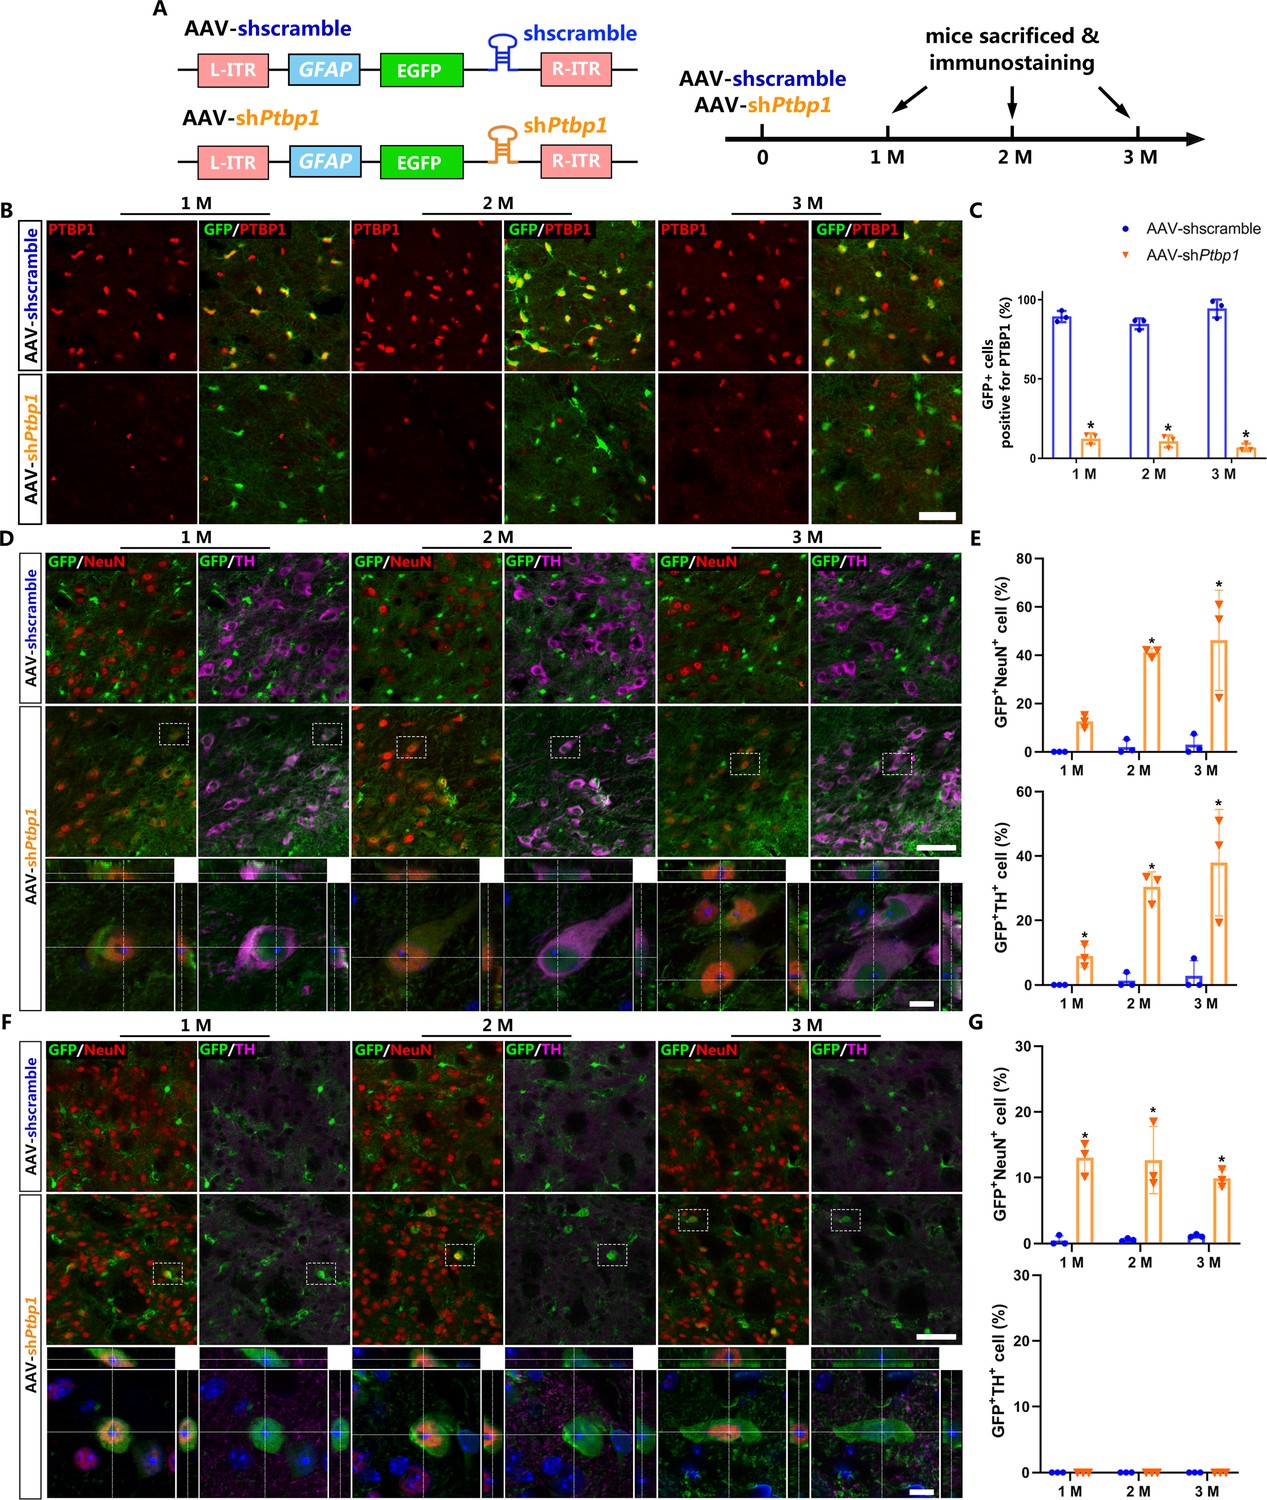
Viral-reporter-labeled neurons including dopaminergic neurons are induced in the substantia nigra and striatum after adeno-associated virus (AAV)-shPtbp1 delivery.
(A) Schematic of AAV-shPtbp1 and AAV-shscramble vector design and the experimental design. (B) Representative images of brain slices co-stained with polypyrimidine tract binding protein 1 (PTBP1) (red) and GFP (green) at indicated timepoints after AAV-shPtbp1 or AAV-shscramble delivery in the substantia nigra. Scale bar, 50 μm. (C) Quantitative data of GFP+PTBP1+ cells ratio from (B) are shown. Representative images of brain slices co-stained GFP (green) with tyrosine hydroxylase (TH; purple) or NeuN (red) at indicated timepoints after AAV-shPtbp1 or AAV-shscramble delivery in the substantia nigra (D) and striatum (F), the enlarged 3D reconstruction of boxed individual neurons are shown in the lower panel (counterstained with Hoechst–blue). Scale bars: low magnification, 75 μm; high magnification, 10 μm. Quantitative data of GFP+NeuN+ or GFP+NeuN+ cells ratio from the substantia nigra (D) and striatum (F) are shown in (E) and (G). n = 3 biological repeats per group. Data are presented as mean ± SEM. * indicates a significant difference between AAV-shPtbp1 and AAV-shscramble (p<0.05). Two-way ANOVA followed by Tukey’s multiple comparisons test is used. (C) F(2,12) = 5.297, 1 M: p<0.0001; 2 M: p<0.0001; 3 M: p<0.0001. (E) F(2,12) = 5.321, 1 M: p=0.5220; 2 M: p=0.0016; 3 M: p=0.0007. (G) F(2,12) = 1.132, 1 M: p=0.0004; 2 M: p=0.0006; 3 M: p=0.0085.
-
Figure 1—source data 1
Brain slices co-stained with PTBP1 (red) and GFP (green) at indicated timepoints after AAV-shPtbp1 or AAV-shscramble delivery in the substantia nigra for Figure 1B, C.
- https://cdn.elifesciences.org/articles/75636/elife-75636-fig1-data1-v2.zip
-
Figure 1—source data 2
Brain slices co-stained GFP (green) with TH (purple) or NeuN (red) at indicated timepoints after AAV-shPtbp1 or AAV-shscramble delivery in the substantia nigra for Figure 1D, E.
- https://cdn.elifesciences.org/articles/75636/elife-75636-fig1-data2-v2.zip
-
Figure 1—source data 3
Brain slices co-stained GFP (green) with TH (purple) or NeuN (red) at indicated timepoints after AAV-shPtbp1 or AAV-shscramble delivery in the striatum for Figure 1F, G.
- https://cdn.elifesciences.org/articles/75636/elife-75636-fig1-data3-v2.zip
Figure 1—figure supplement 1
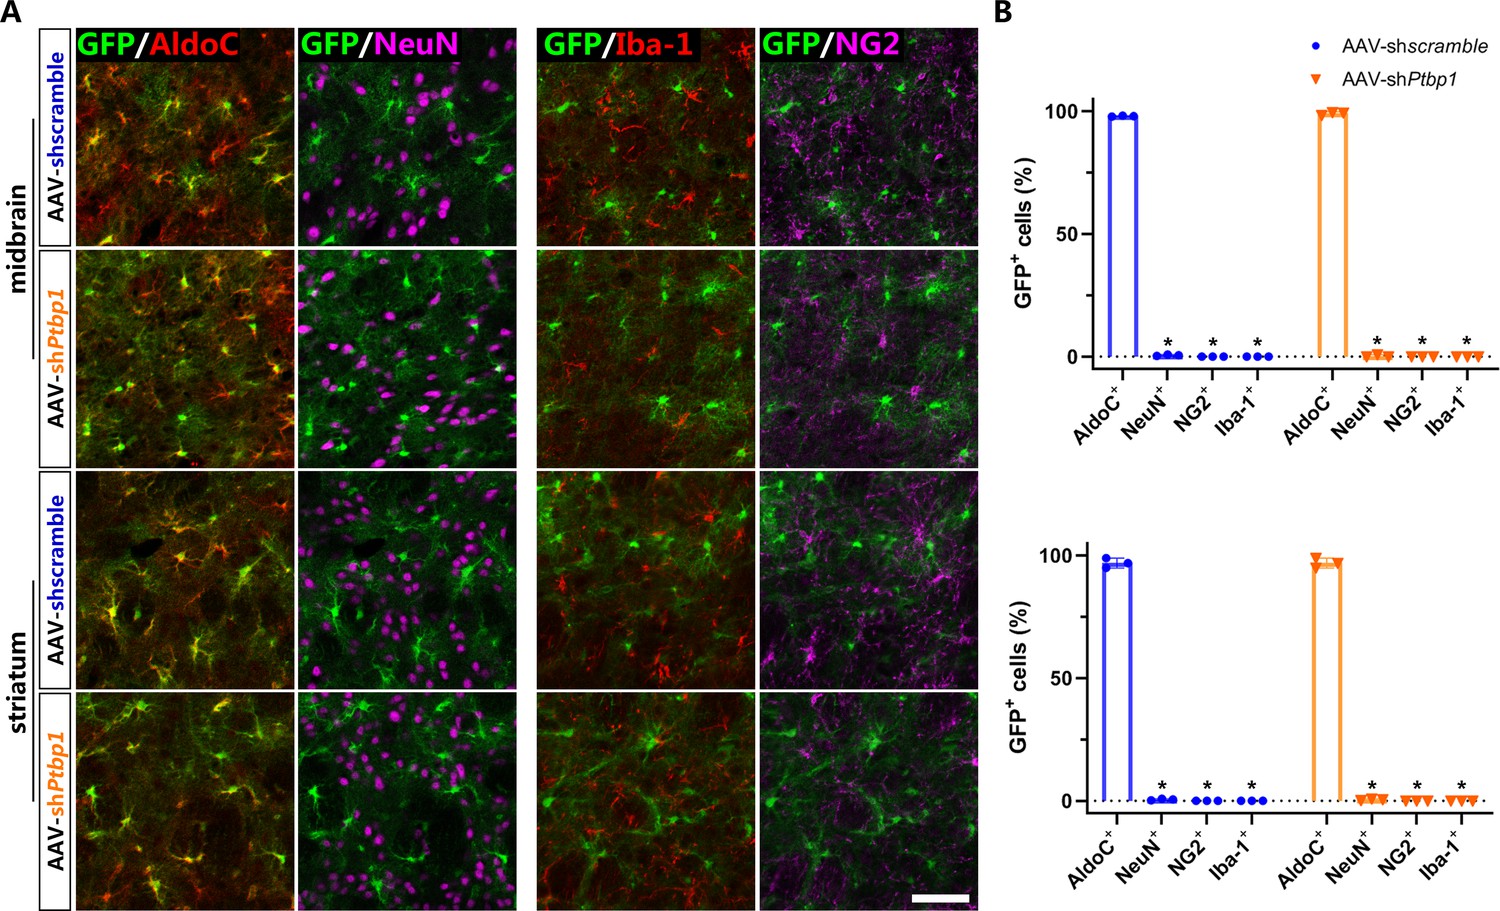
Adeno-associated virus (AAV)-shPtbp1 and AAV-shscramble predominantly infected astrocyte at early timepoint (7dpi).
(A) Representative images of brain slices co-stained with GFP (green) and AldoC (purple), NeuN (red), NG2(purple), or Iba-1(red) 7 days after AAV-shPtbp1 or AAV-shscramble delivery in the substantia nigra or striatum. Scale bar, 75 μm. (B) Ratio of GFP+ cells in the substantia nigra and striatum that shows positive staining for AldoC, NeuN, NG2, or Iba-1. n = 3 biological repeats per group. Data are presented as mean ± SEM. * indicates a significant difference (p<0.05). Two-way ANOVA (Turkey’s) is used. In the substantia nigra, F(3, 16) = 6.285. AAV-shscramble: AldoC vs NeuN, p<0.0001; AldoC vs NG2, p<0.0001; AldoC vs Iba-1, p<0.0001; AAV-shPtbp1: AldoC vs NeuN, p<0.0001; AldoC vs NG2, p<0.0001; AldoC vs Iba-1, p<0.0001. In the striatum, F(3, 16) = 0.000. AAV-shscramble: AldoC vs NeuN, p<0.0001; AldoC vs NG2, p<0.0001; AldoC vs Iba-1, p<0.0001; AAV-shPtbp1: AldoC vs NeuN, p<0.0001; AldoC vs NG2, p<0.0001; AldoC vs Iba-1, p<0.0001.
-
Figure 1—figure supplement 1—source data 1
Brain slices co-stained with GFP (green) and AldoC (purple), NeuN (red), NG2 (purple), or Iba-1 (red) 7days after AAV-shPtbp1 or AAV-shscramble delivery in the substantia nigra or striatum for Figure 1—figure supplement 1.
- https://cdn.elifesciences.org/articles/75636/elife-75636-fig1-figsupp1-data1-v2.zip
Figure 2 with 1 supplement
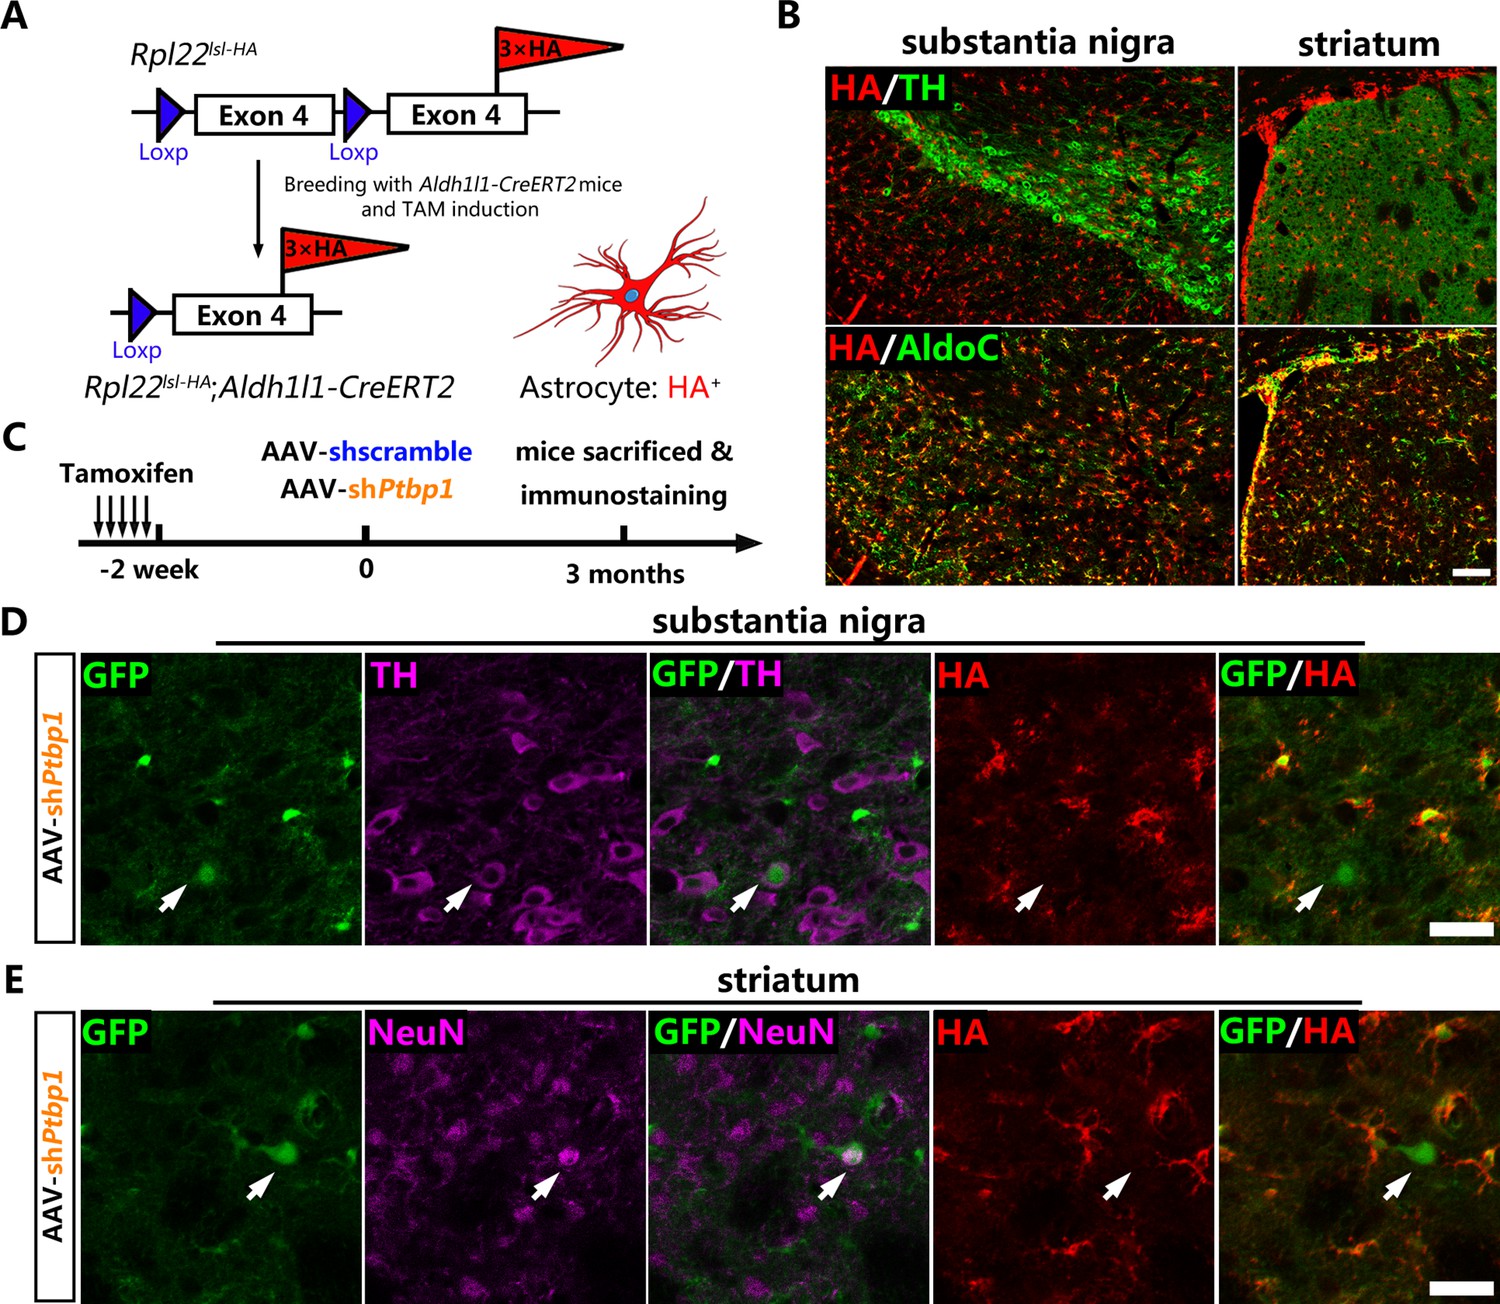
No viral-reporter-labeled neuron including dopaminergic neuron is derived from quiescent astrocytes AAV-shPtbp1 delivery.
(A) Schematic of breeding strategy of Aldh1l1-CreERT2;Rpl22lsl-HA lineage-tracing mice. (B) Experimental design of Tamoxifen (TAM) induction and representative images of the substantia nigra or striatum of Aldh1l1-CreERT2;Rpl22lsl-HA mice co-stained hemagglutinin (HA) (red) with pan-astrocyte marker AldoC (green) and tyrosine hydroxylase (TH) (purple) 2 weeks after TAM administration. Scale bar, 100 μm. (C) Schematic of experimental design. Representative images of brain slices co-stained GFP (green), HA (red) with TH (purple) in the substantia nigra (D) or with NeuN (purple) in striatum (E) 3 months after AAV-shPtbp1 delivery. n = 3 biological repeats per group. Arrows indicate GFP/TH (D) or GFP/NeuN (E) double positive neurons that are HA negative. Scale bar, 75 μm.
-
Figure 2—source data 1
Indicated brain regions of Aldh1l1-CreERT2;Rpl22lsl-HA mice co-stained hemagglutinin (red) with pan-astrocyte marker AldoC (green) and tyrosine hydroxylase (purple) 2 weeks after Tamoxifen administration for Figure 2B.
- https://cdn.elifesciences.org/articles/75636/elife-75636-fig2-data1-v2.zip
-
Figure 2—source data 2
Brain slices co-stained GFP (green), HA (red) with TH (purple) in the substantia nigra 3 months after AAV-shPtbp1 delivery for Figure 2D.
- https://cdn.elifesciences.org/articles/75636/elife-75636-fig2-data2-v2.zip
-
Figure 2—source data 3
Brain slices co-stained GFP (green), hemagglutinin (red) with NeuN (purple) in the striatum 3 months after adeno-associated virus-shPtbp1 delivery for Figure 2E.
- https://cdn.elifesciences.org/articles/75636/elife-75636-fig2-data3-v2.zip
Figure 2—figure supplement 1
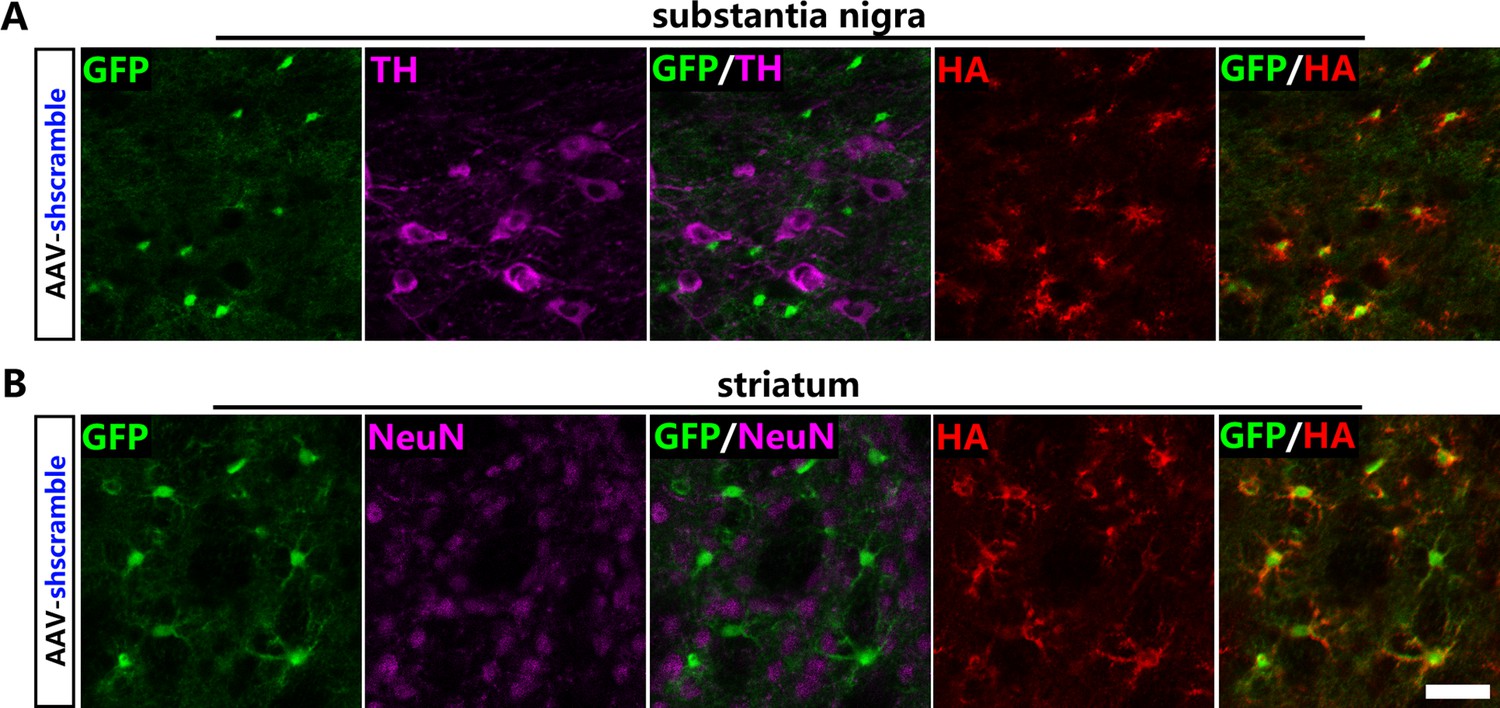
Representative images of brain slices co-stained GFP (green), hemagglutinin (HA; red) with tyrosine hydroxylase (TH; purple) in the substantia nigra (A) or with NeuN (purple) in striatum (B) 3 months after adeno-associated virus (AAV)-shscramble delivery.
n = 2 biological repeats per group. Scale bar, 75 μm.
Figure 3

No neuron including dopaminergic neuron (DAn) is derived from reactive astrocytes in 6-hydroxydopamine (6-OHDA) model after polypyrimidine tract binding protein 1 (PTBP1) repression.
(A) Schematic of experimental design. (B) Representative images of the substantia nigra or striatum after 6-OHDA lesion co-stained with tyrosine hydroxylase (TH; green) and GFAP (red). Scale bar, 200 μm for the substantia nigra and 50 μm for the striatum. (C) Representative images of brain slices of Aldh1l1-CreERT2;Rpl22lsl-HA mice subjected to 6-OHDA lesion and adeno-associated virus (AAV)-shPtbp1 or AAV-shscramble injection in substantia (upper panel) and striatum (lower panel), co-stained with GFP (cyan), hemagglutinin (HA; red) and NeuN (green) or TH(green). Scale bar, 50 μm. Number of NeuN+ neurons (D) and TH+ DAns (E) in the substantia nigra 3 months after treatment with AAV-shPtbp1 or AAV-shscramble on 6-OHDA lesioned mice. n = 5 mice for AAV-shscramble group; n = 8 mice for AAV-shPtbp1 group. (F) Apomorphine-induced rotation test before and 3 months after AAV-shPtbp1 or AAV-shscramble delivery on 6-OHDA lesioned mice. n = 8 mice for AAV-shPtbp1 group; n = 5 mice for AAV-shscramble group. Data are presented as mean ± SEM. Unpaired t test is used in (D) F(4, 7) = 3.266, p=0.4627 and (E) F(4, 7) = 3.856 p=0.5534. Unpaired t test is used in (F) 0 M AAV-shPtbp1 vs AAV-shscramble F(7, 4) = 3.59, p=0.3669; 3 M AAV-shPtbp1 vs AAV-shscramble F(7, 4) = 2.157, p=0.7915. Paired t test is used in (F), AAV-shscramble 3 M vs 0 M: p=0.0489, df = 4; AAV-shPtbp1 3 M vs 0 M: p=0.068, df = 7.
-
Figure 3—source data 1
Brain slices of the substantia nigra or striatum after 6-OHDA lesion, co-stained with TH (green) and GFAP (red) for Figure 3B.
- https://cdn.elifesciences.org/articles/75636/elife-75636-fig3-data1-v2.zip
-
Figure 3—source data 2
Brain slices of Aldh1l1-CreERT2;Rpl22lsl-HA mice subjected to 6-OHDA lesion and AAV-shPtbp1 or AAV-shscramble injection in substantia or striatum, co-stained with GFP (green) and HA (red), or NeuN (green) and HA (red), or TH(green) and HA (red) for Figure 3C.
- https://cdn.elifesciences.org/articles/75636/elife-75636-fig3-data2-v2.zip
-
Figure 3—source data 3
Original data and statistical analysis of Figure 3D and E for Figure 3D&E.
- https://cdn.elifesciences.org/articles/75636/elife-75636-fig3-data3-v2.zip
-
Figure 3—source data 4
Original data and statistical analysis of Figure 3F.
- https://cdn.elifesciences.org/articles/75636/elife-75636-fig3-data4-v2.zip
Figure 4 with 2 supplements

No neuron including dopaminergic neuron is derived from astrocytes with or without 6-hydroxydopamine (6-OHDA) lesion after antisense oligonucleotide (ASO)-mediated polypyrimidine tract binding protein 1 (PTBP1) repression.
(A) Schematic of experimental design. (B) Representative images of the brain slices of Aldh1l1-CreERT2;Rosa26lsl-YFP mice co-stained with YFP (green) and NeuN (red) or tyrosine hydroxylase (TH; purple) after ASO-Ptbp1 or ASO-Ctrl delivery in the substantia nigra. Scale bar, 75 μm. n = 6 mice for ASO-Ctrl group; n = 5 mice for ASO-Ptbp1 group. (C) Schematic of experimental design. (D) Representative images of brain slices of 6-OHDA lesioned Aldh1l1-CreERT2;Rpl22lsl-HA mice after ASO-Ptbp1 delivery in substantia nigra, co-stained with hemagglutinin (HA; green) and NeuN (red) or TH (purple). Scale bar, 75 μm. n = 2 mice for ASO-Ctrl group; n = 3 mice for ASO-Ptbp1 group. (E) Apomorphine-induced rotation test before and 2 months after ASO-Ptbp1 delivery in substantia nigra on 6-OHDA lesioned mice (n = 3 biological repeats). Data are presented as mean ± SEM. Paired t test is used in (E), p=0.1435, df = 2.
-
Figure 4—source data 1
Brain slices of Aldh1l1-CreERT2;Rosa26lsl-YFP mice co-stained with YFP (green) and NeuN (red) or TH (purple) after ASO-Ptbp1 or ASO-Ctrl delivery in the substantia nigra for Figure 4B.
- https://cdn.elifesciences.org/articles/75636/elife-75636-fig4-data1-v2.zip
-
Figure 4—source data 2
Brain slices of 6-OHDA lesioned Aldh1l1-CreERT2;Rpl22lsl-HA mice after ASO-Ptbp1 delivery in substantia nigra, co-stained with HA (green) and NeuN (red) or TH (purple) for Figure 4D.
- https://cdn.elifesciences.org/articles/75636/elife-75636-fig4-data2-v2.zip
-
Figure 4—source data 3
Original data and statistical analysis of Figure 4G.
- https://cdn.elifesciences.org/articles/75636/elife-75636-fig4-data3-v2.zip
Figure 4—figure supplement 1
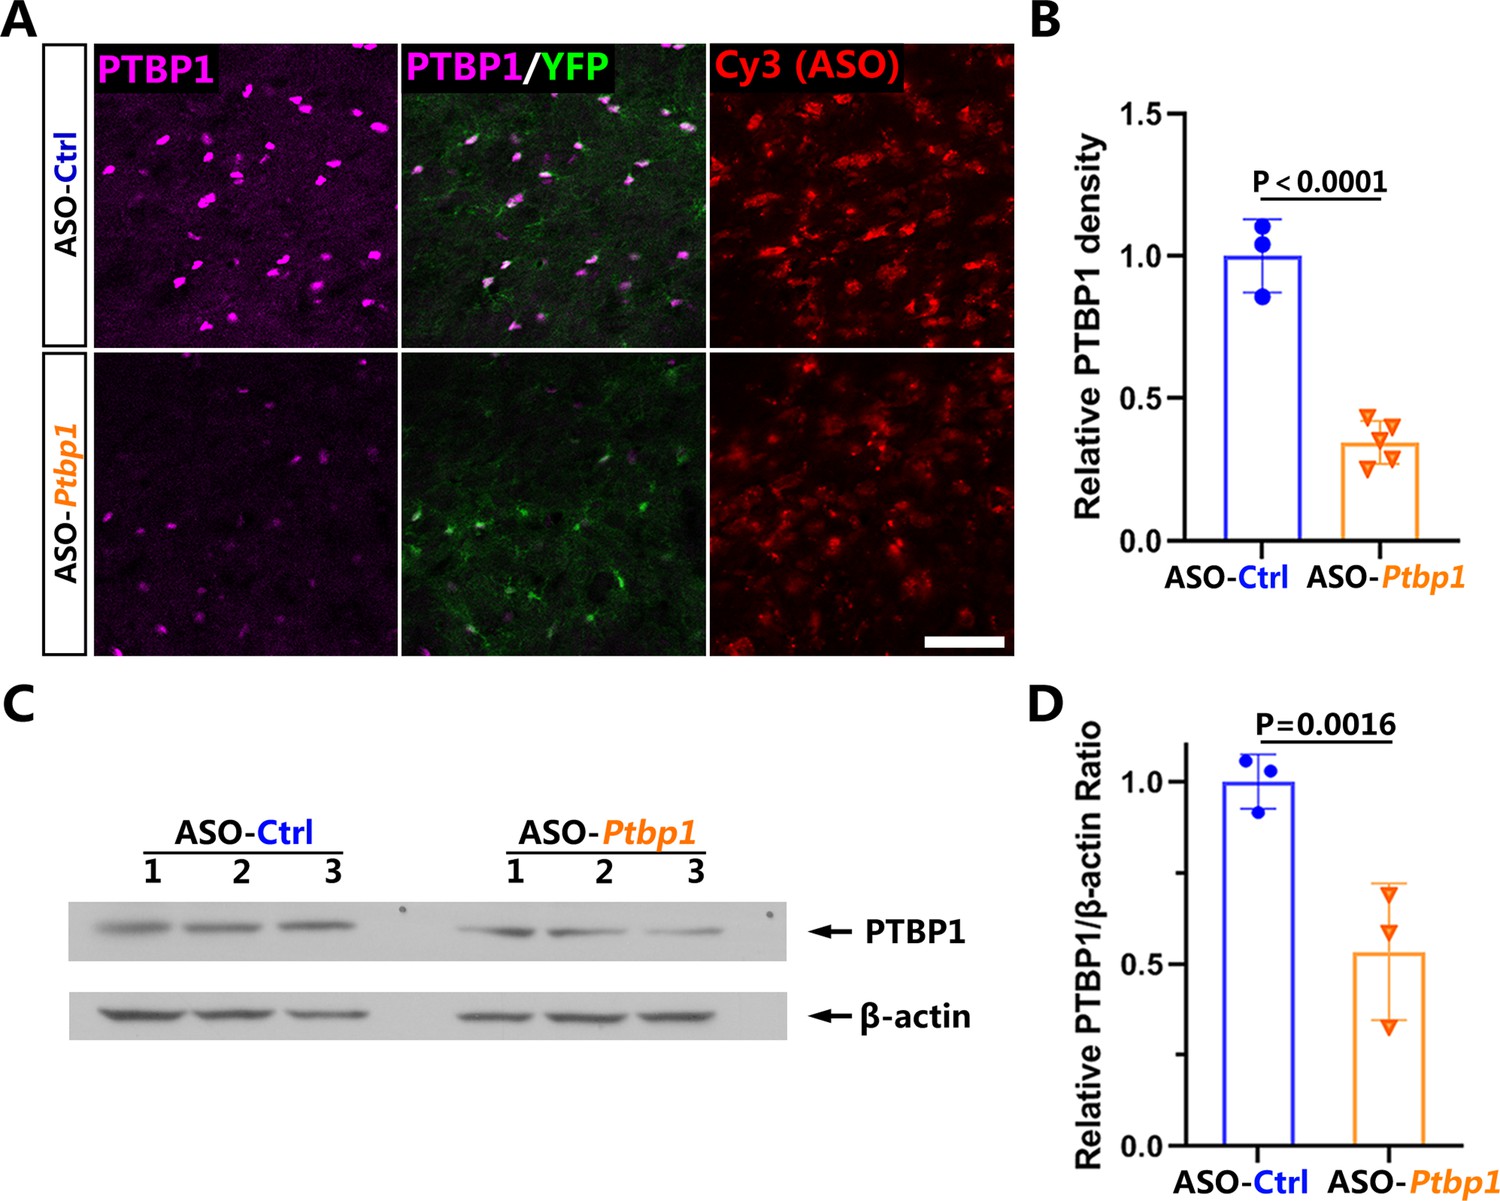
Knockdown efficiency of PTBP1 by ASO.
(A) In vivo knockdown efficiency of antisense oligonucleotide (ASO) by immunofluorescence. Representative images of the brain slices of Aldh1l1-CreERT2;Rosa26lsl-YFP mice co-stained with polypyrimidine tract binding protein 1 (PTBP1; purple), YFP (green), and Cy3 (red) after ASO-Ptbp1 or ASO-Ctrl delivery in the substantia nigra. n = 3 mice for ASO-Ctrl group; n = 5 mice for ASO-Ptbp1 group. Scale bar, 75 μm. (B) Quantitative data of relative PTBP1 intensity from (A) are shown. Unpaired t test is used. p<0.0001, F(2, 4) = 2.868. (C) In vivo knockdown efficiency of ASO by western blot, normalized against β-actin in mouse midbrain delivered with ASO-Ptbp1 or ASO-Ctrl (n = 3 biological repeats, respectively). (D) Quantitative data of relative PTBP1/β-actin ratio from (C) are shown. Unpaired t test is used. p=0.016, F(2, 2) = 6.268.
-
Figure 4—figure supplement 1—source data 1
Brain slices of Aldh1l1-CreERT2;Rosa26lsl-YFP mice co-stained with PTBP1 (purple), YFP (green), and Cy3 (red) after ASO-Ptbp1 or ASO-Ctrl delivery in the substantia nigra for Figure 4—figure supplement 1.
- https://cdn.elifesciences.org/articles/75636/elife-75636-fig4-figsupp1-data1-v2.zip
Figure 4—figure supplement 2
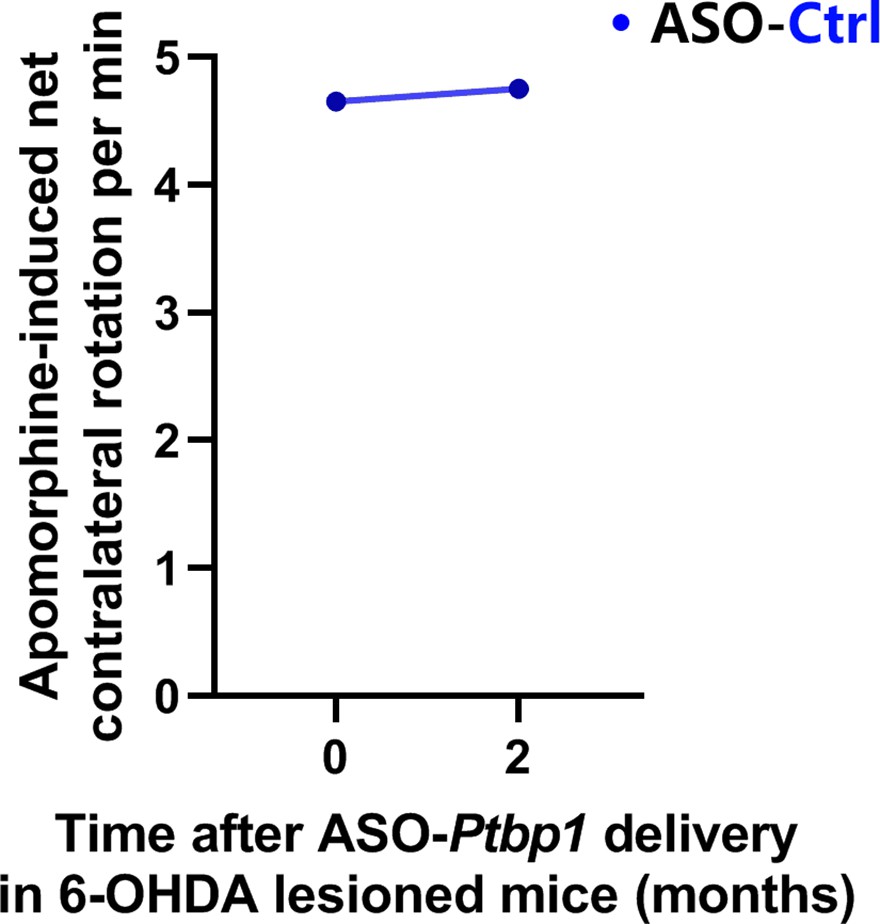
Apomorphine-induced rotation test before and 2 months after antisense oligonucleotide (ASO)-Ctrl delivery in substantia nigra on 6-hydroxydopamine lesioned mice (n = 1 biological repeat).
-
Figure 4—figure supplement 2—source data 1
Original data and statistical analysis of Figure 4—figure supplement 2.
- https://cdn.elifesciences.org/articles/75636/elife-75636-fig4-figsupp2-data1-v2.zip
Additional files
Download links
A two-part list of links to download the article, or parts of the article, in various formats.
Downloads (link to download the article as PDF)
Open citations (links to open the citations from this article in various online reference manager services)
Cite this article (links to download the citations from this article in formats compatible with various reference manager tools)
Repressing PTBP1 fails to convert reactive astrocytes to dopaminergic neurons in a 6-hydroxydopamine mouse model of Parkinson’s disease
eLife 11:e75636.
https://doi.org/10.7554/eLife.75636


