Conditional and unconditional components of aversively motivated freezing, flight and darting in mice
- Staglin Center for Brain and Behavioral Health, Department of Psychology, Department of Psychiatry and Biobehavioral Sciences, University of California, Los Angeles, United States
Figures
Figure 1 with 1 supplement
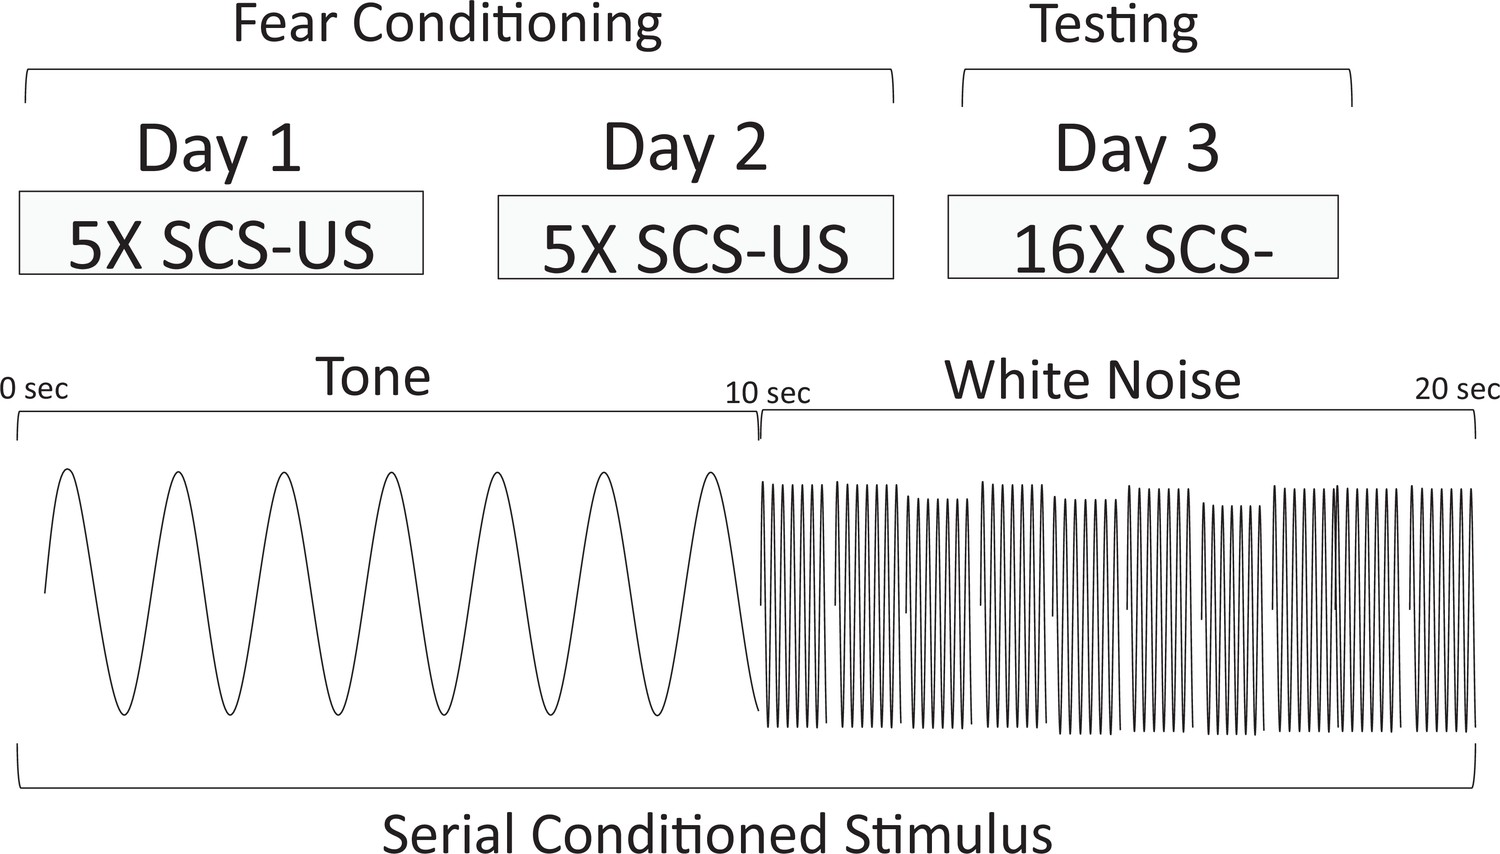
Behavioral design and schematic representation of the serial compound conditional stimulus (SCS) used for the Replication Group in Experiment 1.
During training, animals were given 2 days each of five SCS-US pairings. The SCS consisted of a 10 s pure tone (7.5 kHz) followed by a 10 s white noise (75 dB). Immediately upon termination of the white noise-SCS, a footshock US (1 s, 0.9 mA) was delivered. On day 3, the animals were tested with 16 presentations of the SCS without delivering any shocks.
Figure 1—figure supplement 1
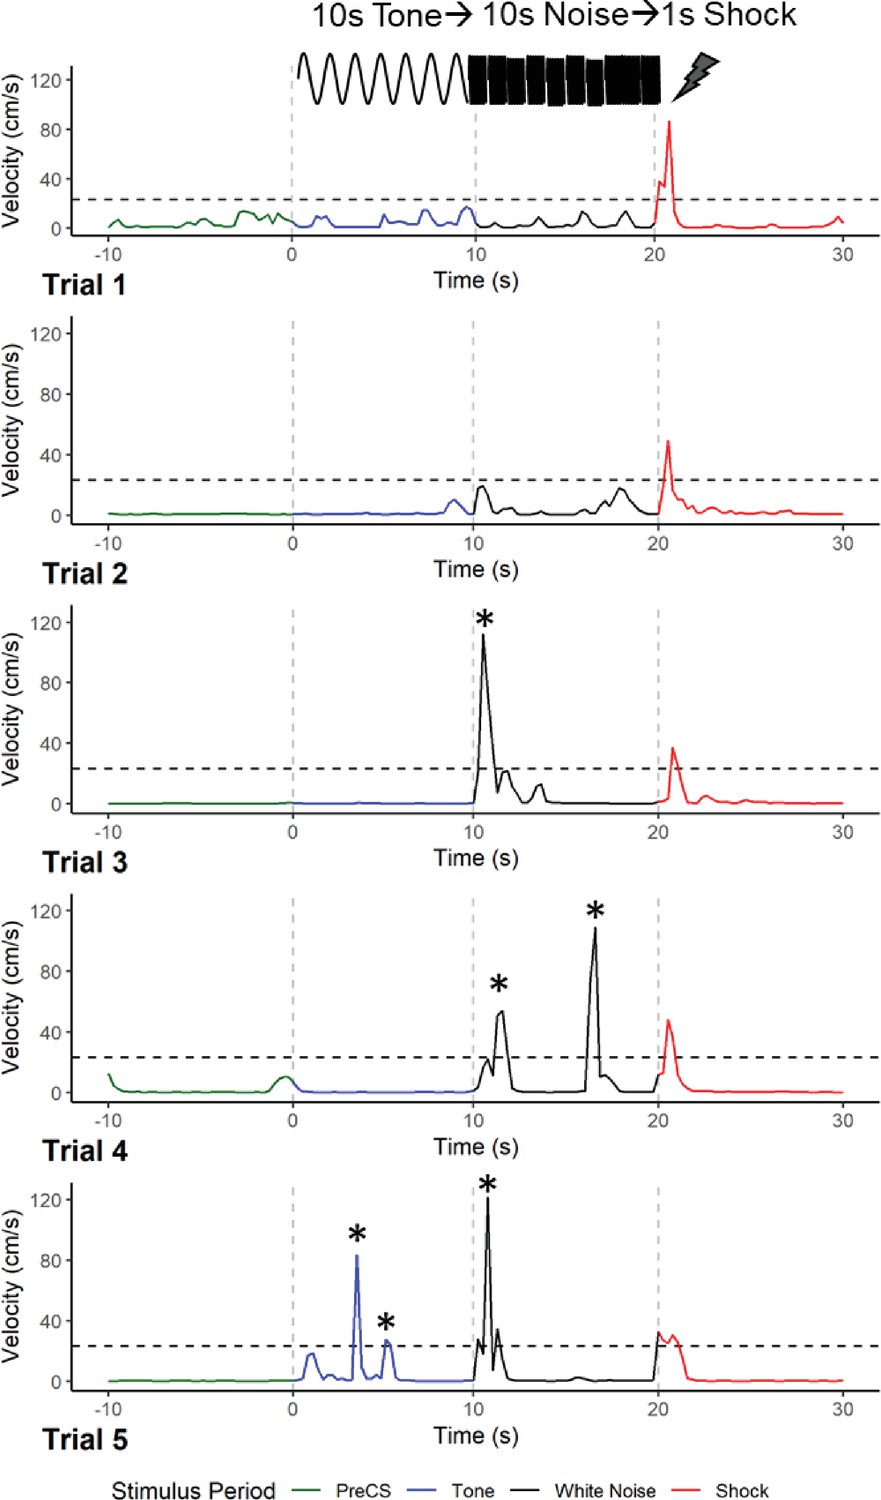
Example traces of velocity (cm/s) measurements obtained via EthoVision across five trials on the first day of training for a mouse in the Replication Group of Experiment 1.
Vertical dotted lines denote stimulus onset times and the horizontal dotted line is the threshold for scoring behavior as a dart (22.9 cm/s). Darting episodes are marked with an *. See Figure 1—figure supplement 1—source data 1.
-
Figure 1—figure supplement 1—source data 1
Source files for velocity used to create representative traces.
- https://cdn.elifesciences.org/articles/75663/elife-75663-fig1-figsupp1-data1-v2.xlsx
Figure 2 with 1 supplement
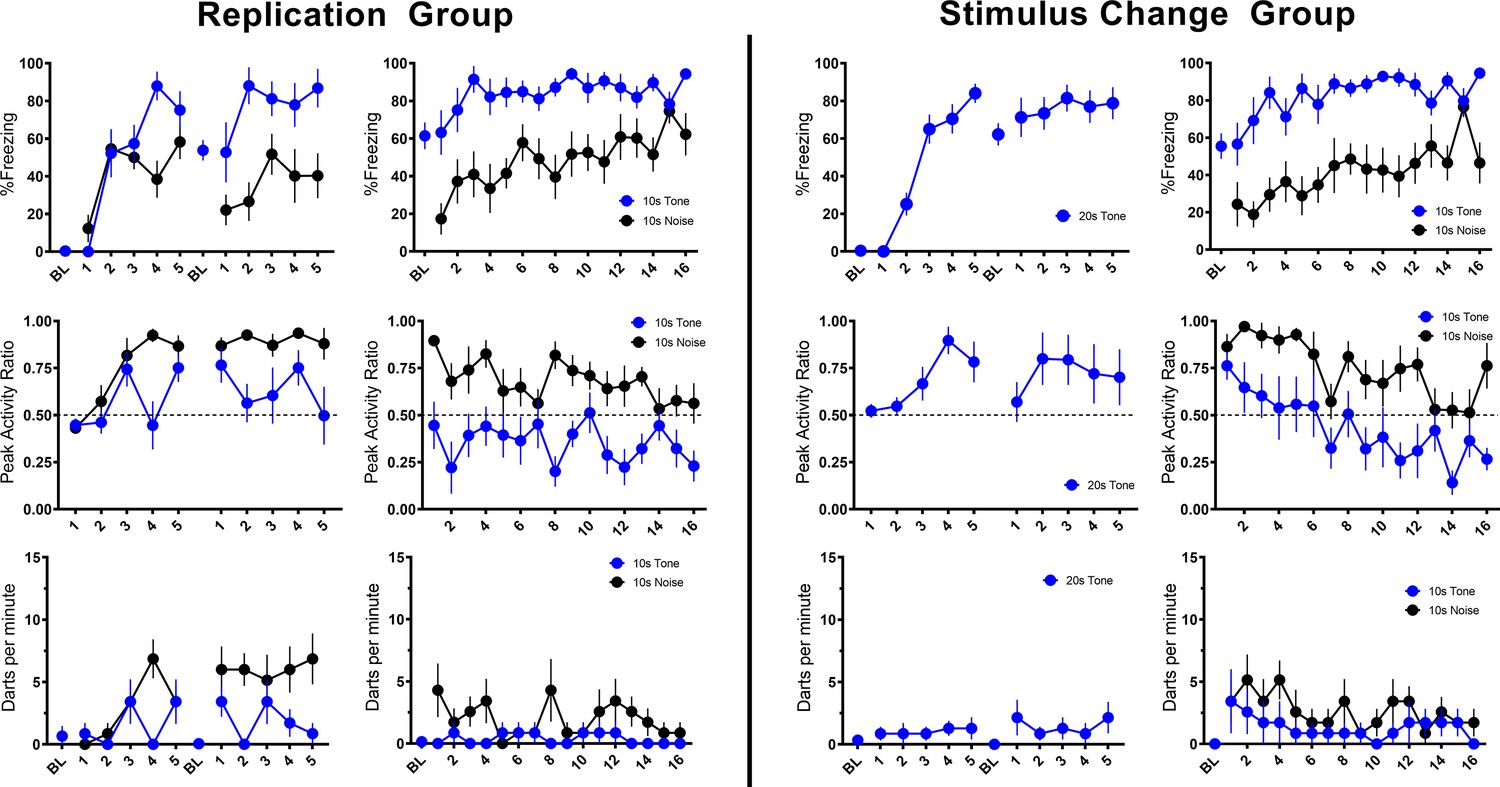
Trial-by-trial mean (±SEM) percent freezing, peak activity ratio, and darts per minute throughout all stimulus presentations during training (left panels) and testing (right panels) for the Replication Group (n=7; left half of figure) and the Stimulus Change Group (n=7; right half of figure) in Experiment 1.
-
Figure 2—source data 1
Source files for freezing, PAR, and darting for Experiment 1-Replication and Stimulus Change groups.
- https://cdn.elifesciences.org/articles/75663/elife-75663-fig2-data1-v2.xlsx
-
Figure 2—source data 2
Source files for velocity for all of Experiment 1.
- https://cdn.elifesciences.org/articles/75663/elife-75663-fig2-data2-v2.xlsx
Figure 2—figure supplement 1
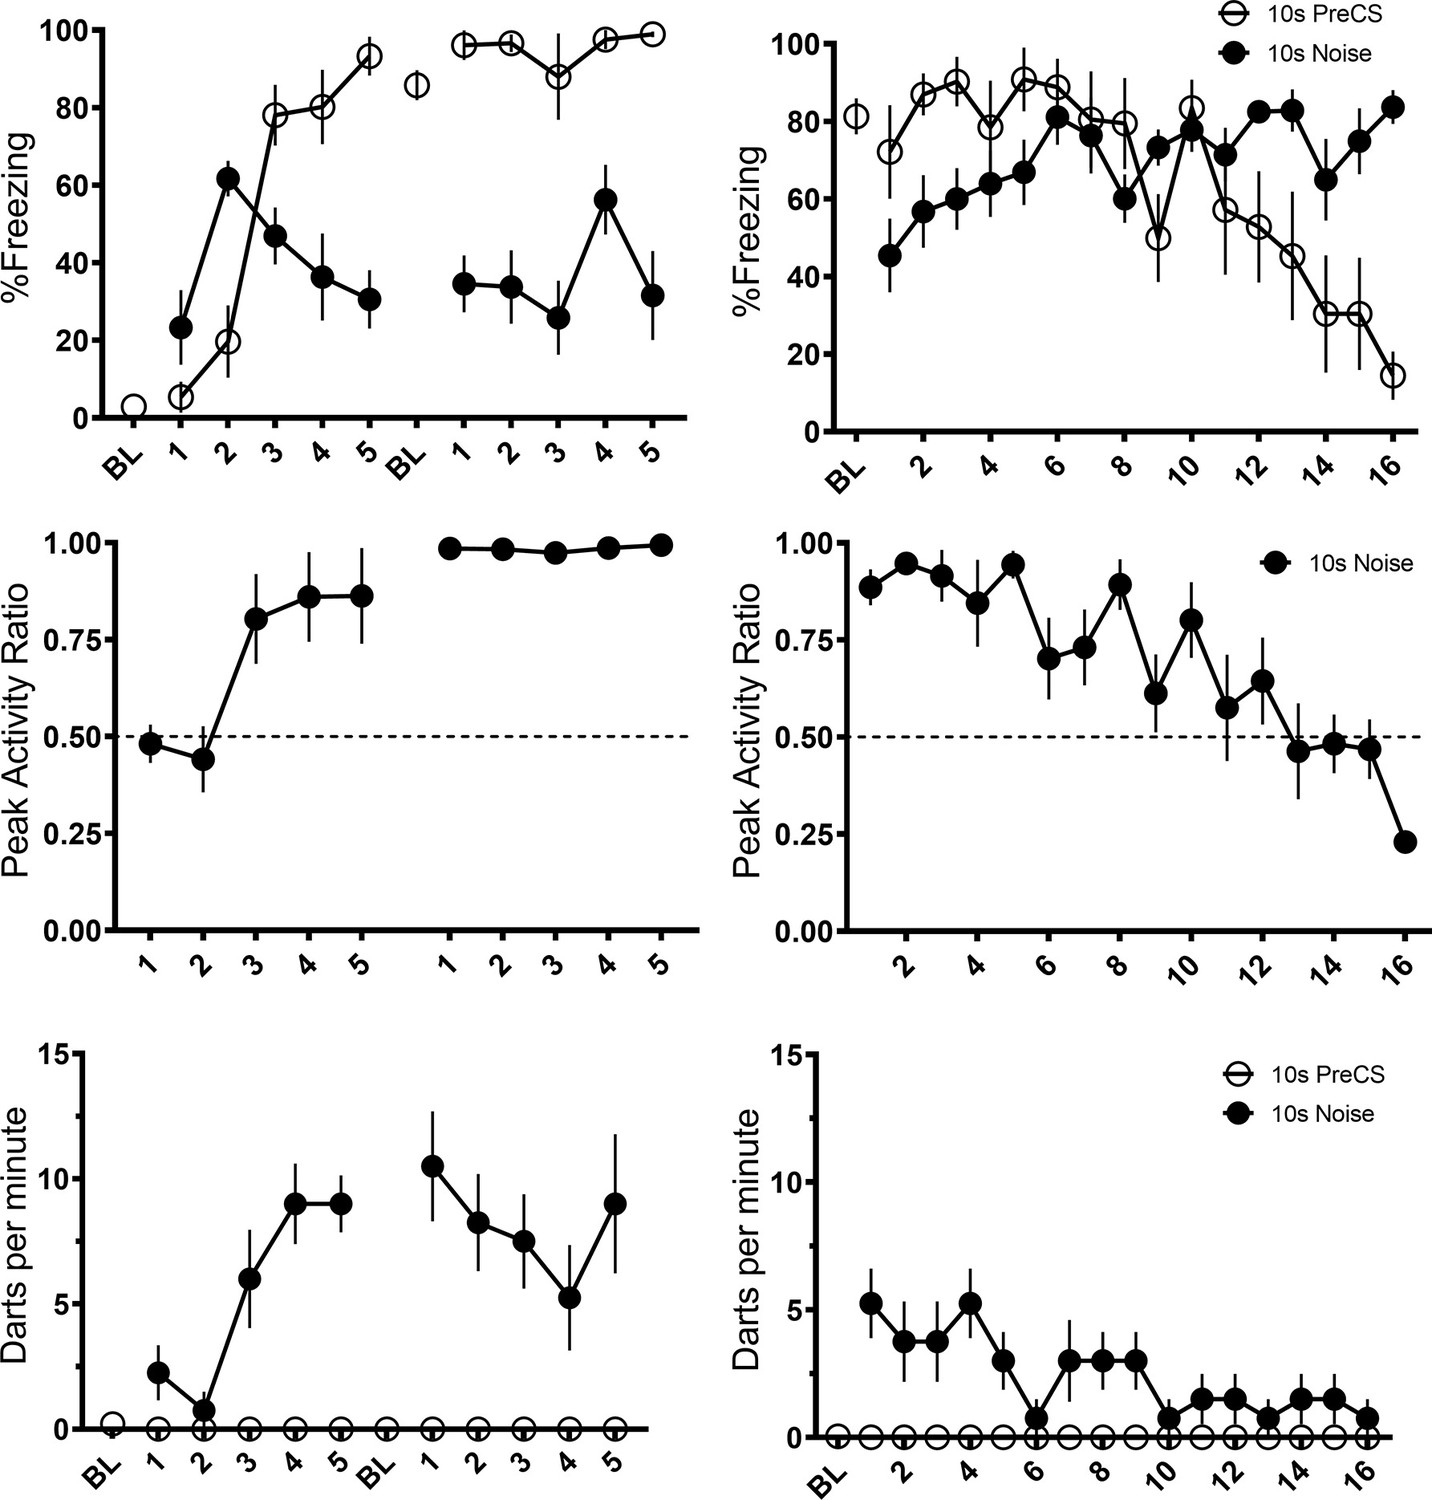
Mean (±SEM) percent freezing, peak activity ratio, and darts per minute throughout training (left panels) and testing (right panels) for the CS Duration Group (n=8) of Experiment 1.
Responding during the 10 s preCS period is represented with open circles, responding during the noise is represented with filled in black circles. See Figure 2—figure supplement 1—source data 1.
-
Figure 2—figure supplement 1—source data 1
Source files for freezing, PAR, and darting for Experiment 1-CS Duration group.
- https://cdn.elifesciences.org/articles/75663/elife-75663-fig2-figsupp1-data1-v2.xlsx
Figure 3
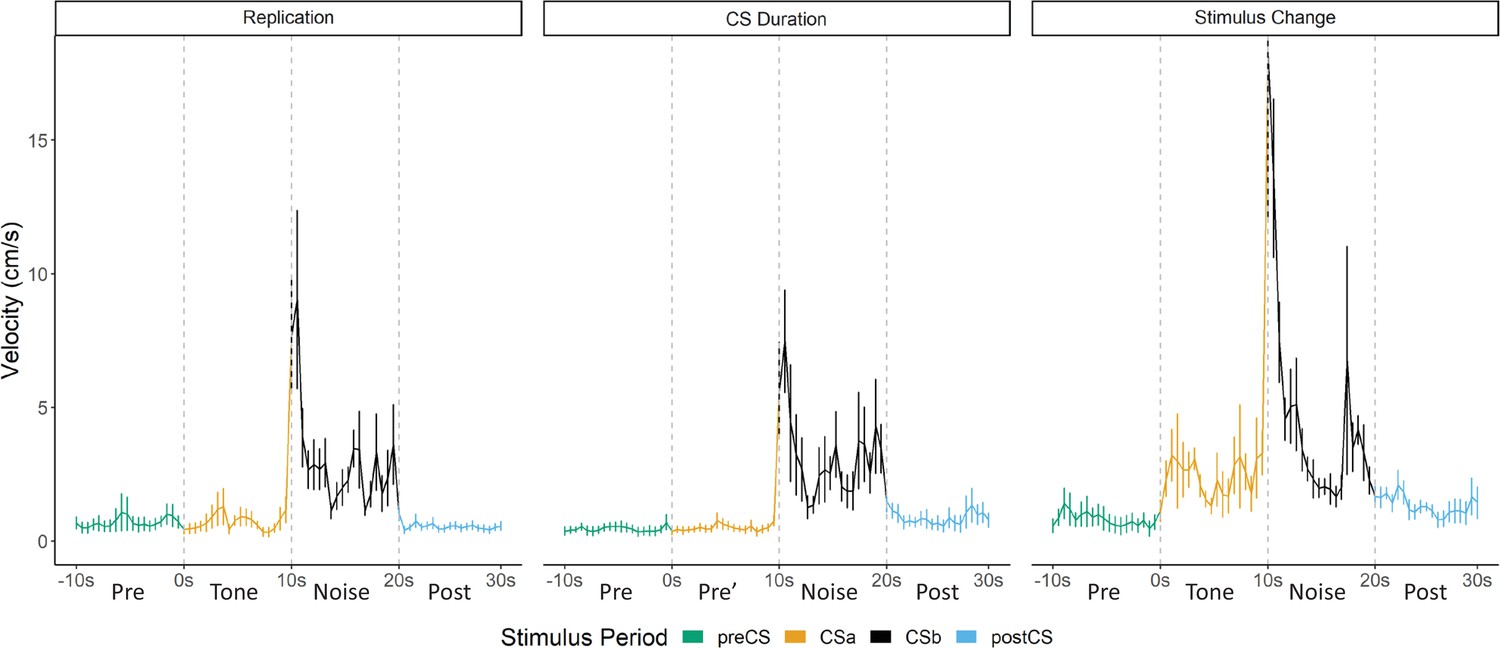
Averaged traces of velocity (cm/s) across the first four trials of extinction during testing for Experiment 1.
Data were averaged across all animals per group and binned into ~0.5 s bins (0.533 s) and presented as mean ± SE. These within-subject error bars are corrected for between-subject variability using methods as described in Morey, 2008. During this test, the Replication Group (n=7) and the Stimulus Change Group (n=7) received the serial conditional stimulus in which a 10 s tone was followed by a 10 s noise. The CS Duration Group (n=8) was only tested with a 10 s noise. See Figure 3—source data 1.
-
Figure 3—source data 1
Source files for velocity for test day of Experiment 1.
- https://cdn.elifesciences.org/articles/75663/elife-75663-fig3-data1-v2.xlsx
Figure 4 with 1 supplement

Mean (± SEM) percent freezing, peak activity ratio, and darting for the test session for Experiment 2 (n=8 per group).
Values are averaged across the 16 trials of extinction during test. p-values and significance were determined through one-way ANOVA. *p<0.05, **p<0.01, ****p<0.0001. See Figure 4—source data 1 & Figure 4—source data 2.
-
Figure 4—source data 1
Source files for freezing, PAR, and darting for test day for Experiment 2.
- https://cdn.elifesciences.org/articles/75663/elife-75663-fig4-data1-v2.xlsx
-
Figure 4—source data 2
Source files for velocity for Experiment 2.
- https://cdn.elifesciences.org/articles/75663/elife-75663-fig4-data2-v2.xlsx
Figure 4—figure supplement 1
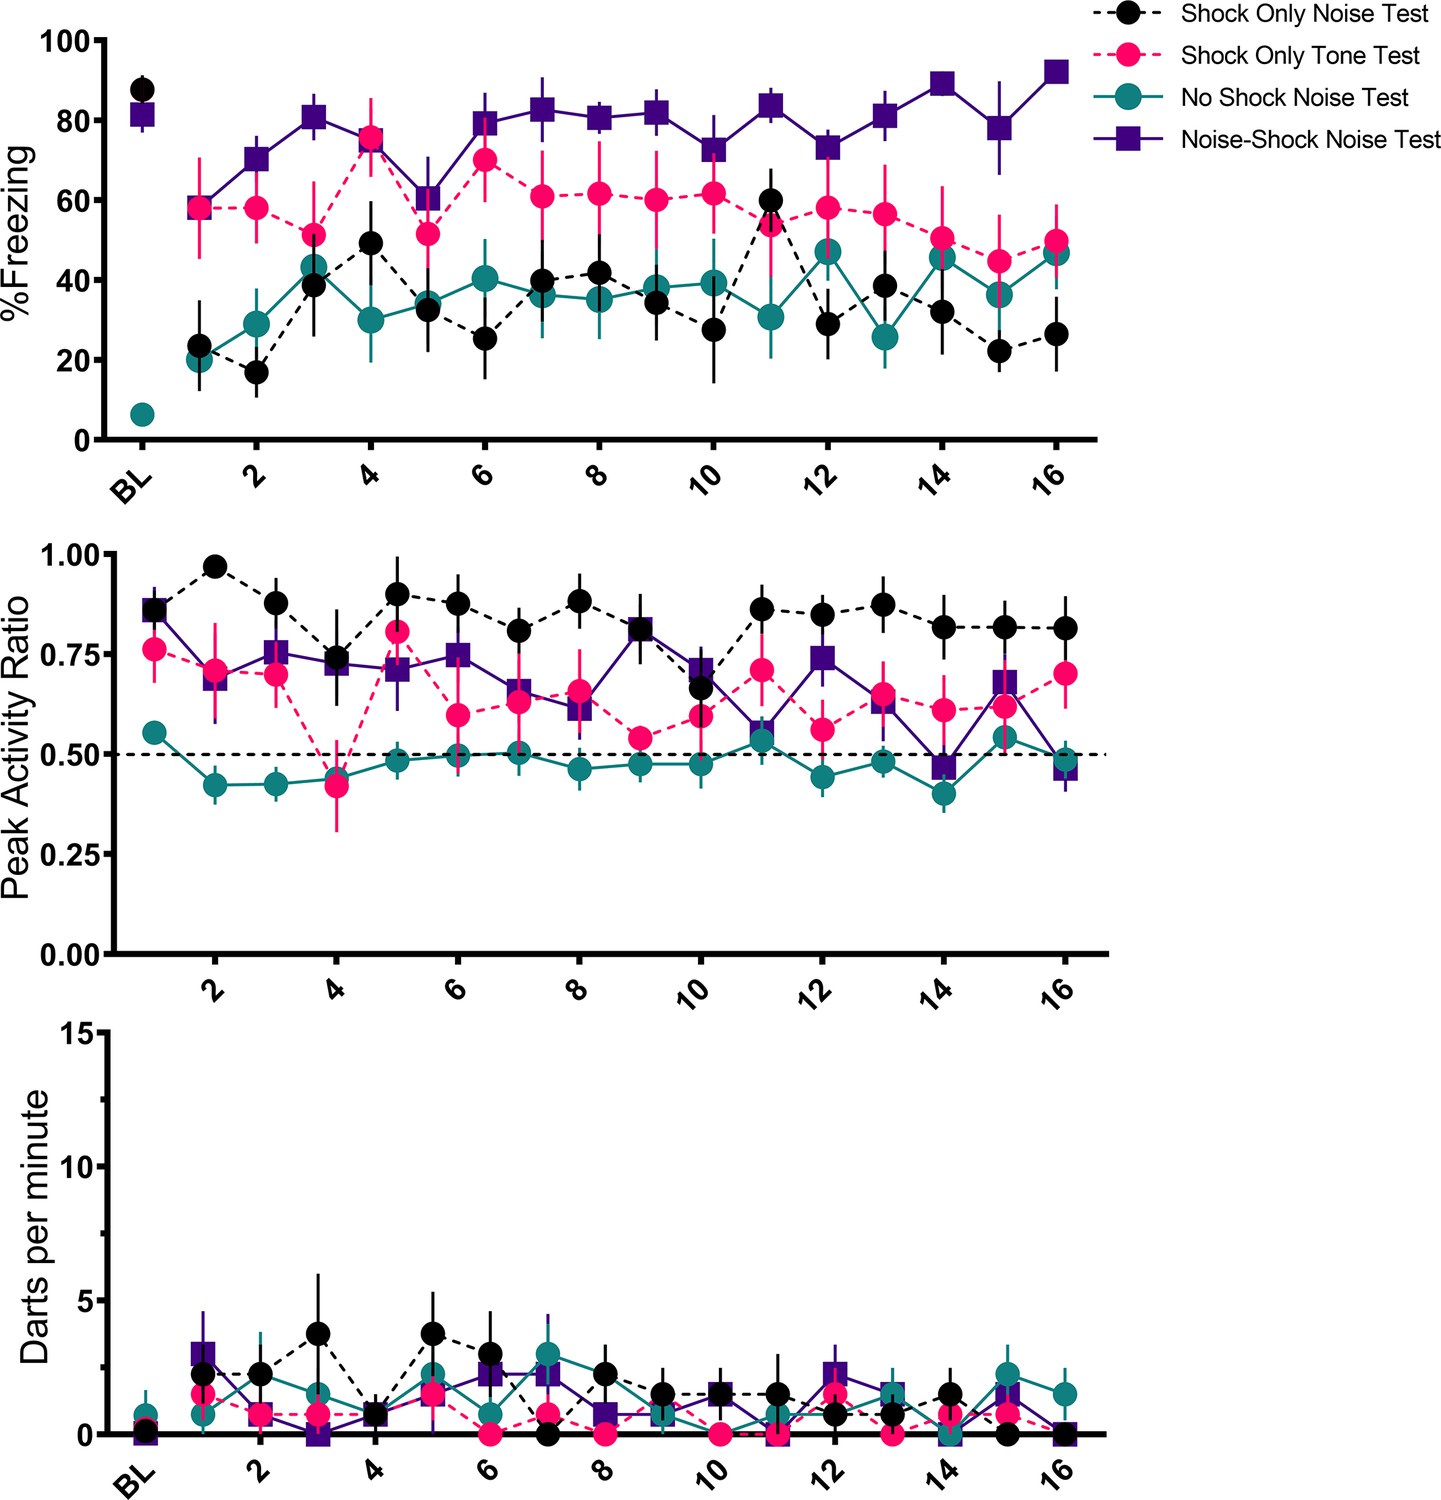
Trial-by-trial mean (± SEM) percent freezing, peak activity ratio, and darts per minute throughout 16 trials of testing for Experiment 2 (n=8 per group).
-
Figure 4—figure supplement 1—source data 1
Source files for freezing, PAR, and darting for Experiment 2.
- https://cdn.elifesciences.org/articles/75663/elife-75663-fig4-figsupp1-data1-v2.xlsx
Figure 5
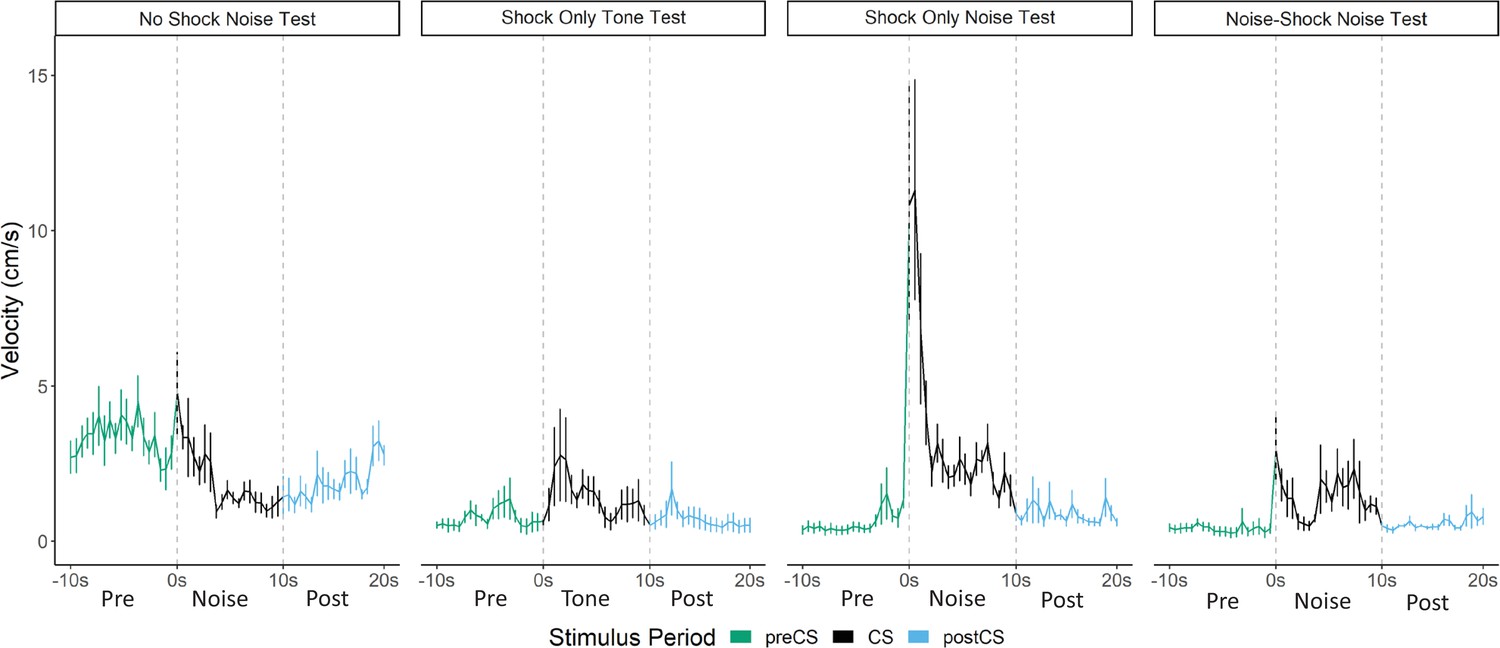
Averaged traces of velocity (cm/s) across the first four trials of extinction during testing for Experiment 2 (n=8 per group).
Data were averaged across all animals per group and binned into ~0.5 s bins (0.533 s) and presented as mean ± SE. These within-subject error bars are corrected for between-subject variability using methods as described in Morey, 2008. During this test, the no shock-noise test, shock only-noise test, and noise-shock noise test groups were tested with a 10 s noise. The shock only-tone test group was tested with a 10 s tone. See Figure 5—source data 1.
-
Figure 5—source data 1
Source files for velocity for test day of Experiment 2.
- https://cdn.elifesciences.org/articles/75663/elife-75663-fig5-data1-v2.xlsx
Figure 6
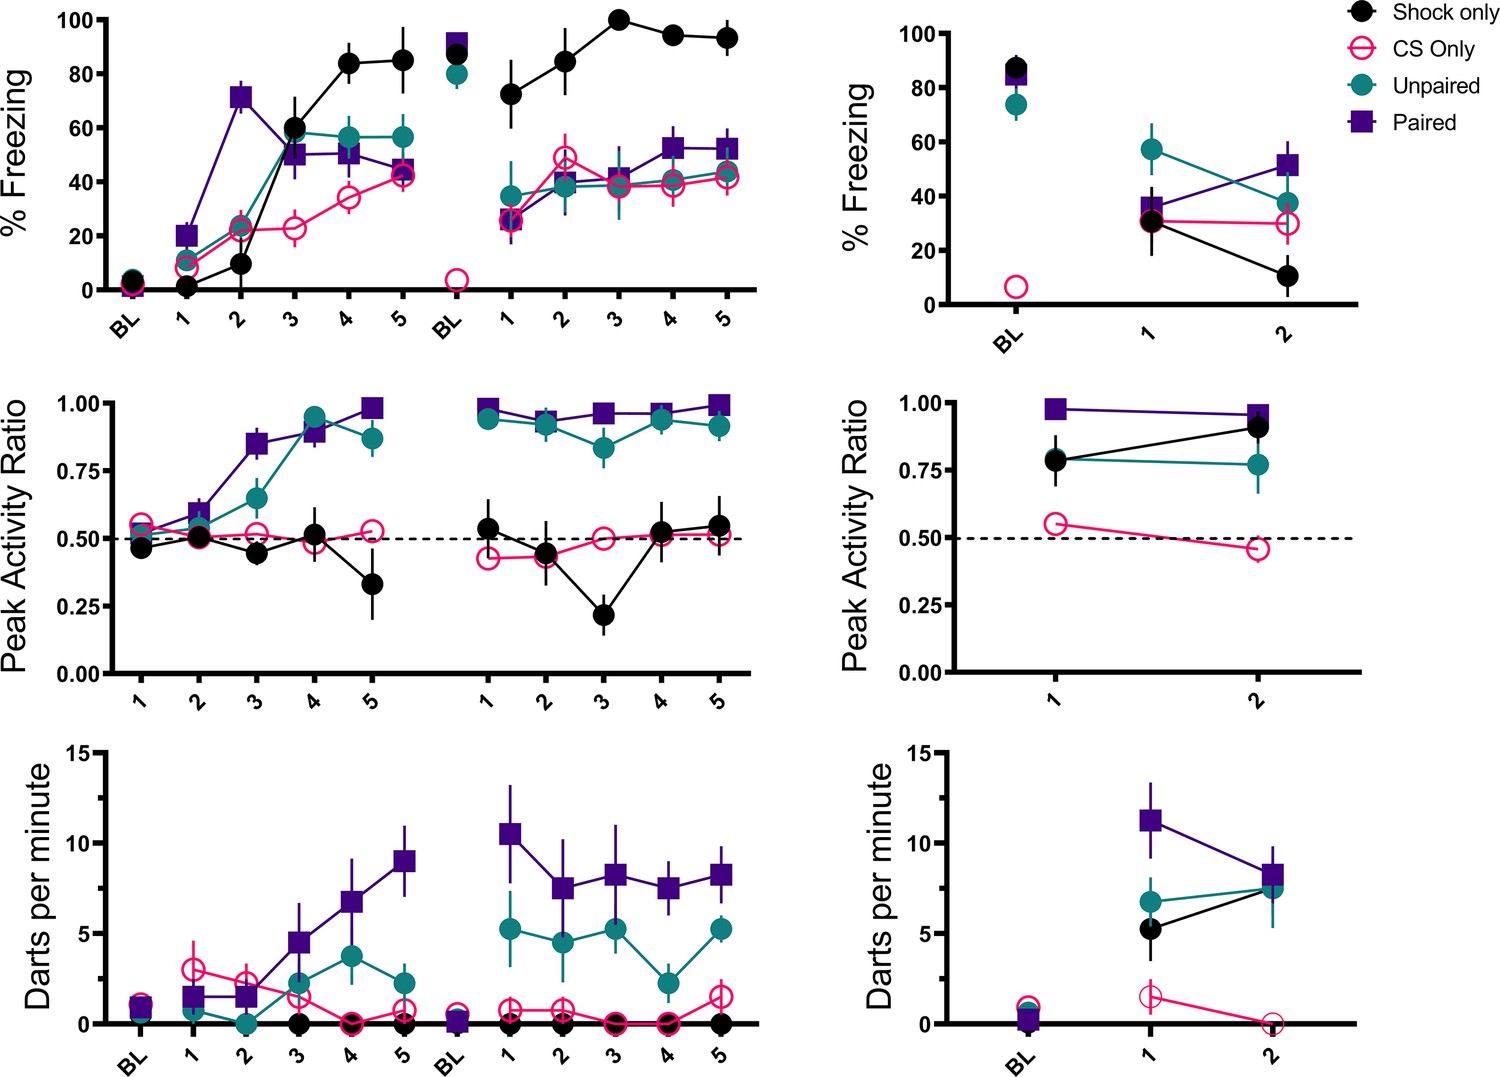
Trial-by-trial mean (± SEM) percent freezing, peak activity ratio, and darting per minute throughout all stimulus presentations during training (left panels) and testing (right panels) for Experiment 3 (n=8 per group).
-
Figure 6—source data 1
Source file for freezing, PAR, and darting for Experiment 3.
- https://cdn.elifesciences.org/articles/75663/elife-75663-fig6-data1-v2.xlsx
-
Figure 6—source data 2
Source files for velocity for Experiment 3.
- https://cdn.elifesciences.org/articles/75663/elife-75663-fig6-data2-v2.xlsx
Figure 7
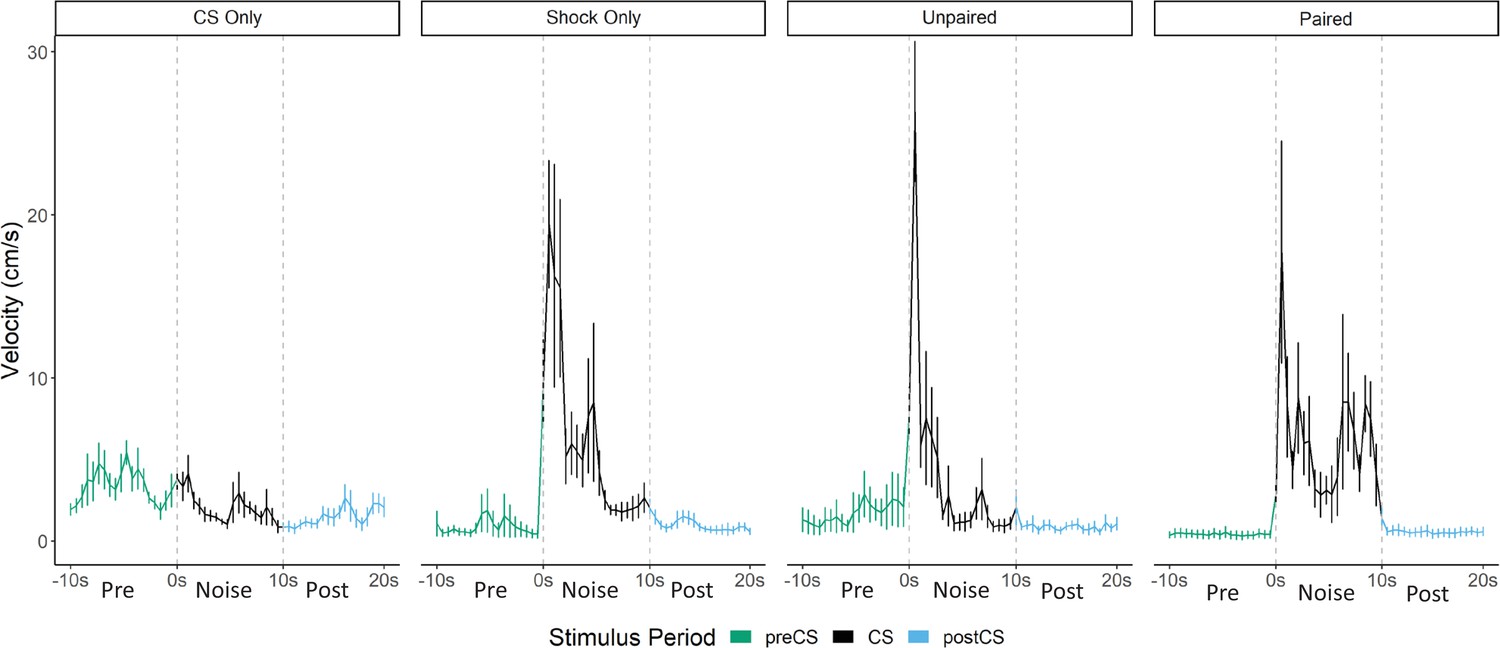
Averaged traces of velocity (cm/s) across two trials of extinction during testing for Experiment 3 (n=8 per group).
Datawere averaged across all animals per group and binned into ~0.5 s bins (0.533 s) and presented as Mean ± SE. These within-subject error bars are corrected for between-subject variability using methods as described in Morey, 2008. During this test all groups were tested with a 10 s noise CS.
-
Figure 7—source data 1
Source files for velocity for test day of Experiment 3.
- https://cdn.elifesciences.org/articles/75663/elife-75663-fig7-data1-v2.xlsx
Figure 8 with 1 supplement

Averaged traces of velocity (cm/s) across three trials of extinction during testing for Experiment 4 (n=8 per group).
Datawere averaged across all animals per group and binned into ~0.5 s bins (0.533 s) and presented as mean ± SE. These within-subject error bars are corrected for between-subject variability using methods as described in Morey, 2008. During this test, all groups were tested with a 10 s noise CS. See Figure 8—source data 1.
-
Figure 8—source data 1
Source files for velocity on test day of Experiment 4.
- https://cdn.elifesciences.org/articles/75663/elife-75663-fig8-data1-v2.xlsx
Figure 8—figure supplement 1
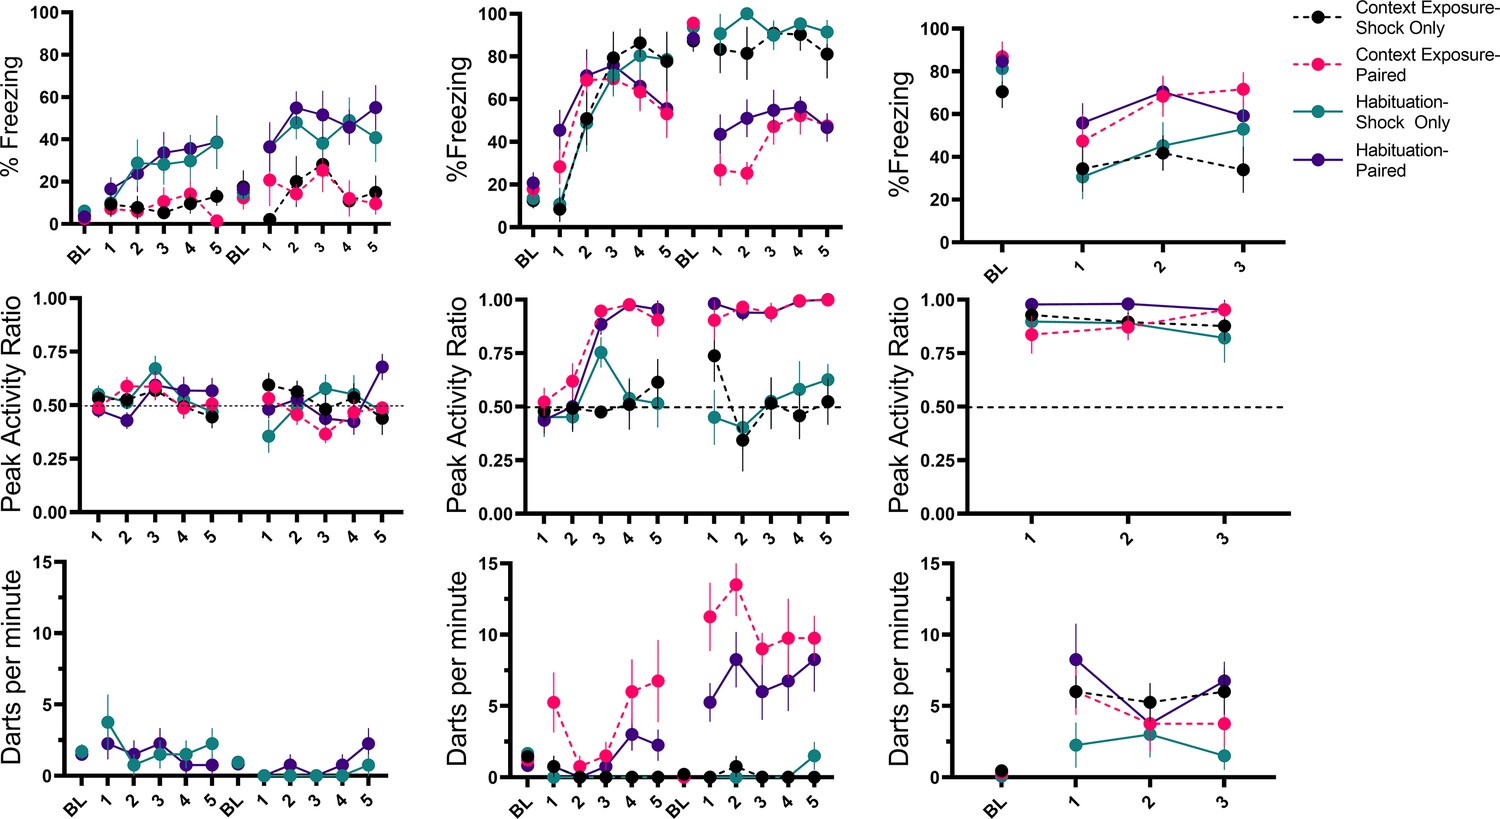
Trial-by-trial mean (± SEM) percent freezing, peak activity ratio, and darting per minute throughout all stimulus presentations during habituation (left panels), training (middle panels), and testing (right panels) for Experiment 4 (n=8 per group).
For habituation, presented are the values during CS presentation for habituation groups and values during the same 10 s period for context exposure groups. For training, presented are the values during CS exposure for the paired groups and values during the same 10 s period for shock only groups. For testing, all presented values are during the 10 s CS presentation. See Figure 8—figure supplement 1—source data 1 and Figure 8—figure supplement 1—source data 2.
-
Figure 8—figure supplement 1—source data 1
Source files for freezing, PAR, and darting for all of Experiment 4.
- https://cdn.elifesciences.org/articles/75663/elife-75663-fig8-figsupp1-data1-v2.xlsx
-
Figure 8—figure supplement 1—source data 2
Source files for velocity for all of Experiment 4.
- https://cdn.elifesciences.org/articles/75663/elife-75663-fig8-figsupp1-data2-v2.xlsx
Figure 9
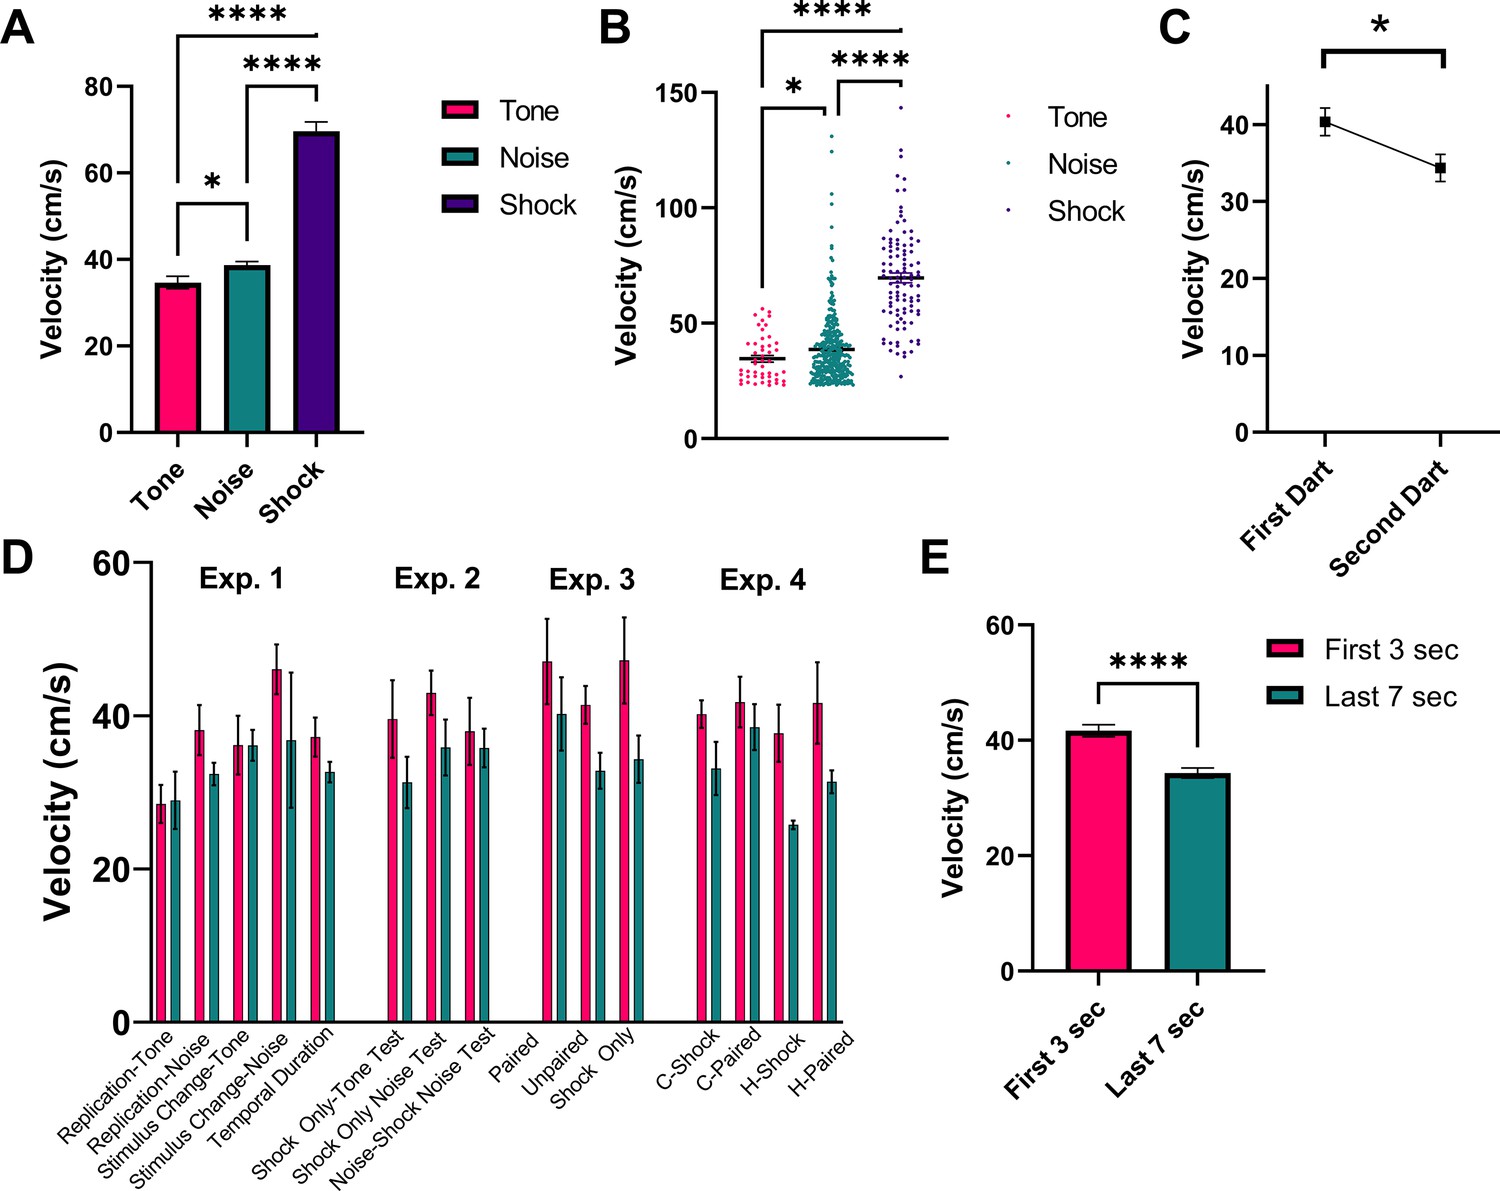
Analysis of dart timing and magnitude.
(A) and (B) represent the magnitude of darts to the tone (n=48 darts) and noise (n=360 darts) stimuli during testing, as well as the reaction to the first shock (n=102 shocks) on day 1 of training. Data are presented as mean ± SE and come from all groups (total n=102 animals) that received shock during training, collapsed across all experiments. p-values and significance were determined through Welch’s ANOVA. *p<0.05, ****p<0.0001. (C) represents the magnitude (mean ± SE) of the first and second dart within a single CS presentation for all animals across all experiments that performed two darts within a single 10 s CS period (n=65 “multi-darts”). p-values and significance were determined through a paired sample t-test. *p<0.05. (D) and (E) represent the magnitude of darts that occurred during the initial 3 s of the 10 s CS period (n=230 darts) and those that occurred during the final 7 s of the 10 s CS period (n=178 darts). Data are presented as mean ± SE and come from all groups that received shock during training (n=102 animals), displayed by group and stimulus type in (D) and collapsed across all experimental groups in (E). p-values and significance were determined through Welch’s ANOVA. ****p<0.0001. See Figure 9—source data 1.
-
Figure 9—source data 1
Source files for dart magnitudes and shock reactivity across all experiments.
- https://cdn.elifesciences.org/articles/75663/elife-75663-fig9-data1-v2.xlsx
Figure 10
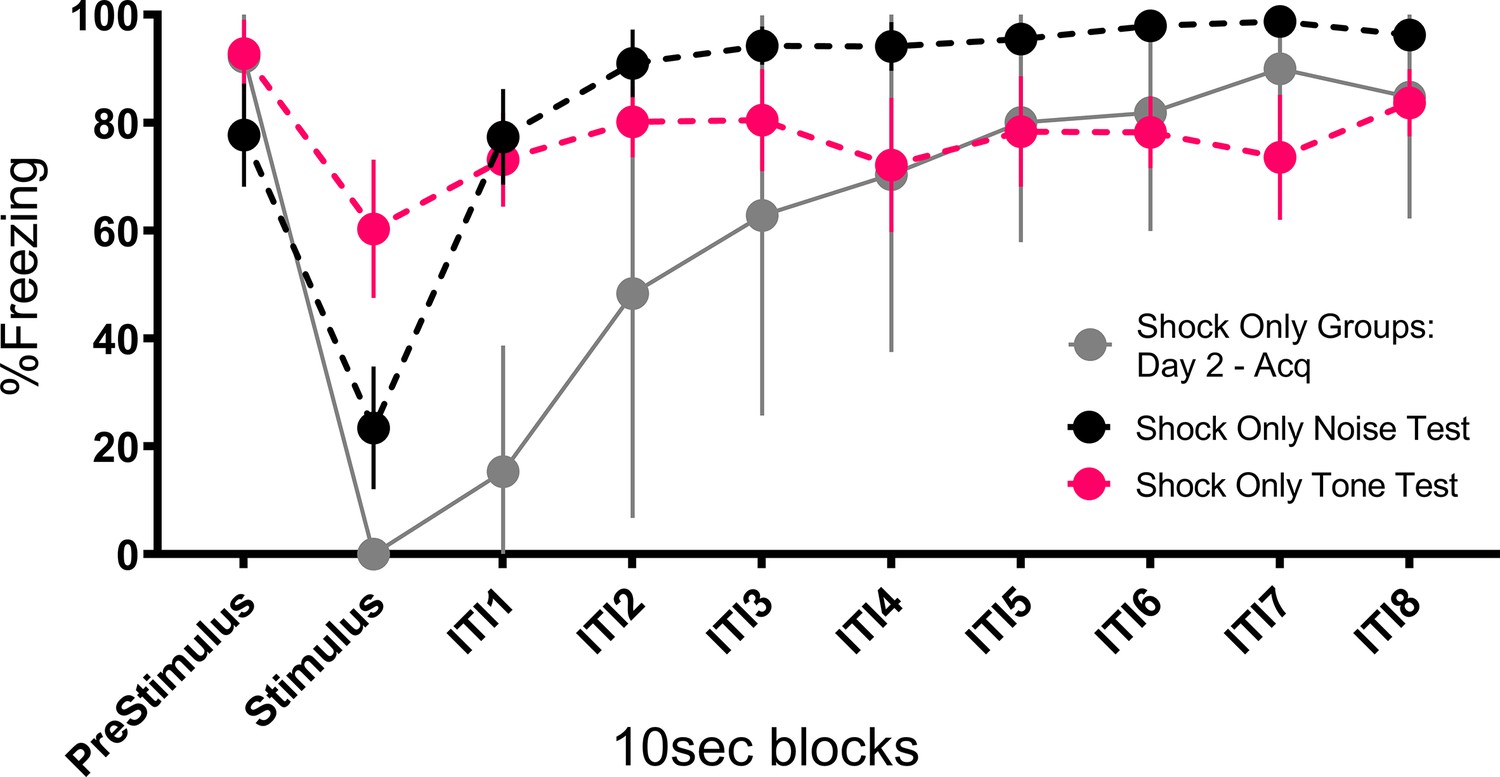
Mean (± SEM) percent freezing during extinction/testing for Experiment 2 shows that the occurrence of the stimuli at test disrupt freezing to the context and that the noise disrupts freezing to a greater extent than the tone (n=8 per group).
Also plotted is a similar curve showing freezing and the impact that shock presentation during training has on freezing. These data are averaged across both shock only groups (total n=16) on day 2 trials after fear to the context had been established, showing that shock disrupts freezing to an even greater extent than the noise. See Figure 10—source data 1.
-
Figure 10—source data 1
Source data for the ability of cues and shock to disrupt freezing.
- https://cdn.elifesciences.org/articles/75663/elife-75663-fig10-data1-v2.xlsx
Figure 11
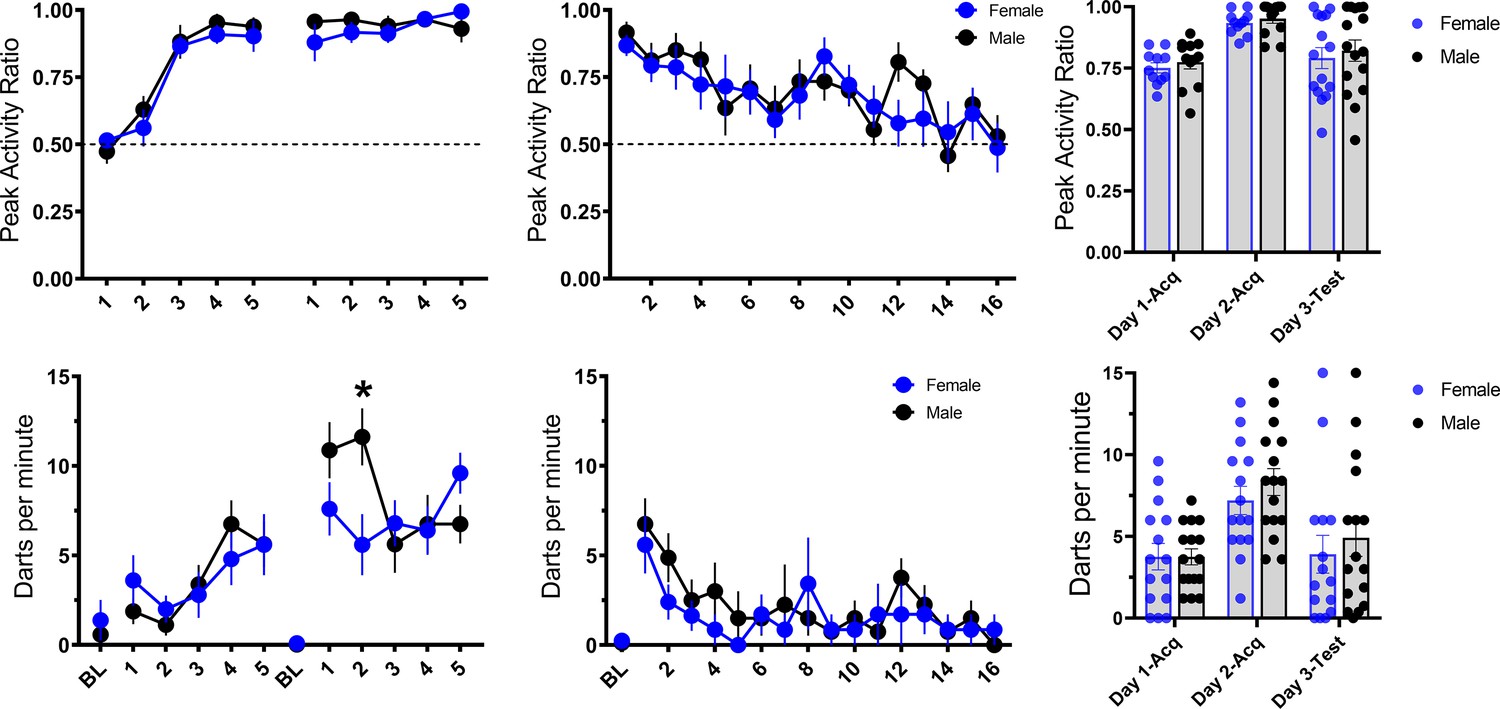
Trial-by-trial mean (± SEM), peak activity ratio (PAR), and darting per minute throughout all stimulus presentations during training (left panels), and testing (middle panels) for all groups across experiments that received noise-shock pairings, grouped by sex of the animal (n=15 females; n=16 males).
The right panels show individual values for each animal’s average PAR and darts per minute across training and testing. p-values and significance were determined through repeated measures ANOVA, and the interaction was followed up with pairwise t-tests.
*p<0.05. See Figure 11—source data 1.
-
Figure 11—source data 1
Source data for the potential sex differences in PAR and darting.
- https://cdn.elifesciences.org/articles/75663/elife-75663-fig11-data1-v2.xlsx
Tables
Table 1
Design of Experiment 1.
| Group | Training treatment: 10 CS-US pairings(5 per day) | Testing treatment(16 on 1 day) |
|---|---|---|
| (1) Replication | 10 s tone→10 s noise→1 s shock | 10 s tone→10 s noise |
| (2) CS duration | 10 s noise→shock | 10 s noise |
| (3) Stimulus change | 20 s tone→shock | 10 s tone→10 s noise |
Table 2
Design of Experiment 2.
| Group | 2-Day training treatment: | Testing treatment |
|---|---|---|
| (1) Pseudoconditioned noise-shock only noise test | 10 Shocks (1-mA, 1 s, 150–210 s intertrial interval) | 5 Noise presentations (10 s) |
| (2) Pseudoconditioned tone-shock only tone test | 10 Shocks (1-mA, 1 s, 150–210 s intertrial interval) | 5 Tone presentations (10 s) |
| (3) No shock control | Context exposure only (17 min and 15 s per day) | 5 Noise presentations (10 s) |
| (4) Noise-shock conditioning | 10 Noise (10 s)→shock pairings | 5 Noise presentations (10 s) |
Table 3
Design of Experiment 3—paired vs unpaired noise-shock.
| Group | Training treatment: 10 CS-US pairings(5 per day) | Testing treatment(2 on 1 day) |
|---|---|---|
| (1) Paired noise-shock (conditioning) | 10 s noise→1 s shock | 10 s noise |
| (2) Unpaired noise-shock | 10 s noise and 1 s shock – unpaired | 10 s noise |
| (3) Noise - CS only | 10 s noise | 10 s noise |
| (4) Shock only (pseudo conditioning) | 1 s shock | 10 s noise |
Table 4
Design of Experiment 4—tested the effect of habituation to the white noise.
| Group | Habituation treatment: 10 CS exposures (5 per day) | Training treatment: 10 CS-US pairings (5 per day) | Testing treatment(3 on 1 day) |
|---|---|---|---|
| (1) Habituation/shock only (H-shock) | 10 s noise | 1 s shock | 10 s noise |
| (2) Habituation/paired noise-shock (H-paired) | 10 s noise | 10 s noise→1 s shock | 10 s noise |
| (3) Context exposure/shock only (C-shock) | Context exposure | 1 s shock | 10 s noise |
| (4) Context exposure/paired noise-shock (C-paired) | Context exposure | 10 s noise→1 s shock | 10 s noise |
Additional files
-
Transparent reporting form
- https://cdn.elifesciences.org/articles/75663/elife-75663-transrepform1-v2.docx
-
Source code 1
Custom R code for darting analysis.
- https://cdn.elifesciences.org/articles/75663/elife-75663-code1-v2.zip
Download links
A two-part list of links to download the article, or parts of the article, in various formats.
Downloads (link to download the article as PDF)
Open citations (links to open the citations from this article in various online reference manager services)
Cite this article (links to download the citations from this article in formats compatible with various reference manager tools)
Conditional and unconditional components of aversively motivated freezing, flight and darting in mice
eLife 11:e75663.
https://doi.org/10.7554/eLife.75663


