Ribosome profiling of porcine reproductive and respiratory syndrome virus reveals novel features of viral gene expression
- Department of Pathology, University of Cambridge, United Kingdom
- Department of Diagnostic Medicine and Pathobiology, Kansas State University, United States
- Cambivac Ltd, United Kingdom
Figures
Figure 1 with 6 supplements
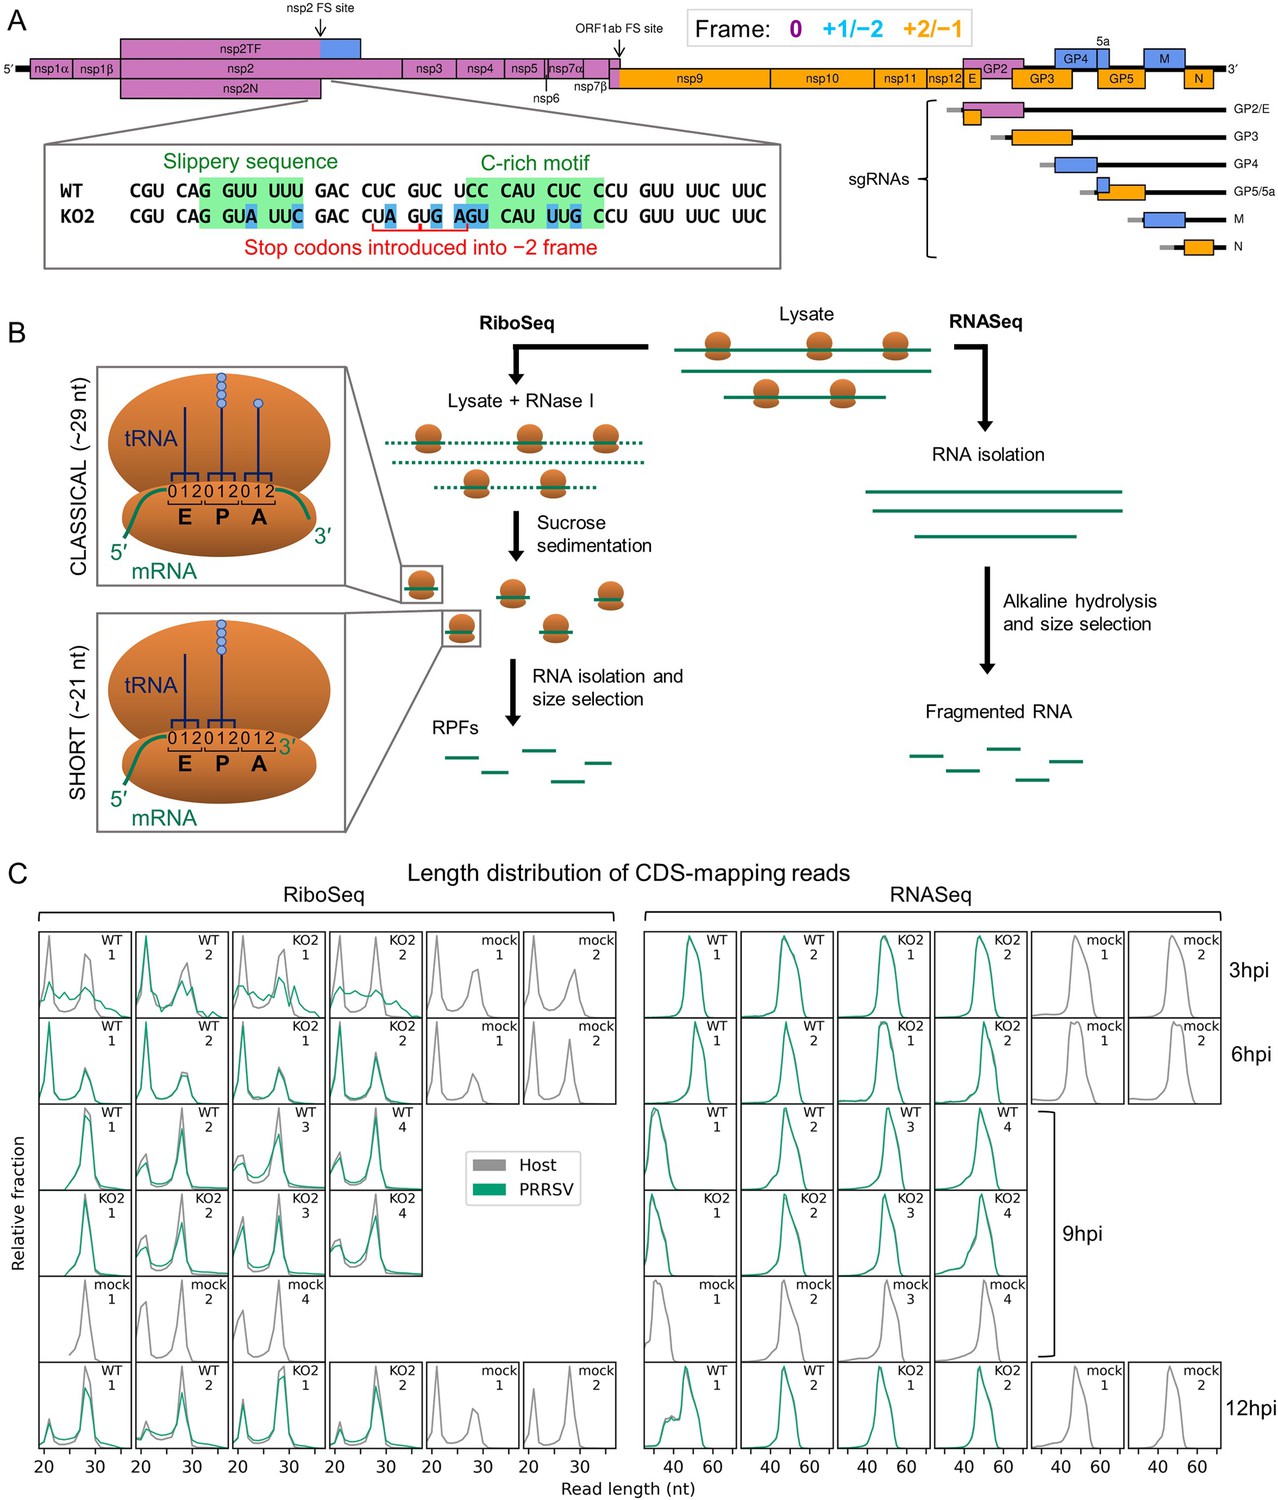
An overview of the experimental set-up and the quality of the datasets.
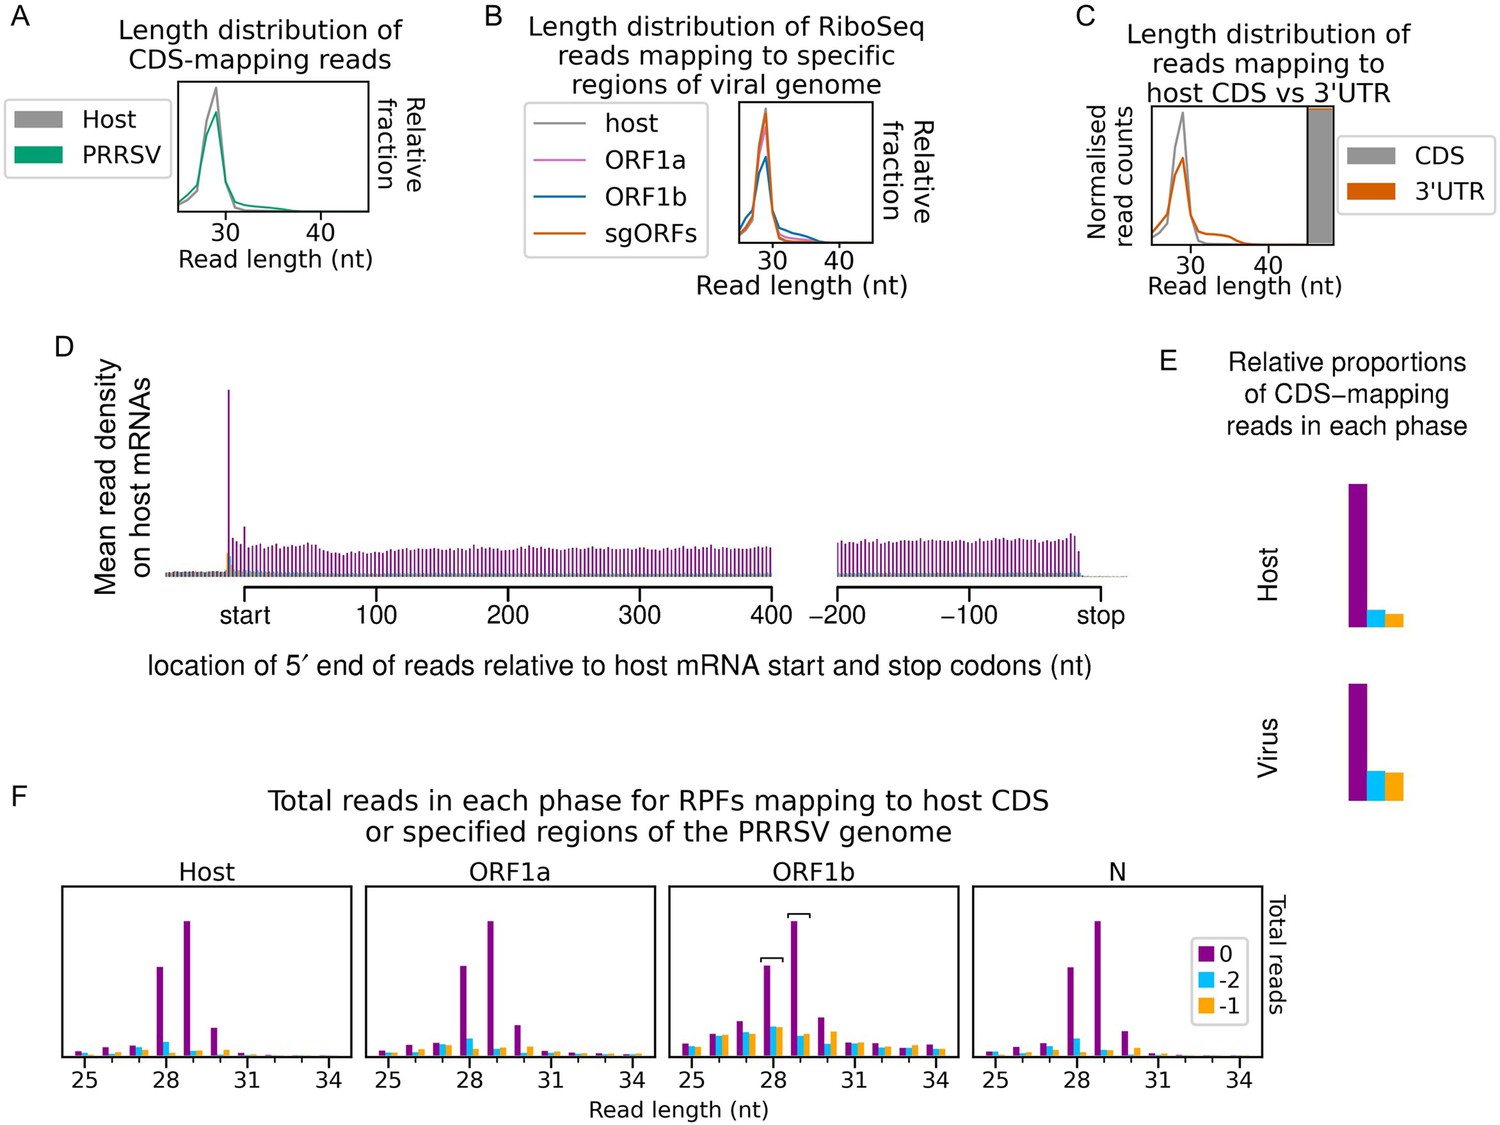
(A) Genome map of the North American porcine reproductive and respiratory syndrome virus (NA PRRSV) isolate used in this study (SD95-21, GenBank accession KC469618.1). ORFs are coloured and offset on the y-axis according to their frame relative to ORF1a (0: purple, no offset; +1/–2: blue, above axis; +2/–1: yellow, below axis). Subgenomic (sg) RNAs are shown beneath the full-length genomic RNA, with the region of 5′ UTR that is identical to the genomic 5′ UTR shown in grey (known as the ‘leader’). ‘FS’, frameshift. ORFs translated from each sgRNA are depicted as coloured boxes and named to the right. The nucleotide sequence at the non-structural protein (nsp)2 programmed ribosomal frameshift (PRF) site of the NA PRRSVs used in this study is shown (boxed), with mutations made to disrupt PRF and/or expression of nsp2TF in the KO2 mutant virus highlighted in blue. All mutations are synonymous with respect to the ORF1a amino acid sequence. (B) Key experimental steps in preparation of RiboSeq libraries (left) and parallel RNASeq libraries (right). Schematics of ribosomes protecting classical length ribosome-protected fragments (RPFs) (A site occupied) and short RPFs (A site unoccupied) are shown to the left, with numbers within the decoding centre indicating nucleotide positions within codons. (C) Length distribution of positive-sense RiboSeq (left) and RNASeq (right) reads mapping within host (grey) or viral (green, mock excluded) coding sequences (CDSs) in each library. For 9 hr post-infection (hpi) replicate 1 samples (RiboSeq and RNASeq), fragments of 25–34 nt were size-selected during the library preparation; for all other samples, the minimum length selected was 19 nt for RiboSeq and ~45 nt for RNASeq. Note that the RiboSeq library 9 hpi mock replicate 3 was discarded due to poor quality. Further quality control analyses can be found in Figure 1—figure supplement 1–Figure 1—figure supplement 6.
Figure 1—figure supplement 1
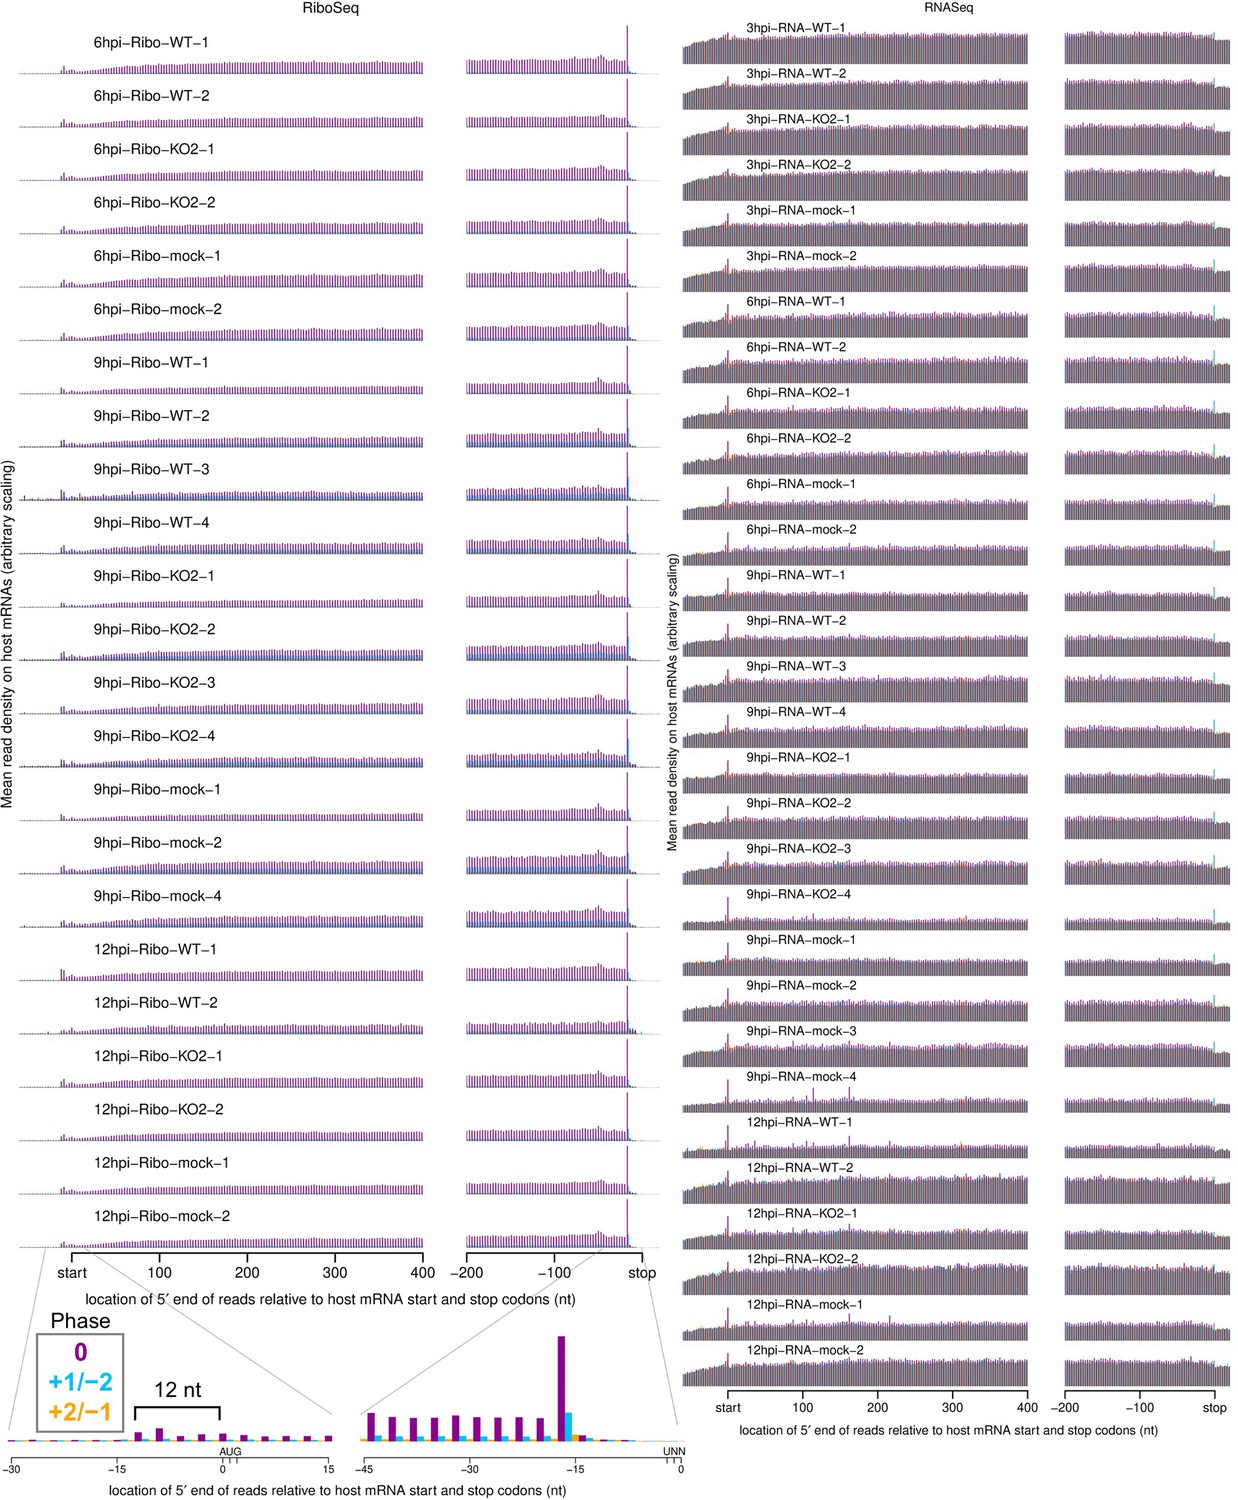
Metagene profile showing the average distribution of 5′ ends of host mRNA-mapping reads relative to start and stop codons.
Only transcripts with an annotated CDS of at least 450 nt, 5′ UTR of at least 60 nt, and 3′ UTR of at least 90 nt were included in the analysis. The total number of positive-sense reads from all these transcripts mapping to each position was plotted. RiboSeq reads originate from translating ribosomes and therefore display clear triplet periodicity (phasing), with few reads mapping to the UTRs, and a heightened termination peak characteristic of samples harvested without cycloheximide (CHX) pre-treatment. Underneath the 12 hr post-infection (hpi)-Ribo-mock-2 library, a magnified view of 45 nt around the start and stop codons for that library is shown, with the typical 12 nt distance between the 5′ end of ribosome-protected fragments (RPFs) and the ribosomal P site indicated for initiating ribosomes. This +12 nt offset is applied to read 5′ end coordinates to plot reads at inferred ribosomal P site positions in all plots except this and similar plots in Figure 1—figure supplement 6B and Figure 6—figure supplement 3D. RNASeq reads do not originate from ribosomal protection, and therefore display a roughly uniform distribution with no clear dominant phase.
Figure 1—figure supplement 2
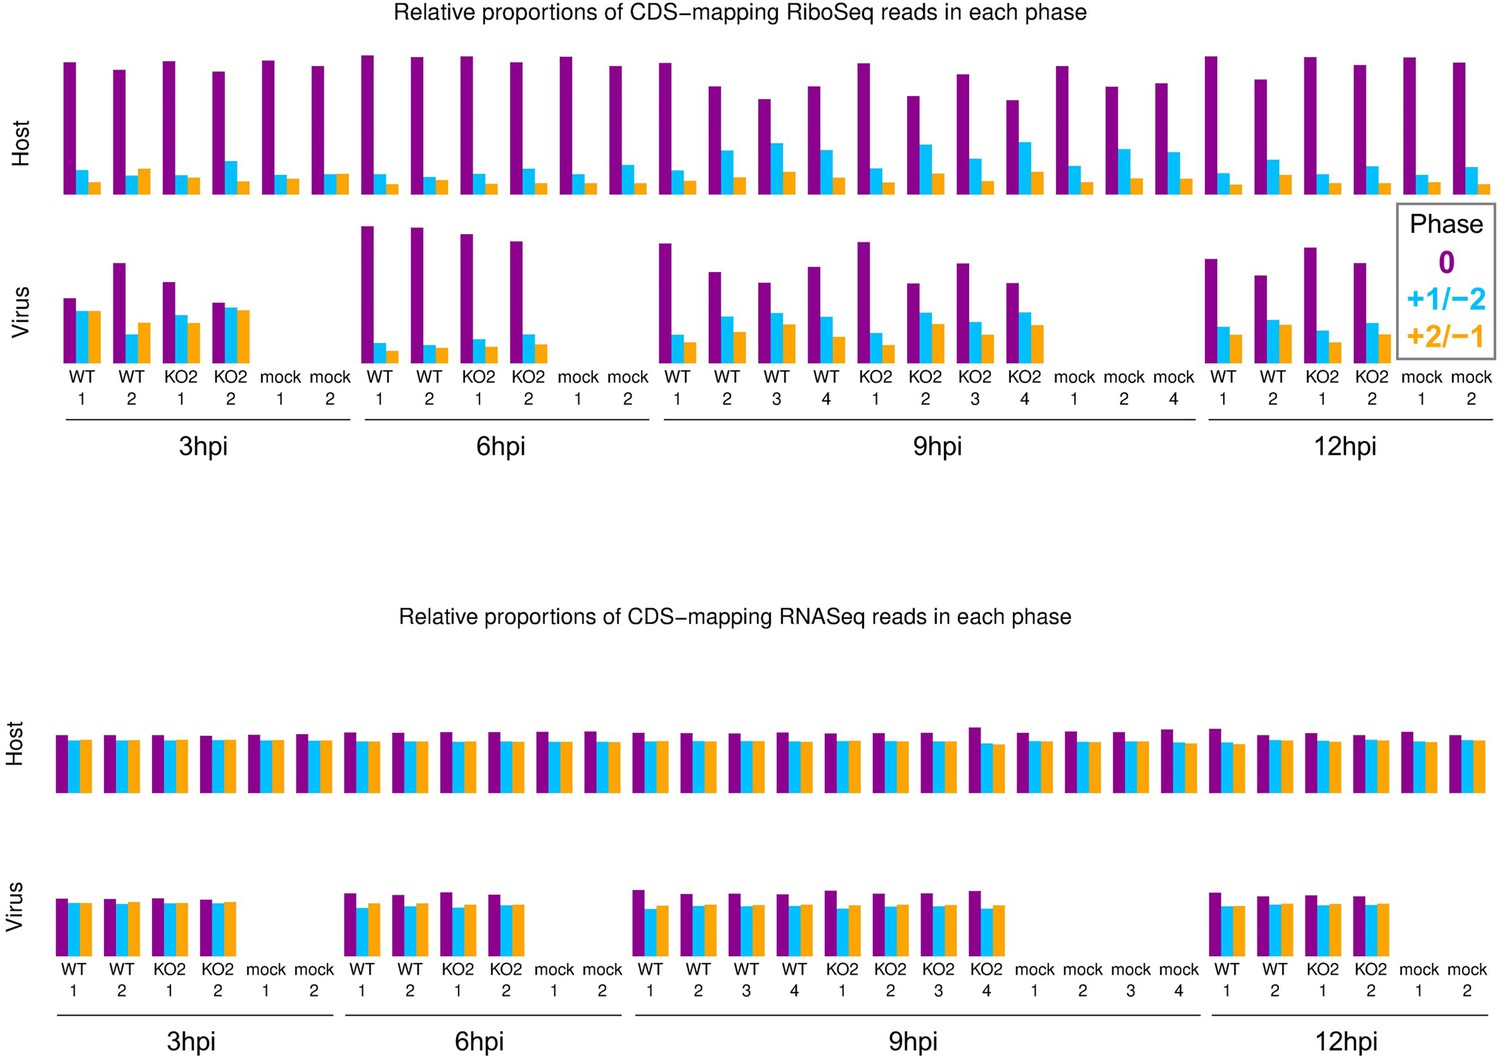
Phase composition of CDS-mapping reads.
Upper: proportion of RiboSeq reads (all read lengths) attributed to each phase, from positive-sense reads mapping within host (top) or viral (bottom, mock excluded) CDSs. Overlapping regions of viral CDS were excluded. 3 hr post-infection (hpi) libraries are shown here to provide an additional method to verify that the virus-mapping reads have a relatively low proportion of genuine ribosome-protected fragments (RPFs), hence exclusion of these libraries from all other quality control analyses. Lower: analysis from the upper panel carried out on RNASeq reads.
Figure 1—figure supplement 3
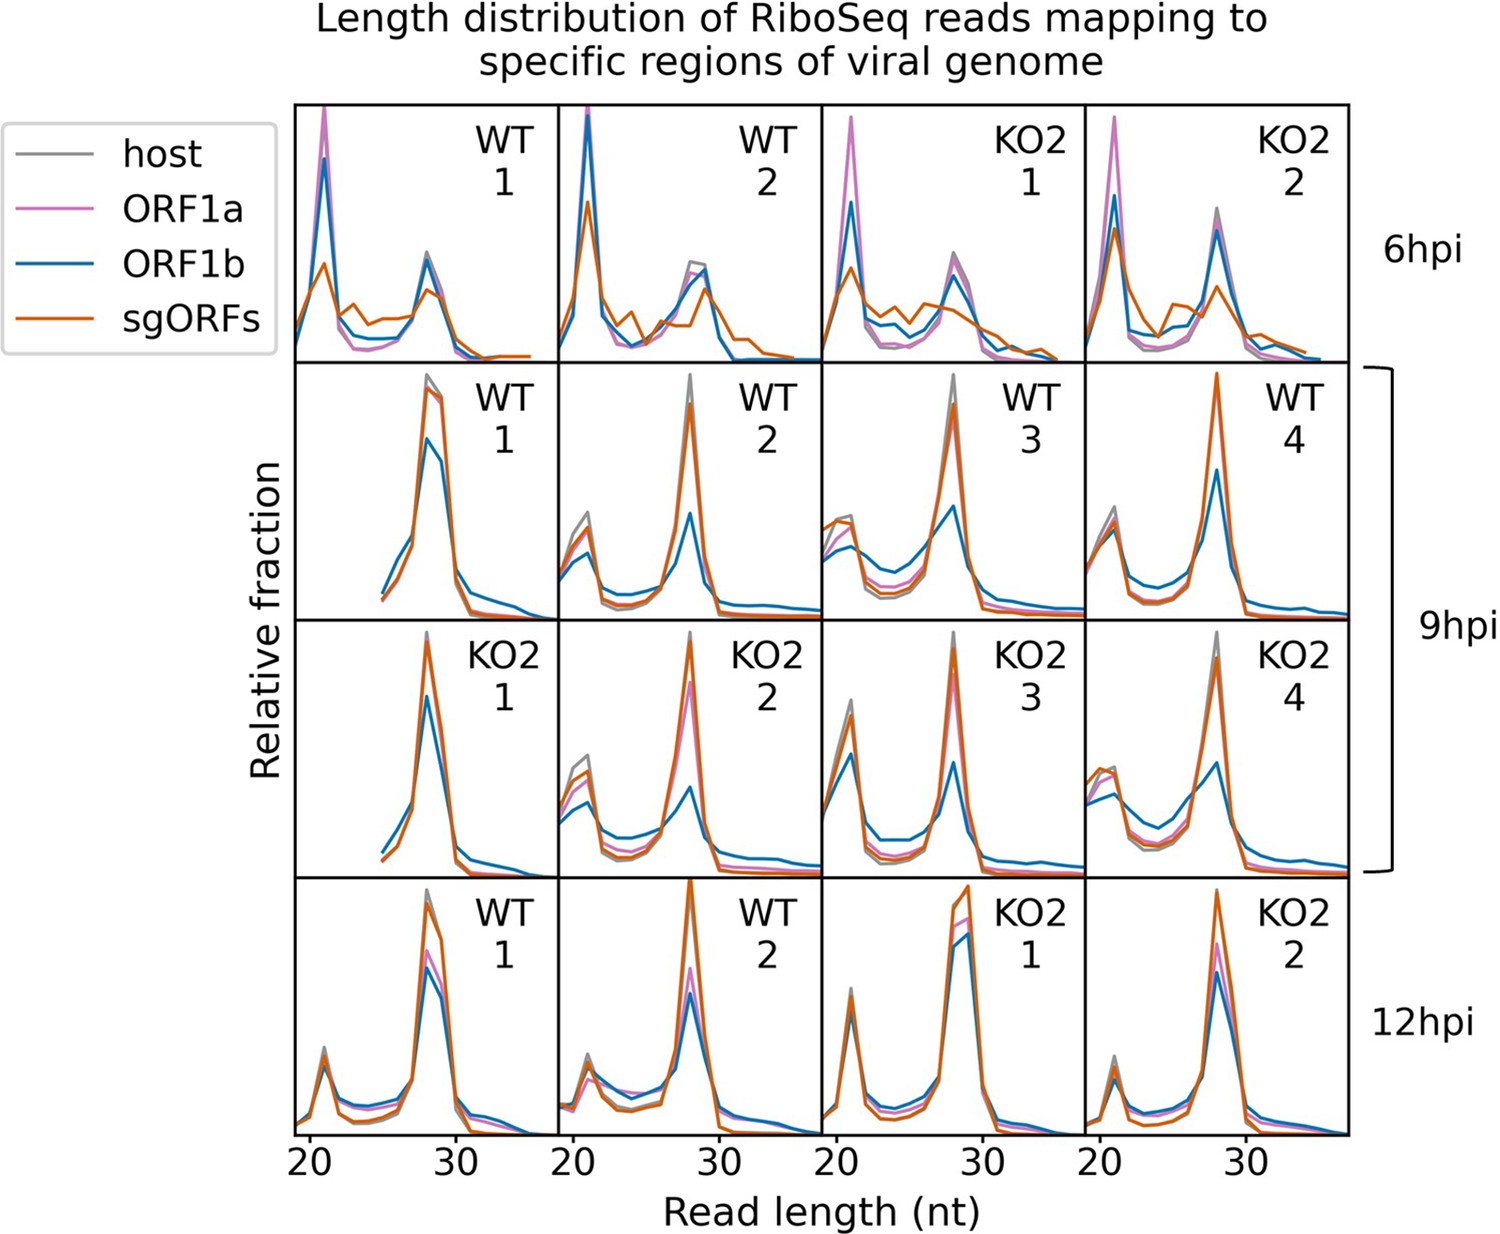
Length distribution of ribosome-protected fragments (RPFs) mapping to specified regions of the viral genome.
Only positive-sense RiboSeq reads were used. Reads mapping to ORF1a are shown in purple, ORF1b in blue, and subgenomic RNA ORFs (sgORFs) in orange. The length distribution of host CDS-mapping RPFs from Figure 1C is reproduced in grey for comparison. Read counts for each length were normalised by the total number of reads in the region to make the scales comparable between regions. Note that, as sgRNA transcription and translation is minimal at 6 hr post-infection (hpi), very few (156–293) reads formed the input for the sgORF-mapping read length distributions at this timepoint, and these are therefore likely highly subject to noise.
Figure 1—figure supplement 4
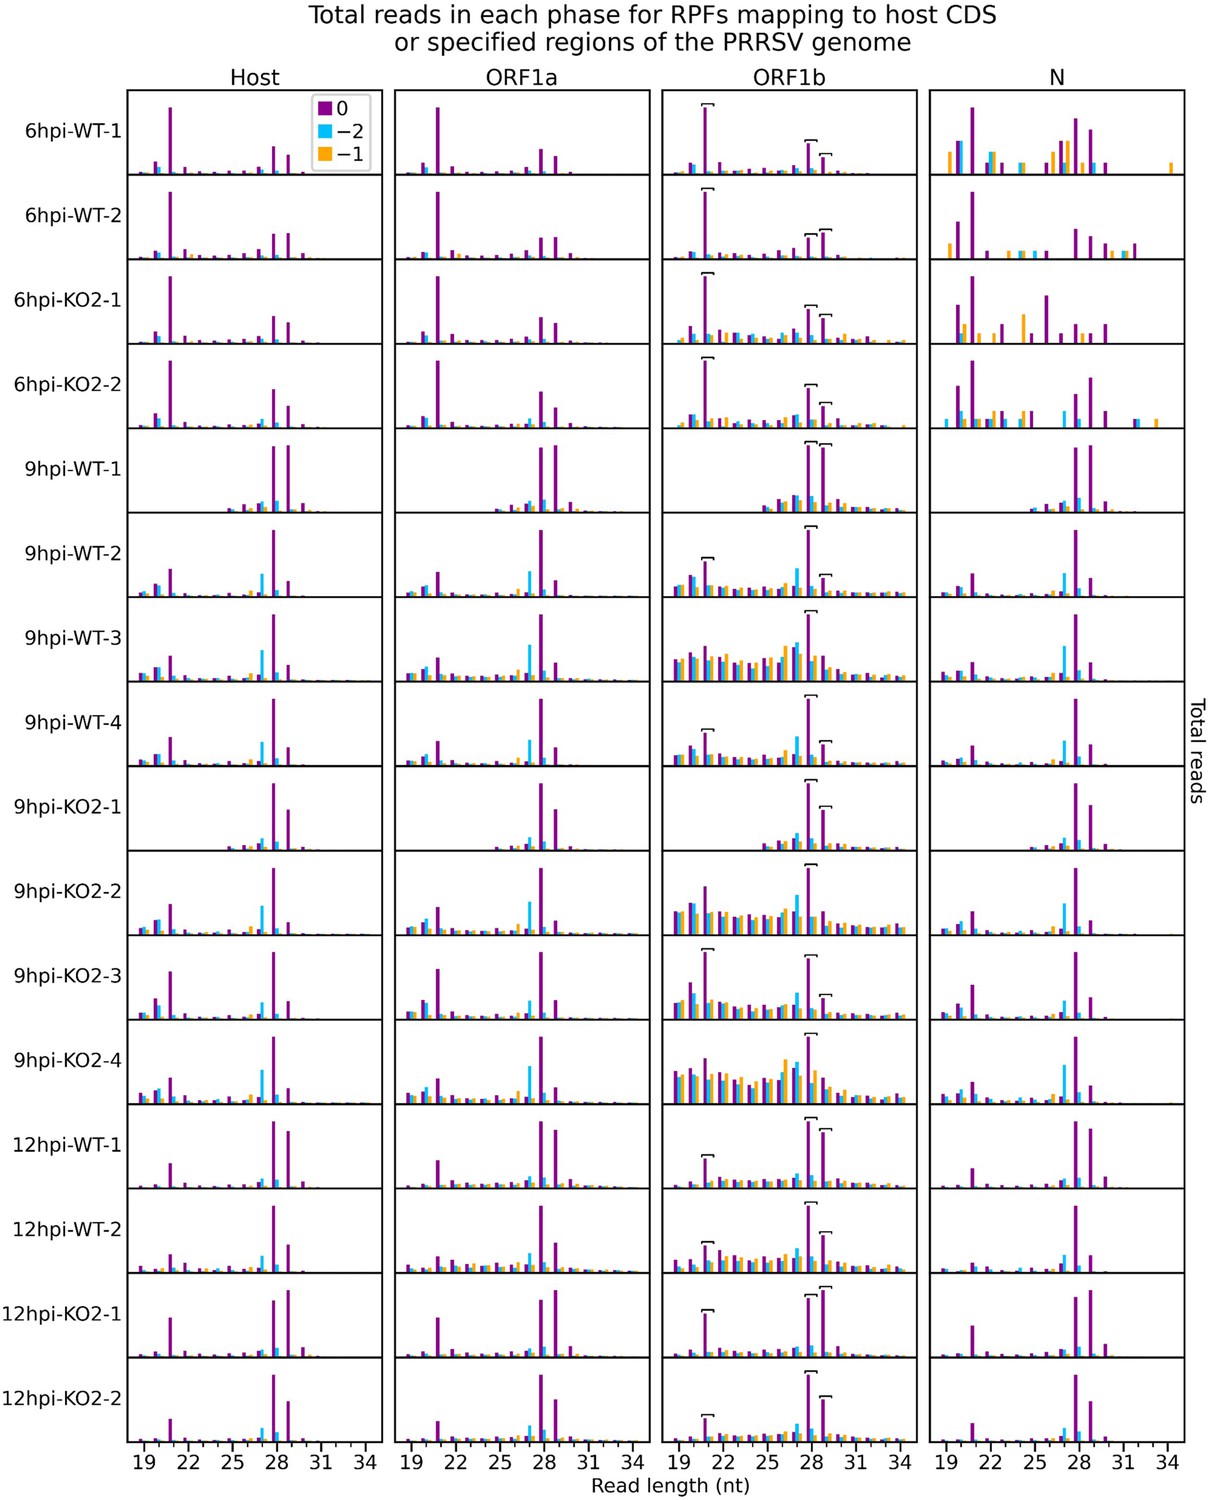
Number of reads of each length that are attributed to each phase for ribosome-protected fragments (RPFs) mapping to specified regions of the viral genome.
Only positive-sense RiboSeq reads were used, and regions from Figure 1—figure supplement 3 were edited to exclude overlapping CDSs (Supplementary file 2). Phase 0 is designated independently for each region, relative to the first nucleotide of that region’s ORF, to aid comparison (e.g. the dominant phase in ORF1b is designated 0 instead of −1). The host phasing information from Figure 1—figure supplement 2 was stratified by read length and reproduced for comparison. Note that y-axis scaling was set for each library and region separately to facilitate comparison. Read lengths forming the peaks of the characteristic bimodal RPF length distribution in this dataset (21, 28, and 29 nt) were selected as likely having the highest signal-to-noise ratio. From within this selection, read lengths which show similar phasing in the ORF1b region of the viral genome and host CDSs were determined for each library individually and designated as showing minimal ribonucleoprotein (RNP) contamination. These are indicated by square brackets and are used for all analyses involving these libraries unless specified. As for Figure 1—figure supplement 3, very few (34–49) reads formed the input for the 6 hr post-infection (hpi) N phase composition plots, and these are therefore likely highly subject to noise.
Figure 1—figure supplement 5
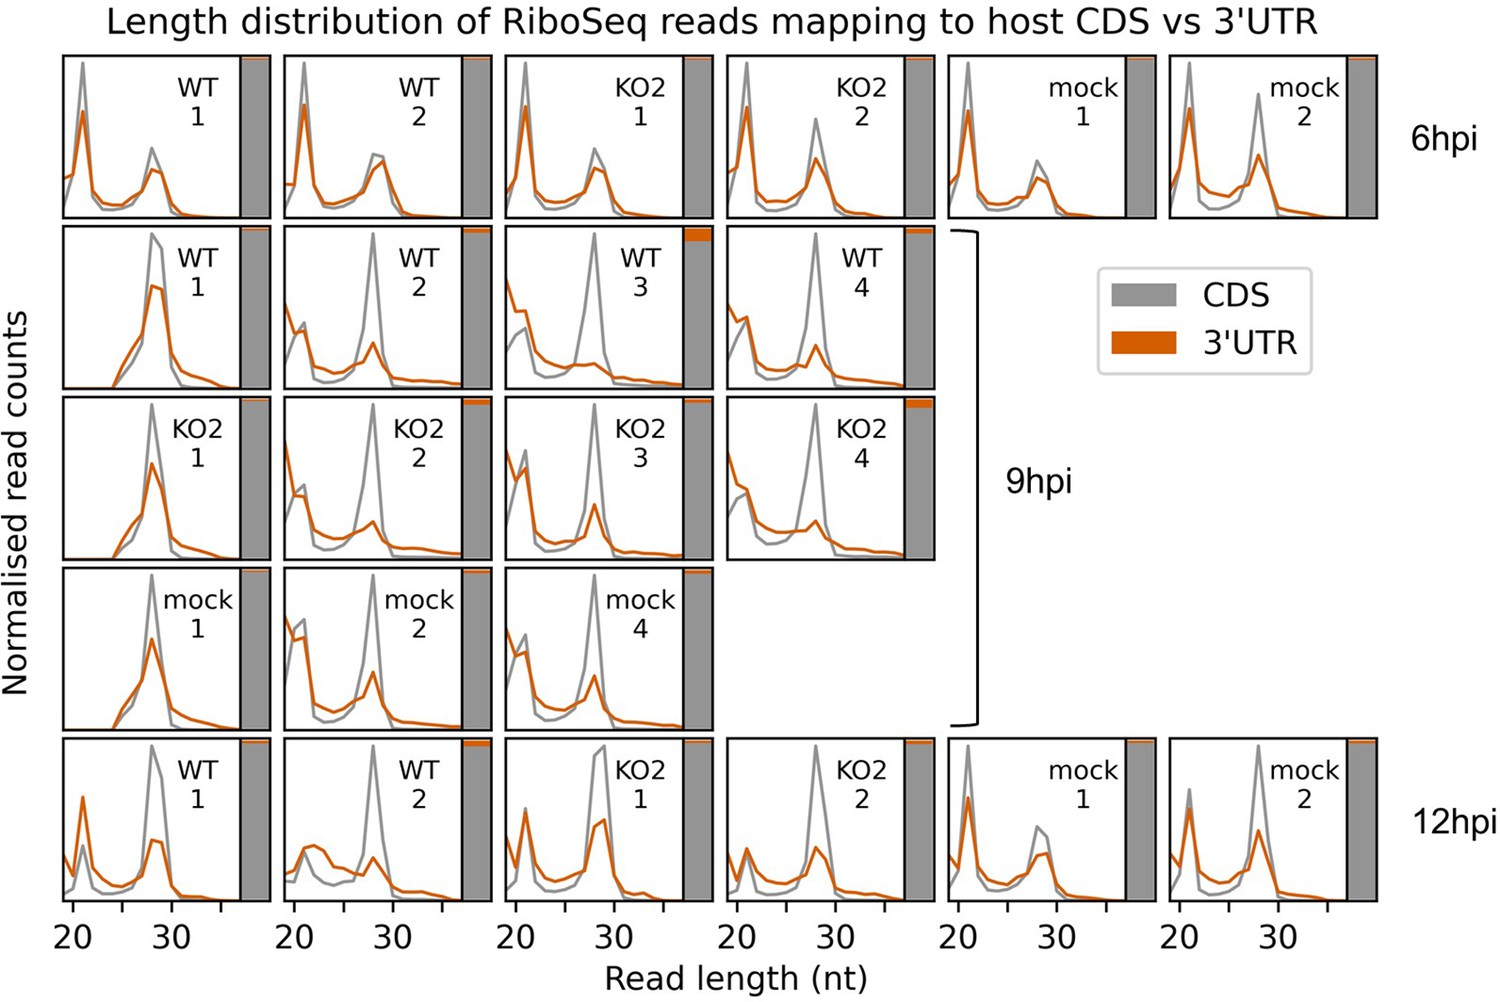
Assessment of potential ribonucleoprotein (RNP) contamination of host-mapping RiboSeq reads.
Length distribution (line graph) and relative density (stacked bar chart) of RiboSeq reads mapping to host CDSs (grey) compared to host 3′ UTRs (orange). Only host mRNAs with a CDS of at least 150 codons and a 3′ UTR of at least 100 codons were included in the analysis. The length distributions of positive-sense ribosome-protected fragments (RPFs) with inferred P sites in the CDS (codons −100 to −10 relative to the stop codon) and 3′ UTR (codons +10 to +100 relative to the stop codon) were determined and normalised by the total number of reads in each category to make the scales comparable. To the right of each length distribution, a stacked bar chart indicates the relative density of reads in each region (note that the 3′ UTR in orange is a minor component in this chart, reflective of its low read density relative to the CDS). Ribonucleoprotein (RNP) contamination is expected to affect both the CDSs and the UTRs but would be more visible in the UTRs due to the lower density of genuine RPFs (largely originating from multi-mapping reads aligning to transcript variants with identical regions annotated as CDS for some isoforms and 3′ UTR for others; multi-mapping reads were randomly assigned to a unique site). The uncontaminated 3′ UTR read length distribution should match the CDS-mapping read length distribution, but with lower relative density, as observed here in most samples. Where there are differences, they are also present in mock libraries, indicating that they are not related to infection. In any case, the relative density of 3′ UTR-mapping reads remains very low, indicating that RNP contamination is unlikely to affect most host mRNA analyses.
Figure 1—figure supplement 6
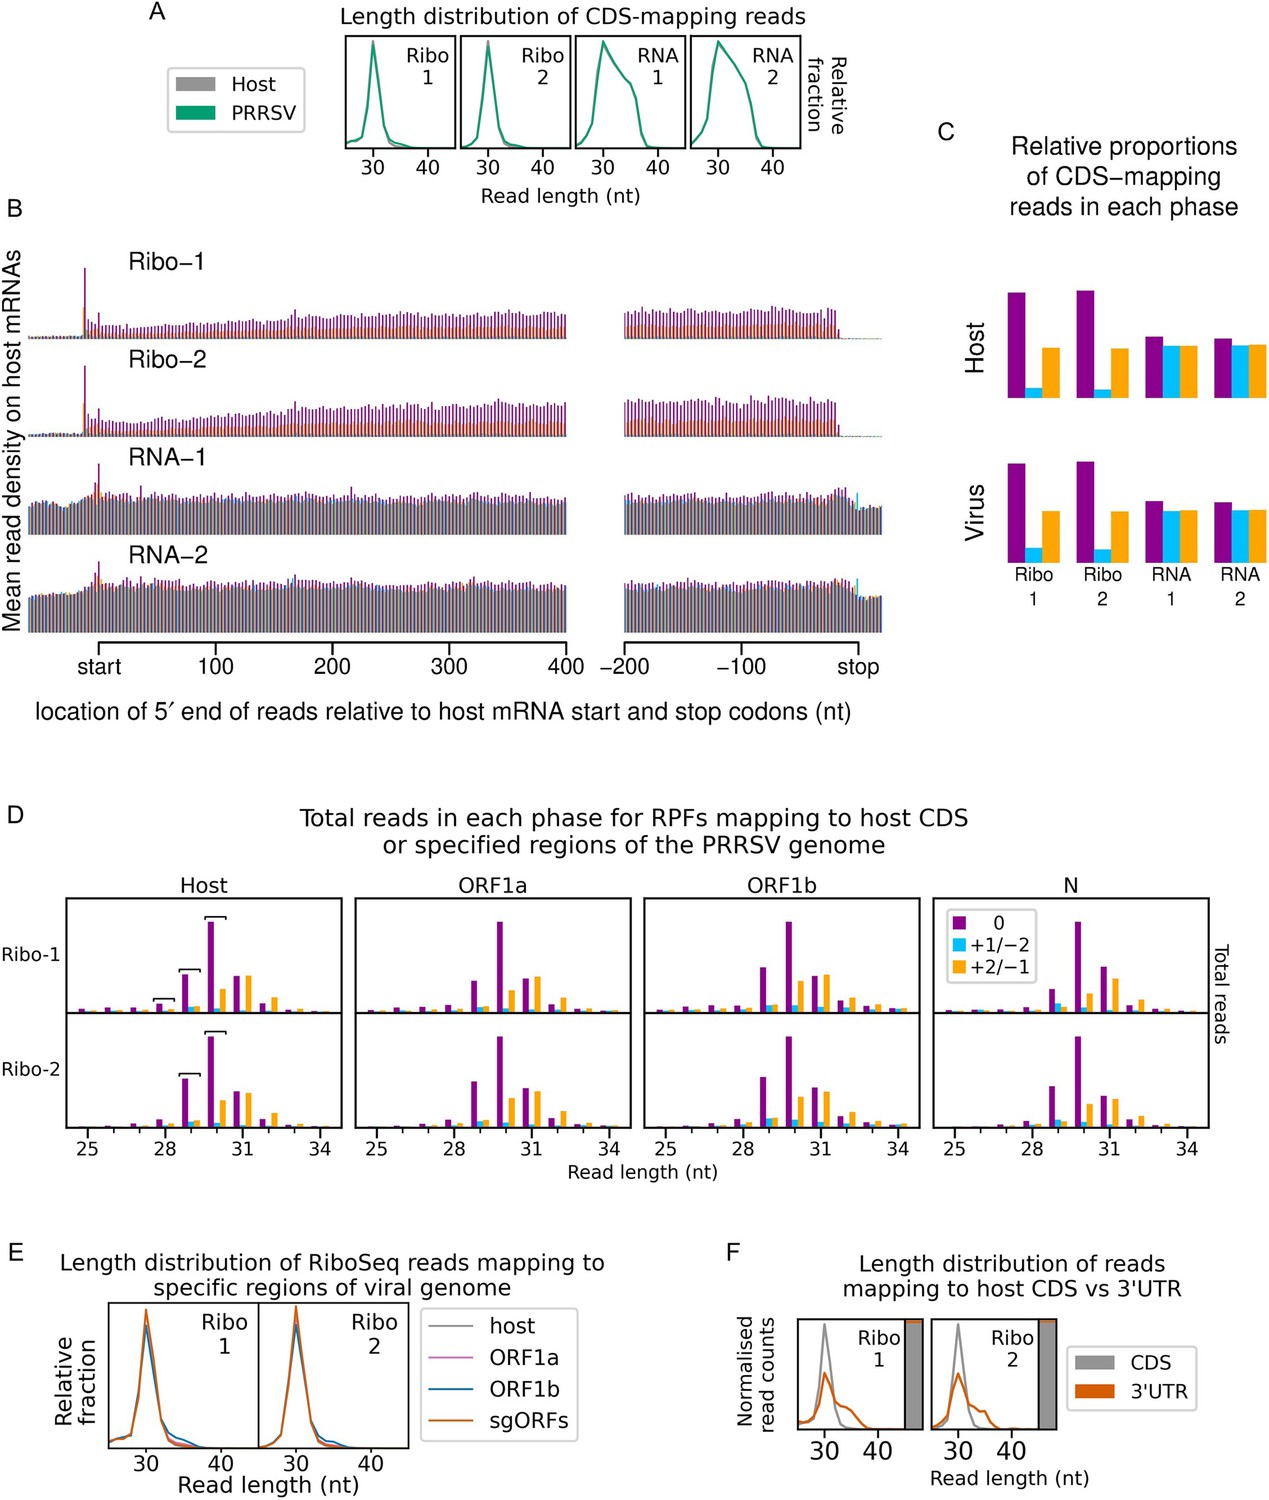
Quality control for the European porcine reproductive and respiratory syndrome virus (EU PRRSV) dataset.
(A) Length distribution of positive-sense host (grey) and virus (green) reads mapping within CDSs. Fragments of 25–34 nt were size-selected during the library preparation for all samples. (B) Metagene profile of the average distribution of 5′ ends of host mRNA-mapping reads relative to start and stop codons. Plot constructed as in Figure 1—figure supplement 1. (C) Proportion of host and viral reads attributed to each phase. Plot constructed as in Figure 1—figure supplement 2. (D) Number of reads of each length that are attributed to each phase for reads with 5′ ends mapping to specified regions of the viral genome. Plot constructed as in Figure 1—figure supplement 3. Ribonucleoprotein (RNP) contamination in these libraries is minimal, but to aid visualisation of phasing, read lengths for which at least two-thirds of host CDS-mapping reads are in phase 0 were selected for some (specified) plots and analyses. These read lengths are indicated by square brackets. (E) Length distribution of positive-sense RiboSeq reads with 5′ ends mapping to specified regions of the viral genome: ORF1a (purple), ORF1b (blue), and subgenomic (sg)RNA ORFs (orange). The length distribution of host CDS-mapping RPFs from (A) is reproduced for comparison (grey). (F) Length distribution (line graph) and relative density (stacked bar chart) of reads mapping to host CDSs (grey) compared to host 3′ UTRs (orange). Plot constructed as in Figure 1—figure supplement 5.
Figure 2 with 3 supplements

An overview of viral transcription and translation over a timecourse of infection.
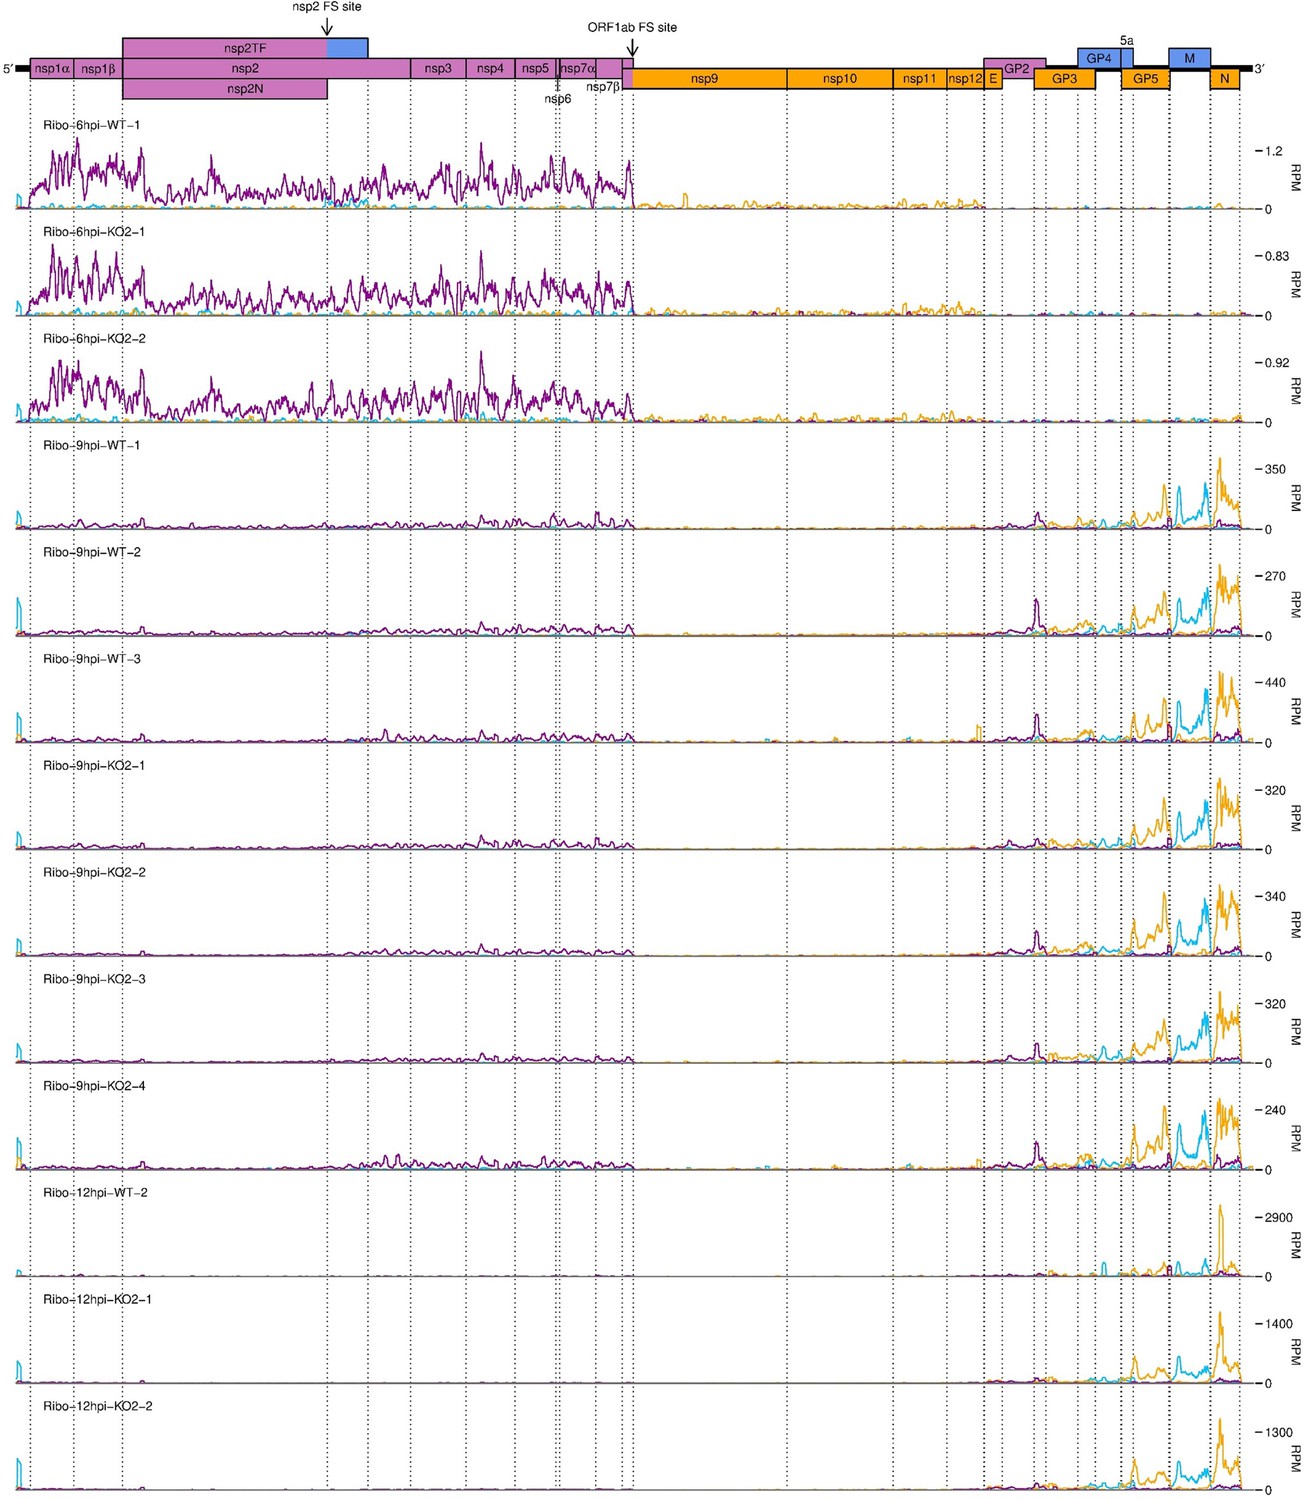
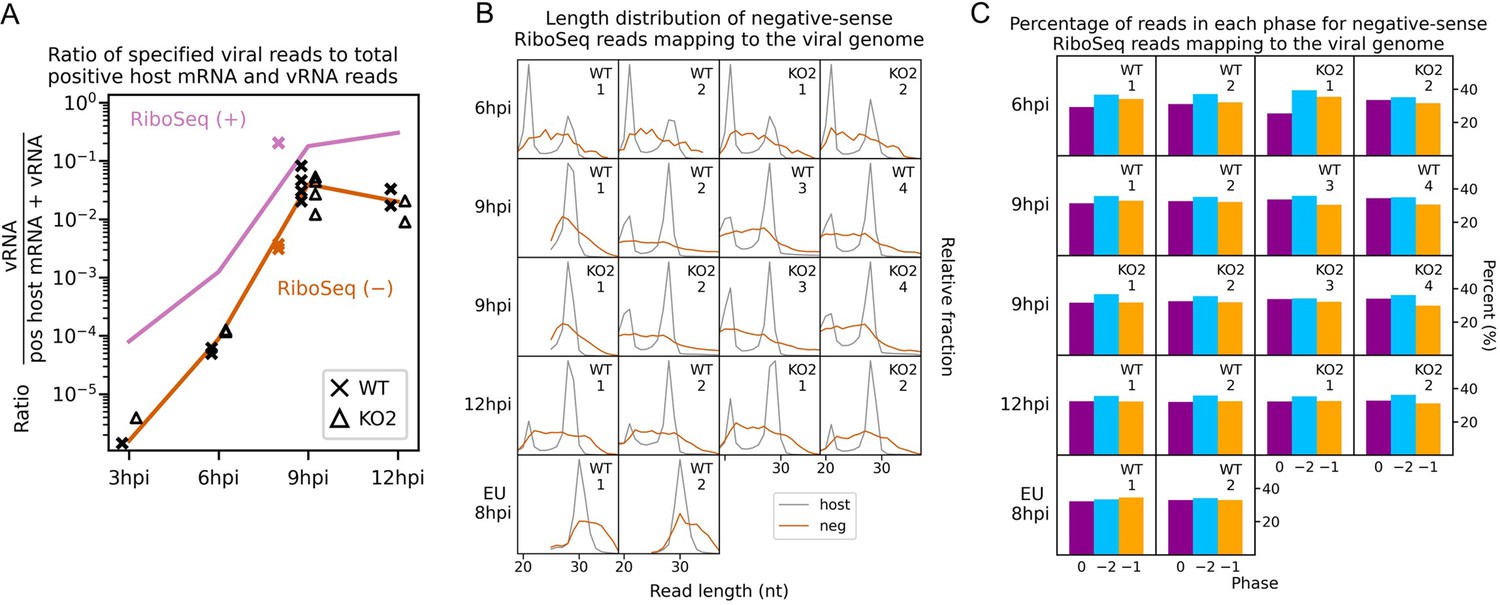
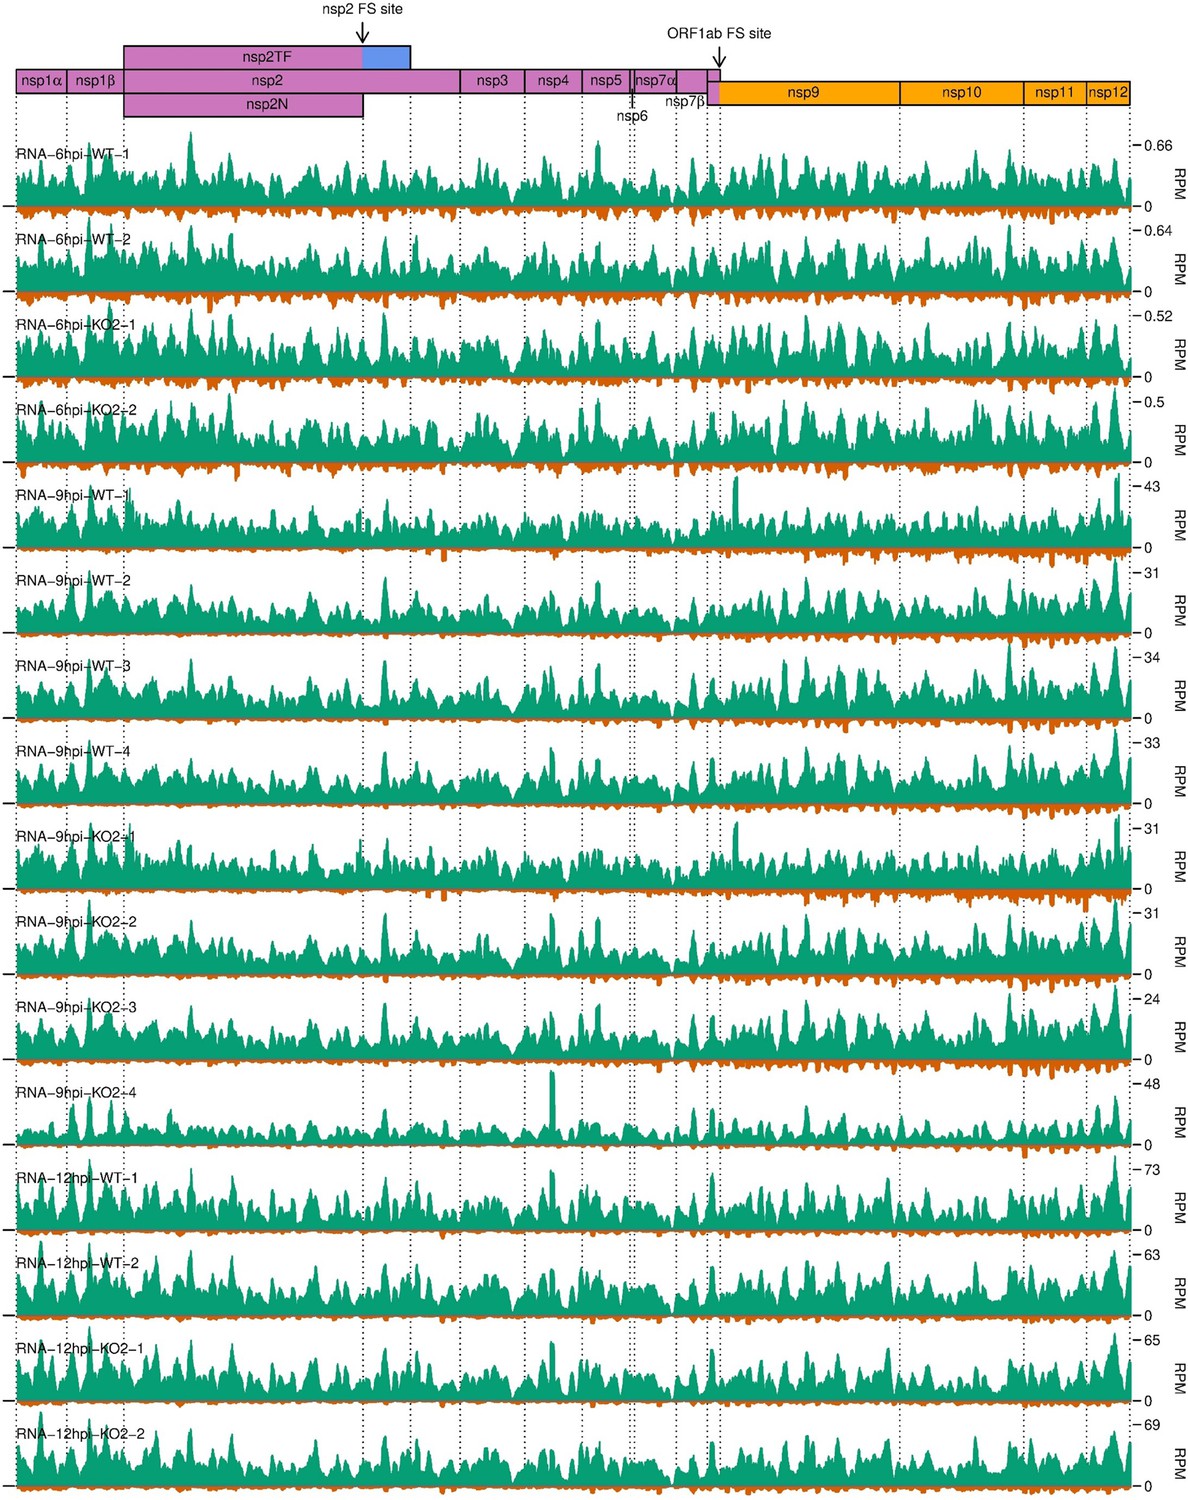
(A) Genome map of North American porcine reproductive and respiratory syndrome virus (NA PRRSV), reproduced from Figure 1A. (B) RNASeq read densities in reads per million mapped reads (RPM) on the WT viral genome, after application of a 45-nt running mean filter, from cells harvested over a timecourse of 3–12 hr post-infection (hpi). Positive-sense reads are plotted in green (above the horizontal axis), negative-sense in orange (below the horizontal axis). The WT libraries with the best RiboSeq quality control results were selected for this plot (3 hpi replicate 1, 6 hpi replicate 2, 9 hpi replicate 4, 12 hpi replicate 1), with further replicates and KO2 libraries shown in Figure 2—figure supplement 1. (C) RiboSeq read densities on the WT viral genome from the counterpart libraries to (B). Reads were separated according to phase (0: purple; –2/+1: blue; –1/+2: yellow), and densities plotted after application of a 15-codon running mean filter. Further replicates and KO2 libraries are shown in Figure 2—figure supplement 2. (D) Ratio of virus-mapping reads to (positive-sense host mRNA- plus positive-sense vRNA-mapping reads). Virus-mapping reads (all read lengths) in the numerator were split into the following categories: positive-sense RNASeq (green), negative-sense RNASeq (orange), and positive-sense RiboSeq (purple). Analysis of negative-sense RiboSeq reads can be found in Figure 2—figure supplement 3. The line graphs represent the mean ratios for each category for NA PRRSV (WT and KO2 combined), with individual datapoints for WT (crosses) and KO2 (triangles) overlaid, offset to the left and right, respectively. EU PRRSV (8 hpi) ratios are plotted as individual datapoints represented by crosses in the category colour. The RiboSeq (+) 3 hpi timepoint is plotted here to represent the upper limit of the NA PRRSV fraction at this timepoint, likely inflated by the relatively high proportion of non-ribosome-protected fragment (non-RPF) reads in these libraries. (E) Data from (D) represented on a linear scale. Here, data from WT (solid bars) and KO2 (hatched bars) are plotted separately, and individual datapoints are plotted as black circles. (F) Ratio of the density of subgenomic (sg)RNA-mapping reads to ORF1a-mapping reads. All read lengths were used, and densities were calculated as reads per kilobase per million mapped reads (RPKM) of reads from each category in (E). RiboSeq 3 hpi libraries were excluded, and negative-sense RNASeq was omitted from the plot at 3 hpi due to the number of reads being insufficient for robust assessment of the ratio. Categories arranged and plot constructed as in (E), with a grey line indicating a ratio of 1.
Figure 2—figure supplement 1
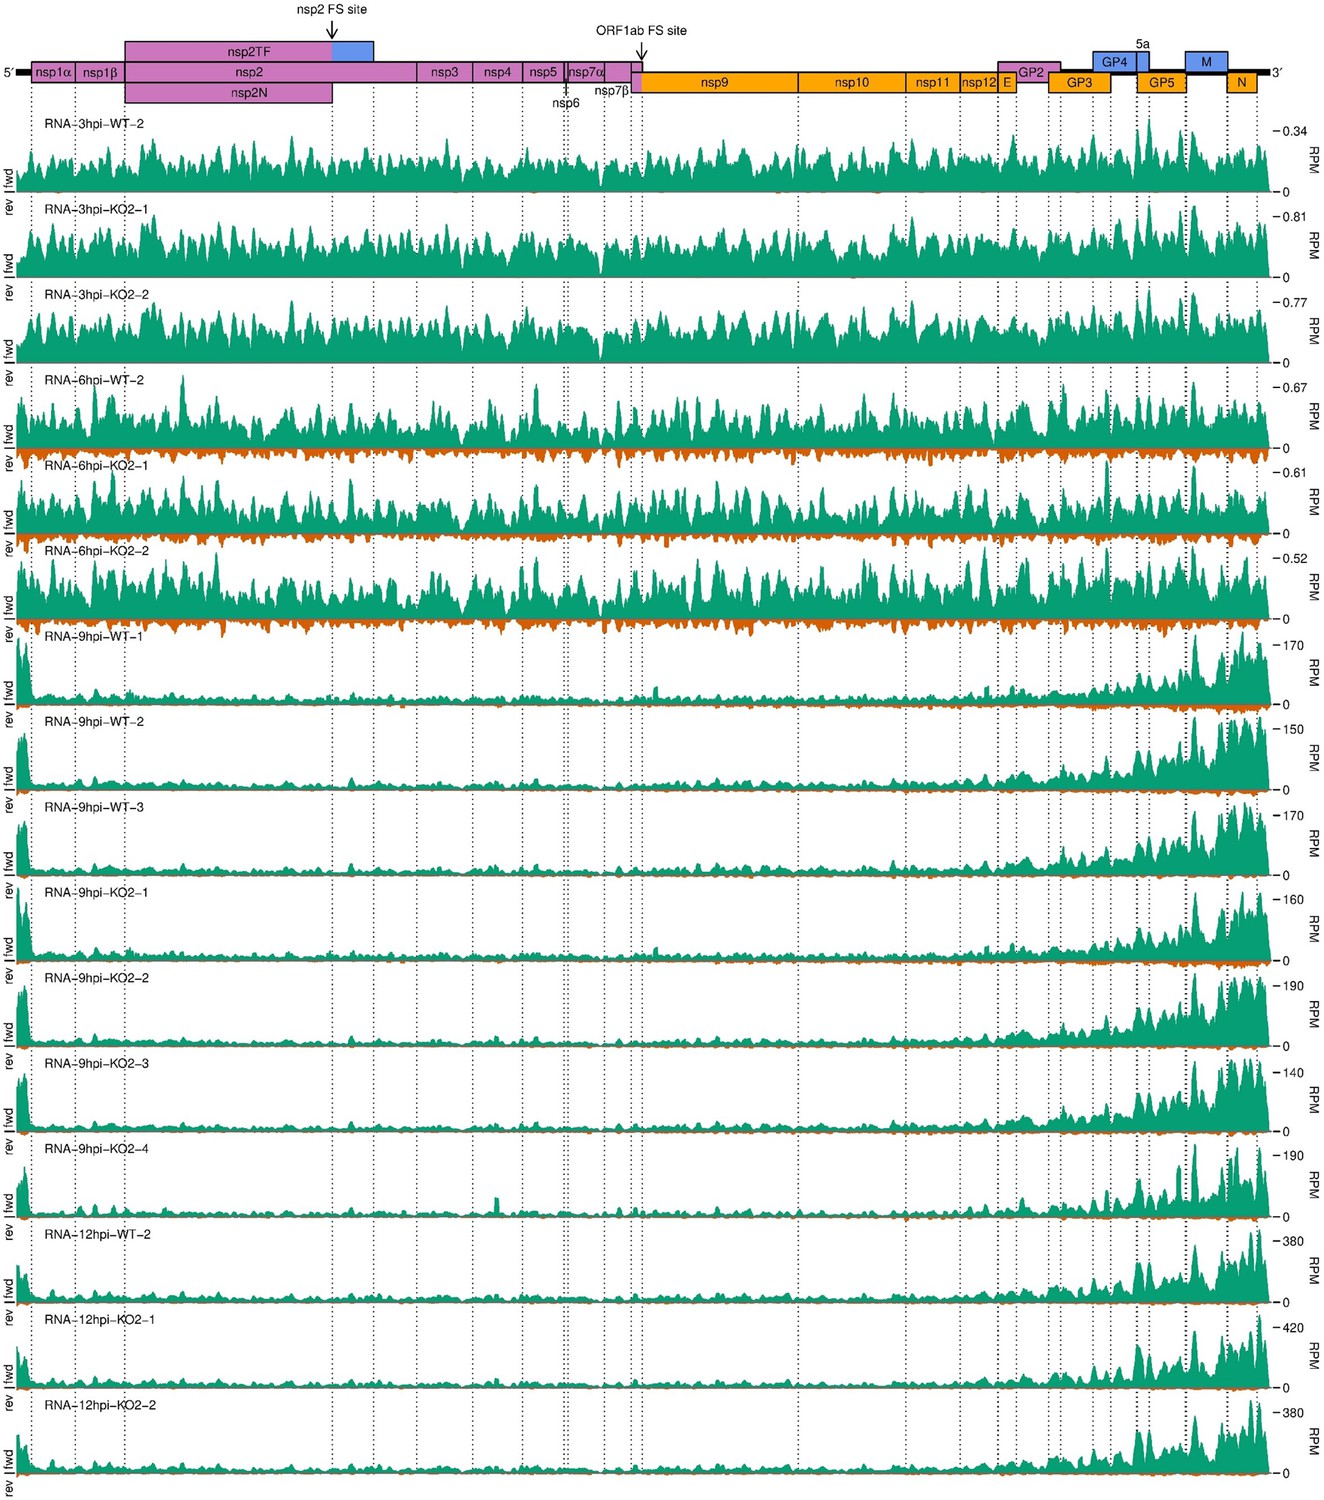
Further replicates of a timecourse of North American porcine reproductive and respiratory syndrome virus (NA PRRSV) viral transcription.
Figure 2—figure supplement 2
Further replicates of a timecourse of North American porcine reproductive and respiratory syndrome virus (NA PRRSV) viral translation.
Figure 2—figure supplement 3
Investigation of negative-sense RiboSeq reads.
(A) Ratio of virus-mapping reads to (positive-sense host mRNA- plus positive-sense vRNA-mapping reads) for negative-sense RiboSeq reads. Mean values for RiboSeq (+) at each timepoint for North American porcine reproductive and respiratory syndrome virus (NA PRRSV) (lines) and individual datapoints for European (EU) PRRSV (crosses) are reproduced from Figure 2D for comparison. Plot constructed as in Figure 2D. (B) Length distribution of negative-sense RiboSeq reads (orange) mapping to the viral genome for NA (6–12 hr post-infection [hpi]) or EU (8 hpi) PRRSV. The length distribution of host CDS-mapping ribosome-protected fragments (RPFs) from Figure 1C and Figure 1—figure supplement 6A is reproduced for comparison (grey). (C) Percentage of reads attributed to each phase for negative-sense RiboSeq reads mapping to the viral genome for NA (6–12 hpi) or EU (8 hpi) PRRSV.
Figure 3
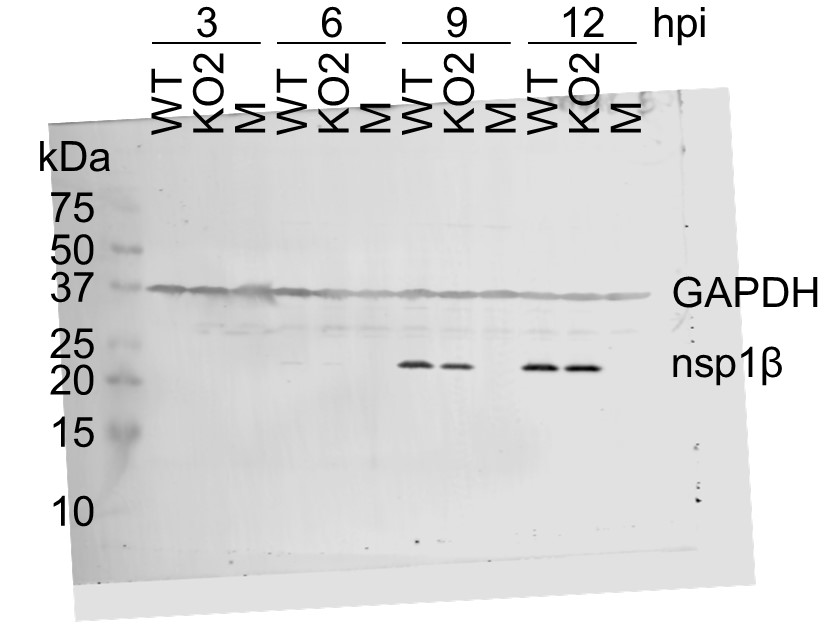
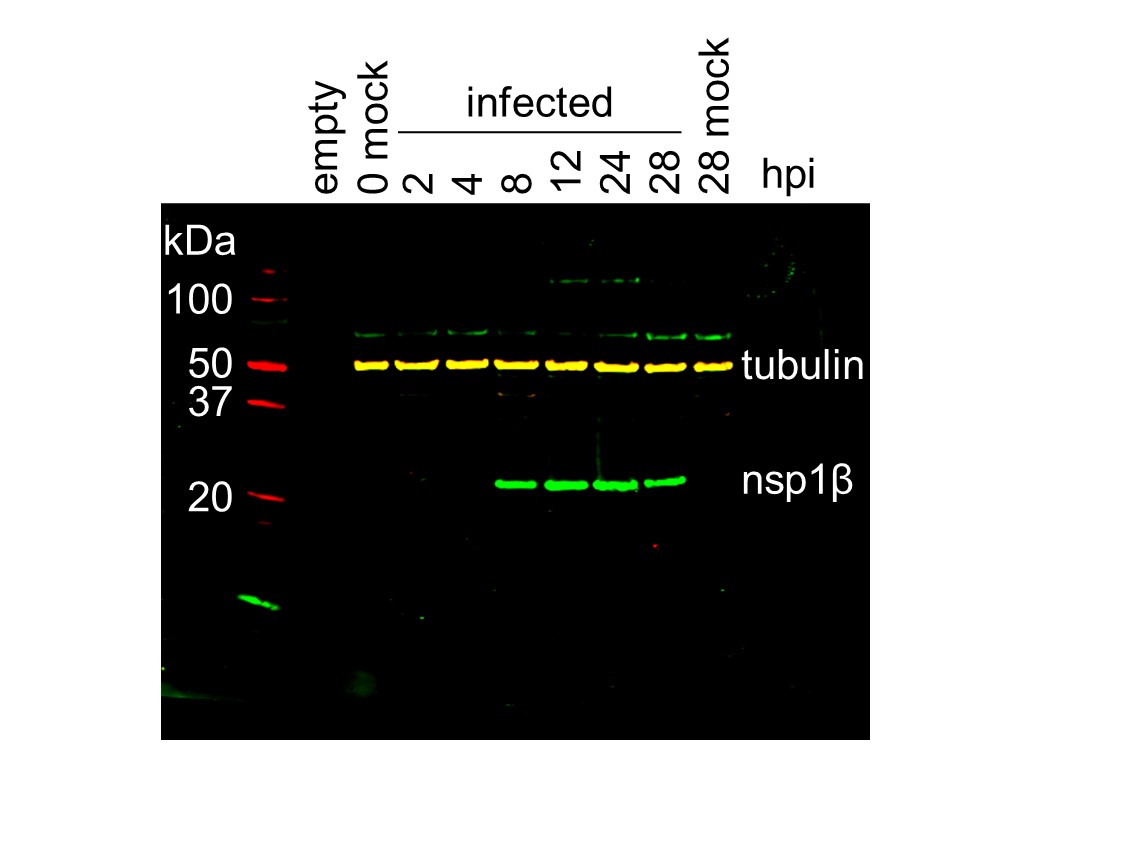
Transcription and translation of the European porcine reproductive and respiratory syndrome virus (EU PRRSV) genome and Western blots of non-structural protein 1β (nsp1β).
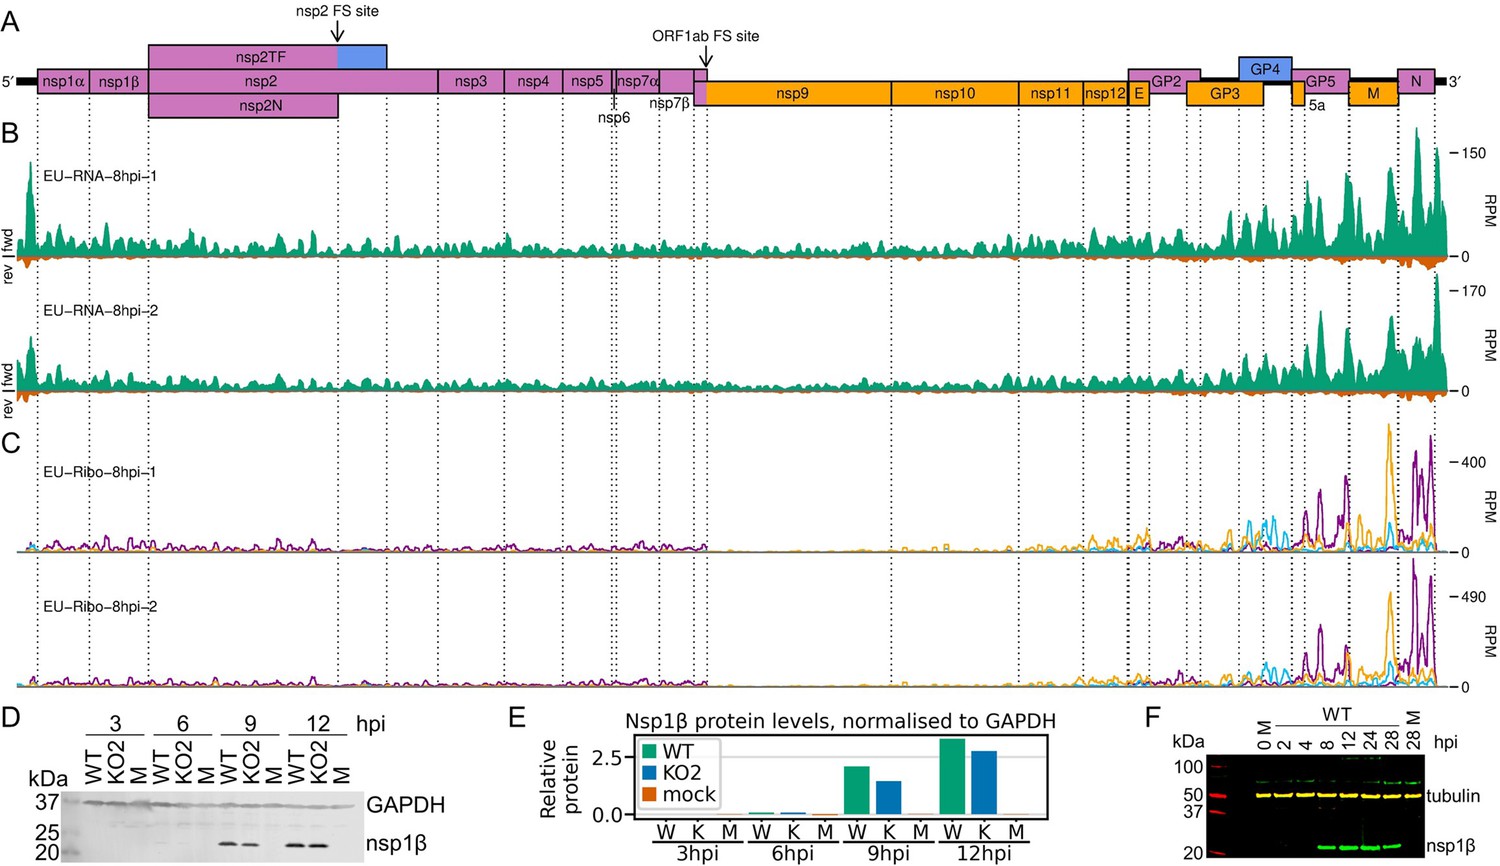
(A) Genome map of the EU PRRSV strain used in this study (GenBank accession OK635576.1). Genome map constructed as in Figure 1A, with subgenomic RNAs omitted for space considerations. (B) RNASeq read densities on the EU PRRSV genome. Plot constructed as in Figure 2B. (C) RiboSeq read densities on the EU PRRSV genome. Plot constructed as in Figure 2C, except for the selection of read lengths to include – in this case, read lengths showing good phasing were selected for inclusion (indicated in Figure 1—figure supplement 6D). (D) Western blot of lysates used for North American (NA) PRRSV ribosome profiling (replicate 1 samples) with antibodies to viral protein nsp1β (23 kDa) and cellular protein GAPDH (36 kDa) as a loading control. M, mock. (E) Quantification of the Western blot from panel (D) to determine the level of nsp1β relative to GAPDH. W, WT; K, KO2. (F) Western blot of nsp1β expression in MA-104 cells infected with EU PRRSV, harvested over a 28 hr timecourse.
-
Figure 3—source data 1
Raw tiff of Western blot in Figure 3D.
- https://cdn.elifesciences.org/articles/75668/elife-75668-fig3-data1-v2.tif
-
Figure 3—source data 2
Image of full Western blot in Figure 3D, with bands labelled.
- https://cdn.elifesciences.org/articles/75668/elife-75668-fig3-data2-v2.jpg
-
Figure 3—source data 3
Quantification of band densities in Western blot in Figure 3D and normalised results presented in Figure 3E.
- https://cdn.elifesciences.org/articles/75668/elife-75668-fig3-data3-v2.xlsx
-
Figure 3—source data 4
Raw tiff of Western blot in Figure 3F.
- https://cdn.elifesciences.org/articles/75668/elife-75668-fig3-data4-v2.tif
-
Figure 3—source data 5
Image of full Western blot in Figure 3F, with bands labelled.
- https://cdn.elifesciences.org/articles/75668/elife-75668-fig3-data5-v2.jpg
Figure 4
The North American porcine reproductive and respiratory syndrome virus (NA PRRSV) transcriptome at 3, 6, and 12 hr post-infection (hpi).
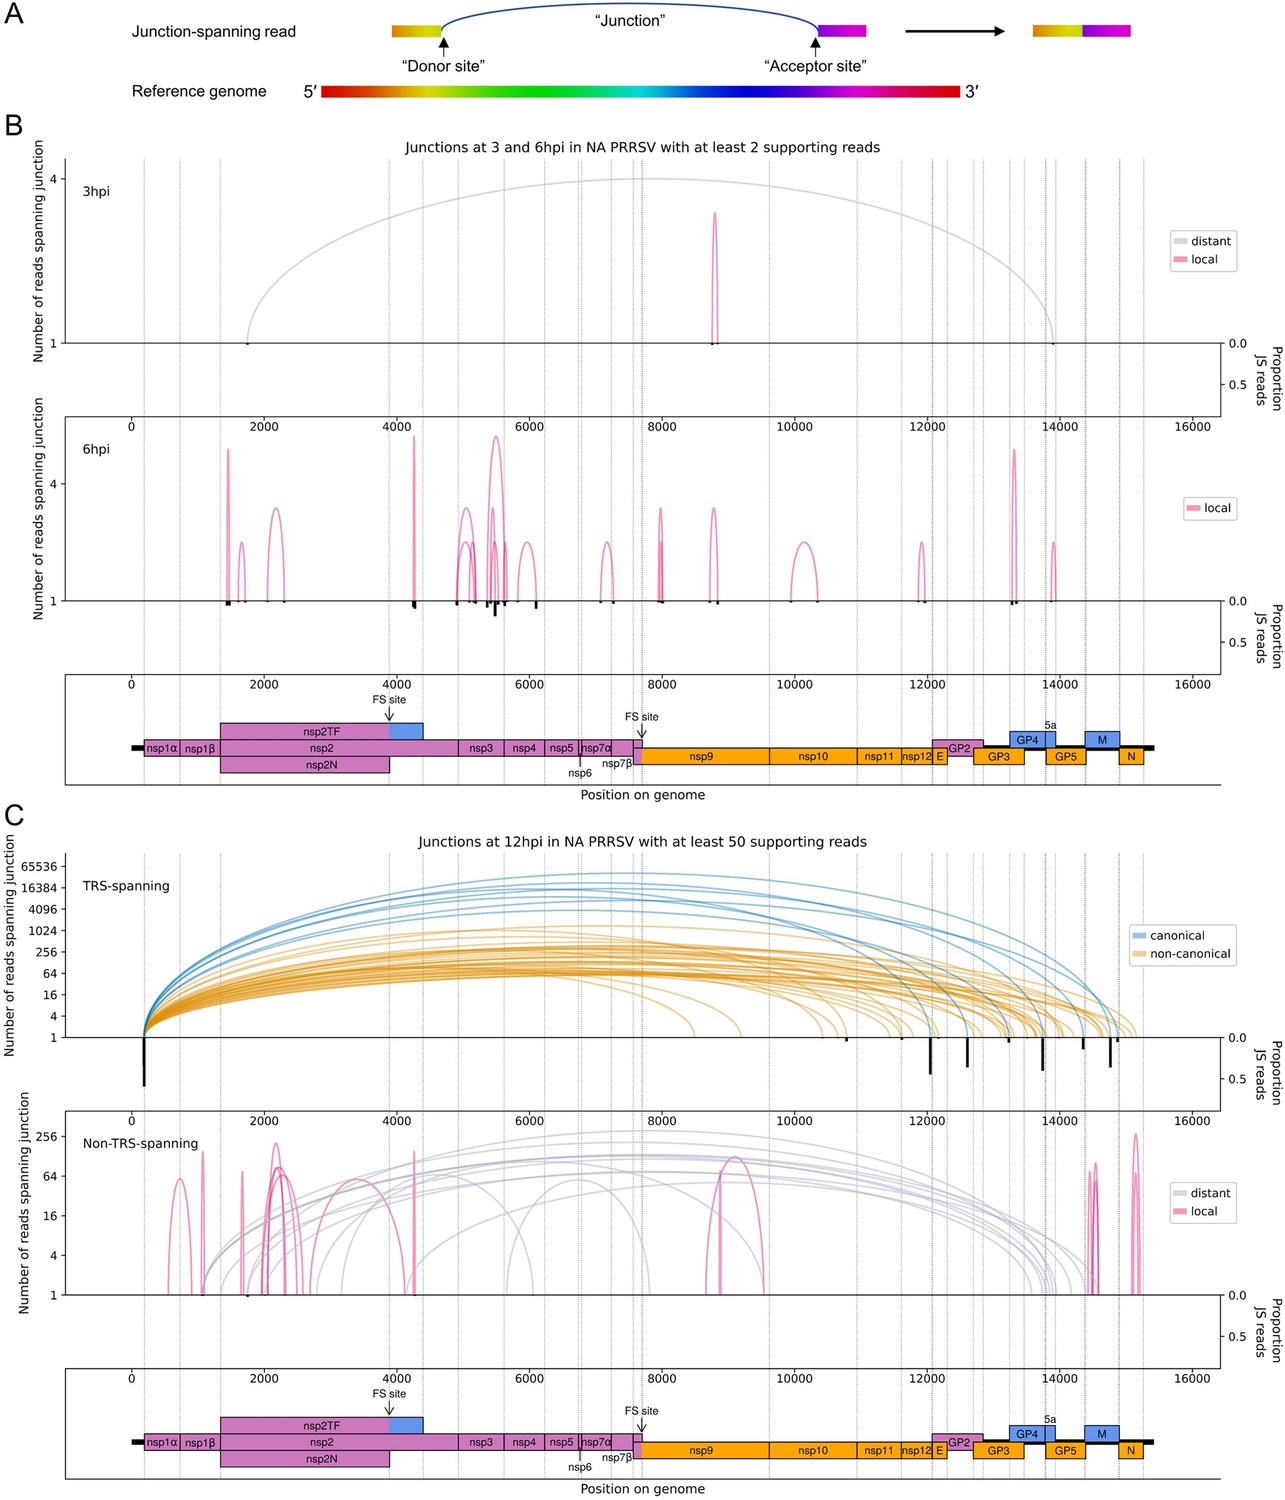
(A) Illustrative schematic of a junction-spanning (JS) read (not to scale). The blue arc (‘Junction’) represents a deletion in the read with respect to the reference genome. (B) Sashimi plot of junctions in the NA PRRSV dataset at early timepoints during infection (3 and 6 hpi). The number of reads supporting each junction is indicated (on a logarithmic scale) by the highest point of its arc and represents the total number of reads spanning the junction in all libraries from the specified timepoint combined. Only junctions for which this number is ≥2 are plotted (which, for these timepoints, does not include any transcription regulatory sequence (TRS)-spanning junctions). Beneath the sashimi plot is an inverted bar chart (black) of the proportion of reads at each donor and acceptor site that span the junction of interest, plotted on a linear scale (see Materials and methods for details). Lists of all junctions from these timepoints, and their associated proportions of JS reads, are given in Figure 4—source data 1–3. Internal deletions, in which the donor site does not overlap the leader TRS, are coloured according to whether the deletion is distant (>2000 nt deleted, grey) or local (≤2000 nt deleted, red). (C) Upper: sashimi plot of TRS-spanning junctions at 12 hpi, with the major junction for each canonical subgenomic (sg)RNA shown in blue (including both N-long and N-short for the N sgRNA), and other junctions (‘non-canonical’) shown in orange. Both upper and lower panels were constructed as in panel (A) except that the threshold for inclusion of junctions was adjusted to ≥50 supporting reads. Lower: sashimi plot of junctions representing internal deletions.
-
Figure 4—source data 1
Junctions in the North American porcine reproductive and respiratory syndrome virus (NA PRRSV) transcriptome at 3 hr post-infection (hpi).
Sheets 1 and 3 (‘Filtered TRS junctions’ and ‘Filtered non-TRS-spanning junctions’): final junctions after clustering and merging within each library and then filtering to select only junctions present in multiple replicates. All results are shown, including those with too few reads to pass the filter for inclusion on the sashimi plots. ‘Donor cluster’ and ‘Acceptor cluster’ columns show the group of genomic coordinates that formed the final merged cluster for the donor and acceptor of each junction. ‘Input junctions’ gives the pairings (donor_acceptor) of these coordinates in the input junctions from the input libraries, and ‘Input junction read counts’ gives the corresponding number of junction-spanning (JS) reads for each pairing. ‘Total junction read counts’ is the sum of all the input junction read counts. ‘Donor midpoint’ and ‘Acceptor midpoint’ columns give the midpoints of the ranges of coordinates within the donor and acceptor clusters – these were used as the junction coordinates for making the sashimi plots and for calculating the number of non-JS reads spanning each site. The ‘Libraries with reads supporting junction’ column gives the libraries in which the input junctions were found. The ‘Row IDs’ column gives the row IDs of the input junctions from these libraries, which were merged to generate the output junction in this sheet. These row IDs can be used to inspect the input junctions from each individual library pre-merging, which can be found in the ‘Input TRS junctions’ and ‘Input non-TRS-spanning junctions’ sheets. The ‘sgRNA name’ column gives the name of the sgRNA, including non-canonical sgRNAs and minor transcript variants (‘-’ = not applicable). ‘Deletion length’ (non-TRS-spanning sheet only) is the length, in nucleotides, of the region that is deleted due to each junction. ‘Donor non-JS read count’ and ‘Acceptor non-JS read count’ columns give the number of non-JS reads that span each site. ‘Proportion of JS reads at donor site’ and ‘Proportion of JS reads at acceptor site’ columns give the proportions of JS reads at each site, calculated as described in Materials and methods. Sheets 2 and 4 (‘Input TRS junctions’ and ‘Input non-TRS-spanning junctions’): junctions after clustering and merging within each individual library, which formed the input for the final filtering step that tests for presence in multiple replicates and merges matching junctions. Columns are as described for sheets 1 and 3.
- https://cdn.elifesciences.org/articles/75668/elife-75668-fig4-data1-v2.xlsx
-
Figure 4—source data 2
Junctions in the North American porcine reproductive and respiratory syndrome virus (NA PRRSV) transcriptome at 6 hr post-infection (hpi).
Table and columns as described for Figure 4—source data 1.
- https://cdn.elifesciences.org/articles/75668/elife-75668-fig4-data2-v2.xlsx
-
Figure 4—source data 3
Junctions in the North American porcine reproductive and respiratory syndrome virus (NA PRRSV) transcriptome at 12 hr post-infection (hpi).
Table and columns as described for Figure 4—source data 1.
- https://cdn.elifesciences.org/articles/75668/elife-75668-fig4-data3-v2.xlsx
Figure 5
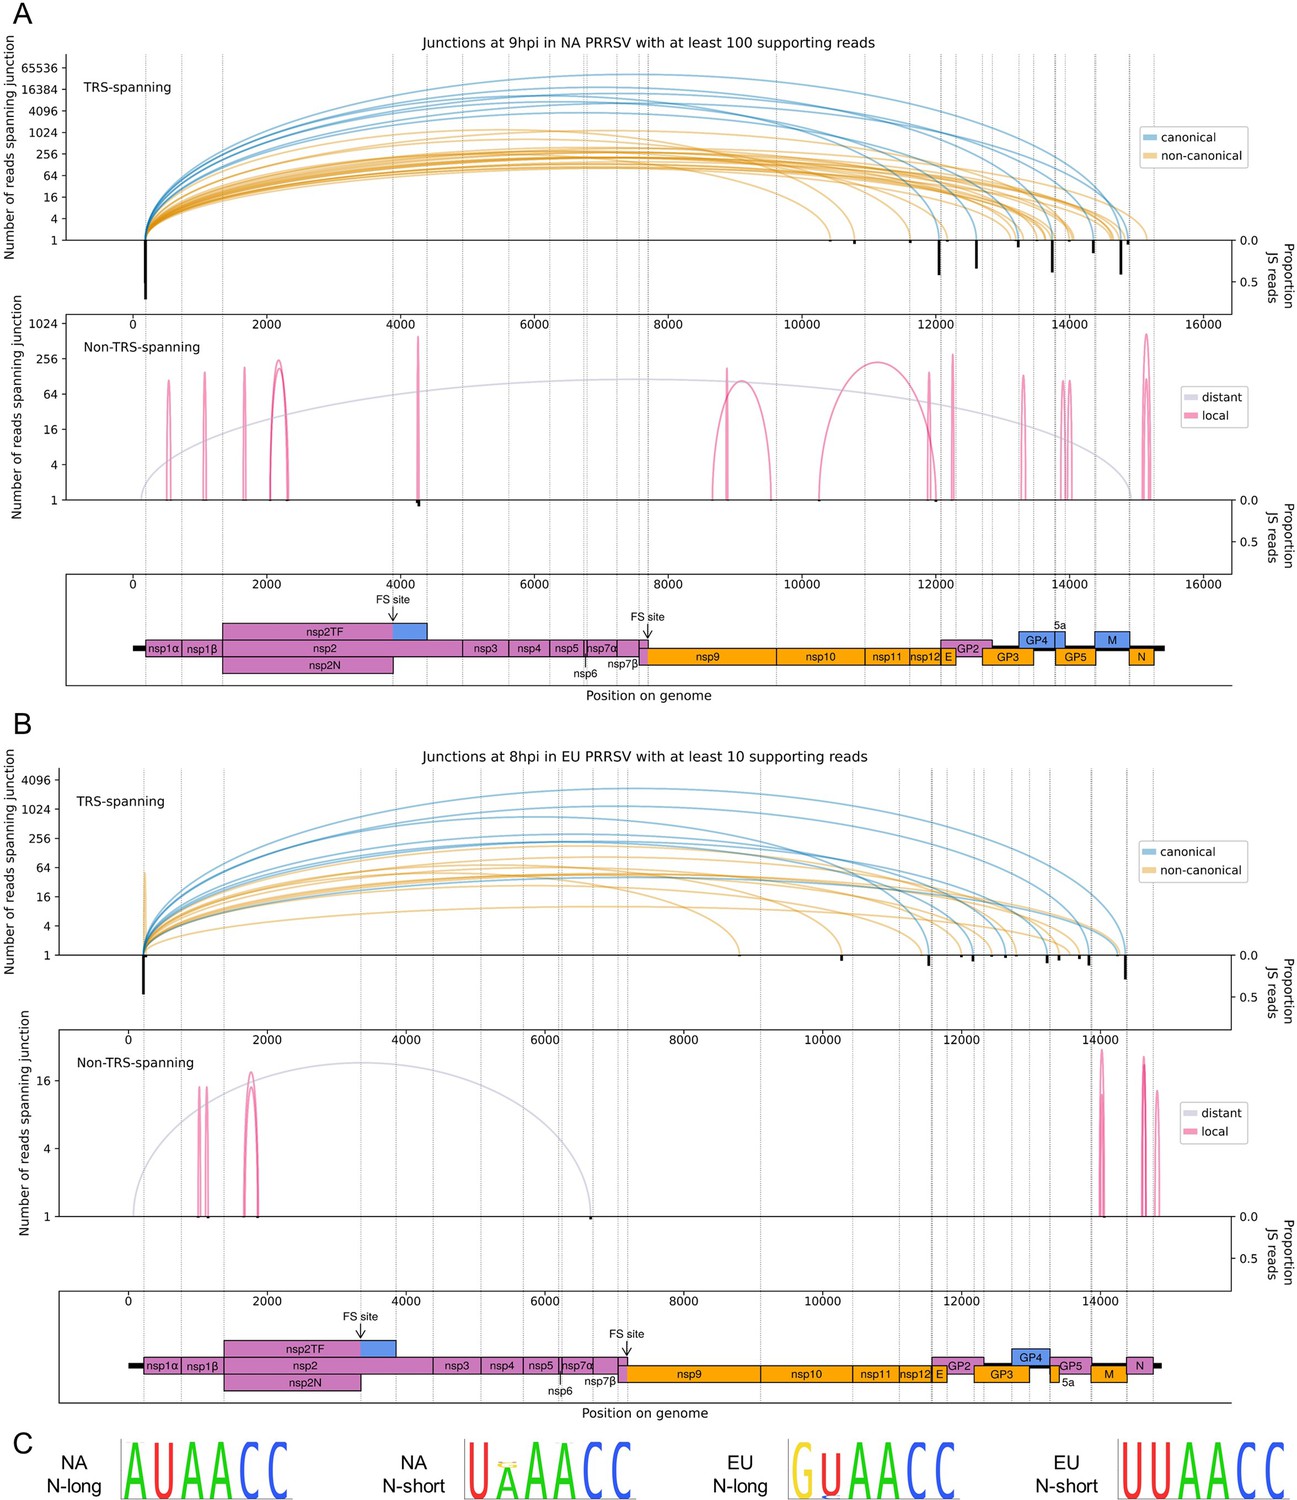
The North American (NA) and European (EU) porcine reproductive and respiratory syndrome virus (PRRSV) transcriptomes at 9 and 8 hr post-infection (hpi), respectively.
(A) Sashimi plots of junctions for NA PRRSV at 9 hpi. Plots constructed as in Figure 4C, but with the threshold for inclusion of junctions adjusted to ≥100 junction-spanning (JS) reads in total from all 9 hpi libraries (as eight libraries were analysed at this timepoint compared to four at other timepoints). (B) Sashimi plots of junctions for EU PRRSV at 8 hpi. Plots constructed as in Figure 4C, but with the threshold for inclusion of junctions adjusted to ≥10 supporting reads (as only two libraries were analysed and shorter read lengths are expected to lead to fewer identifiably JS reads). Lists of all junctions from these timepoints, and their associated proportion of JS reads, are given in Figure 5—source data 1 and 2. (C) Conservation of the body transcription regulatory sequences (TRSs) for N-long and N-short in both species of PRRSV, based on all available full-genome sequences.
-
Figure 5—source data 1
Junctions in the North American porcine reproductive and respiratory syndrome virus (NA PRRSV) transcriptome at 9 hr post-infection (hpi).
Table and columns as described for Figure 4—source data 1.
- https://cdn.elifesciences.org/articles/75668/elife-75668-fig5-data1-v2.xlsx
-
Figure 5—source data 2
Junctions in the European porcine reproductive and respiratory syndrome virus (EU PRRSV) transcriptome at 8 hr post-infection (hpi).
Table and columns as described for Figure 4—source data 1.
- https://cdn.elifesciences.org/articles/75668/elife-75668-fig5-data2-v2.xlsx
Figure 6 with 3 supplements
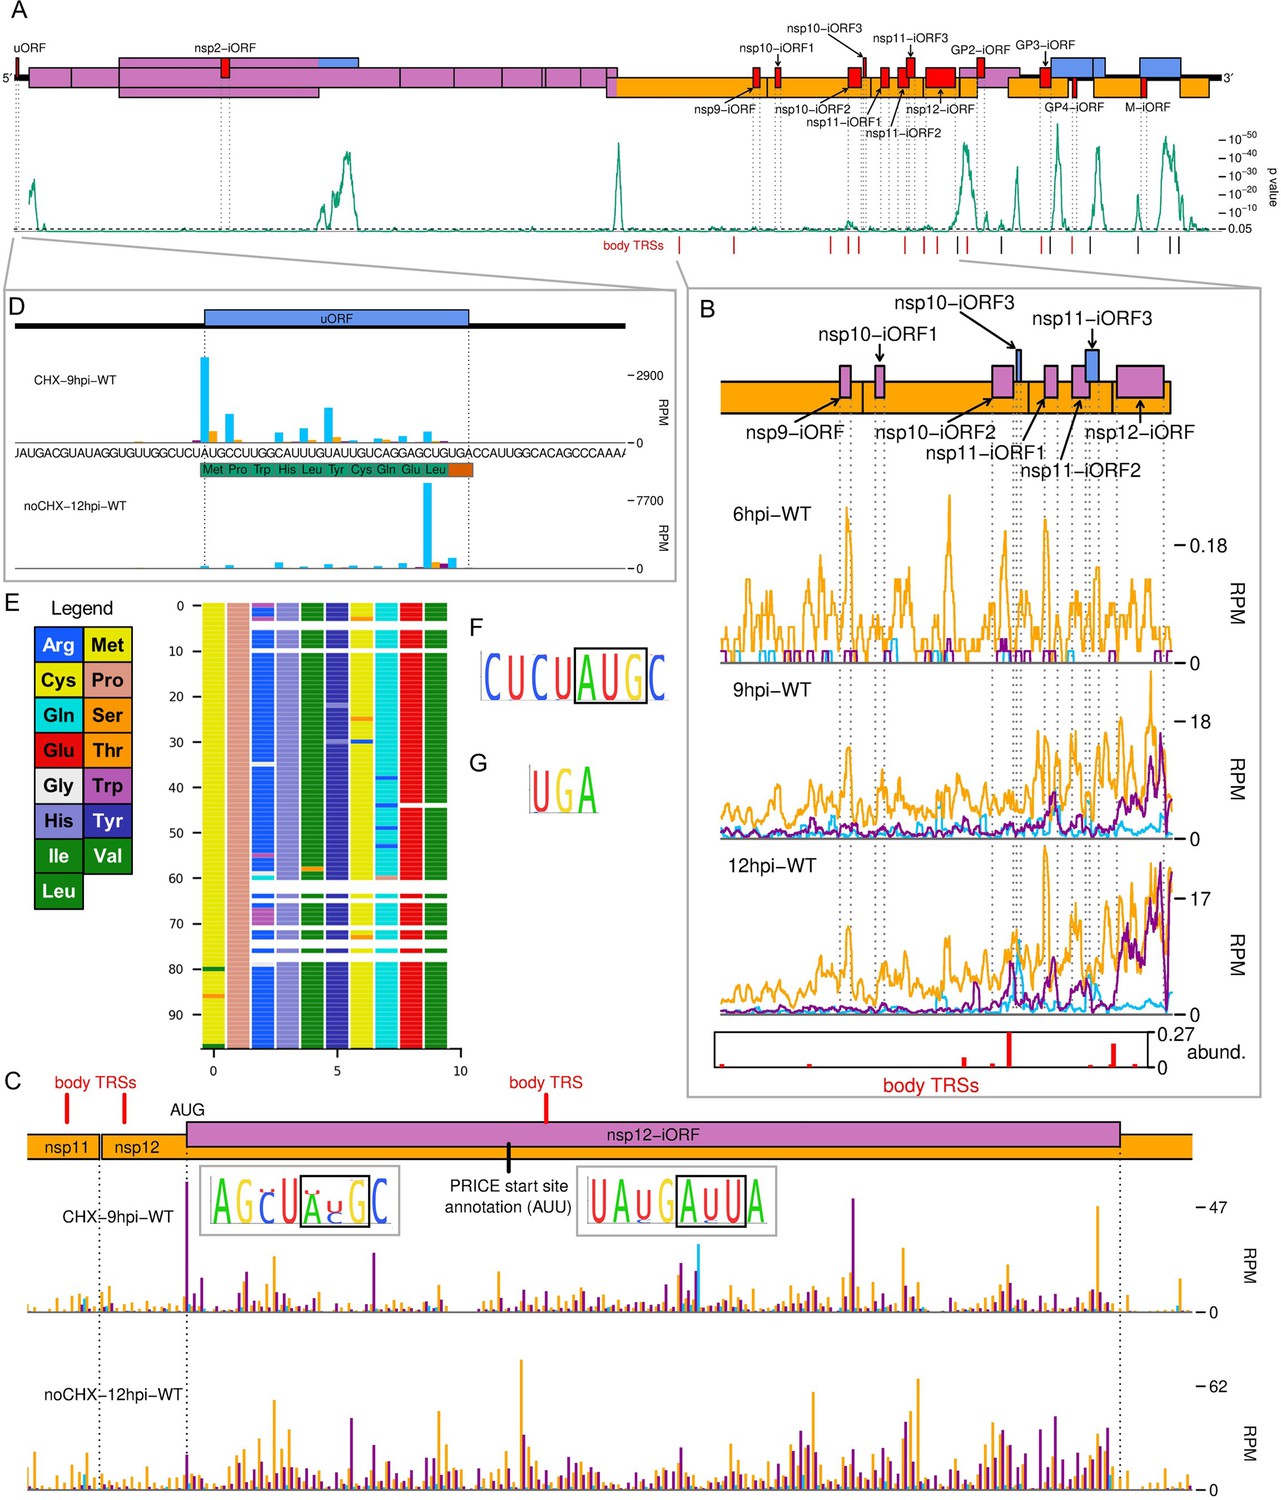
The North American porcine reproductive and respiratory syndrome virus (NA PRRSV) translatome.
(A) Locations of novel ORFs (red) in the NA PRRSV genome, offset on the y-axis according to frame relative to ORF1a. Below this is a SYNPLOT2 (Firth, 2014) analysis of synonymous site conservation in the canonical protein-coding regions, based on 137 NA PRRSV genomes representative of NA PRRSV diversity (see Materials and methods). The green line represents the probability (over a 25-codon sliding window) that the observed conservation could occur under a null model of neutral evolution at synonymous sites; with peaks indicative of overlapping functional elements (such as ORFs). Locations of known (black) and selected novel (red) body transcription regulatory sequences (TRSs) are indicated below. Our analysis of the European (EU) PRRSV translatome can be found in Figure 6—figure supplement 2. (B) Translation of novel ORFs overlapping ORF1b. Reads mapping to the NA PRRSV genome between the ORF1b sgRNA 1 body TRS and the end of ORF1b are shown, separated according to phase and plotted after application of a 15-codon running mean filter. Novel ORFs on the genome map are coloured according to frame relative to ORF1a. Positions of moderately frequently used body TRSs (at least 44 junction-spanning reads) are indicated by red bars at the bottom of the plot, with the height of each bar scaled according to transcript abundance (‘abund.’; see Materials and methods for details). The libraries displayed are those in Figure 2C, with remaining replicates and KO2 libraries in Figure 6—figure supplement 1. (C) Main: ribosome-protected fragment (RPF) distribution on the region of the NA PRRSV genome predicted to contain non-structural protein (nsp)12-iORF. RPFs are coloured according to phase and plotted without application of a sliding window. Quality control analyses for CHX-9hpi-WT are in Figure 6—figure supplement 3, and noCHX-12hpi-WT is replicate 1. The positions of body TRSs with ≥50 junction-spanning reads at 12 hr post-infection (hpi) are indicated by a red bar at the top of the genome map. The final initiation codon predicted by PRICE is an AUU codon, indicated by a black line. However, the observed RPF profiles are more consistent with the N-terminally extended ORF annotated in this plot, for which ribosomes would initiate at the upstream AUG. Insets: conservation of the context of the upstream AUG (left) and PRICE-predicted AUU (right), based on 661 available sequences for full NA PRRSV genomes. The putative initiator codons are indicated by black boxes. (D) Distribution of RPFs mapping to the region of the NA PRRSV 5′ UTR containing the upstream ORF (uORF). Plot constructed as in panel (C), with the genome sequence in this region, and the uORF amino acid sequence, underlaid. Note that cycloheximide (CHX) pre-treated libraries typically have heightened initiation peaks, while libraries harvested without CHX pre-treatment have heightened termination peaks. (E) Predicted amino acid sequences of the uORF from 98 PRRSV genomes representative of NA PRRSV diversity. Visualisation made using CIAlign (Tumescheit et al., 2022), with each row representing one sequence, each coloured rectangle representing an amino acid, and gaps indicating translation termination due to a stop codon. (F, G) Conservation of (F) the initiation context and (G) the stop codon for the NA PRRSV uORF. The initiator AUG is indicated by a black box. The initiation context of this ORF is weak, as defined by the absence of a G at position +4 or a A/G at position –3 relative to the A of the AUG, but the sequence is highly conserved.
-
Figure 6—source data 1
ORFs in the porcine reproductive and respiratory syndrome virus (PRRSV) translatome detected by PRICE.
Sheet 1: output from running PRICE on the North American (NA) PRRSV libraries, filtered to select viral ORFs with false discovery rate (FDR)-corrected p-value<0.05. Columns and outputs are as described in the PRICE manual (output file ${prefix}.orfs.tsv), with two additional columns: ‘ORF name’, giving the assigned ORF names, and ‘FDR-corrected p value’, giving the p-value after Benjamini–Hochberg correction for multiple testing. Novel ORFs identified in this study are written in bold. Note that some canonical ORFs have differences in start codon designation compared to the reference genome annotation. Sheet 2: output from running PRICE on the European PRRSV libraries. Results were filtered to select viral ORFs with FDR-corrected p-value<0.05, and results for canonical ORFs with p-values>0.05 (E, 5a and nsp2TF transframe) were appended. Table as described for sheet 1.
- https://cdn.elifesciences.org/articles/75668/elife-75668-fig6-data1-v2.xlsx
Figure 6—figure supplement 1
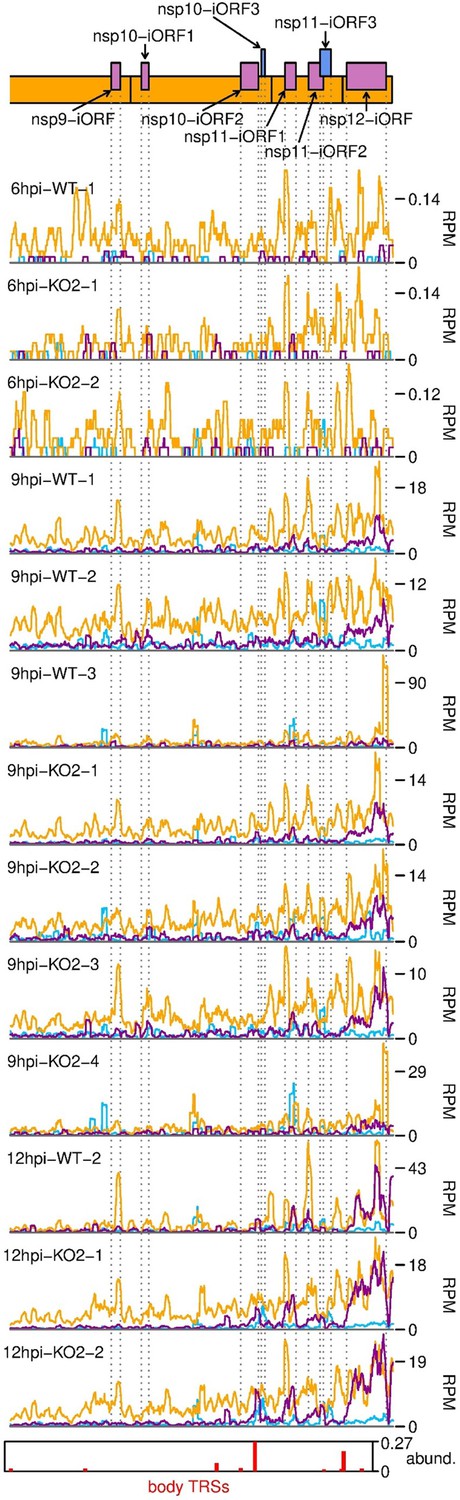
Further replicates of ribosome-protected fragments (RPFs) mapping to novel ORFs overlapping ORF1b.
Plot constructed as in Figure 6B.
Figure 6—figure supplement 2
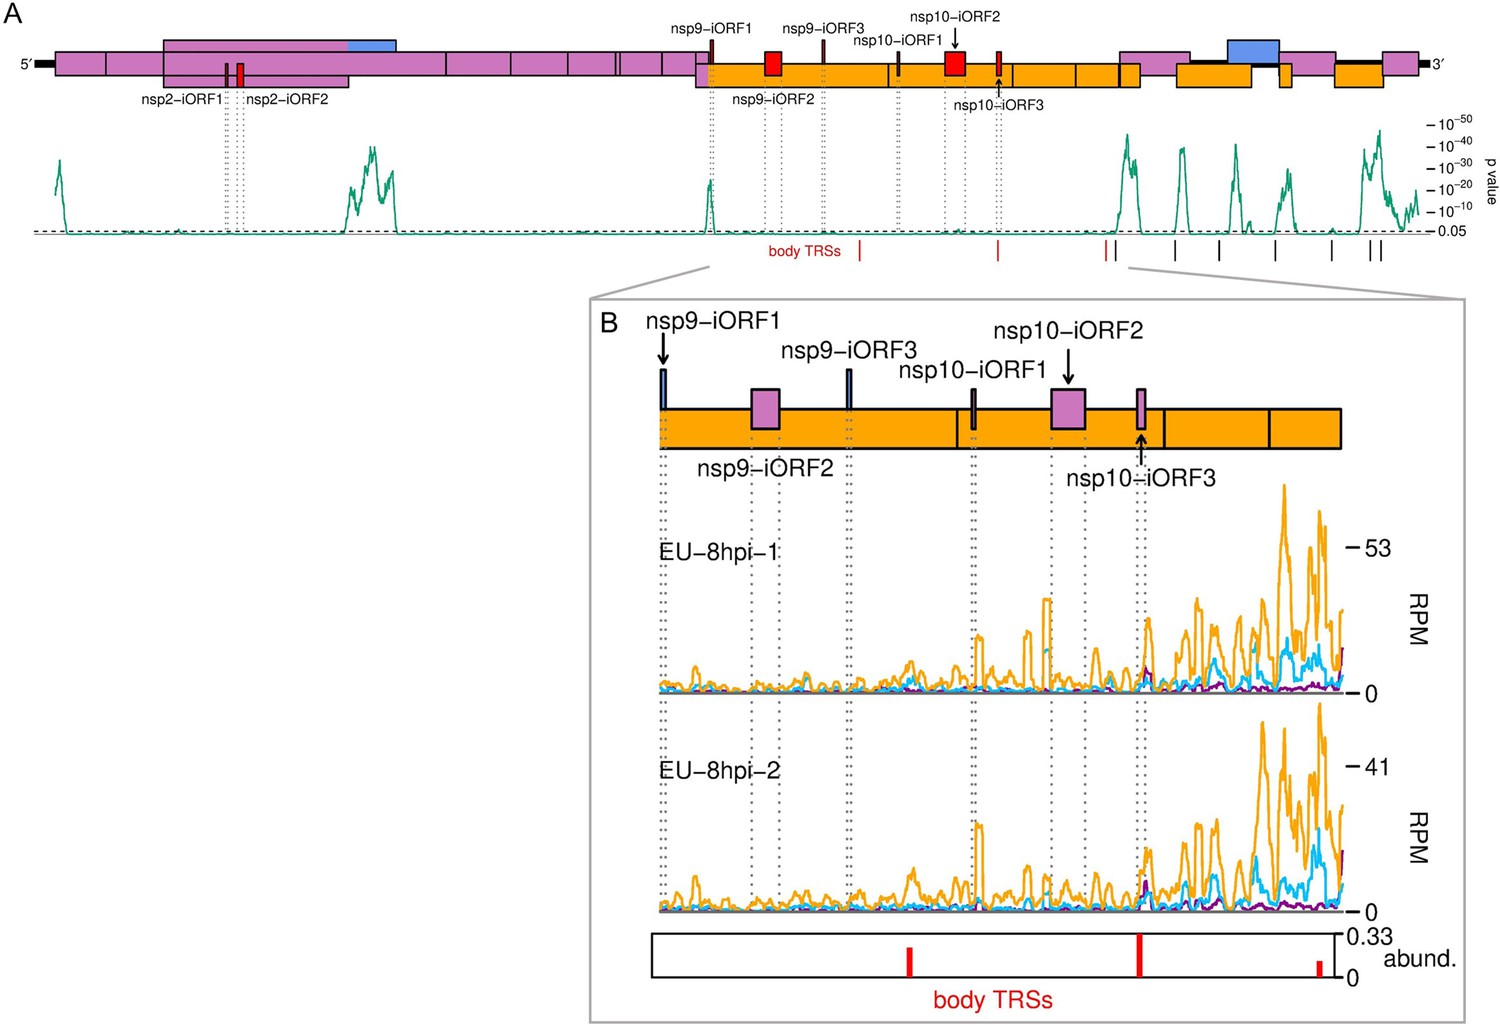
The European porcine reproductive and respiratory syndrome virus (EU PRRSV) translatome.
(A) Locations of novel ORFs in the EU PRRSV genome. Plot constructed as in Figure 6A, with synonymous site conservation analysed for 120 available EU PRRSV sequences, and positions of body transcription regulatory sequences (TRSs) within ORF1b shown in red. (B) Translation of EU PRRSV novel ORFs overlapping ORF1b. ORF1b is shown in its entirety, and the plot is constructed as in Figure 6B, with body TRSs with over 10 junction-spanning reads included. Only read lengths with good phasing (indicated in Figure 1—figure supplement 6D) were used to generate this plot.
Figure 6—figure supplement 3
Quality control for North American porcine reproductive and respiratory syndrome virus (NA PRRSV) cycloheximide (CHX) dataset.
(A) Length distribution of positive-sense host (grey) and virus (green) reads mapping within CDSs. Fragments of 25–34 nt were size-selected during the library preparation. (B) Length distribution of positive-sense RiboSeq reads with 5′ ends mapping to specified regions of the viral genome: ORF1a (purple), ORF1b (blue), and subgenomic (sg)RNA ORFs (orange). The length distribution of host CDS-mapping ribosome-protected fragments (RPFs) from (A) is reproduced for comparison (grey). (C) Length distribution (line graph) and relative density (stacked bar chart) of reads mapping to host CDSs (grey) compared to host 3′ UTRs (orange). Plot constructed as in Figure 1—figure supplement 5. (D) Average distribution of 5′ ends of host mRNA-mapping reads relative to start and stop codons. Plot constructed as in Figure 1—figure supplement 1. (E) Proportion of host and viral reads attributed to each phase. Plot constructed as in Figure 1—figure supplement 2. (F) Number of reads of each length that are attributed to each phase for reads with 5′ ends mapping to specified regions of the viral genome. Plot constructed as in Figure 1—figure supplement 4. Read lengths selected as showing minimal effect of ribonucleoprotein (RNP) contamination are indicated by square brackets and are used in all plots and analyses for this library.
Figure 7
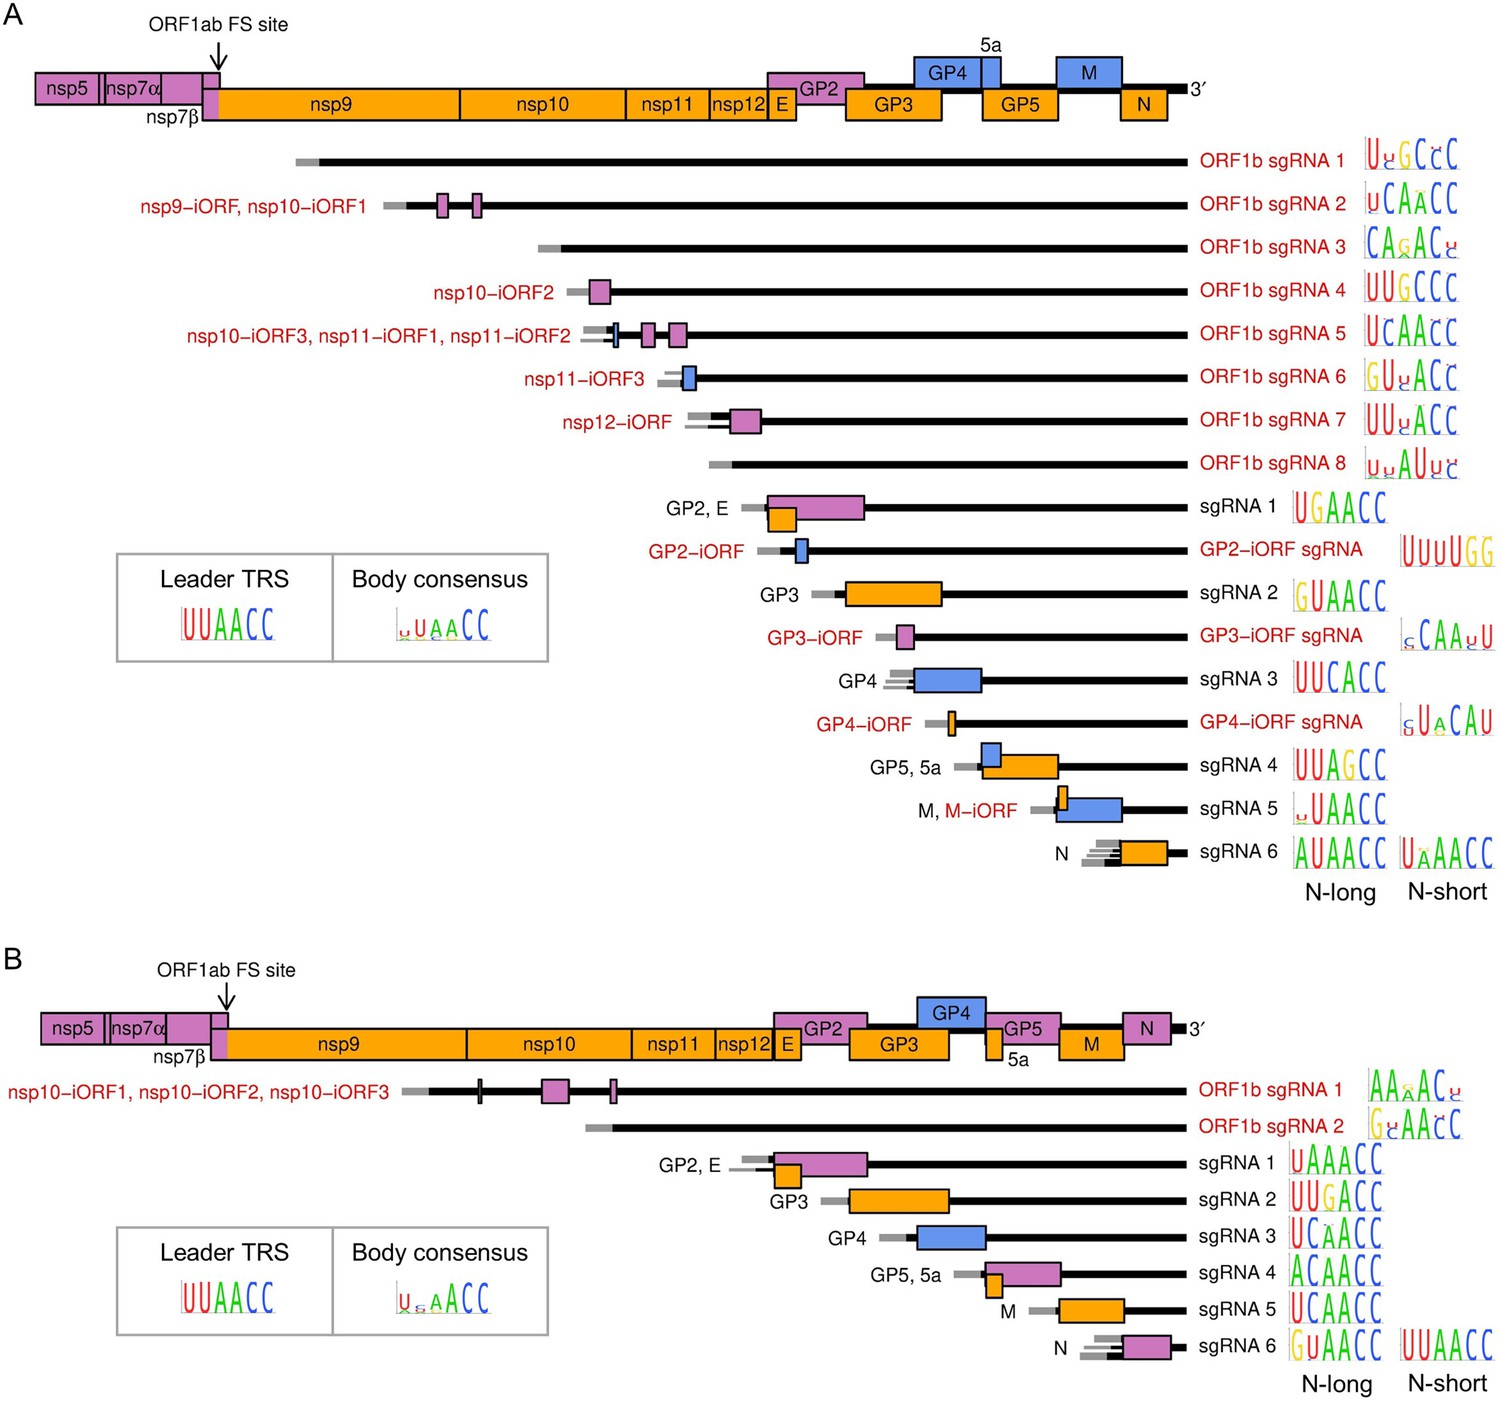
Subgenomic (sg) mRNA transcripts and ORFs included in viral gene expression analysis of (A) North American porcine reproductive and respiratory syndrome virus (NA PRRSV) and (B) European PRRSV (EU PRRSV).
Canonical transcripts and ORFs are labelled in black, novel ones in red. The genome map from nsp5 onwards is reproduced above for comparison. The leader (grey) is treated as a separate transcript for the purposes of these analyses (see Materials and methods), and the NA PRRSV upstream ORF (uORF) putatively expressed from it was omitted from these plots for clarity. Where more than one 5′ UTR is depicted for some mRNAs, this indicates that multiple merged junctions were detected that likely give rise to transcripts from which the same ORF(s) are translated, in which case junction-spanning read counts for these junctions were combined. To the right of each transcript, the consensus sequence of the body transcription regulatory sequence (TRS) used to generate the major transcript variant (indicated by the thicker UTR) is plotted, based on (A) 661 NA PRRSV or (B) 120 EU PRRSV genome sequences. For ease of identification, both N-long and N-short are depicted as major transcripts for N. The body TRS consensus (inset) is based on a combination of the consensus sequences of all the canonical body TRSs (omitting N-short for NA PRRSV and N-long for EU PRRSV). In addition to these sgRNAs and ORFs, ORF1a and all novel ORFs not depicted here were included in the analysis and designated as expressed from the gRNA transcript.
Figure 8 with 3 supplements
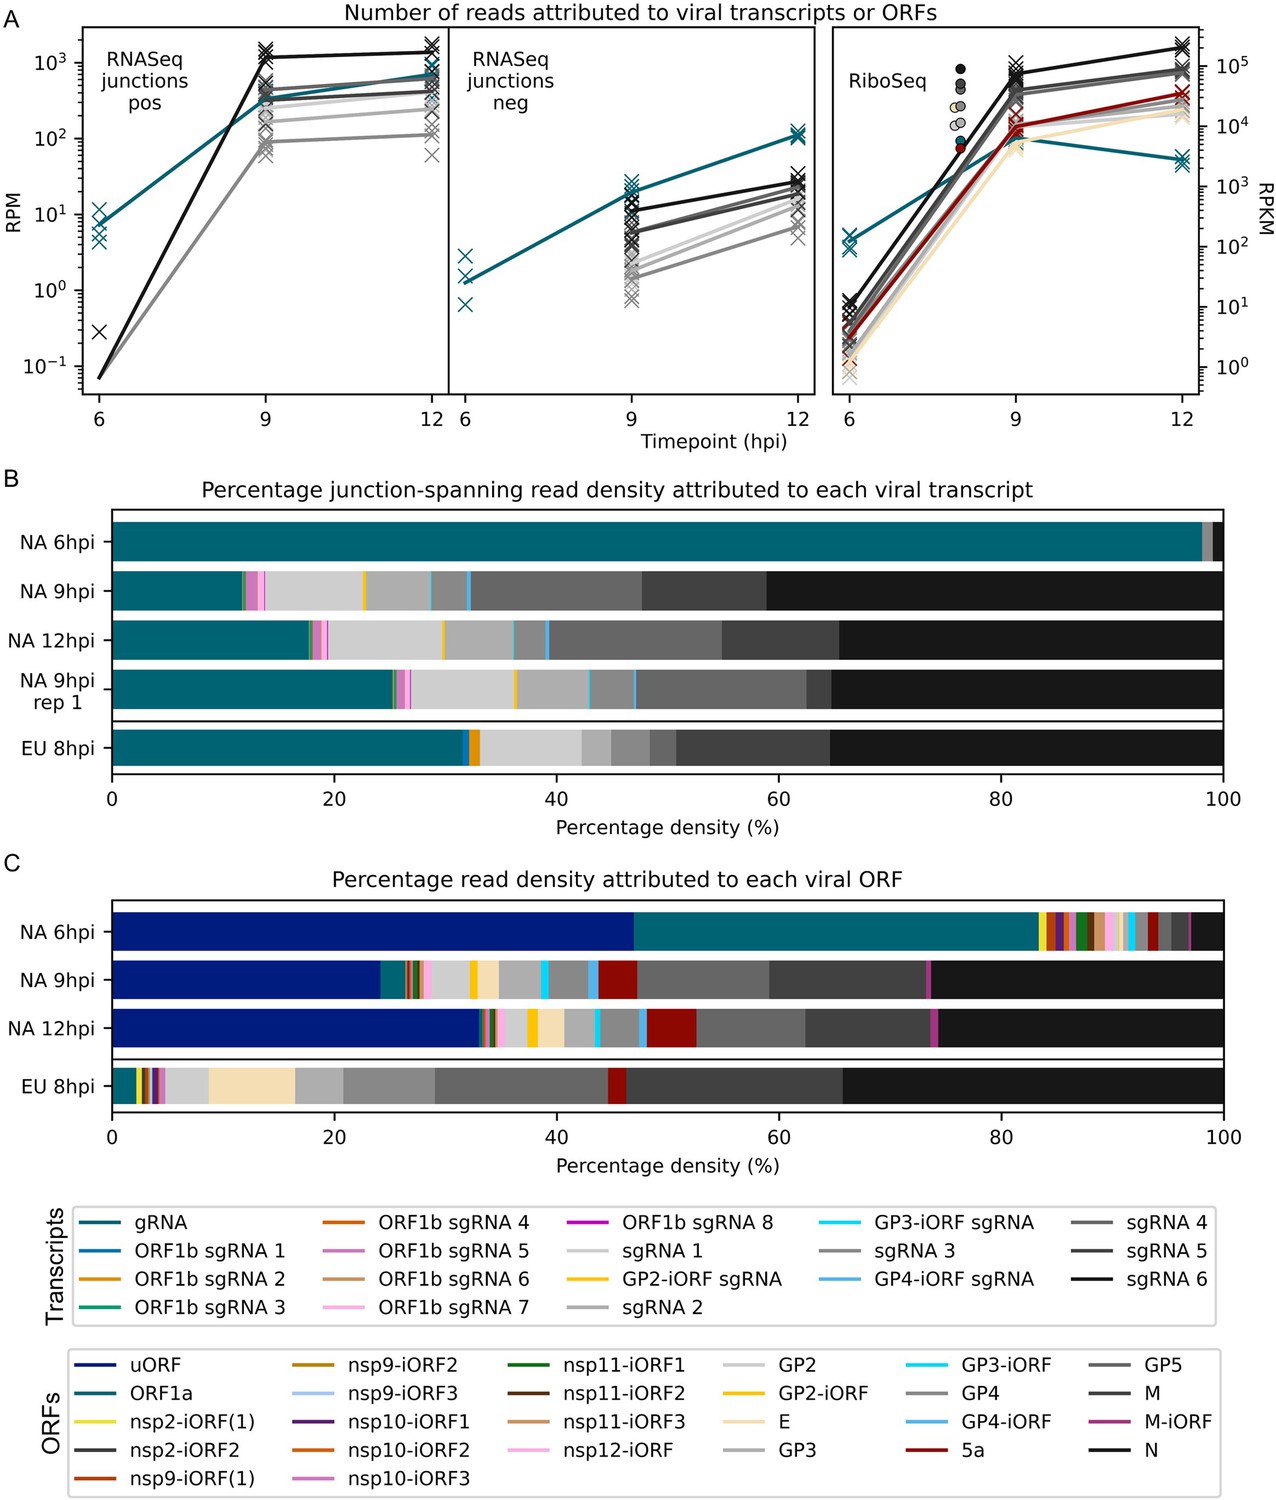
Viral transcript abundance and total translation of viral ORFs.
(A) Left: positive-sense (pos) and negative-sense (neg) junction-spanning read density attributed to canonical viral transcripts. Mean values are indicated by the line graph, with individual datapoints plotted as crosses. Due to the shorter RNASeq fragment lengths, North American porcine reproductive and respiratory syndrome virus (NA PRRSV) 9 hr post-infection (hpi) replicate 1 libraries and European (EU) PRRSV libraries are not comparable to the remaining NA PRRSV libraries in this analysis, so are omitted from this plot and shown separately in Figure 8—figure supplement 1. Right: RiboSeq read density attributed to canonical viral ORFs, based on the PRICE read count values. Mean values for EU PRRSV are plotted as filled circles, with individual datapoints omitted for clarity and some circles offset on the x-axis to aid visualisation. ORF1b is omitted from this analysis and investigated separately in Figure 9A–C. The legend for colours in all panels is displayed beneath panel (C). Analysis of non-canonical ORFs can be found in Figure 8—figure supplement 2, and translation efficiency results in Figure 8—figure supplement 3. The source data for this figure is the same as the source data for Figures 4—6. (B) Percentage of the viral transcriptome represented by each transcript (leader omitted; see Materials and methods for details). (C) Percentage of the viral translatome represented by each ORF. Note that the novel ORFs detected on the EU PRRSV genome were named according to the same convention as for NA PRRSV novel ORFs, but equivalent names does not indicate that they are equivalent ORFs.
Figure 8—figure supplement 1
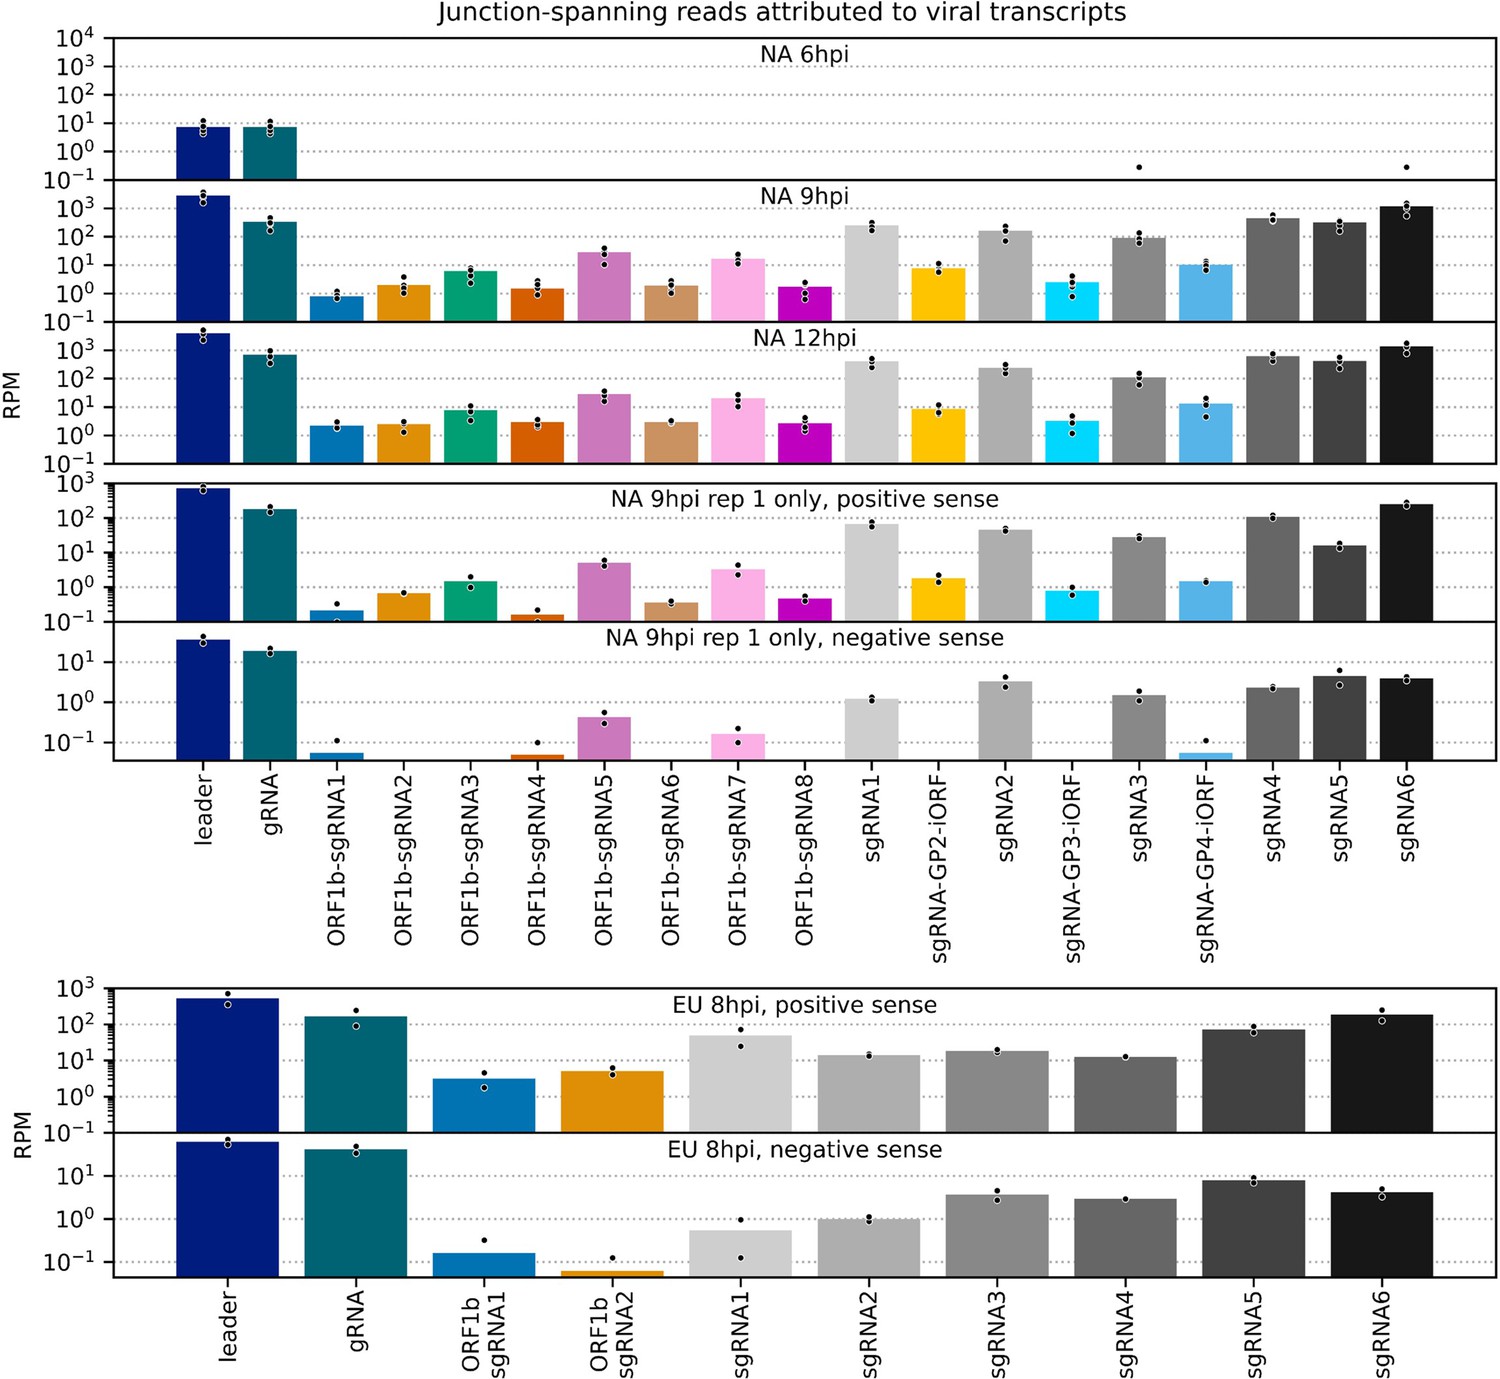
Number of junction-spanning reads attributed to viral transcripts.
Data for canonical transcripts are reproduced from Figure 8A, and the same junction-spanning read abundance calculations were performed for novel transcripts. Bars represent the mean, with individual datapoints represented as black circles with white outlines.
Figure 8—figure supplement 2
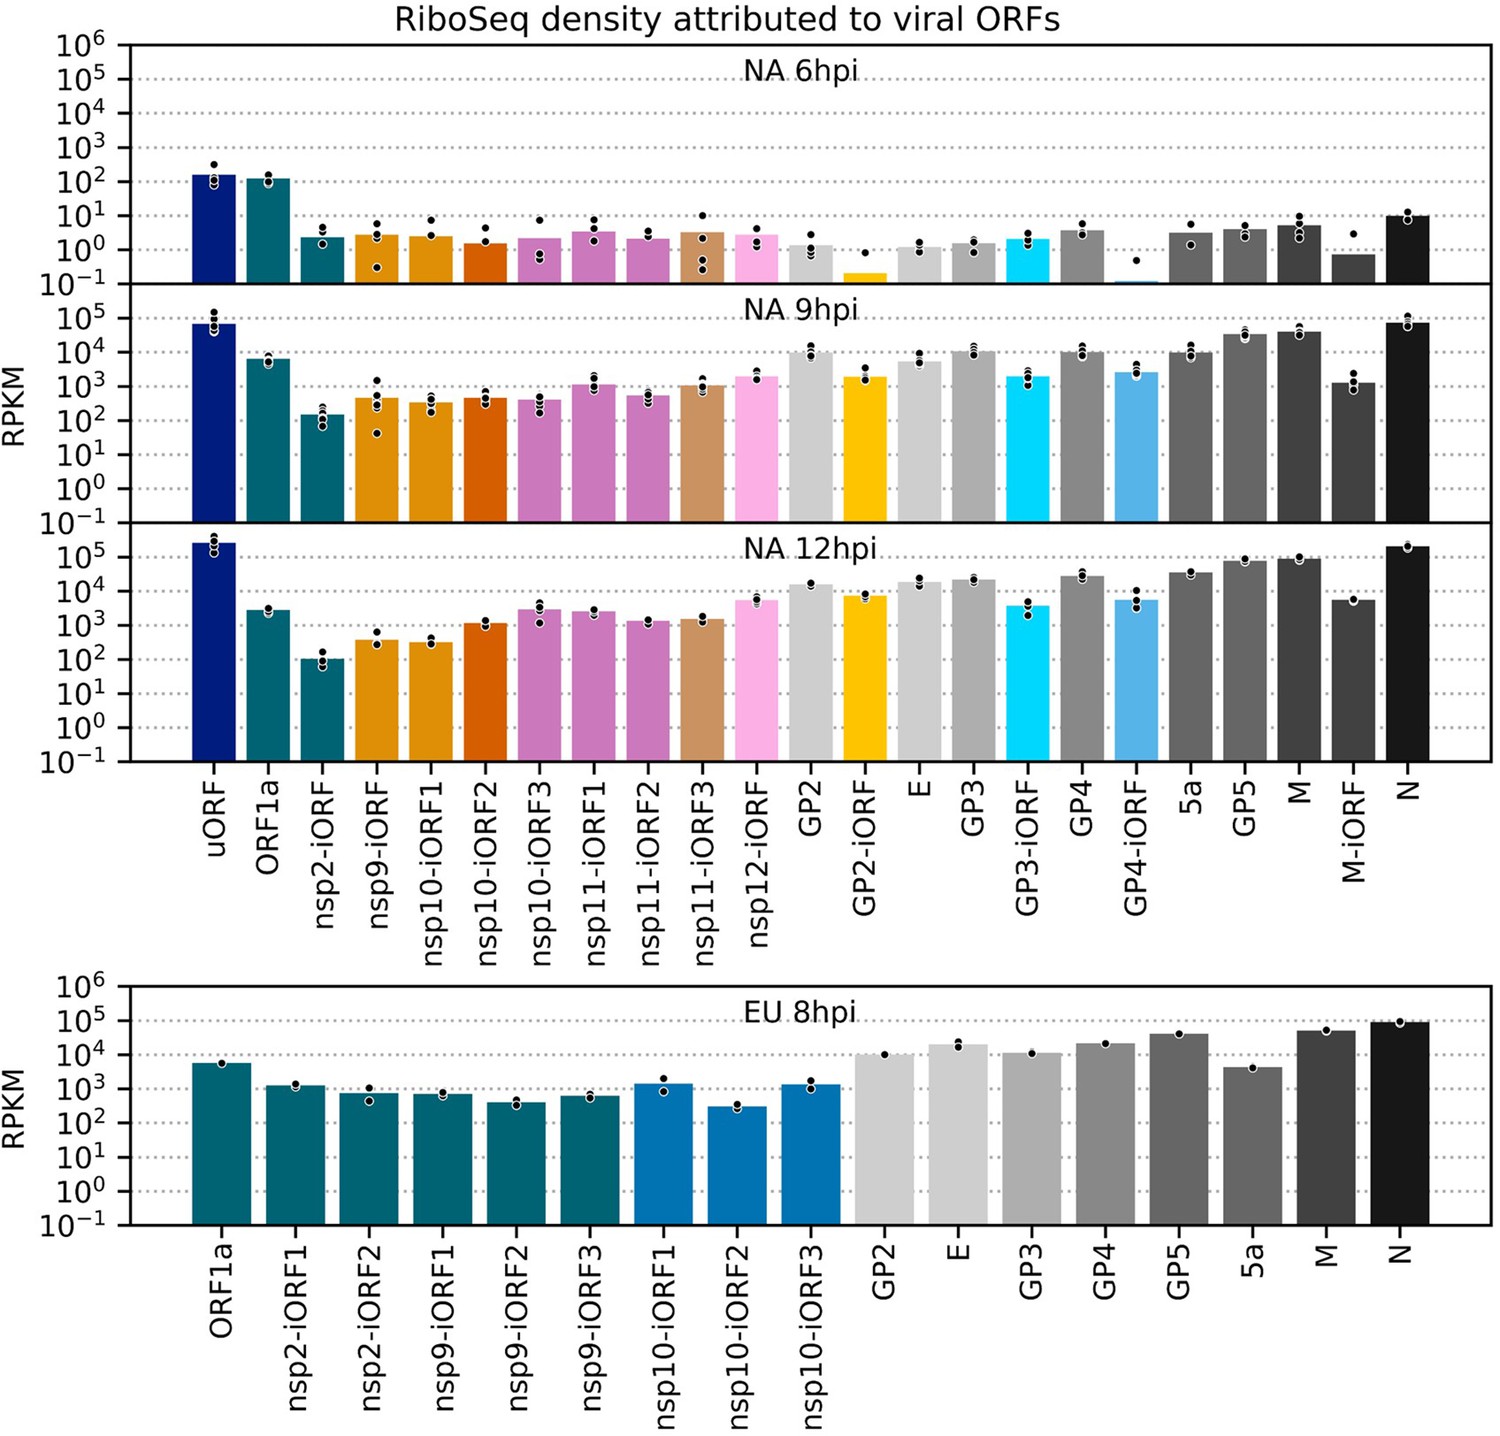
RiboSeq density attributed to each viral ORF.
Data for canonical ORFs is reproduced from Figure 8A, and the same calculations were performed for novel ORFs. Plot constructed as in Figure 8—figure supplement 1, with ORFs coloured according to their paired transcript (pairings in Figure 7, colour legend in Figure 8).
Figure 8—figure supplement 3
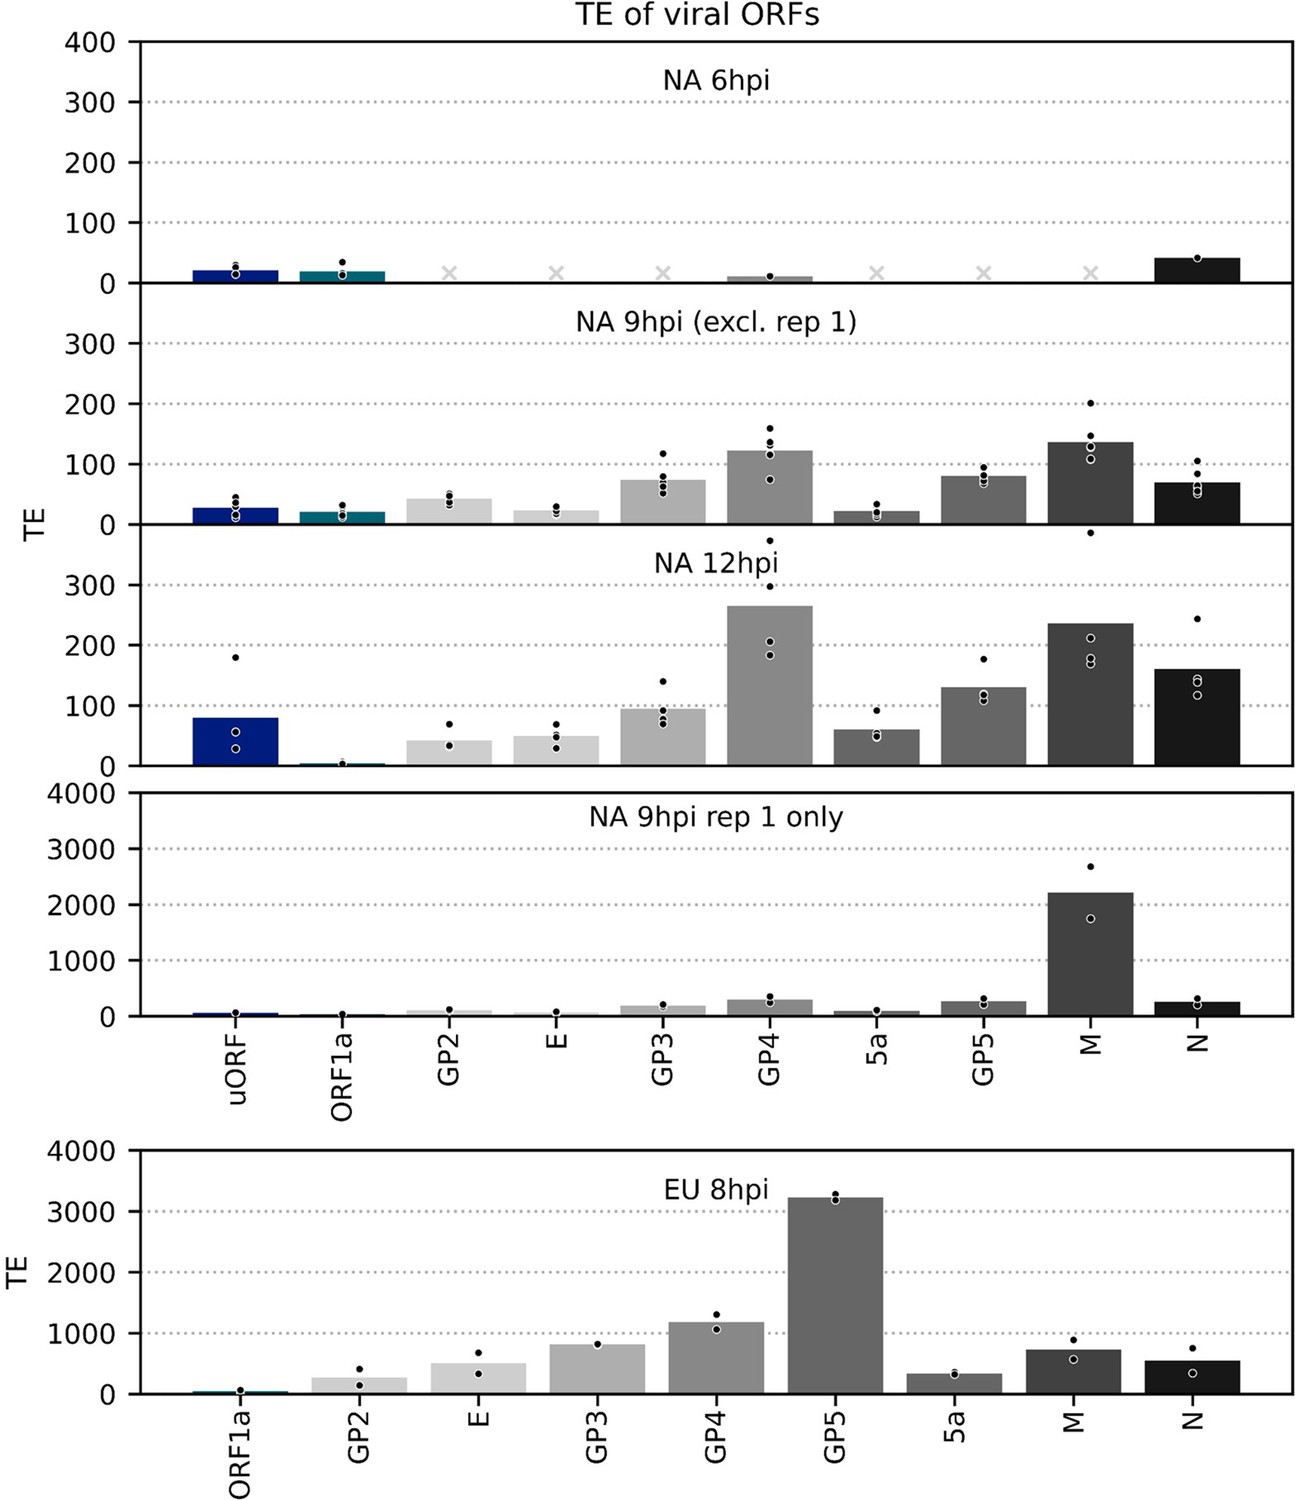
Translation efficiency (TE) of viral ORFs.
TE, calculated as (ribosome-protected fragment [RPF] density in reads per kilobase per million mapped reads [RPKM])/(junction-spanning reads in reads per million mapped reads [RPM]), of canonical viral ORFs and the North American porcine reproductive and respiratory syndrome virus (NA PRRSV) upstream ORF (uORF). Other novel ORFs were excluded as this method can be unreliable for small, lowly expressed overlapping ORFs and/or lowly abundant transcripts due to greater susceptibility to noise. In cases where no junction-spanning reads were detected, TE was not calculated, with grey crosses in place of bars indicating that this was the case for all libraries within a group. Plot constructed as in Figure 8—figure supplement 1 using a linear scale and with ORFs coloured according to their paired transcript. The high estimated TE of M for the 9 hr post-infection (hpi) replicate 1 libraries likely reflects the sensitivity of subgenomic (sg)RNA 5 transcript abundance estimation to the shorter read lengths in these libraries (Figure 8B, Figure 8—figure supplement 1).
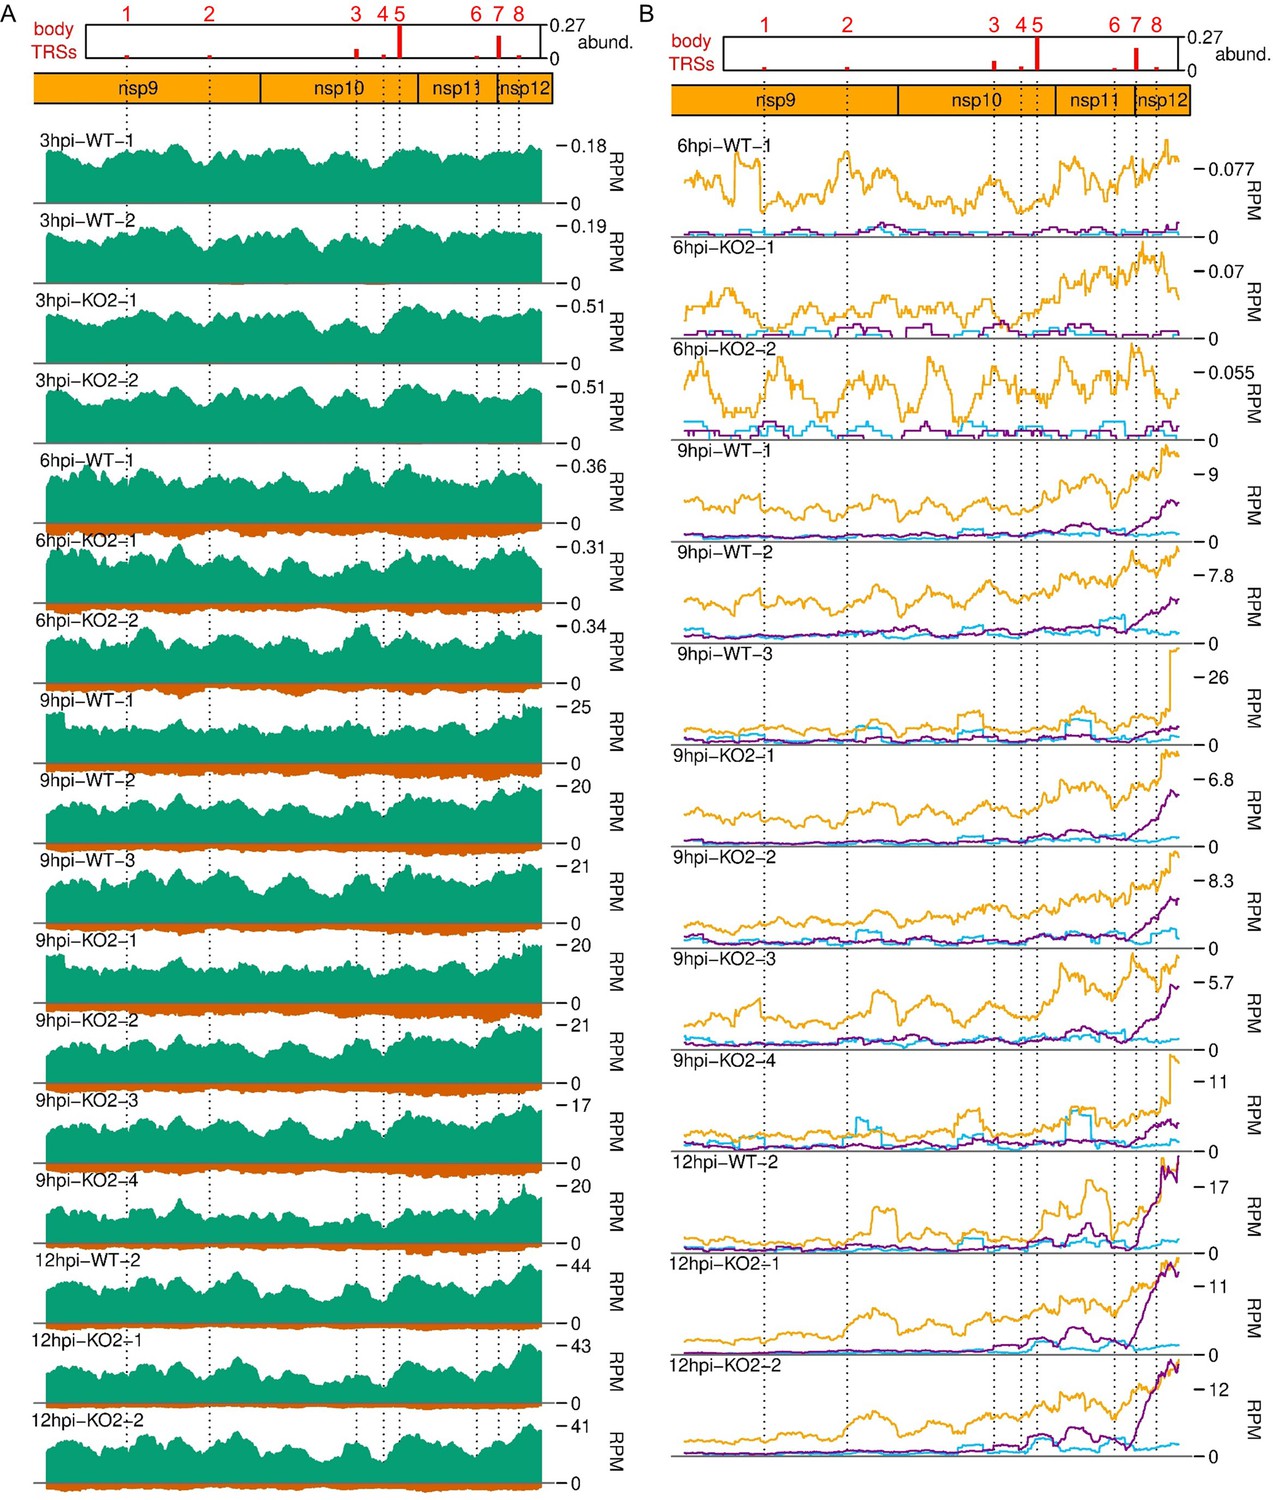
Figure 9 with 1 supplement

Expression of specific regions of ORF1a and ORF1b.
(A) Distribution of RNASeq (upper) and RiboSeq (lower) reads mapping to the ORF1b region of the North American porcine reproductive and respiratory syndrome virus (NA PRRSV) genome. Plots constructed as in Figures 2B and 6B, respectively, with the application of a 213-nt running mean filter. Dotted lines indicate body transcription regulatory sequence (TRS) positions, with junction-spanning read abundances supporting body TRSs reproduced from Figure 6B, and the designated ORF1b subgenomic (sg)RNA number indicated above in red. The libraries displayed are those in Figure 2B and C, with remaining replicates and KO2 libraries in Figure 9—figure supplement 1. (B) Distribution of RNASeq (upper) and RiboSeq (lower) reads mapping to the ORF1b region of the European (EU) PRRSV genome. Plot constructed as in panel (A) using RiboSeq read lengths with good phasing and with junction-spanning read abundances supporting body TRSs reproduced from Figure 6—figure supplement 2B. The body TRS annotated at the end of non-structural protein (nsp)12 does not represent an ORF1b sgRNA, but is expected to produce an alternative transcript for GP2. (C) RiboSeq read density attributed to different regions of ORF1b. ORF1b was divided into regions based on the positions of the ORF1b sgRNA body TRSs, and RiboSeq density of reads in-phase with ORF1b was determined. All sgRNA numbers in the x-axis labels refer to ORF1b sgRNAs. RiboSeq density in ORF1a (the ‘gRNA’ region from panel D) is included for comparison, and its mean value is indicated by a solid grey line. Plot constructed as in Figure 8—figure supplement 1 using a linear scale. (D) Gene expression of the heteroclite sgRNAs compared to gRNA. Transcript abundance and RiboSeq density for gRNA was distinguished from that of the heteroclite sgRNAs by decumulation (‘decum.’), as described in Materials and methods. Although no junctions were detected for putative heteroclite sgRNAs in the EU dataset, regions were designated analogously to NA PRRSV, for comparison. Plot constructed as in Figure 8—figure supplement 1 using a linear scale and with WT and KO2 values indicated by crosses and triangles, respectively.
Figure 9—figure supplement 1
Distribution of (A) RNASeq and (B) RiboSeq reads mapping to the ORF1b region of the North American porcine reproductive and respiratory syndrome virus (NA PRRSV) genome, further replicates.
Plot constructed as in Figure 9A.
Figure 10 with 7 supplements
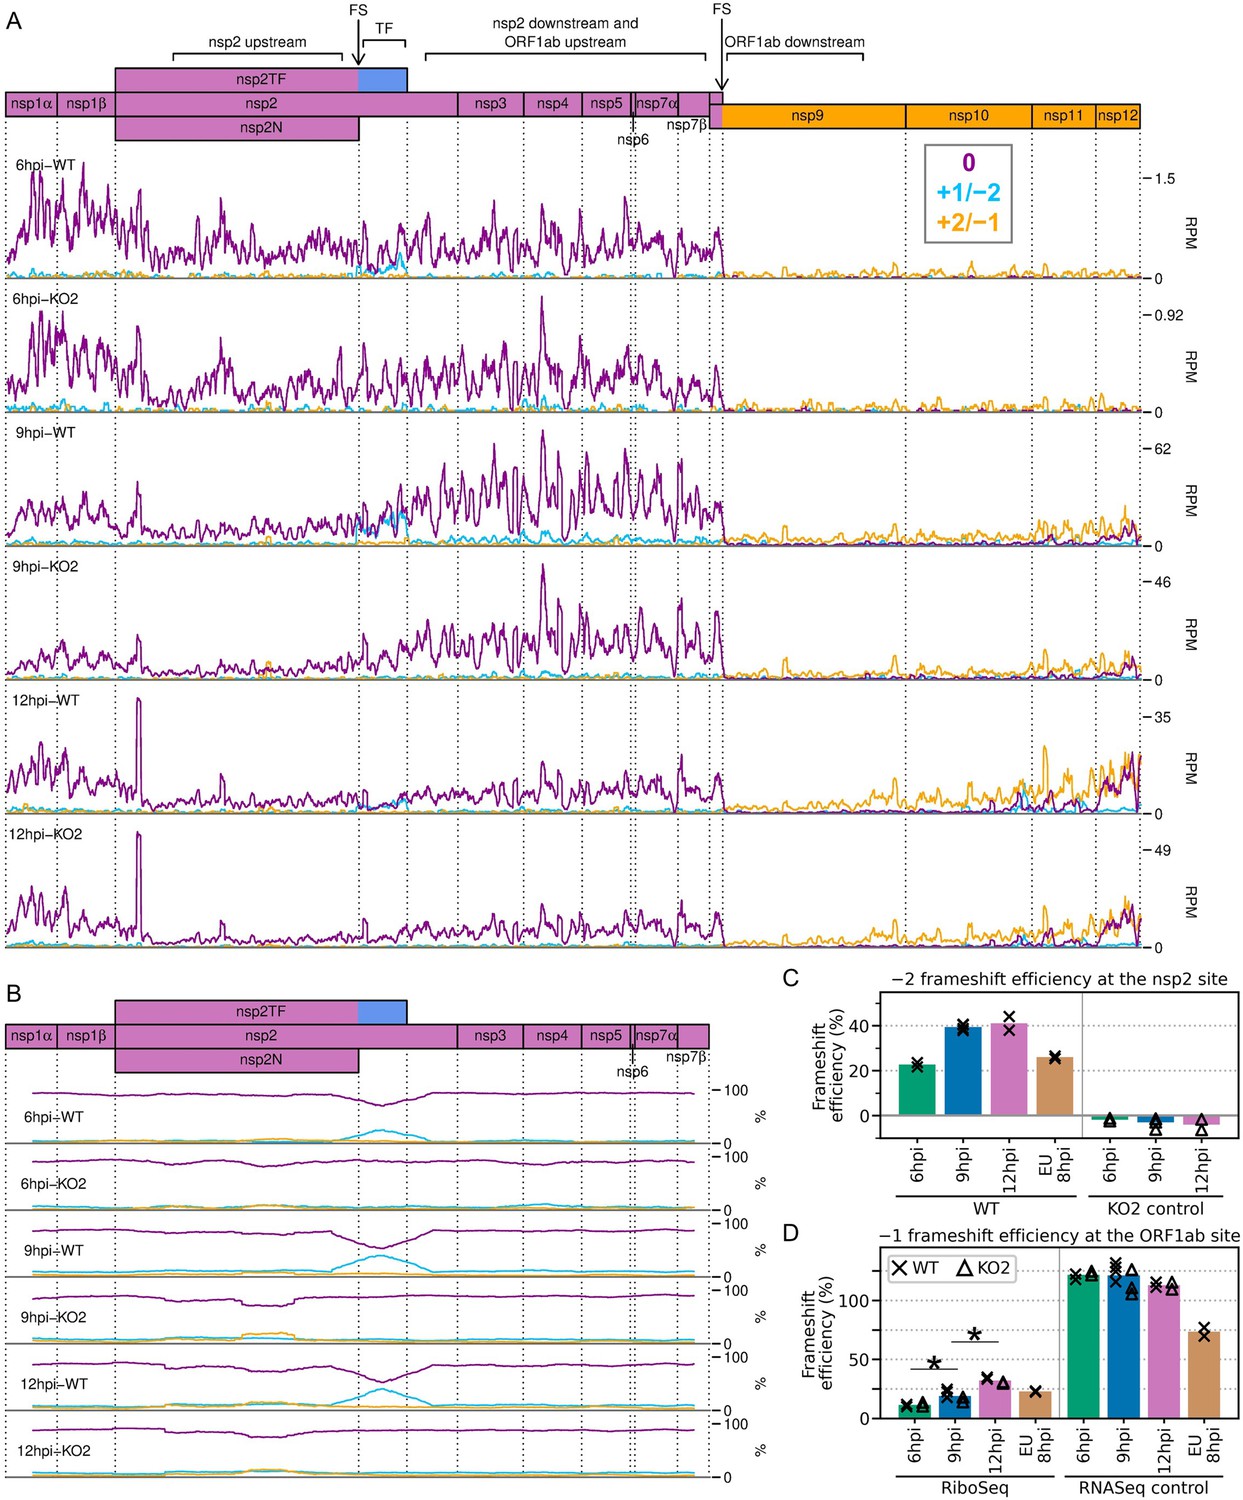
Frameshifting on the porcine reproductive and respiratory syndrome virus (PRRSV) genome.
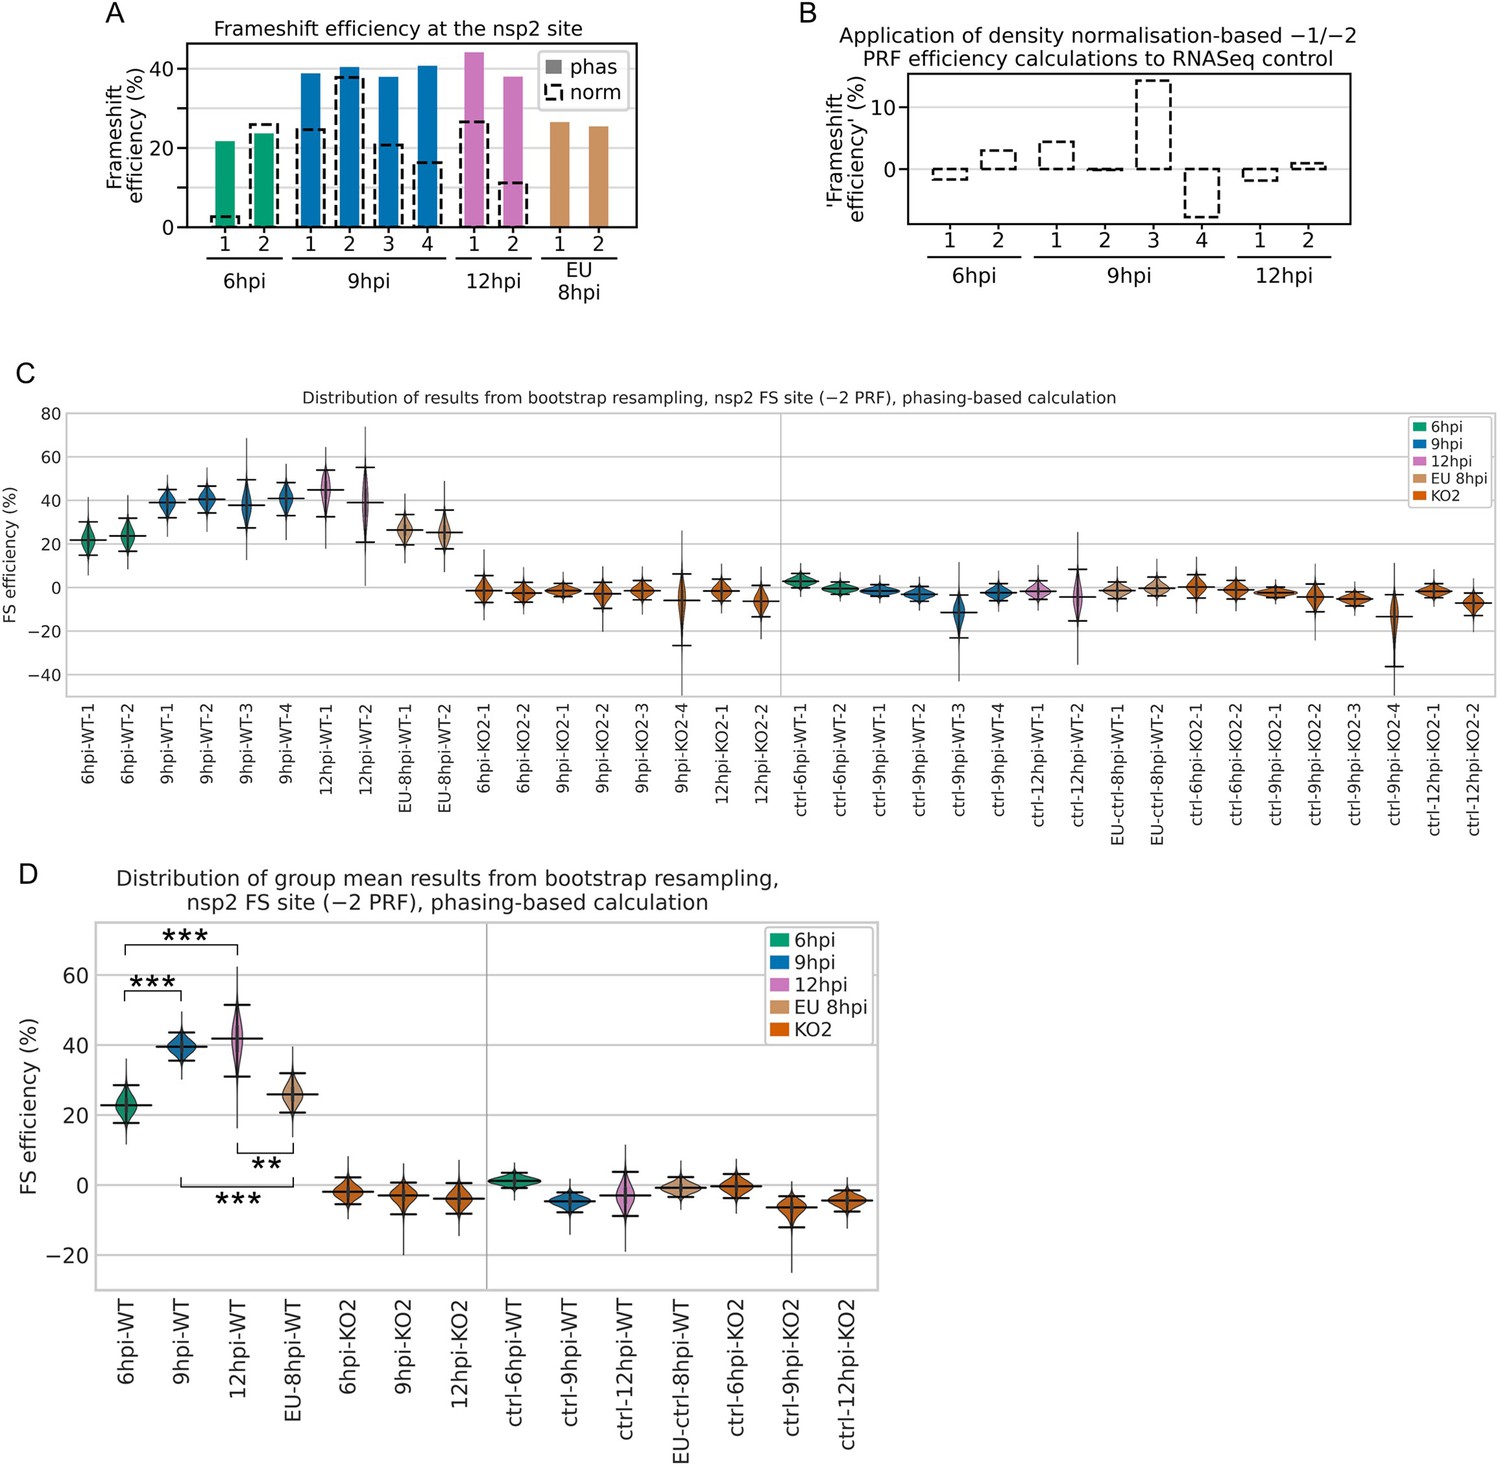
(A) Distribution of RiboSeq reads in each phase in the ORF1ab region of the North American (NA) PRRSV genome. Plot constructed as in Figure 2C. Regions used in the frameshift efficiency calculations for the non-structural protein (nsp)2 and ORF1ab sites are annotated above the genome map (‘TF’ = transframe). Replicates shown are noCHX-Ribo-6hpi-WT-2, noCHX-Ribo-6hpi-KO2-2, noCHX-Ribo-9hpi-WT-4, noCHX-Ribo-9hpi-KO2-3, noCHX-Ribo-12hpi-WT-1, and noCHX-Ribo-12hpi-KO2-1, with remaining replicates in Figure 10—figure supplement 1. The heightened peak shortly after the beginning of nsp2 corresponds to ribosomes with proline codons, which are known to be associated with ribosomal pausing (Ingolia et al., 2011; Artieri and Fraser, 2014; Pavlov et al., 2008), in both the P and A sites (P site genomic coordinates 1583–1585). The region upstream of this peak is the ‘heteroclite’ region analysed in Figure 9D, with the increased ribosome density in this region likely corresponding to heteroclite sgRNA translation. (B) Percentage of RiboSeq reads in each phase across the ORF1a region of the NA PRRSV genome, plotted using a 183-codon running mean filter (see Materials and methods). Replicates shown are those from panel (A), with remaining replicates in Figure 10—figure supplement 2. (C) Bar chart of −2 programmed ribosomal frameshift (PRF) efficiency at the nsp2 site, calculated based on the differences in phasing in the upstream and transframe regions (data from Figure 10—figure supplement 4). Bars represent the mean results for each group, with individual datapoints overlaid as crosses (WT) and triangles (KO2). The KO2 libraries provide a negative control (expected value ~0%). (D) Percentage frameshift efficiency at the ORF1ab site, calculated based on differences in read density upstream and downstream of the frameshift site. Plot constructed as in panel (C), with WT and KO2 scatter points offset on the x-axis to aid visualisation. The right-hand panel shows the results of applying these calculations to RNASeq reads as a control, for which the expected result is ~100%. Further plots related to PRF analysis can be found in Figure 10—figure supplement 3–Figure 10—figure supplement 7.
Figure 10—figure supplement 1
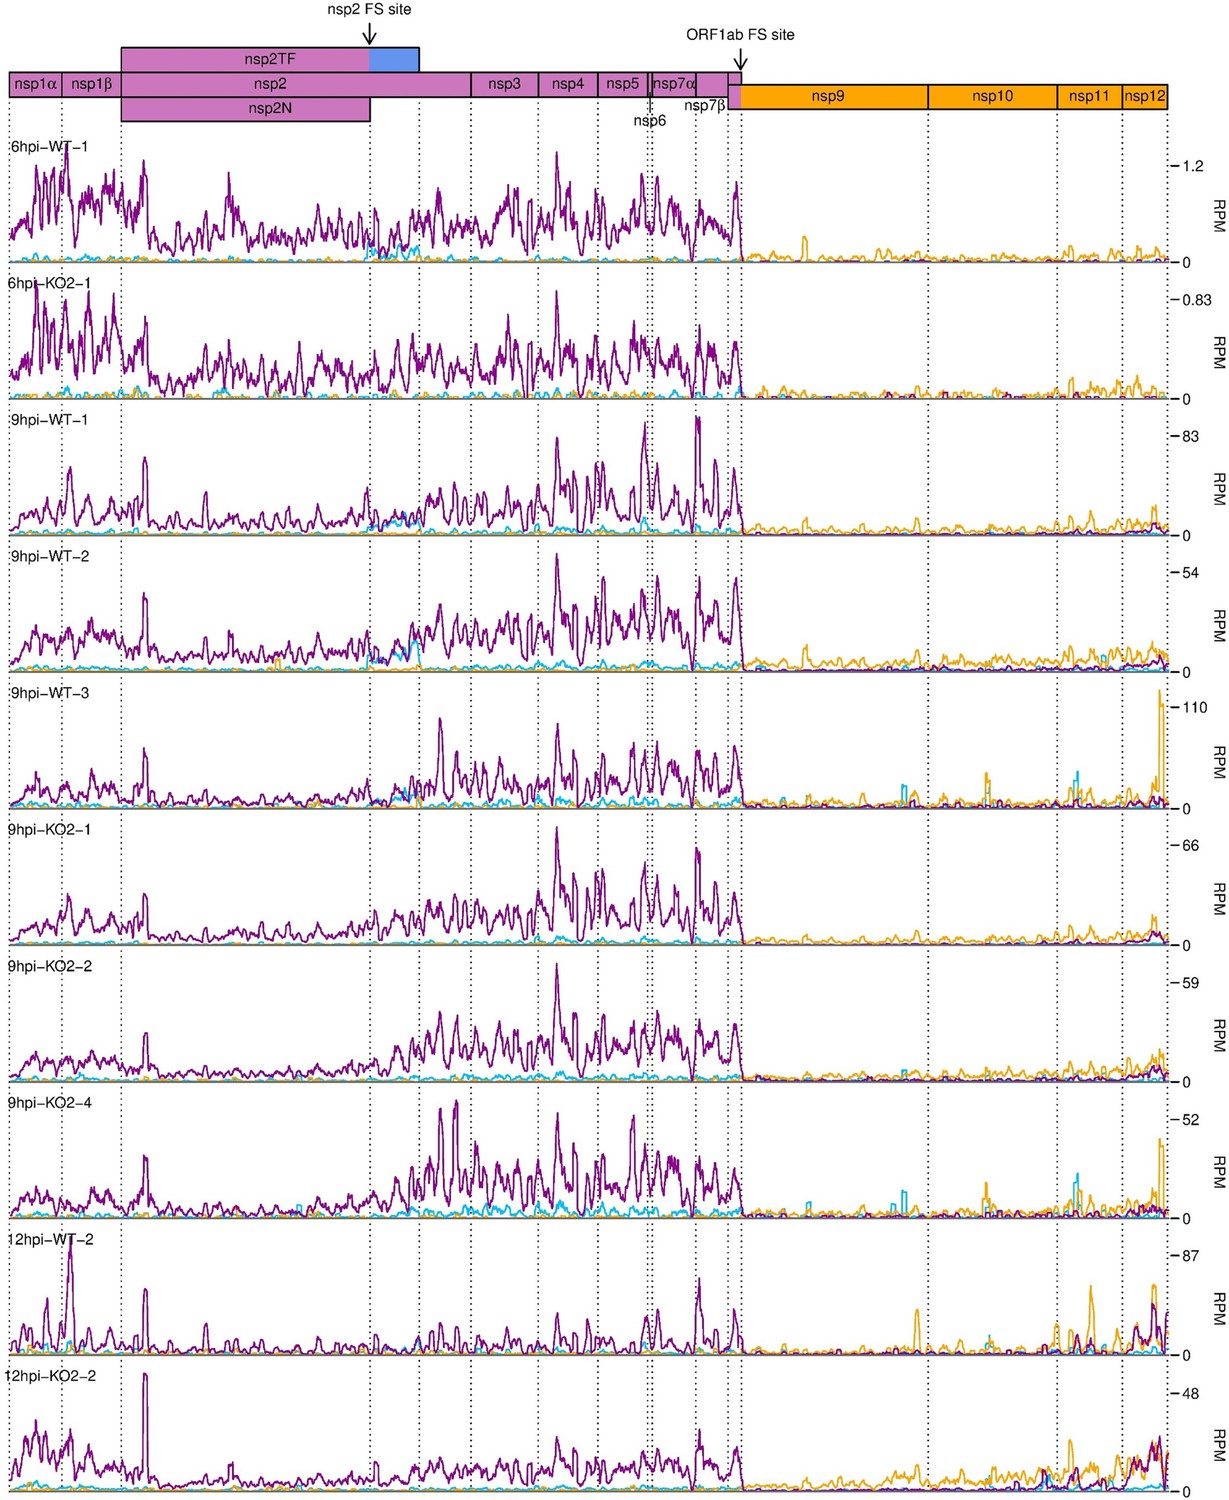
Distribution of RiboSeq reads in each phase in the ORF1ab region of the North American porcine reproductive and respiratory syndrome virus (NA PRRSV) genome, further replicates.
Plot constructed as in Figure 10A.
Figure 10—figure supplement 2
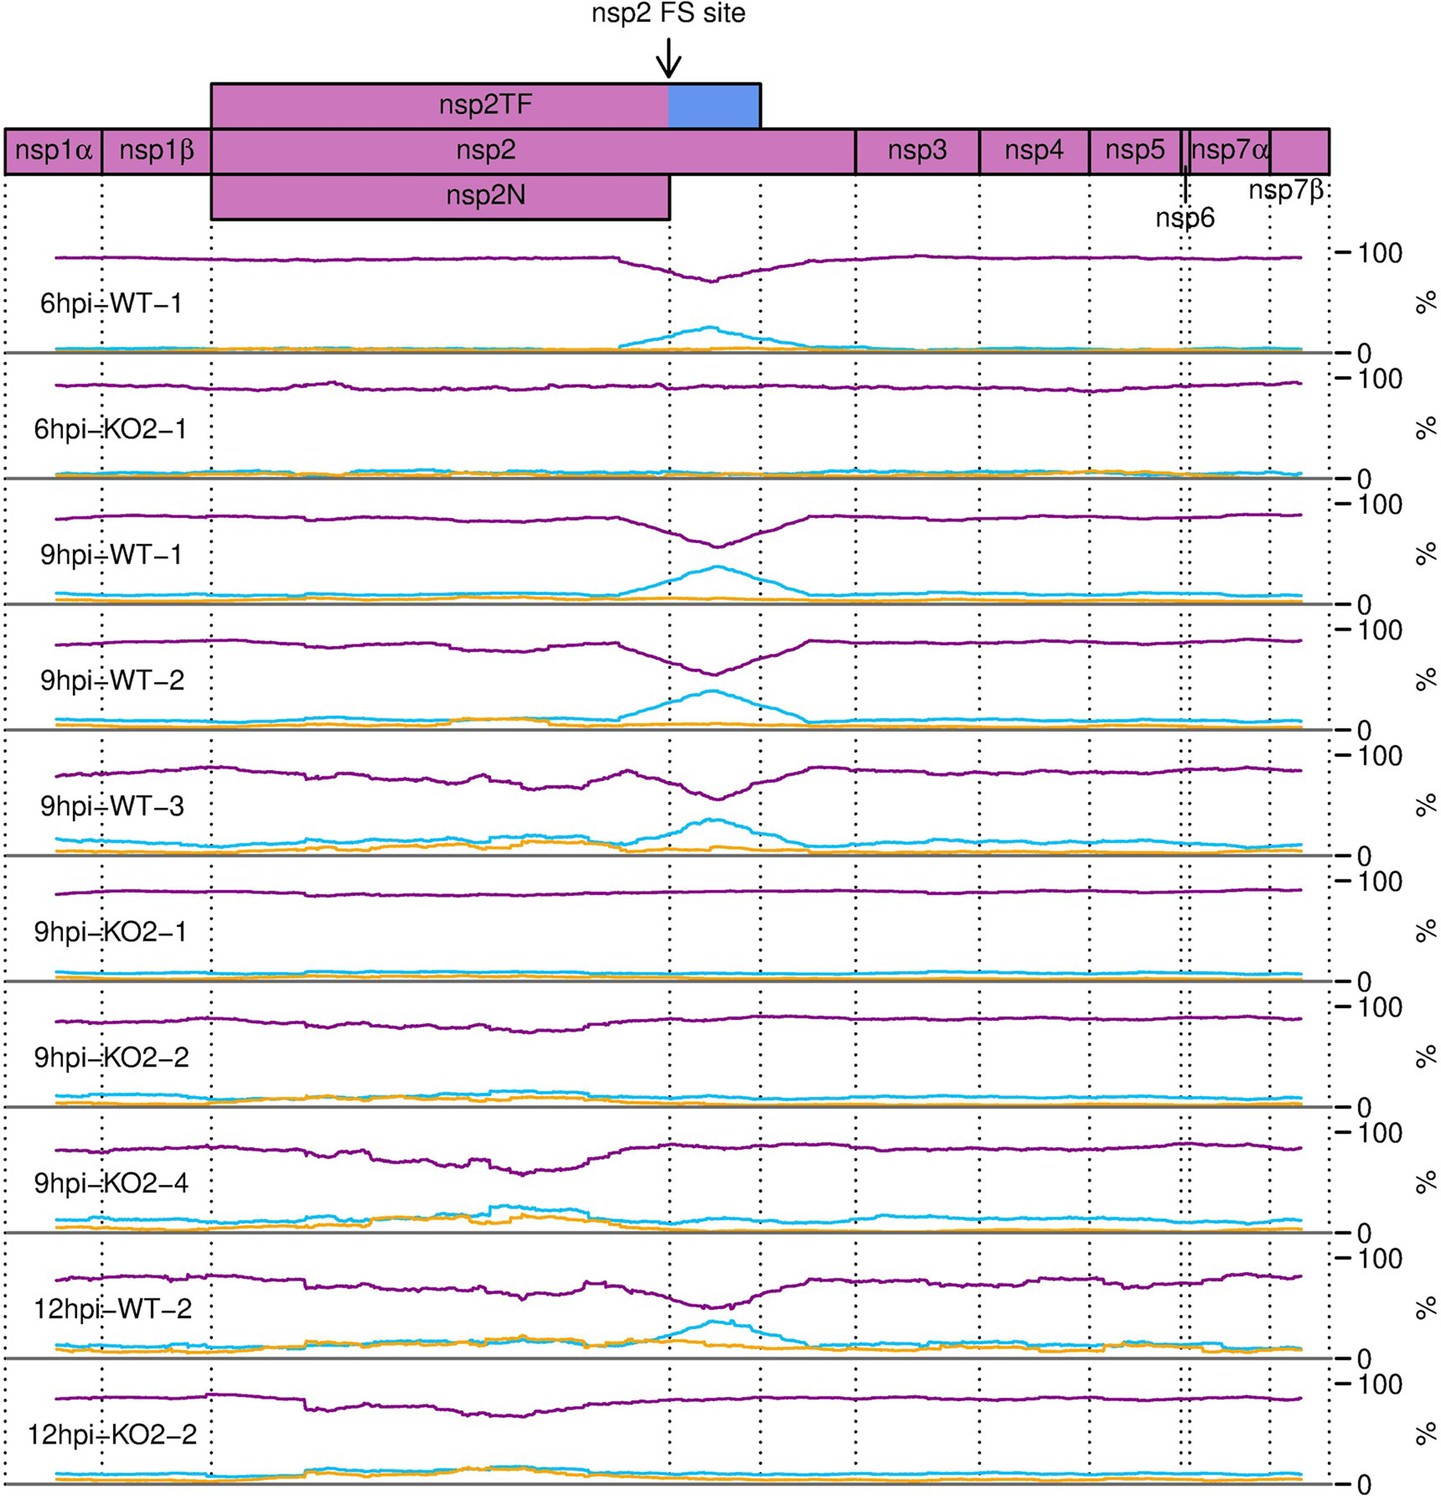
Percentage of RiboSeq reads in each phase across the ORF1a region of the North American porcine reproductive and respiratory syndrome virus (NA PRRSV) genome, further replicates.
Plot constructed as in Figure 10B.
Figure 10—figure supplement 3
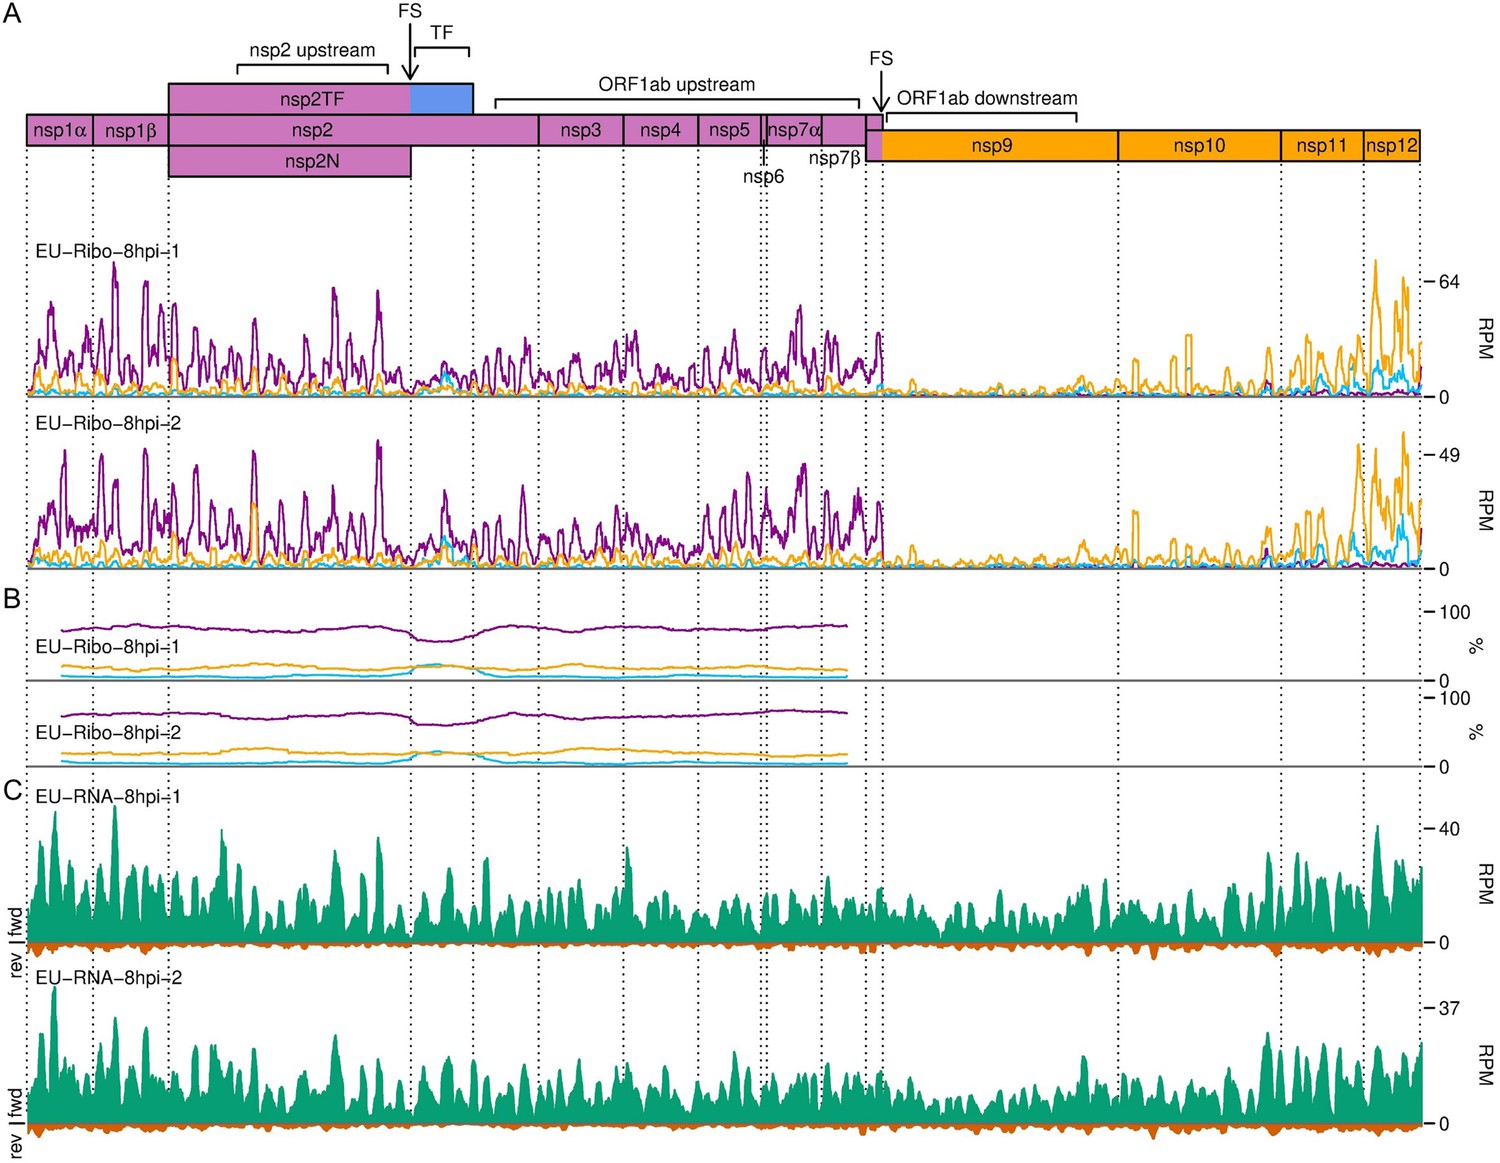
Distribution of reads in the ORF1ab region of the European porcine reproductive and respiratory syndrome virus (EU PRRSV) genome.
(A) RiboSeq read densities separated according to phase. Plot constructed as described in Figure 10A using read lengths with good phasing (indicated in Figure 1—figure supplement 6D). (B) Percentage of RiboSeq reads in each phase. Plot constructed as described in Figure 10B using the same 183-codon running mean filter and using read lengths with good phasing. (C) RNASeq read densities. Plot constructed as in Figure 2B, with a 45-nt running mean filter applied.
Figure 10—figure supplement 4
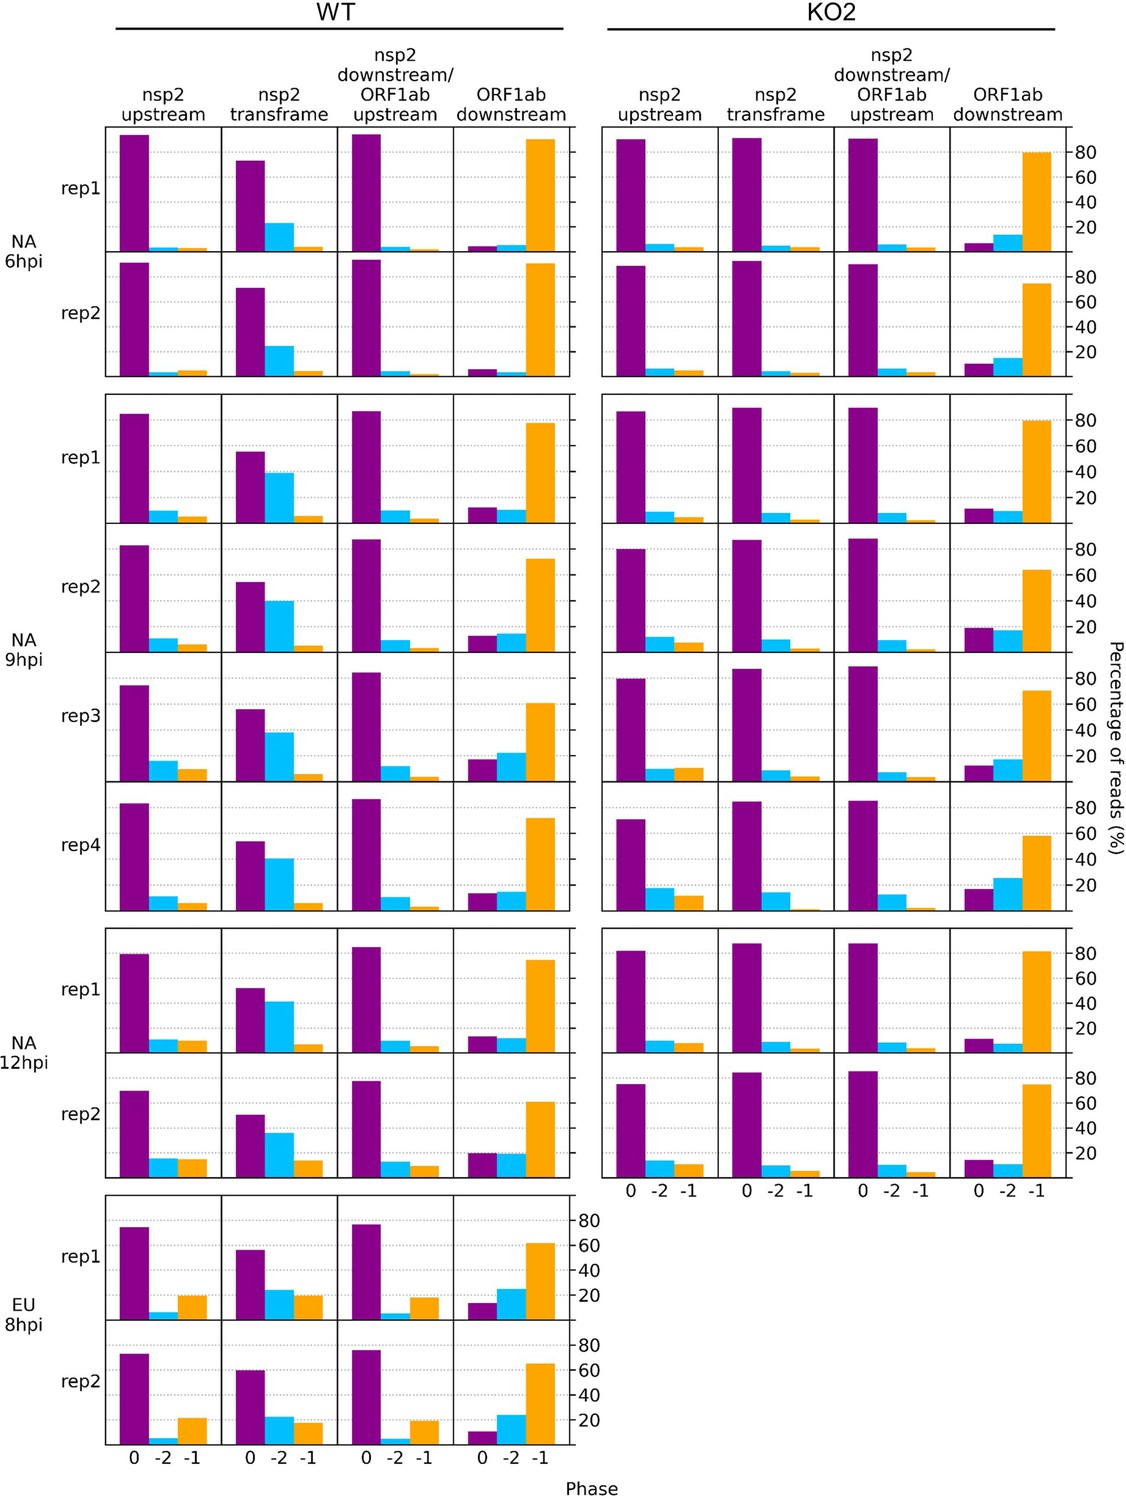
Bar charts of the percentage of reads in each phase in the specified regions of the viral genome.
Read lengths showing good phasing were selected for inclusion in this analysis, as indicated in Figure 1—figure supplement 4 for North American porcine reproductive and respiratory syndrome virus (NA PRRSV) libraries and Figure 1—figure supplement 6D for European (EU) PRRSV libraries. Genome regions are those annotated in Figure 10 and Figure 10—figure supplement 3 (coordinates given in Supplementary file 2).
Figure 10—figure supplement 5
Distribution of RNASeq reads in the ORF1ab region of the North American porcine reproductive and respiratory syndrome virus (NA PRRSV) genome.
Plot constructed as in Figure 10—figure supplement 3C.
Figure 10—figure supplement 6
Bootstrapping and control analyses for non-structural protein (nsp)2 programmed ribosomal frameshift (PRF) efficiency.
(A) Comparison of the phasing-based (filled bars) and density normalisation-based (black dashed outlines) methods of PRF efficiency estimation at the nsp2 site. Note that the density normalisation-based method estimates the combined −1 and −2 PRF efficiency, whereas the phasing-based method estimates only −2 PRF efficiency. For European porcine reproductive and respiratory syndrome virus (EU PRRSV), no KO2 libraries were available so the normalisation-based method was not used. (B) Application of the combined −1 and −2 PRF efficiency density normalisation-based calculation to the North American (NA) PRRSV RNASeq libraries as a negative control (expected value ~0%). (C) Distribution of results from calculation of −2 frameshift efficiency by the nsp2 phasing-based method after 100,000 bootstrap resamples of the codons in the upstream and transframe regions. The KO2 mutant libraries provide a negative control. As an additional negative control, the same calculations were performed using the downstream region instead of the transframe region, expected to yield ~0% frameshift efficiency. To aid visibility, the y-axis was truncated and the lower limits of the 9 hr post-infection (hpi)-KO2-4 bootstrap populations are off scale. For all violin plots (here and in panel D), horizontal lines represent the median of the results distribution, and the 95% confidence intervals determined using the bias-corrected accelerated (BCa) method. (D) Distribution of bootstrap results from calculation of mean −2 frameshift efficiency by the nsp2 phasing-based method. For each of the 100,000 resamples in panel (C), the mean result was calculated for each indicated group of libraries, generating these distributions. Plot constructed as in panel (C) using BCa 95% confidence intervals. Statistical significance of differences between non-control groups was determined using BCa confidence intervals (as described in Materials and methods), with asterisks representing *p<0.05, **p<0.005; ***p<0.0005.
Figure 10—figure supplement 7
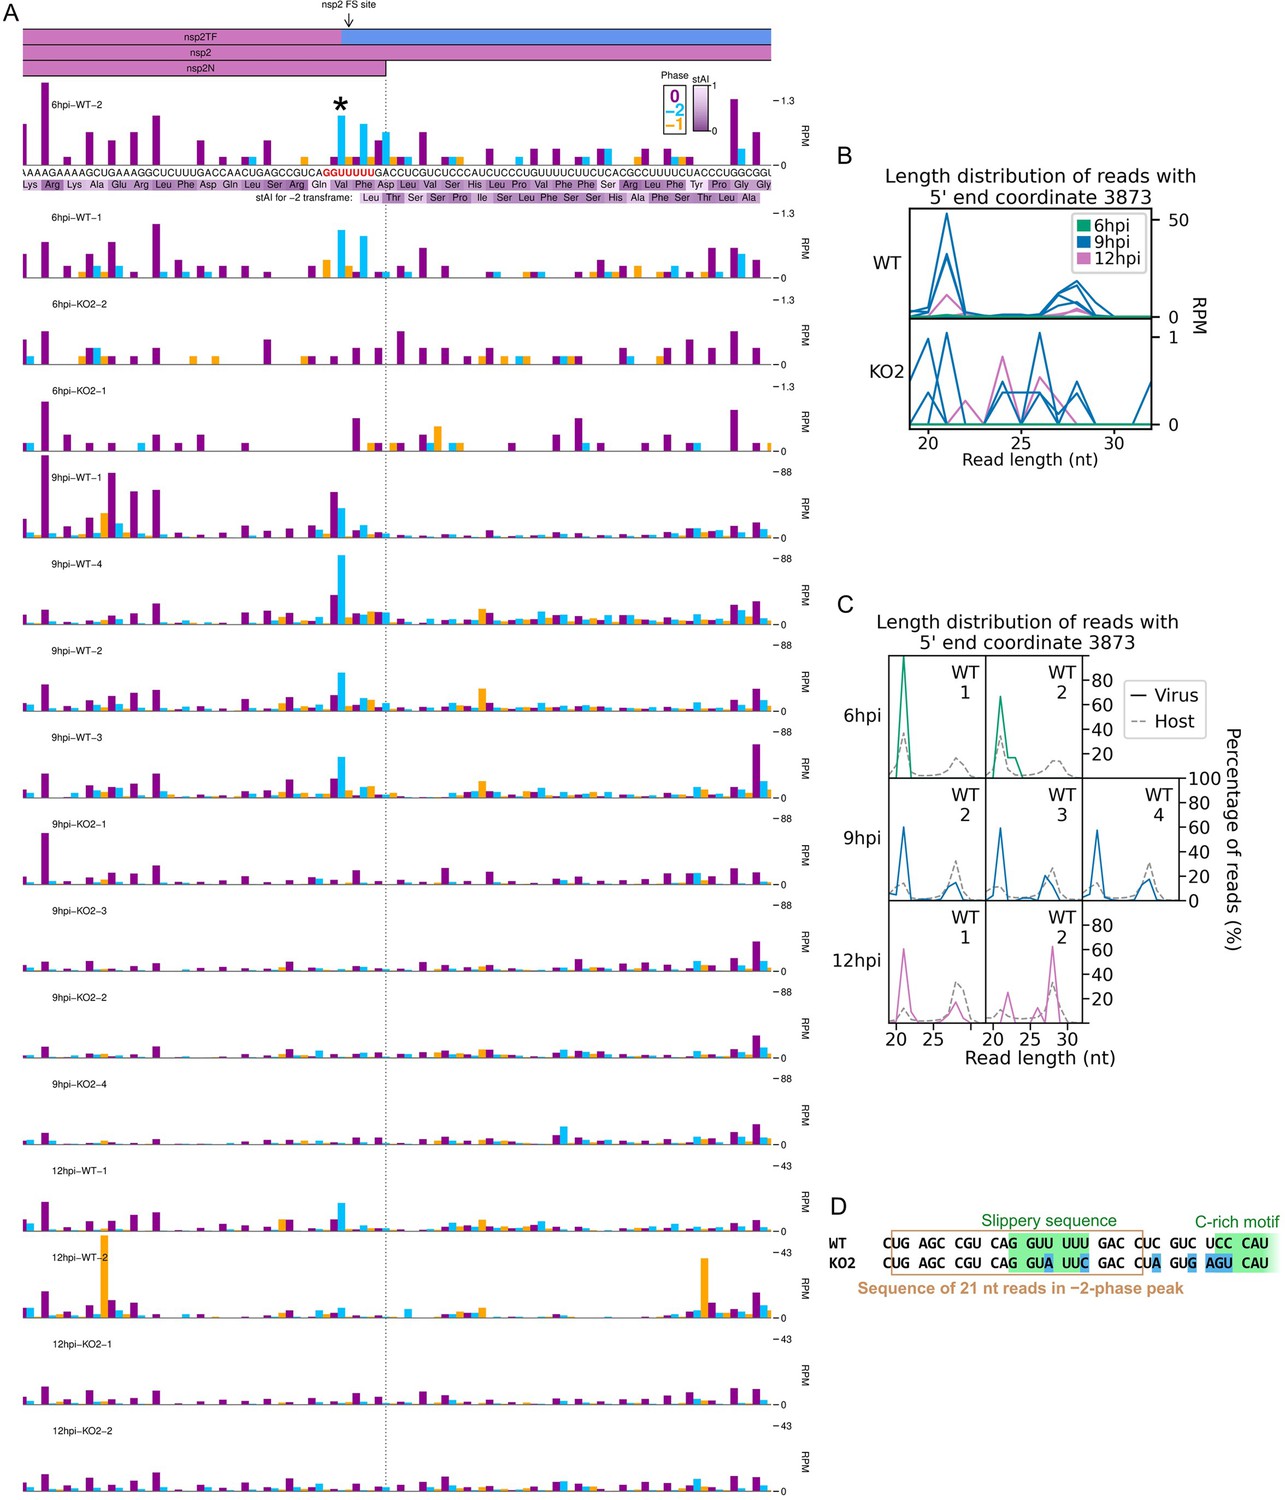
RiboSeq read densities around the non-structural protein (nsp)2 frameshift site.
(A) RiboSeq read densities around the nsp2 frameshift site. Plot constructed as in Figure 6D, with a heatmap of the species-specific tRNA adaptation index (stAI) of each codon underlaid beneath the amino acid identities (Macaca mulatta values were used as C. sabaeus values were unavailable). These values indicate the extent to which the codon is adapted to the host tRNA pool, with low values indicating poor adaptation, which may result in slow translation (Meulenberg et al., 1994; Cavanagh, 1997). Codons in-frame with respect to nsp2 are displayed above those of the overlapping nsp2TF −2 frame. The slippery sequence is printed in red, and the most prominent peak on the WT slippery sequence is indicated with an asterisk. As frameshifting could potentially affect the lengths of ribosome-protected fragments (RPFs), all read lengths were used to make this plot. All libraries for a given timepoint are set to the same reads per million mapped reads (RPM) scale on the y-axis, with no running mean filter applied. (B) Length distribution of reads that make up the blue peak marked with an asterisk in panel (A). Length distribution is plotted as the number of reads (RPM) of each length, so libraries with a greater number of reads at this position (relative to total virus- and host-mapping positive-sense reads) appear more prominent. Due to considerable differences in read counts at this base between WT (top) and KO2 (bottom), these libraries were plotted on separate scales. Note that the very low number of reads at this position on the KO2 genome means the length distributions in the KO2 panel are highly subject to noise. (C) Data for selected libraries from (B) reproduced to show the number of reads of each length as a percentage of the total number of reads mapping to this base (all libraries are therefore displayed on the same scale). KO2 libraries were omitted, and 9 hr post-infection (hpi) WT replicate 1 was omitted due to the exclusion of reads below 25 nt in the preparation of this library. The length distribution of host RPFs for each library is reproduced from Figure 1C for comparison (grey dashed lines). (D) Positions of mutations in the KO2 viral genome (blue) relative to the positions of reads comprising the majority of the peak marked with an asterisk in panel (A) (brown box).
Figure 11

Host differential gene expression at 12 hr post-infection (hpi).
Differences in transcription (left) and translation efficiency (centre) were determined using DESeq2 and xtail, respectively. Volcano plots show relative changes in pair-wise comparisons between the 12 hpi libraries (n = 2 biological replicates per condition): (A) WT and mock, (B) KO2 and mock, or (C) KO2 and WT. The y-axis shows the false discovery rate (FDR)-corrected p-values. Genes with FDR-corrected p-values≤0.05 and log2(fold change) magnitudes greater than 1 (WT vs. mock and KO2 vs. mock) or 0.7 (KO2 vs. WT; thresholds in each case indicated by grey dashed lines) were considered differentially expressed and are coloured orange (upregulated) or blue (downregulated) in the volcano plots. Where gene names were available, those of the top five significantly up- or downregulated genes with the greatest fold changes are annotated, and TXNIP is annotated in red on all plots. For all genes where both RNA and translation efficiency (TE) fold changes were determinable, these were compared (right), irrespective of p-value. The full results of these differential expression analyses, including lists of GO terms enriched in each set of differentially expressed genes, are in Figure 11—source data 1–3.
-
Figure 11—source data 1
Host differential gene expression in WT vs. mock at 12 hr post-infection (hpi).
Sheets 1–3: differential transcription analysis. Significantly upregulated and downregulated genes are shown in sheets 1 (‘TS_up’) and 2 (‘TS_down’), respectively, while sheet 3 (‘TS_full’) shows the results for all genes included in the analysis. The columns ‘baseMean’, ‘log2FoldChange’, ‘lfcSE’, ‘stat’, ‘pvalue’, and ‘padj’ are as described in the DESeq2 documentation. The ‘gene_ID’ column gives the ensembl gene ID, and the ‘external_gene_name’ and ‘wikigene_description’ columns give the name and description associated with these gene IDs. The ‘p_adj_final’ column gives the final false discovery rate (FDR)-corrected p-values that were used to make the volcano plots and to determine significance (while ‘p_final’ gives the counterpart before correction for multiple testing). Where p-value histograms were anti-conservative (WT vs. mock and KO2 vs. mock), ‘p_adj_final’ and ‘p_final’ are the same as ‘padj’ and ‘pvalue’, respectively. For KO2 vs. WT, the p-value histogram was conservative, so p-values were corrected using fdrtool to generate the values in ‘p_adj_final’ and ‘p_final’ (qval and pval from the fdrtool output, respectively). Columns entitled with library names contain the read counts for each gene in that library, generated using HTSeq and normalised for library size using DESeq2. Sheets 4–6: differential translation efficiency (TE) analysis. Significantly upregulated and downregulated genes are shown in sheets 4 (‘TE_up’) and 5 (‘TE_down’), respectively, while sheet 6 (‘TE_full’) shows the results for all genes included in the analysis. The columns ‘log2FC_TE_final’, ‘pvalue_final’, ‘pvalue.adjust’, ‘log2FC_TE_v1’, ‘pvalue_v1’, ‘WT_log2TE’, ‘mock_log2TE’, ‘log2FC_TE_v2’, and ‘pvalue_v2’ are as described in the xtail documentation (where ‘log2FC_TE_final’ and ‘pvalue.adjust’ are the final values used to make the volcano plots and determine significance). Columns entitled with library names contain the read counts for each gene in that library, generated using HTSeq and normalised for library size using DESeq2 (which formed the input for xtail). Sheets 7–10: GO term enrichment analysis. Lists of significantly differentially expressed genes from sheets 1, 2, 4, and 5 were used as input for DAVID to determine whether any GO terms associated with these genes were significantly enriched. All columns are as described in the DAVID documentation for ‘functional annotation chart report’.
- https://cdn.elifesciences.org/articles/75668/elife-75668-fig11-data1-v2.xlsx
-
Figure 11—source data 2
Host differential gene expression in KO2 vs. mock at 12 hr post-infection (hpi).
Table as described for Figure 11—source data 1.
- https://cdn.elifesciences.org/articles/75668/elife-75668-fig11-data2-v2.xlsx
-
Figure 11—source data 3
Host differential gene expression in KO2 vs. WT at 12 hr post-infection (hpi).
Table as described for Figure 11—source data 1.
- https://cdn.elifesciences.org/articles/75668/elife-75668-fig11-data3-v2.xlsx
Figure 12

Schematic summary of non-canonical mechanisms of porcine reproductive and respiratory syndrome virus (PRRSV) gene expression regulation supported by this study.
(A) A short upstream ORF (uORF) was discovered in the North American (NA) PRRSV 5′ leader (grey), which is shared by the gRNA and subgenomic (sg)RNAs. The uORF is highly translated throughout infection and could potentially regulate initiation of the canonical ORFs downstream. (B) At the protein-directed non-structural protein (nsp)2 frameshift site, −2 programmed ribosomal frameshift (PRF) efficiency significantly increases between 6 and 9 hr post-infection (hpi), at which point it reaches a plateau. This likely reflects the accumulation of the viral frameshift-stimulatory protein, nsp1β. (C) At the RNA structure-directed ORF1ab frameshift site, −1 PRF efficiency also increases over time, despite the lack of an obvious trans-acting regulatory factor. The changes in frameshift efficiency at this and the nsp2 site likely modulate the stoichiometry of the polyprotein components over the course of infection. (D) Non-canonical ORF1b sgRNAs are synthesised at late timepoints, from which novel ORFs overlapping ORF1b are translated. Although the overlapping ORFs are unlikely to be functional, these ORF1b sgRNAs may also provide templates for translation of ORF1b itself, contributing to temporal regulation of nsp10, 11, and 12. (E) Heteroclite sgRNAs, in which the beginning of ORF1a is fused to ORFs in the 3′-proximal region of the genome, are present throughout infection. These may provide a source of nsp1α and nsp1β to supplement that provided by the genomic RNA.
Author response image 1

Structure and conservation of the NA PRRSV 5′ UTR. (A) The structure of the first 240 nt of the SD95-21 NA PRRSV genome, as predicted by mfold (default parameters). The first base was excluded due to being absent on many NA PRRSV sequences. The uORF AUG and the leader TRS are highlighted in blue. (B) Multiple sequence alignment of the NA PRRSV 5′ UTR (excluding the first base from all sequences and excluding sequences with incomplete UTRs). Regions which are predicted to be unpaired in panel A are indicated by boxes, with the mean Shannon entropy for each of these regions indicated above (as calculated by entropy-one; https://www.hiv.lanl.gov/content/sequence/ENTROPY/entropy_one.html). The uORF AUG is indicated by a purple dashed box, and the average entropy for the A and U were calculated separately from the three upstream bases.
Author response image 2
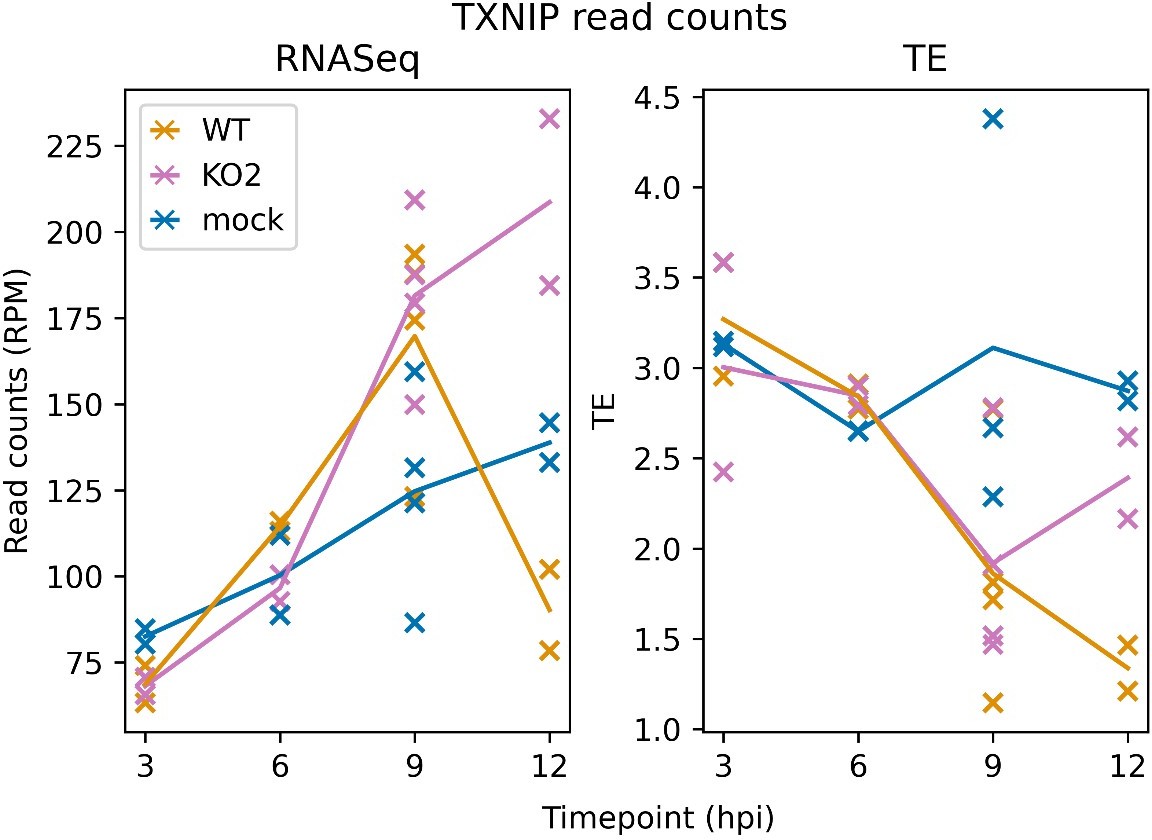
TXNIP expression over a timecourse of NA PRRSV infection. Bowtie-aligned positive-sense reads mapping to TXNIP (XM_007977281.1) were filtered to select those with inferred P sites within the CDS (filter applied to RNASeq reads for comparability). Read counts were converted to RPM using a denominator of positive-sense host-mRNA-mapping reads, and TE was calculated by dividing RiboSeq values by RNASeq values.
Tables
Key resources table
| Reagent type (species) or resource | Designation | Source or reference | Identifiers | Additional information |
|---|---|---|---|---|
| Strain, strain background (PRRSV-2) | WT NA PRRSV | PMID:23761406 | SD95-21; GenBank:KC469618.1 | |
| Strain, strain background (PRRSV-2) | KO2 NA PRRSV | PMID:23043113 | SD95-21 KO2 | |
| Strain, strain background (PRRSV-1) | EU PRRSV | This paper | BH1; GenBank:OK635576 | Based on Porcilis vaccine strain (MDS Animal Health), passaged in tissue culture |
| Cell line (Chlorocebus sabaeus) | MA-104 | ECACC | RRID:CVCL_3845; ECACC 85102918 | |
| Cell line (C. sabaeus) | MARC-145 | ATCC | RRID:CVCL_4540; CRL-12231 | |
| Antibody | Anti-NA-nsp1β (mouse monoclonal) | PMID:24825891 | (1/1000) | |
| Antibody | Anti-EU-nsp1β (mouse monoclonal) | PMID:22258855 | (1/500) | |
| Commercial assay or kit | Ribo-Zero Gold rRNA removal kit (human/mouse/rat) | Illumina | This kit is now discontinued, replaced by Illumina Stranded Total RNA Prep with Ribo-Zero Plus kit | |
| Chemical compound, drug | Cycloheximide; CHX | Merck | 239763 | |
| Other | RNase I | Ambion | AM2294 | |
| Software, algorithm | bowtie; bowtie1 | PMID:19261174 | Version 1.2.3; RRID:SCR_005476 | Aligner for reads in core pipeline |
| Software, algorithm | STAR | PMID:23104886 | Version 2.7.3a; RRID:SCR_004463 | Aligner for junction-spanning read analysis, PRICE, and differential gene expression |
| Software, algorithm | PRICE | PMID:29529017 | Version 1.0.3b | Detection of novel ORFs and quantification of translation |
| Software, algorithm | htseq-count | PMID:25260700 | Version 0.13.5 | Counting reads attributed to each gene for differential gene expression |
| Software, algorithm | DESeq2 | PMID:25516281 | Version 1.30.1; RRID:SCR_015687 | Performing differential gene expression analysis for RNASeq, and quality filtering and normalisation for differential TE analysis |
| software, algorithm | xtail | PMID:27041671 | Version 1.1.5 | Performing differential TE analysis |
Additional files
-
Supplementary file 1
Composition of libraries.
Number of reads assigned to each category. Reads were classified as ‘too short’ if their inferred original fragment length was shorter than the minimum intended length experimentally purified (25 nt for all RNASeq libraries; for RiboSeq libraries: 25 nt for European porcine reproductive and respiratory syndrome virus (EU PRRSV) libraries and North American (NA) PRRSV 9 hr post-infection (hpi) replicate 1 libraries, 19 nt for all other libraries).
- https://cdn.elifesciences.org/articles/75668/elife-75668-supp1-v2.xlsx
-
Supplementary file 2
Coordinates of regions of the North American (NA) and European porcine reproductive and respiratory syndrome virus (PRRSV) genomes used for each analysis.
All coordinates denote the regions within which the 5′ end of the reads must map to qualify for inclusion in the analysis. Sheet 1: general plots and analyses (other than quantification of viral gene expression). Sheet 2: transcript abundance estimation. Sheet 3: translation level estimation.
- https://cdn.elifesciences.org/articles/75668/elife-75668-supp2-v2.xlsx
-
Transparent reporting form
- https://cdn.elifesciences.org/articles/75668/elife-75668-transrepform1-v2.docx
Download links
A two-part list of links to download the article, or parts of the article, in various formats.
Downloads (link to download the article as PDF)
Open citations (links to open the citations from this article in various online reference manager services)
Cite this article (links to download the citations from this article in formats compatible with various reference manager tools)
Ribosome profiling of porcine reproductive and respiratory syndrome virus reveals novel features of viral gene expression
eLife 11:e75668.
https://doi.org/10.7554/eLife.75668


