T cells discriminate between groups C1 and C2 HLA-C
- Laboratory of Immunogenetics, National Institute of Allergy and Infectious Diseases, National Institutes of Health, United States
Figures
Figure 1 with 1 supplement
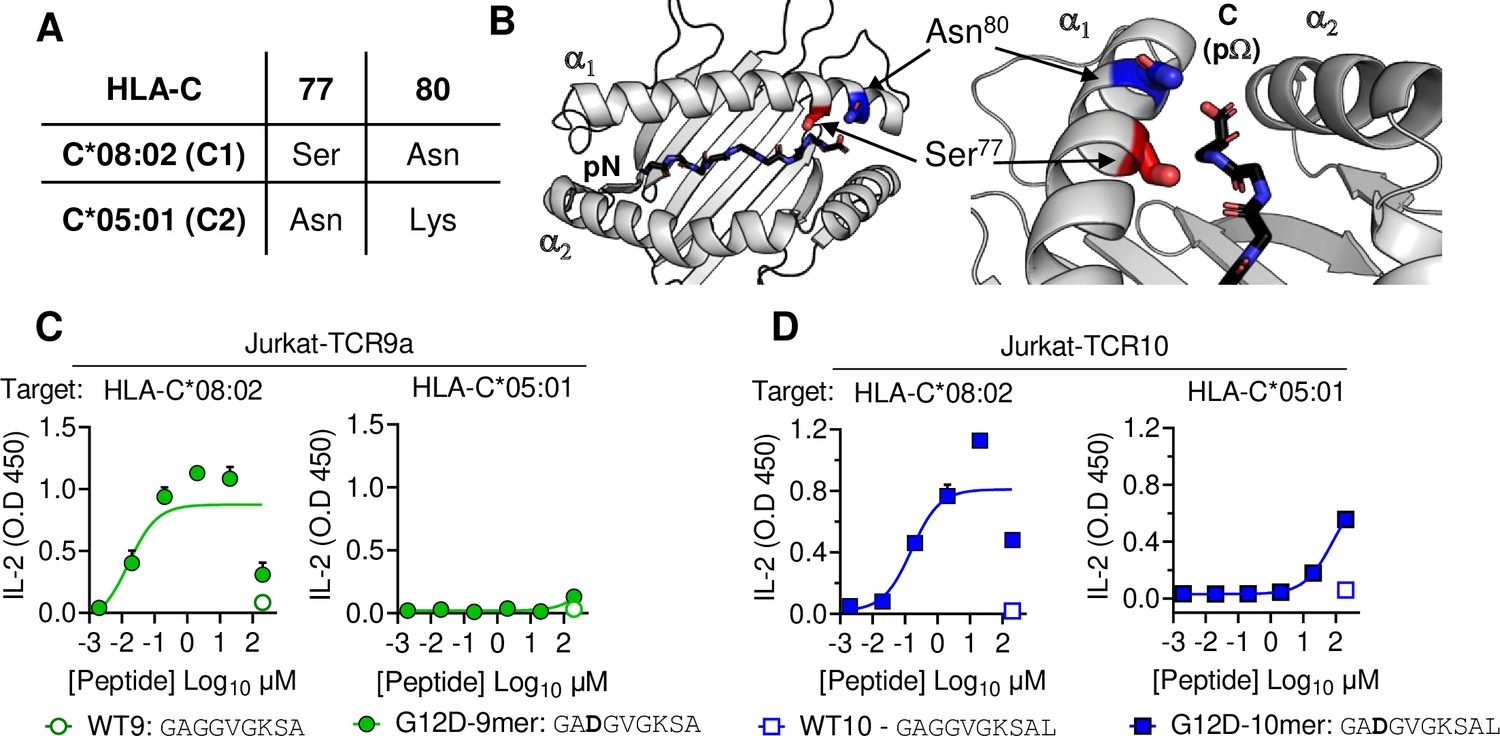
HLA-C C1/C2 dimorphism impacts T cell recognition of KRAS-G12D neoantigen.
(A) Sequence of C1/C2 dimorphism in HLA-C*08:02 and HLA-C*05:01 at positions 77 and 80. All other residues are identical. (B) Location of C1/C2 dimorphism on the structure of HLA-C*08:02, close to peptide C-terminus (PDB:6ULI). (C, D) Stimulation of TCR9a+ Jurkat cells (C) and TCR10+ Jurkat cells (D) by 221C*08:02 (left) or 221C*05:01 (right) preloaded with KRAS WT or G12D peptides at indicated concentrations. Means and standard errors of IL-2 concentration in culture supernatant measured by ELISA are shown from two independent biological replicates. Source data available in Figure 1—source data 1.
-
Figure 1—source data 1
ELISA readings for Figure 1C, D.
- https://cdn.elifesciences.org/articles/75670/elife-75670-fig1-data1-v2.xlsx
Figure 1—figure supplement 1
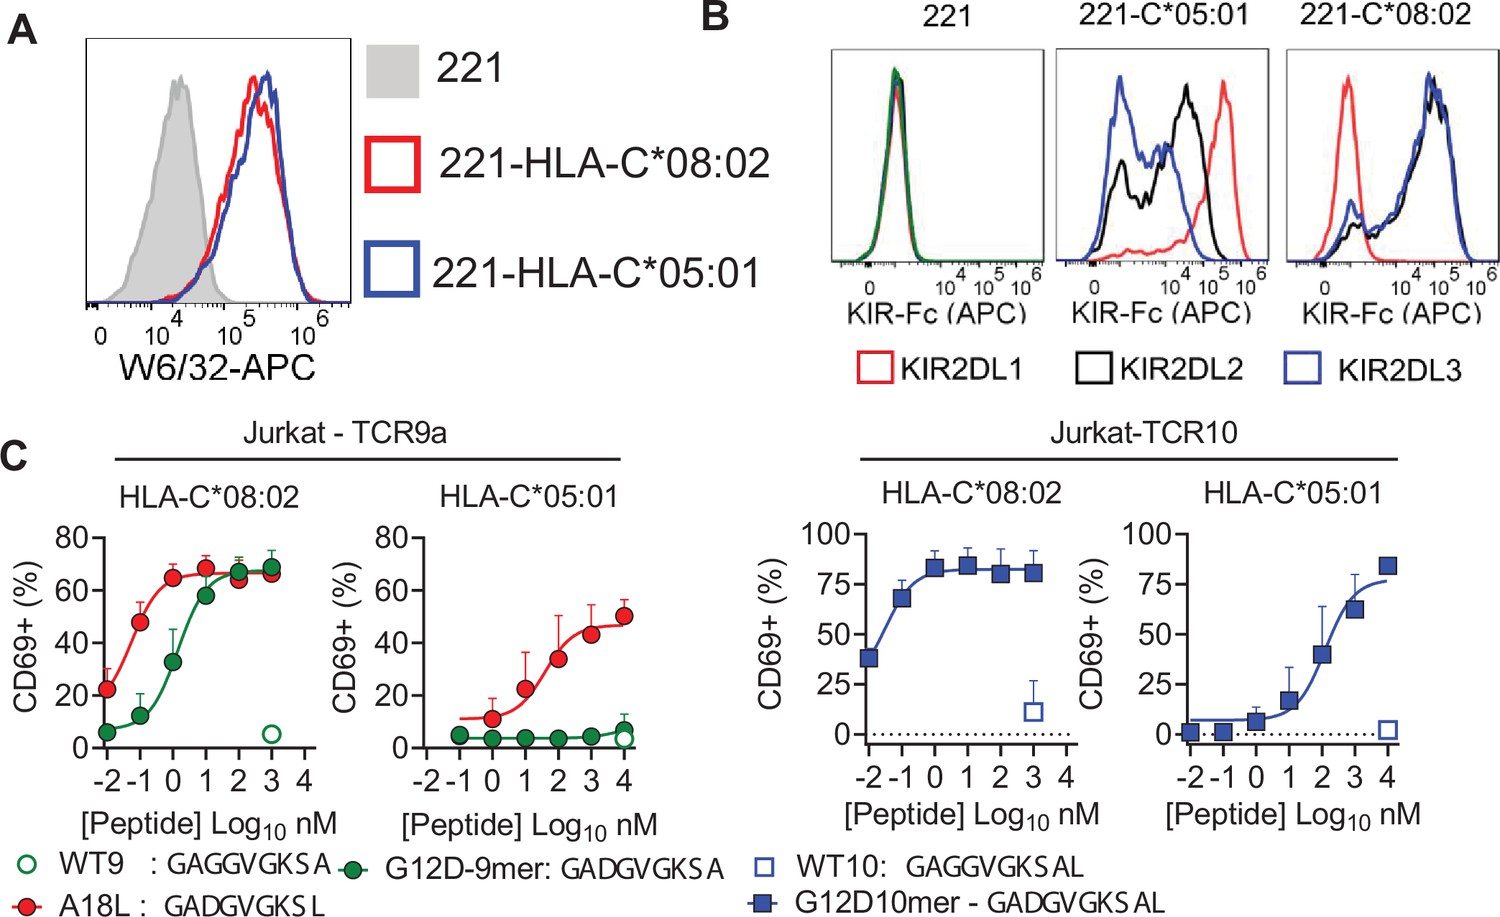
Impact of C1/C2 dimorphism in T cell recognition of HLA-C.
(A) Expression of HLA-C*08:02 and HLA-C*05:01 on 721.221 (221) cells. (B) Recombinant KIR-Ig fusion protein (KIR-Fc) binding to 221, 221C*05:01, and 221C*08:02. KIR-Fc was conjugated to protein-A APC and used at 3.6 μg/ml. (C) Stimulation of Jurkat-TCR9a (left) and Jurkat-TCR10 (right) with indicated peptides loaded on TAP-deficient cells expressing HLA-C*08:02 and HLA-C*05:01. Jurkat T cell activation was measured by CD69 expression by flow cytometry. Means and standard errors from at least three independent experiments are shown.
Figure 2 with 1 supplement
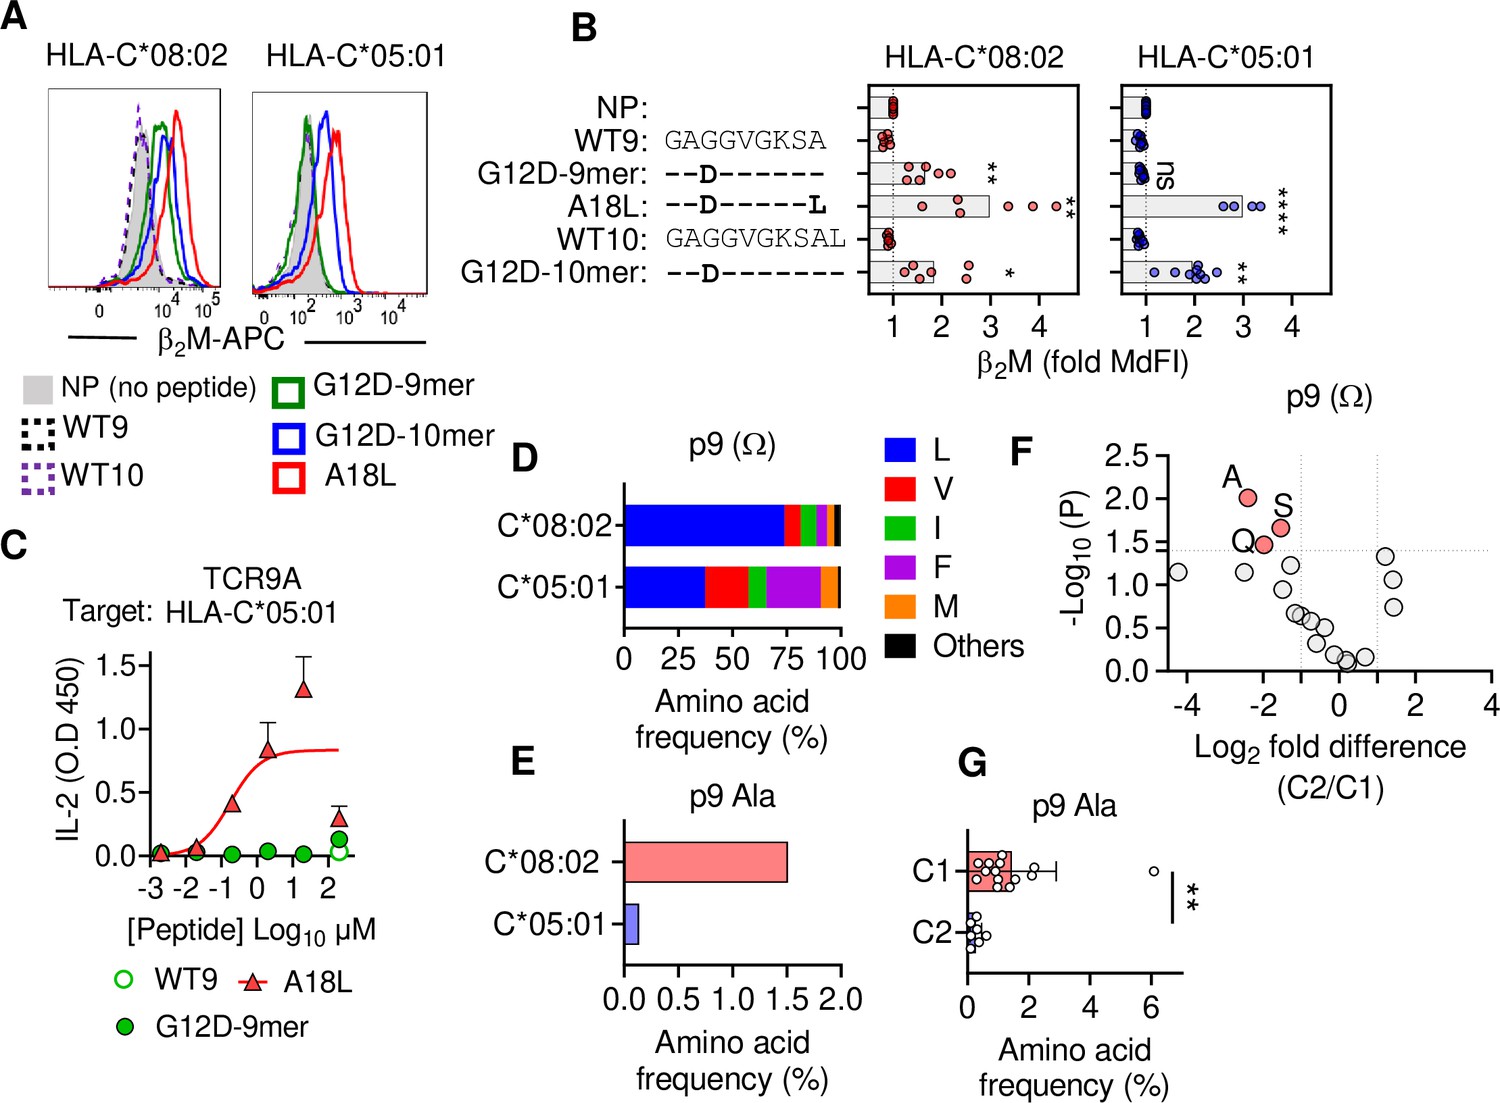
C1 but not C2 HLA-C allotypes present peptides with C-terminal (pΩ) Ala.
(A) Stabilization of HLA-C on TAP-deficient 221 cells expressing HLA-C*08:02 or HLA-C*05:01. (B) Data from (A) shown as fold median fluorescent intensity (MdFI) relative to no peptide (NP) from a minimum of four independent experiments. (C) Stimulation of TCR9a+ Jurkat cells by 221C*05:01 cells preloaded with KRAS peptides at indicated concentrations. Means and standard errors of IL-2 concentration in culture supernatant measured by ELISA from two biological replicates are shown. (D) Frequency of indicated residues at the C-terminus (pΩ) in peptides eluted from HLA-C*08:02 or HLA-C*05:01. (E) Frequency of pΩ Ala in peptides eluted from HLA-C*08:02 or HLA-C*05:01. (F) Volcano plot displaying pΩ amino acid frequency from 21 HLA-C allotypes. The C2/C1 ratio is shown for the average frequency of each amino acid. (G) The frequency of pΩ Ala from 21 HLA-C allotypes by C1/C2 status. Statistical significance was assessed by unpaired t-test with Welsh’s correction, *p<0.05, **p<0.001, ****p<0.0001. Source data available in Figure 2—source data 1. Peptide sequences and p9 frequency analysis are available in Figure 2—source data 2.
-
Figure 2—source data 1
Normalized MdFI values for Figure 2B, ELISA readings for Figure 2C and amino acids frequencies for Figure 2D-G.
- https://cdn.elifesciences.org/articles/75670/elife-75670-fig2-data1-v2.xlsx
-
Figure 2—source data 2
HLA-C Peptide sequences used for analysis.
- https://cdn.elifesciences.org/articles/75670/elife-75670-fig2-data2-v2.xlsx
Figure 2—figure supplement 1
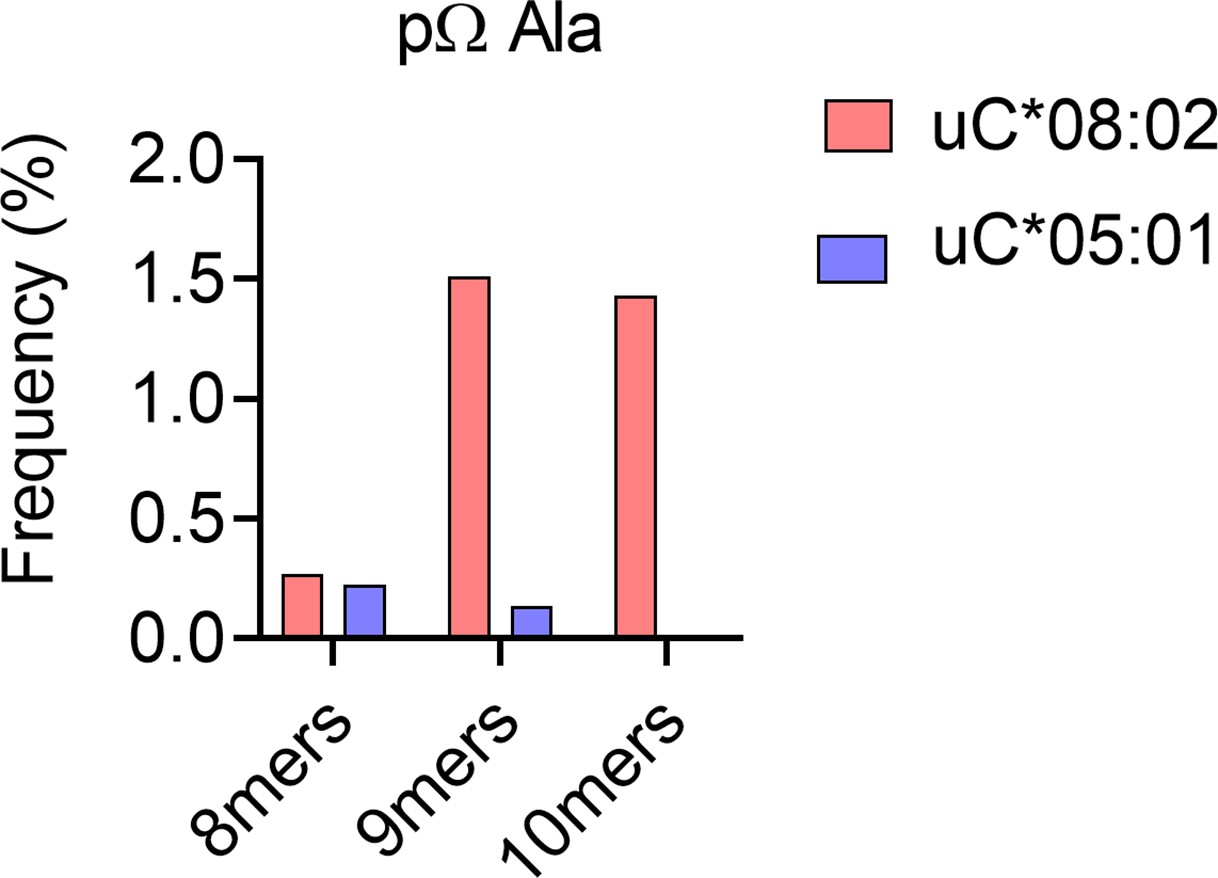
Impact of peptide length on frequency of C-terminal (pΩ) Ala in peptides eluted from C*08:02 and C*05:01.
Frequency of peptides with C-terminal Ala in 8mers, 9mers, and 10mers eluted from HLA-C*08:02 and HLA-C*05:01.
Figure 3 with 1 supplement

T cell receptor (TCR) binding is weaker to C2 HLA-C.
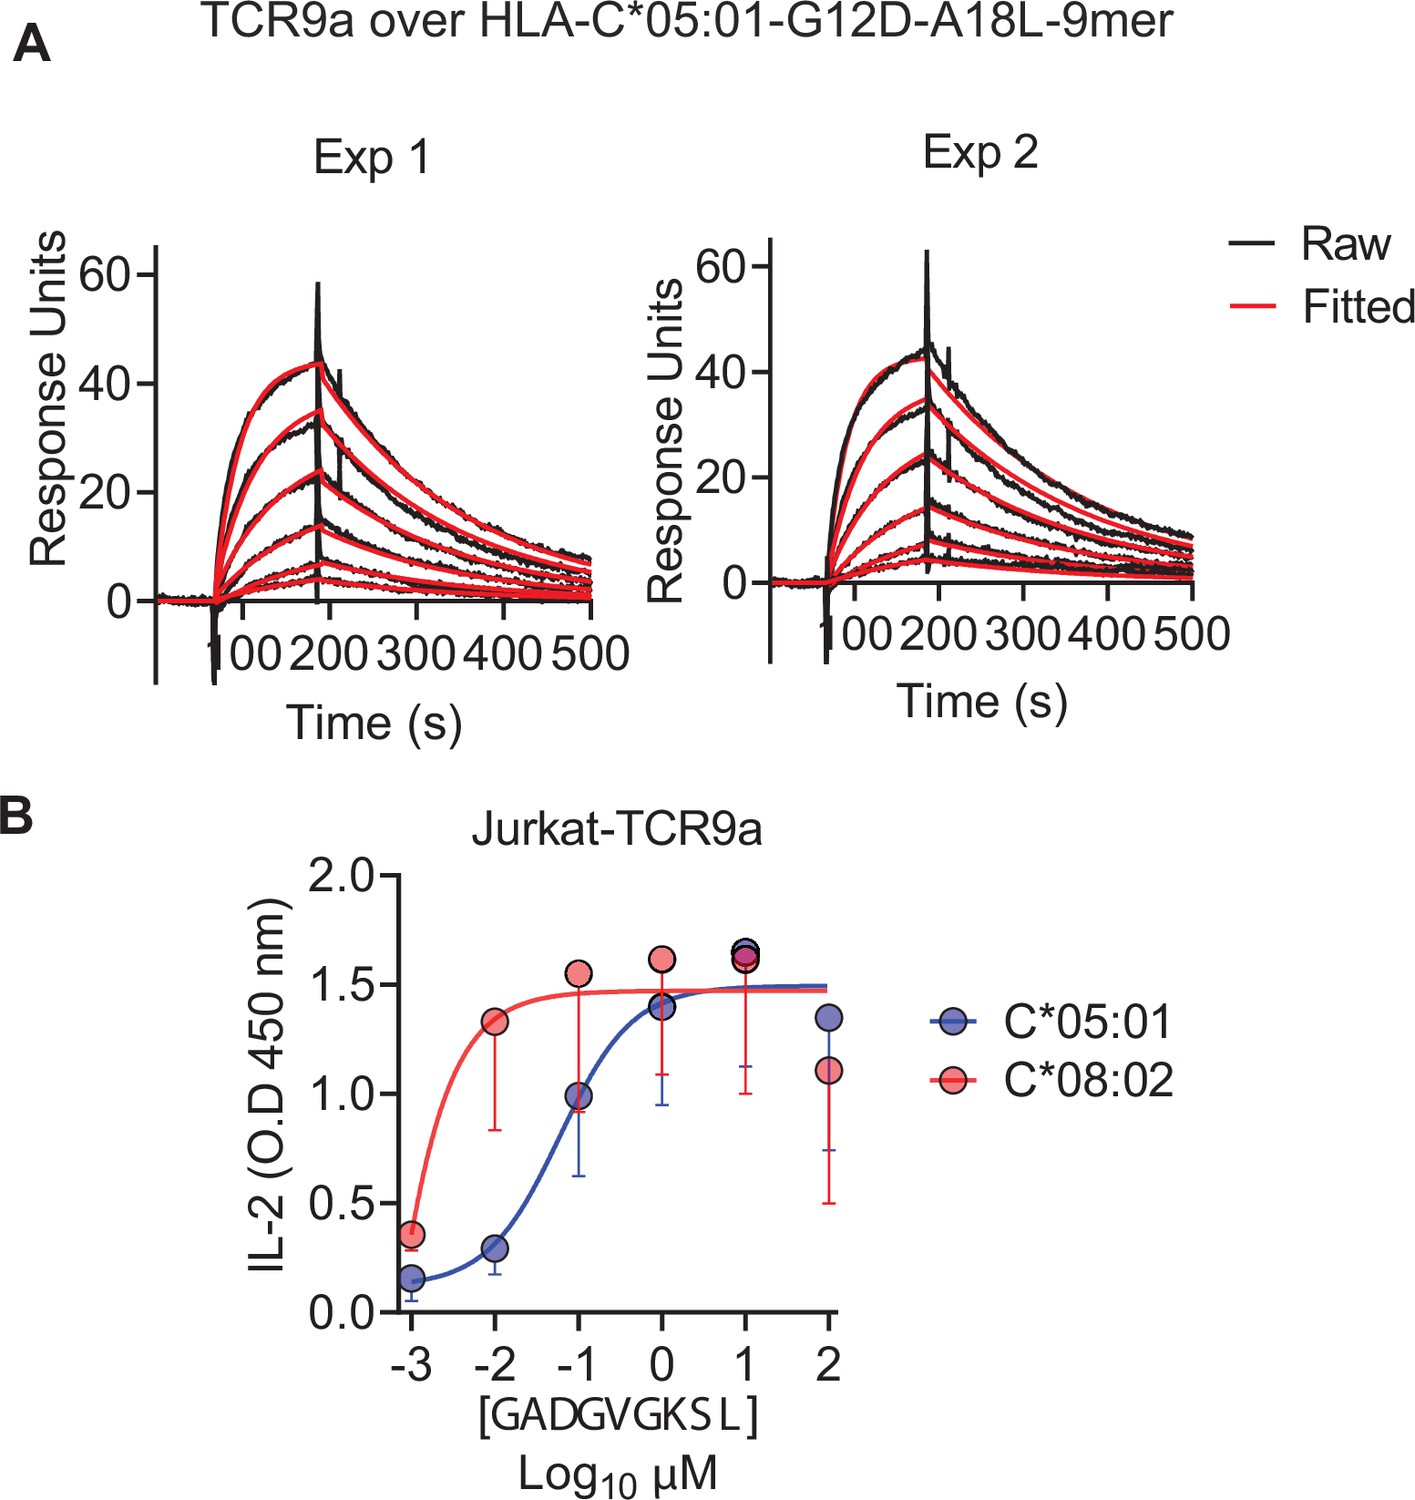
(A) Binding of TCR9a to captured HLA-C*05:01-KRAS-G12D-A18L determined by surface plasmon resonance (SPR). Dissociation constant was determined by kinetic curve fitting of 12 curves from two independent experiments. (B, C) Binding of HLA-C*08:02 or HLA-C*05:01 tetramers to Jurkat T-cells expressing TCR9a or TCR10 at indicated tetramer concentrations. HLA-C was refolded with indicated peptides. (C) Summary of (B) from two independent experiments displayed as average (mean) and standard error of median fluorescence intensity (MdFI). (D, E) Binding of TCR10 to captured HLA-C*08:02-G12D-10mer and HLA-C*05:01-G12D-10mer by SPR. One experiment of four is shown. (F) Mean, standard deviation, and nonlinear curve fitting of TCR10 binding to G12D-10mer bound to C*08:02 and C*05:01. Dissociation constants were derived from four independent binding experiments with twofold serial dilutions of TCR10 starting at 10 μM (two experiments), 40 μM (one experiment), and 80 μM (one experiment). (G) Association binding of TCR10 with G12D-10mer presented by C*08:02 or C*05:01. SA, streptavidin; Tet, tetramer. Source data available in Figure 3—source data 1.
-
Figure 3—source data 1
Raw data for TCR response curves in Figure 3A, D, E and G.
MdFI of tetramer binding experiments in 3C. Responses of all TCR10 binding assays in 3F.
- https://cdn.elifesciences.org/articles/75670/elife-75670-fig3-data1-v2.xlsx
Figure 3—figure supplement 1
C*08 is a better ligand for TCR9a than C*05.
(A) Binding of TCR9a to C*05-A18L-9mer by surface plasmon resonance (SPR). Binding was measured with six serial twofold dilutions with a highest concentration of 1200 nM. The plots display raw and fitted data from two independent experiments. (B) Activation of Jurkat-TCR9a cells by 221C*08:02 and 221C*05:01 loaded with A18L-9mer. Means and standard errors of IL-2 concentration in culture supernatant from three independent experiments are shown.
Figure 4 with 1 supplement
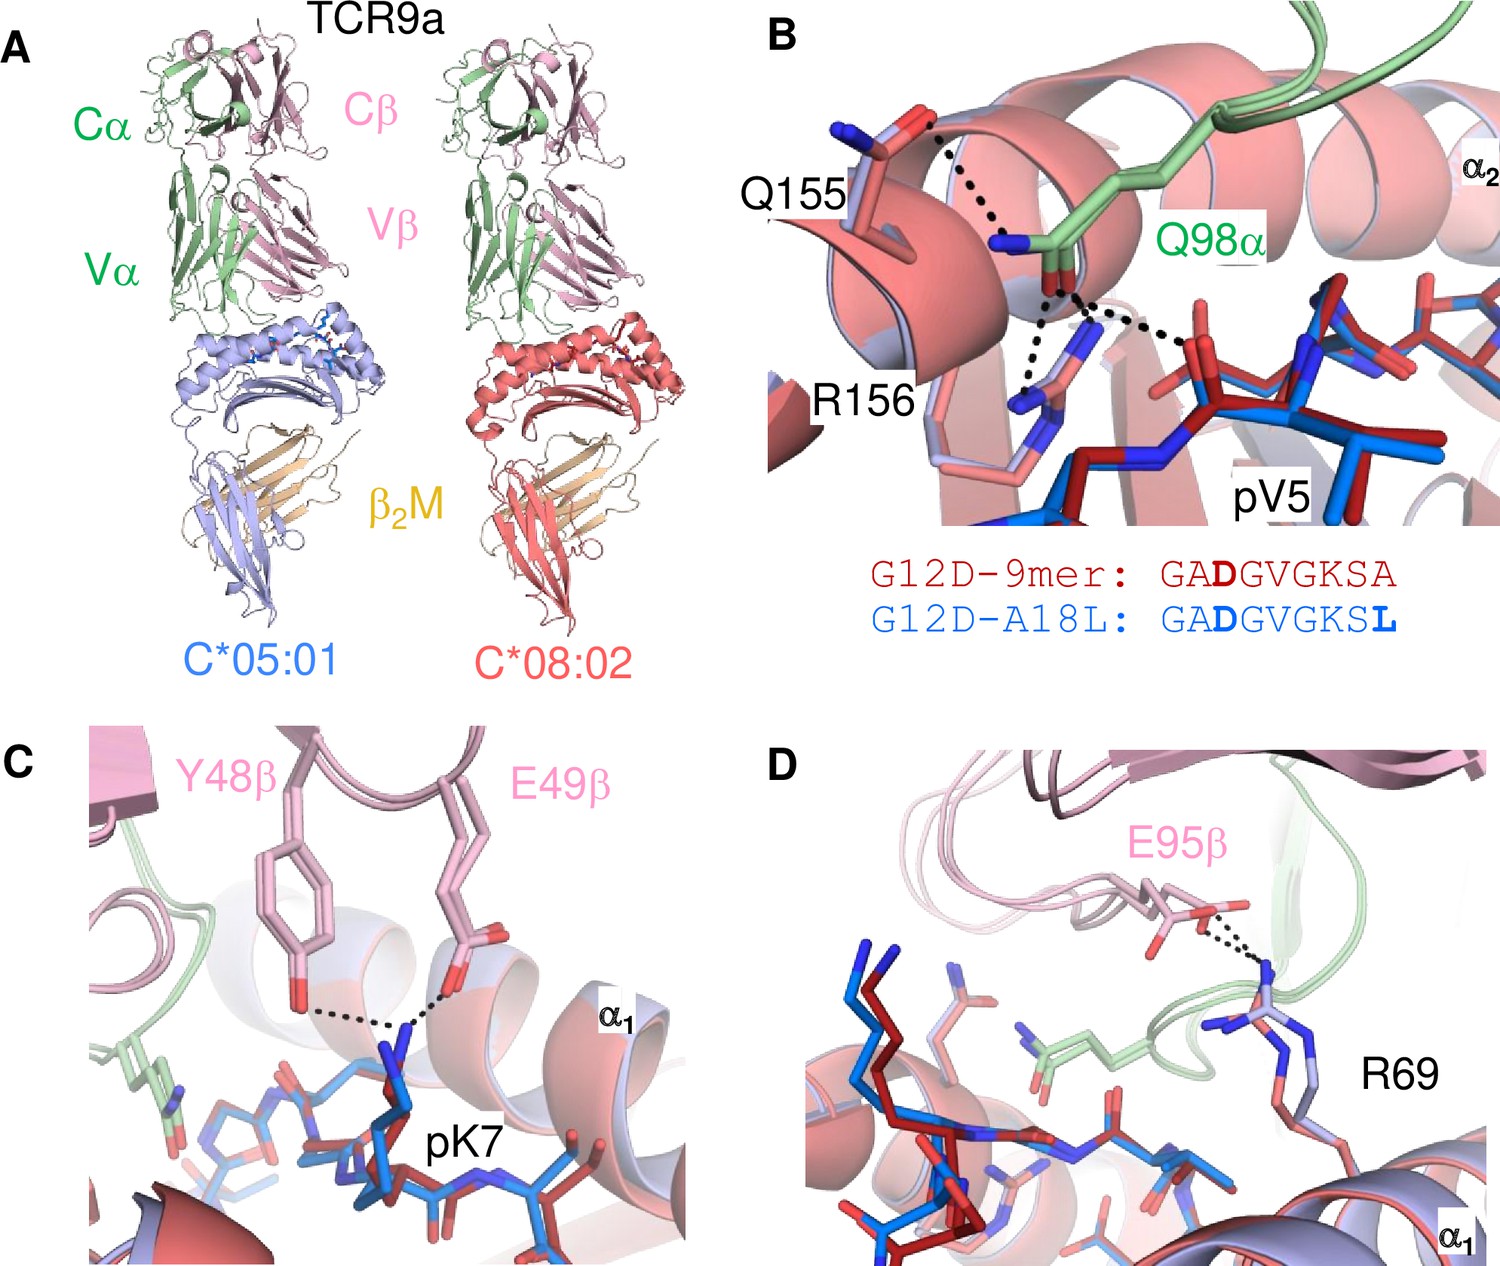
Minimal impact of C1/C2 dimorphism on TCR:HLA-C complex structure.
(A) Side view of TCR9a in complex with HLA-C*05:01-G12D-A18L (left) and HLA-C*08:02-G12D-9mer (right; PDB:6ULR). (B–D) Interactions of TCR9a with HLA-C*05:01-A18L (blue) and HLA-C*08:02-G12D-9mer (red). TCR9a α chain, green; β chain, pink; β2-microglobulin (β2M), gold.
Figure 4—figure supplement 1
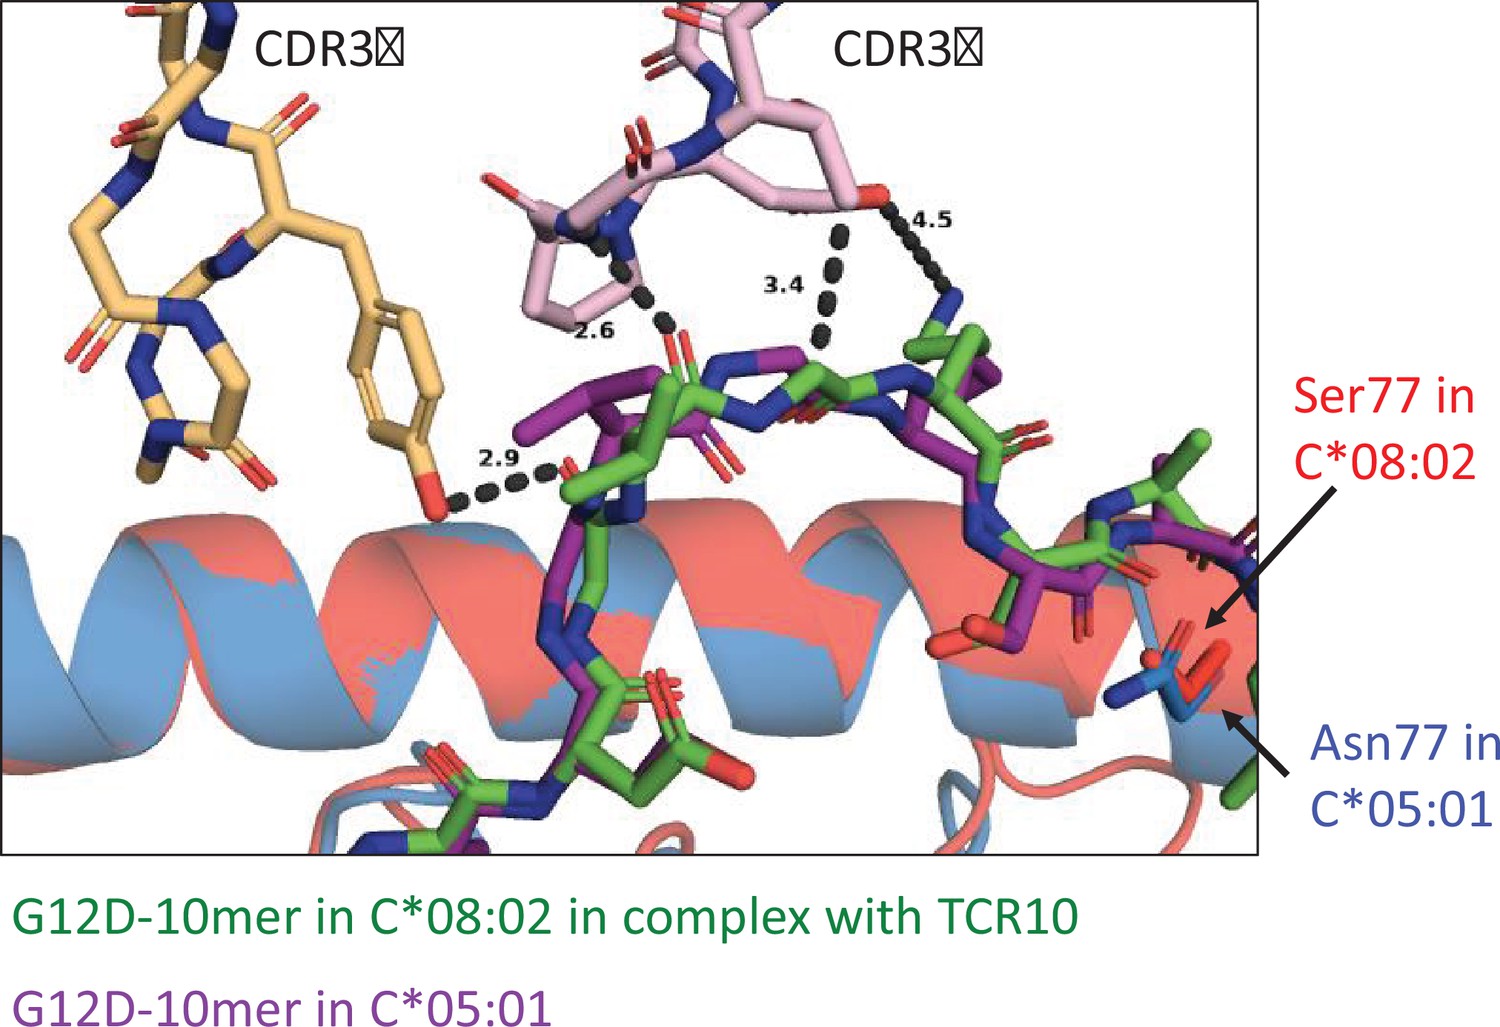
Modeling TCR10 binding to C*05:01-G12D-10mer.
Crystal structure of TCR10 in complex with C*08:02-G12D-10mer (PDB:6UON) was used to dock C*05:01-G12D-10mer (PDB:6JTO). Docking was carried out in PyMOL.
Figure 5 with 1 supplement
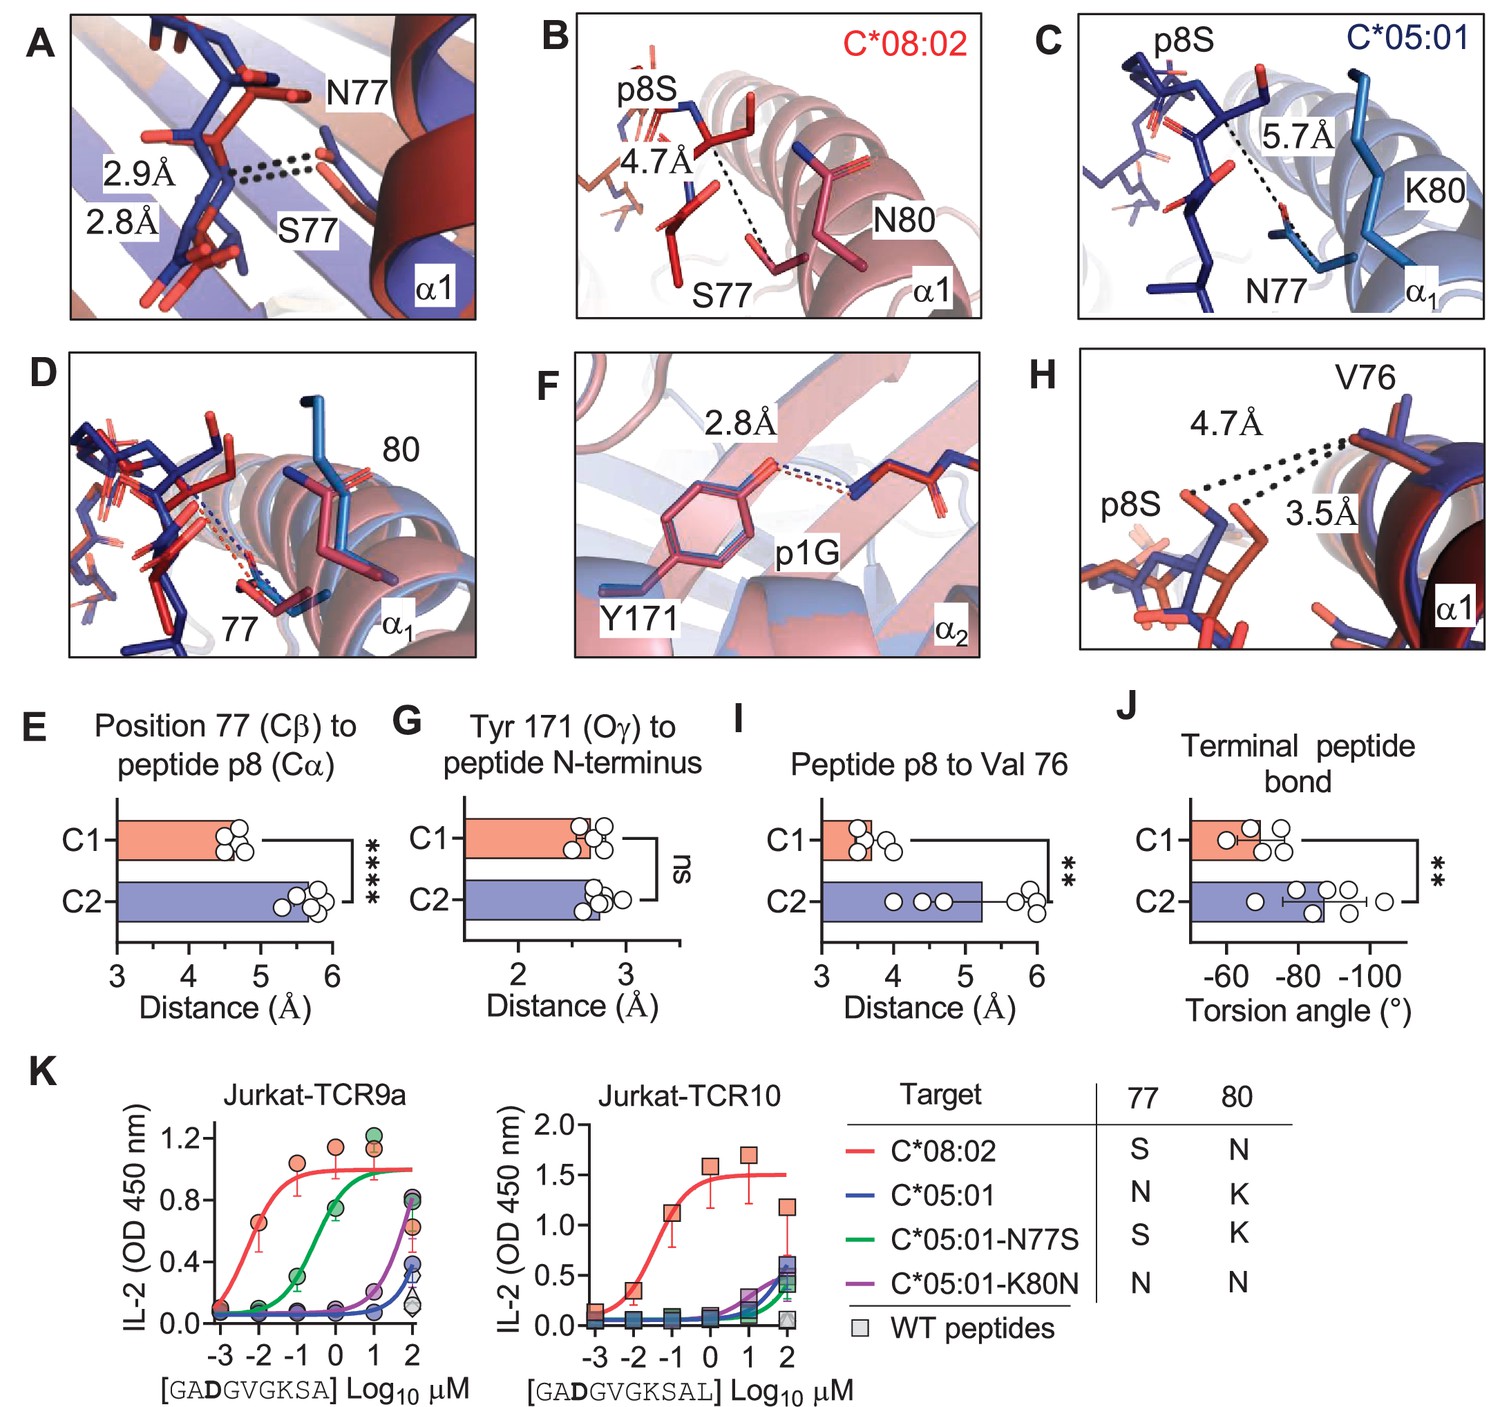
C1/C2 dimorphism determines the distance between peptide p8 and HLA-C.
(A) Hydrogen bond between HLA-C position 77 and amide in terminal peptide bond in C*08:02-G12D-9mer and C*05:01-A18L-9mer structures. (B–D) Distance between HLA-C position 77 Cβ and Cα of peptide p8 Ser of HLA-C*08:02-G12D-9mer (B), HLA-C*05:01-G12D-A18L (C), and both overlaid (D). (E) Distances between HLA-C position 77 Cβ and Cα of peptide pΩ-1 in 12 HLA-C crystal structures. (F) Distance between Tyr 171 Oγ and peptide N-terminus of C*08:02 and C*05:01. (G) Distance between Tyr 171 Oγ and peptide N-terminus in 12 HLA-C crystal structures. (H) Distance between peptide p8 side chain and HLA-C position 77 Val side chain in structures of C*08:02 and C*05:01. (I) Distance between peptide pΩ-1 side chain and HLA-C position 76 Val side chain in 12 HLA-C structures. (J) Torsion angle of terminal peptide bond in 12 HLA-C structures. (K) Stimulation of Jurkat-TCR9a+ and Jurkat-TCR10+ by 221 cells expressing HLA-C*08:02, HLA-C*05:01, HLA-C*05:01-N77S, or HLA-C*05:01-K80N preloaded with G12D-9mer (left) or G12D-10mer (right). Means and standard errors of IL-2 concentration in culture supernatant measured by ELISA from three biological replicates are shown. Significance in (E), (G), (I), and (J) was measured using an unpaired t-test with Welch’s correction, **p<0.01, ****p<0.0001. Source data available in Figure 5—source data 1.
-
Figure 5—source data 1
Raw distances for Figure 5E, G, I.
Raw angles for 5J. ELISA readings for 5K.
- https://cdn.elifesciences.org/articles/75670/elife-75670-fig5-data1-v2.xlsx
Figure 5—figure supplement 1
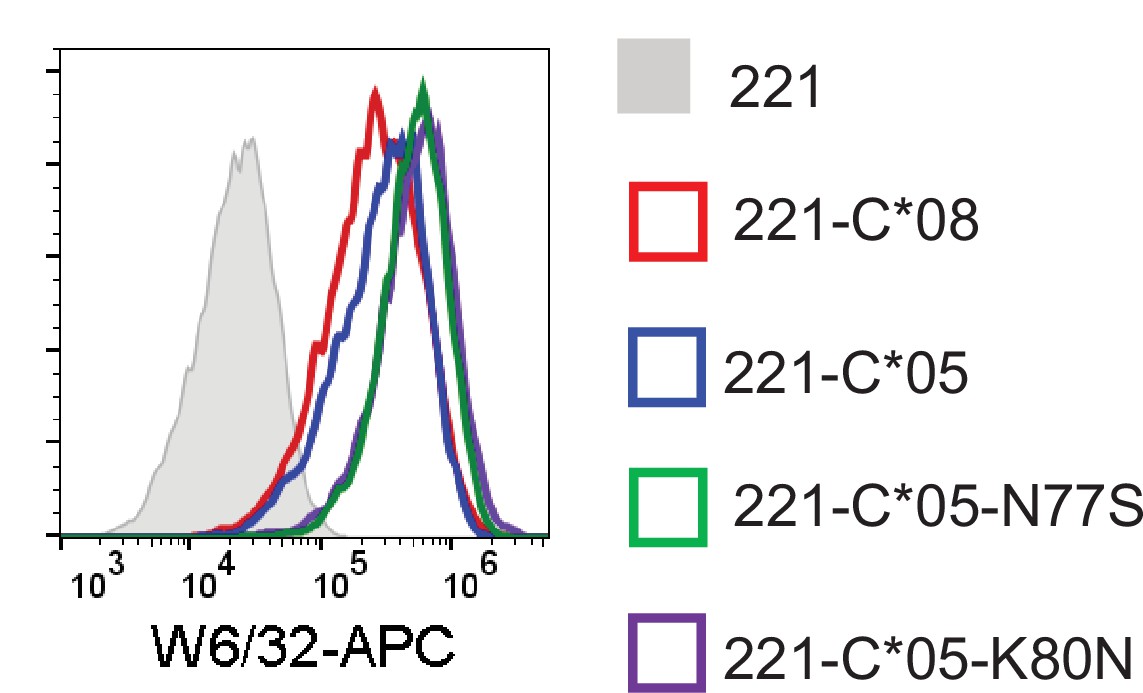
Expression HLA-C in 721.221 cells with position 77 and 80 substitutions.
Figure 6 with 1 supplement
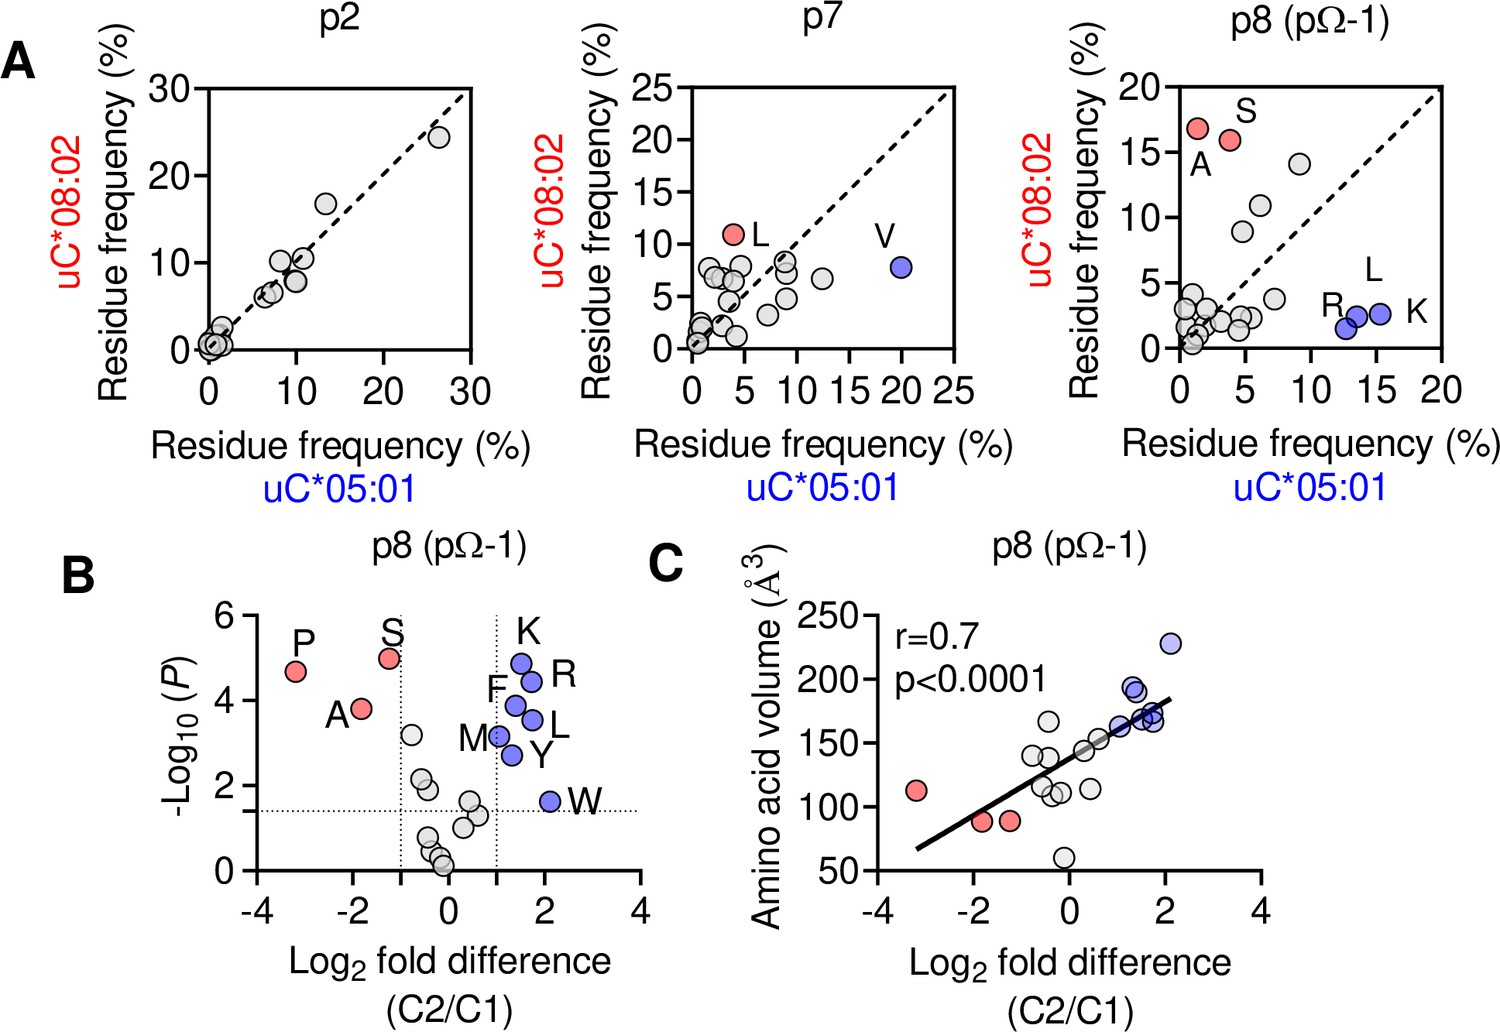
The C1/C2 dimorphism selects for side-chain size at pΩ-1.
(A) Correlation of amino acid frequency at p2, p7, and p8 (pΩ-1) of 9mer peptides unique to HLA-C*08:02 (uC*08:02) and unique to HLA-C*05:01 (uC*05:01). (B) Volcano plot displaying relative p8 amino acid frequency from 9mer peptides eluted from 14 HLA-C allotypes based on C1/C2 status. Amino acids with twofold enrichment and statistically significant differences (p<0.05) determined by Student’s t-test are shown. A total of 26,543 peptide sequences were included. (C) Correlation (Pearson) of amino acid volume with amino acid enrichment at p8 of peptides eluted from HLA-C defined by C2/C1 status. Source data available in Figure 6—source data 1. Peptide sequences and p8 frequency analysis are available in Figure 2—source data 2.
-
Figure 6—source data 1
Amino acid frequencies for Figure 6A, fold change and p vlaues for 6B, fold change and amino acid volume for 6C.
- https://cdn.elifesciences.org/articles/75670/elife-75670-fig6-data1-v2.xlsx
Figure 6—figure supplement 1
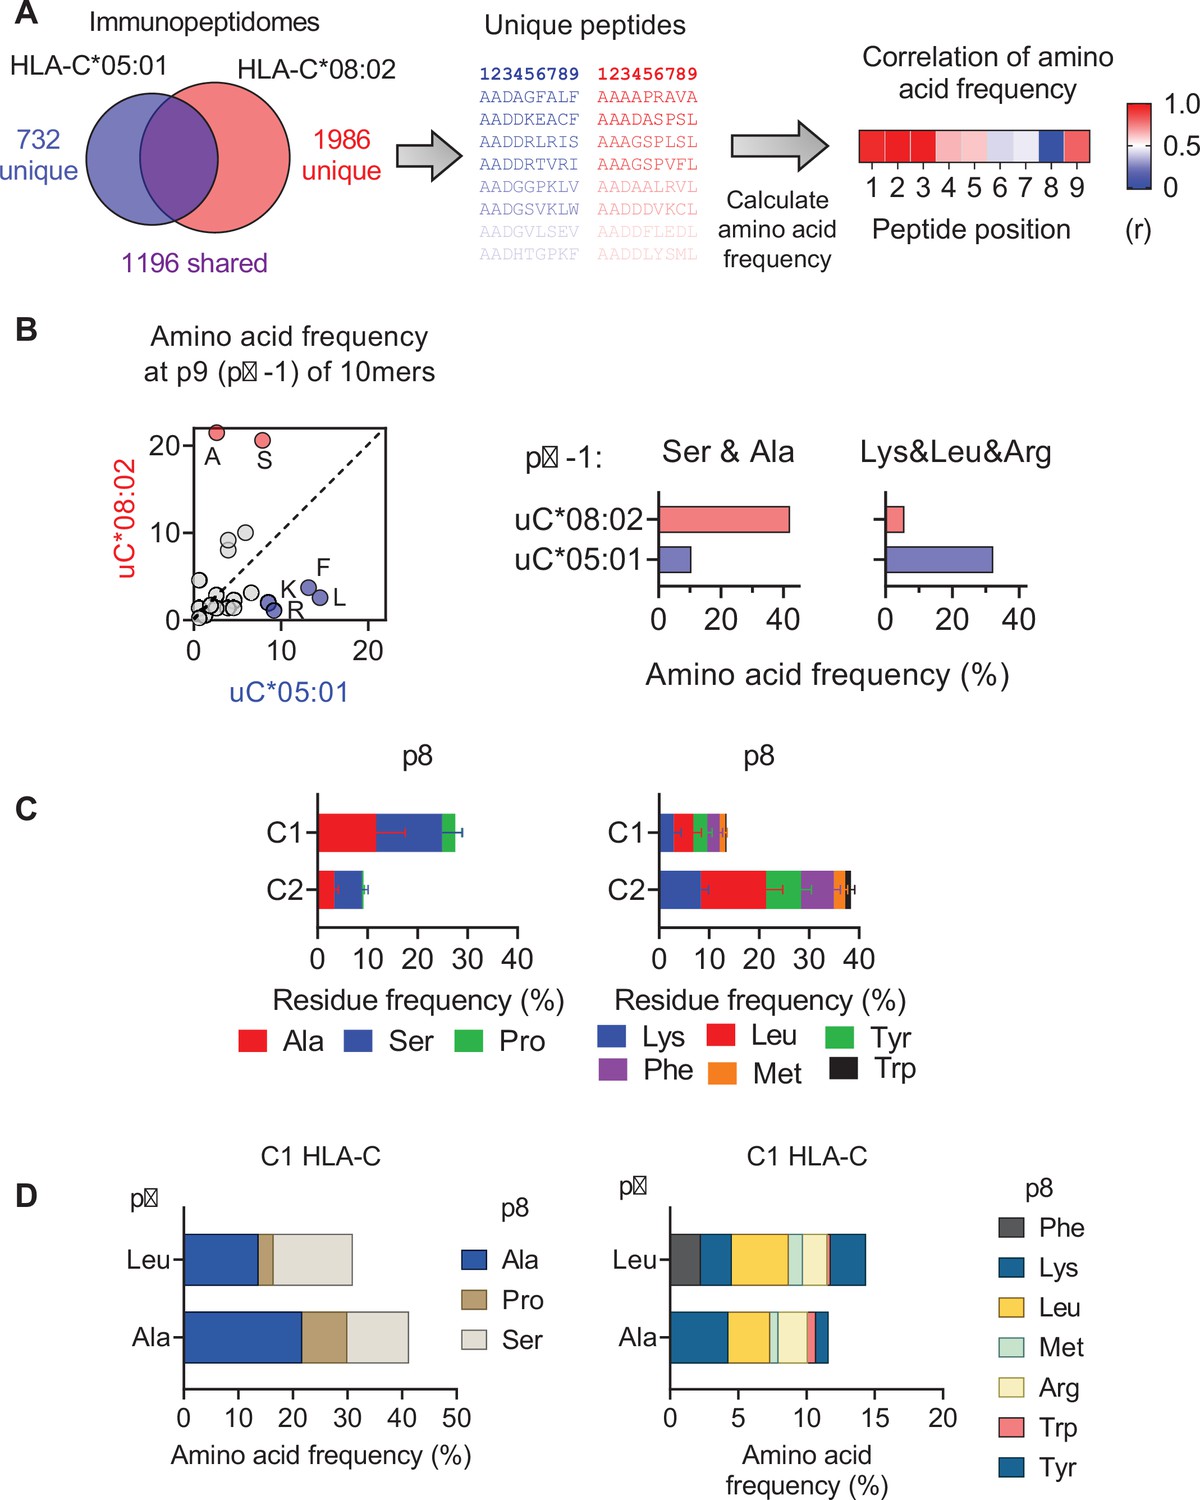
Impact of C1/C2 dimorphism on HLA-C immunopeptidomes.
(A) Workflow for comparing amino acid frequency of 9mer peptides eluted from HLA-C*05:01 and HLA-C*08:02. Amino acid frequencies were compared by Pearson correlation. (B, left) Correlation of amino acid frequencies at p9 (pΩ-1) of 10mers eluted from HLA-C*05:01 and HLA-C*08:02. Frequencies of Ser and Ala and Lys, Leu and Arg at pΩ-1 from peptides eluted from HLA-C*08:02 and HLA-C*05:01 (right). (C) Average frequencies of indicated amino acids at p8 (pΩ-1) of 9mers eluted from 14 C1 and 7 C2 HLA-C allotypes. (D) Amino acid frequencies at p8 (pΩ-1) of 9mers eluted from C1 allotypes with Ala or Leu at the C-terminus (pΩ).
Figure 7 with 1 supplement

Large residues at p8 diminish T cell recognition of C1 HLA-C.
(A–F) Stimulation of Jurkat-TCR9a+ cells by 221C*08:02 cells preloaded with pΩ-1 substitutions of G12D-9mer (A, B) and A18L-9mer (D, E) at indicated concentrations. Each peptide was tested individually in two independent experiments and displayed by p8 sequence as indicated. (C, F) Data from (A, B) and (D, E) are summarized in (C) and (F), respectively, by pooling data by indicated p8 substitutions. Means and standard errors of IL-2 concentration in culture supernatant measured by ELISA are shown. Source data available in Figure 7—source data 1.
-
Figure 7—source data 1
ELISA readings for Figure 7.
- https://cdn.elifesciences.org/articles/75670/elife-75670-fig7-data1-v2.xlsx
Figure 7—figure supplement 1
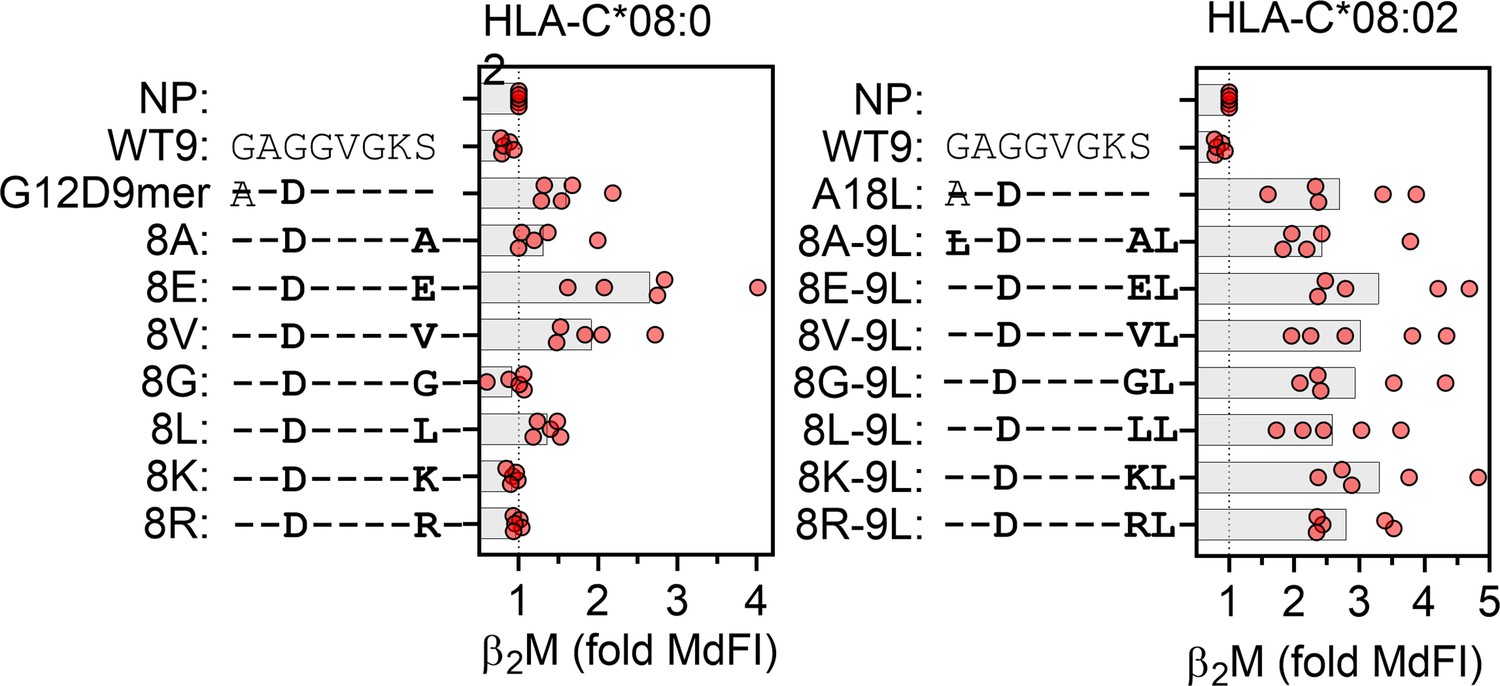
Impact of p8 size on stabilization of HLA-C*08:02.
Stabilization of HLA-C on HLA-C*08:02-expressing TAP-deficient cells by G12D-9mer (left) and A18L-9mer (right) with indicated p8 (pΩ-1) substitutions. Data are from five independent experiments and normalized to cells with no peptide (NP).
Tables
Key resources table
| Reagent type (species) or resource | Designation | Source or reference | Identifiers | Additional information |
|---|---|---|---|---|
| Cell line (human) | 721.221 (221) 221C*05:01 221C*08:02 221C*05:01-N77S 221C*05:01-K80N | Original 221, PMID:3257565 221C*05:01 and 221C*08:02, Sim et al., 2017, PMID:28352266 221C*05:01-N77S and 221C*05:01-K80N – this paper | Plasmids encoding HLA-C*05:01-N77S and HLA-C*05:01-K80N were generated by QuikChange mutagenesis and expressed in 221 cells via retroviral transduction | |
| Strain, strain background (Escherichia coli) | BL21 (DE3) | Novagen | 70235-4 | For recombinant protein production |
| Recombinant DNA reagent | pet30a-HLA-C*05:01 | This paper | Synthesized by GenScript, USA Residues 1–278 Sequence from https://www.ebi.ac.uk/ipd/imgt/hla/ Soluble HLA-C*05:01 heavy chain for production in E. coli and in vitro refolding | |
| Recombinant DNA reagent | pet30a-HLA-C*08:02 | Sim et al., 2020; PMID:32461371 | Soluble HLA-C*08:02 heavy chain for production in E. coli and in vitro refolding | |
| Recombinant DNA reagent | pet30a-B2M | Sim et al., 2020; PMID:32461371 | Soluble B2M for production in E. coli and in vitro refolding | |
| Antibody | Anti-HLA-A, -B, -C (mouse monoclonal, clone W6/32) | BioLegend | 311402 | For SPR 10 μg/ml |
| Antibody | Anti-β2m (mouse monoclonal, clone 2M2) APC | BioLegend | 316312 | For peptide-loading experiments 1:50 |
| Antibody | Anti-human CD3 APC-Cy7 (mouse monoclonal) | BioLegend | 300426 | For Jurkat-T cell functional assays 1:100 |
| Antibody | Anti-human CD69 APC (mouse monoclonal) | BioLegend | 555533 | For Jurkat-T cell functional assays 1:100 |
| Cell line (human) | Jurkat-TCR9a, Jurkat TCR10 | Sim et al., 2020; PMID:32461371 | For Jurkat-T cell functional assays | |
| Cell line (human) | 221C*05:01-ICP47 | Sim et al., 2017; PMID:28352266 | ||
| Cell line (human) | 221C*08:02-TAP-KO | This paper | Cas9 was expressed in 221C*08:02 cells and gRNA to TAP1 were introduced by lentiviral transduction | |
| Recombinant DNA reagent | TCR9a alpha chain | Sim et al., 2020; PMID:32461371 | Soluble TCR9a alpha chain for production in E. coli and in vitro refolding | |
| Recombinant DNA reagent | TCR9a beta chain | Sim et al., 2020; PMID:32461371 | Soluble TCR9a beta chain for production in E. coli and in vitro refolding | |
| Recombinant DNA reagent | TCR10 alpha chain | Sim et al., 2020; PMID:32461371 | Soluble TCR10 alpha chain for production in E. coli and in vitro refolding | |
| Recombinant DNA reagent | TCR10 beta chain | Sim et al., 2020; PMID:32461371 | Soluble TCR10 beta chain for production in E. coli and in vitro refolding | |
| Peptide, recombinant protein | Streptavidin PE | Agilent | PJRS25-1 | For HLA-C tetramers |
| Peptide, recombinant protein | WT and G12D KRAS peptides with substitutions | This paper and Sim et al., 2020; PMID:32461371 | Synthesized by GenScript, USA | |
| Commercial assay or kit | Human IL-2 ELISA | BioLegend | 431804 | For Jurkat T-cell functional assays |
| Recombinant DNA reagent | TAP1 gRNA | GenScript | 1 gRNA sequence: CCCAGATGTCTTAGTGCTAC 2 gRNA sequence: ACCTGTAGCACTAAGACATC | pLentiCRISPR v2 vector Used to knockout TAP in 221C*08:02-Cas9 cells by lentiviral transduction |
| Commercial assay or kit | Amine coupling kit | GE Healthcare Life Sciences | BR100050 | For immobilization of protein on SPR chip |
| Commercial assay or kit | CM5 chips | Cytiva | 29149604 | For SPR |
| Peptide, recombinant protein | Biotinylated HLA-C monomers | NIH Tetramer Core Facility | For HLA-C tetramers |
Additional files
-
Supplementary file 1
Structural data and refinement statistics for TCR9a-C*05:01-A18L complex.
Data for outer shell shown in parentheses.
- https://cdn.elifesciences.org/articles/75670/elife-75670-supp1-v2.docx
-
Supplementary file 2
Major contacts between TCR9a and HLA-C*08:02 (6ULR) and HLA-C*05:01 (7SU9).
- https://cdn.elifesciences.org/articles/75670/elife-75670-supp2-v2.docx
-
Transparent reporting form
- https://cdn.elifesciences.org/articles/75670/elife-75670-transrepform1-v2.docx
Download links
A two-part list of links to download the article, or parts of the article, in various formats.
Downloads (link to download the article as PDF)
Open citations (links to open the citations from this article in various online reference manager services)
Cite this article (links to download the citations from this article in formats compatible with various reference manager tools)
T cells discriminate between groups C1 and C2 HLA-C
eLife 11:e75670.
https://doi.org/10.7554/eLife.75670


