Zebrafish airinemes optimize their shape between ballistic and diffusive search
- Center for Complex Biological Systems, University of California, Irvine, United States
- Center for Mathematical Biology, Department of Mathematics, University of Pennsylvania, United States
- Department of Developmental & Cell Biology, University of California, Irvine, United States
- Department of Physics and Astronomy, University of California, Irvine, United States
- Department of Mathematics, University of California, Irvine, United States
Figures
Figure 1
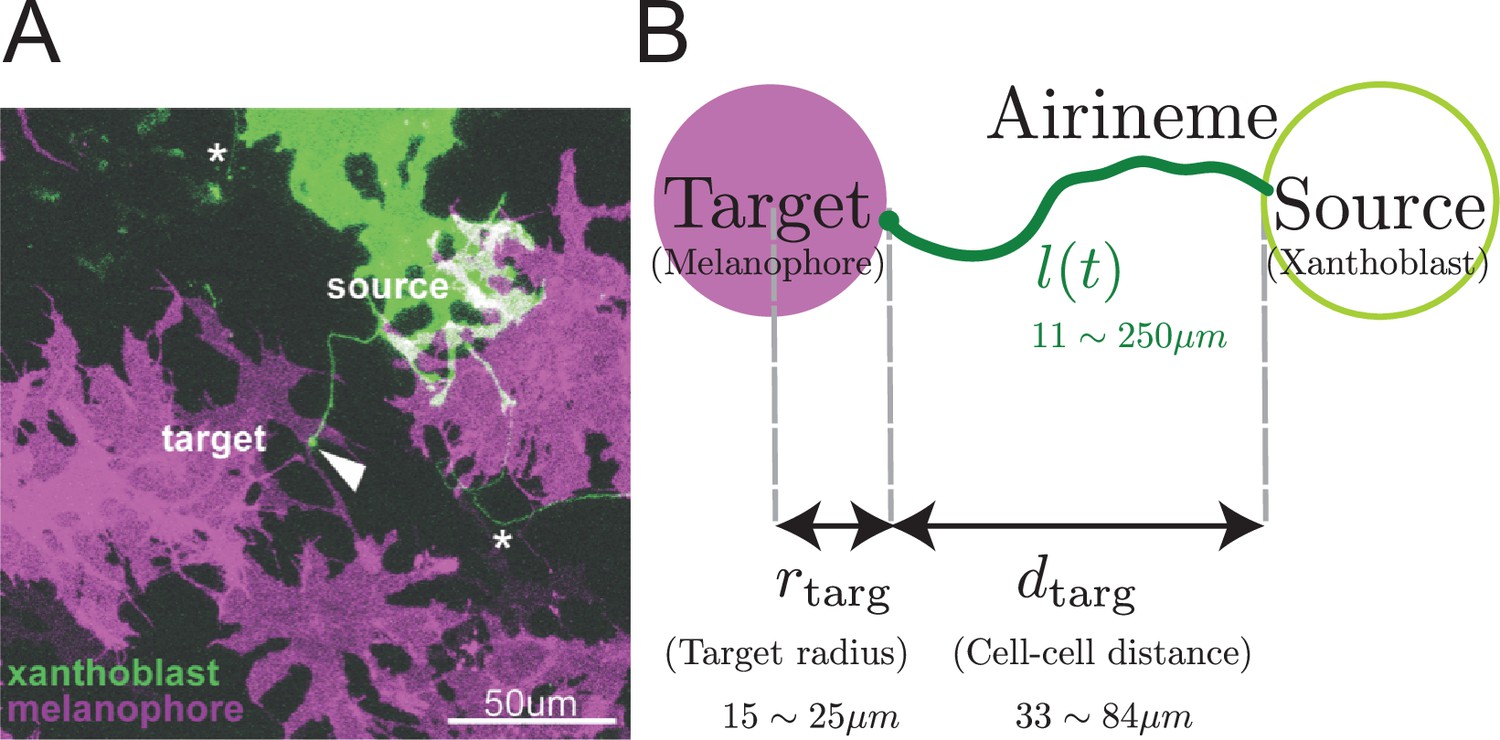
Airineme-mediated signaling between xanthoblast and target melanophore.
(A) Multiple airinemes extend from xanthoblast (undifferentiated yellow pigment cell, green). Airineme makes successful contact (arrowhead) with melanophore cell (pigment cell, purple). Asterisks indicate airinemes from other sources. Scale bar: 50 µm. (B) Model schematic. A single airineme extends from the source (right, green circle) and searches for the target cell (left, purple circle). Target cell has radius and has distance away from the origin. The airineme’s contour length at time is .
Figure 2 with 1 supplement
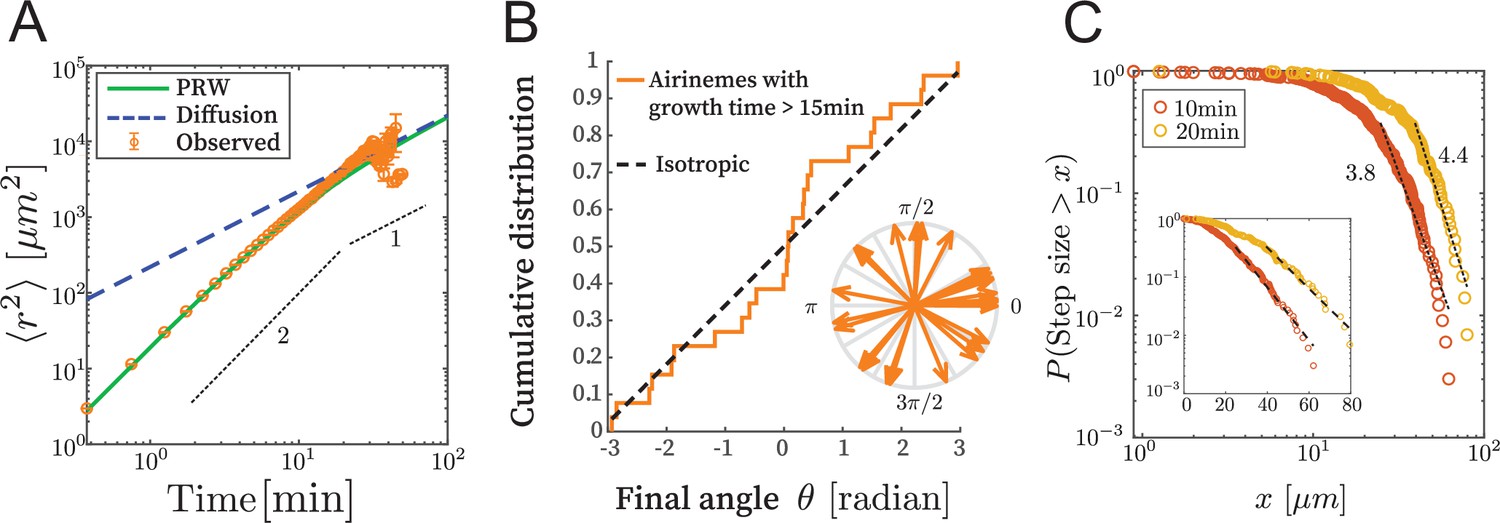
Airinemes are not consistent with simple random walk or Levy-type models.
(A) Mean squared displacement (MSD) of airinemes. Airineme experimental MSDs have exponent (corresponding to slope in log–log plot) up to min, arguing against a simple random walk model. airinemes. (B) For airinemes with growth periods longer than 15 min, the distribution of final angles, that is, the angle between the tangent vector at the airineme’s origin and the tangent vector at its tip. This is consistent with isotropy, that is, a uniform distribution in , shown as a dashed line (Kolmogorov–Smirnov test, , p-value 0.37). The results of this test are insensitive to the cutoff length (see Figure 2—source data 1). (C) Step length complementary cumulative distribution function (CCDF). Levy models in 2D are characterized by CCDF tails with an exponent between 1 and 3. However, for two different time sampling intervals (10 and 20 min, from airinemes), the tails of the distribution fit to an exponent greater than 3, and a continued downward curvature instead of a power-law, arguing against Levy models. Inset shows same data, same time sampling intervals, and same axes, but on semi-log plot.
-
Figure 2—source data 1
Final angles are isotropic.
- https://cdn.elifesciences.org/articles/75690/elife-75690-fig2-data1-v2.xlsx
Figure 2—figure supplement 1
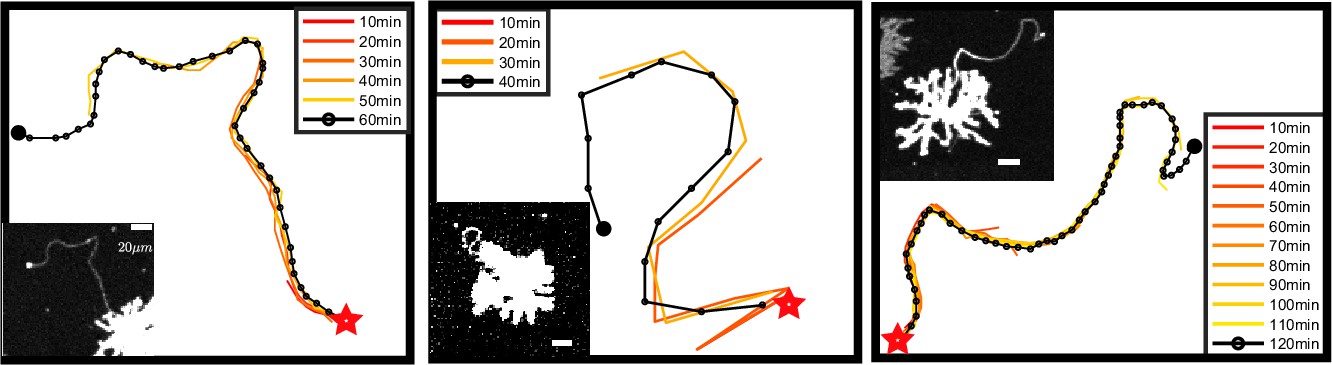
Time evolution and final state are self-consistent.
Each panel shows the examination of a single representative airineme as it emerges from the source cell at , large star. Every 10 min, the shape is tracked at discrete points as it grows away from the source cell. The micrograph of the final length is shown as an inset (only the channel labeling the source cell is shown, so the target cells are not visible). Scale bar is in 20 µm. We computed root mean squared curvature of both the time-series tip location and of just the final state for the airinemes shown here. These two methods yield a difference, on average, of 0.7%. Thus, we conclude that the shape of the part of the airineme already existing at time does not significantly change after time as the tip of the airineme continues to extend.
Figure 3 with 2 supplements
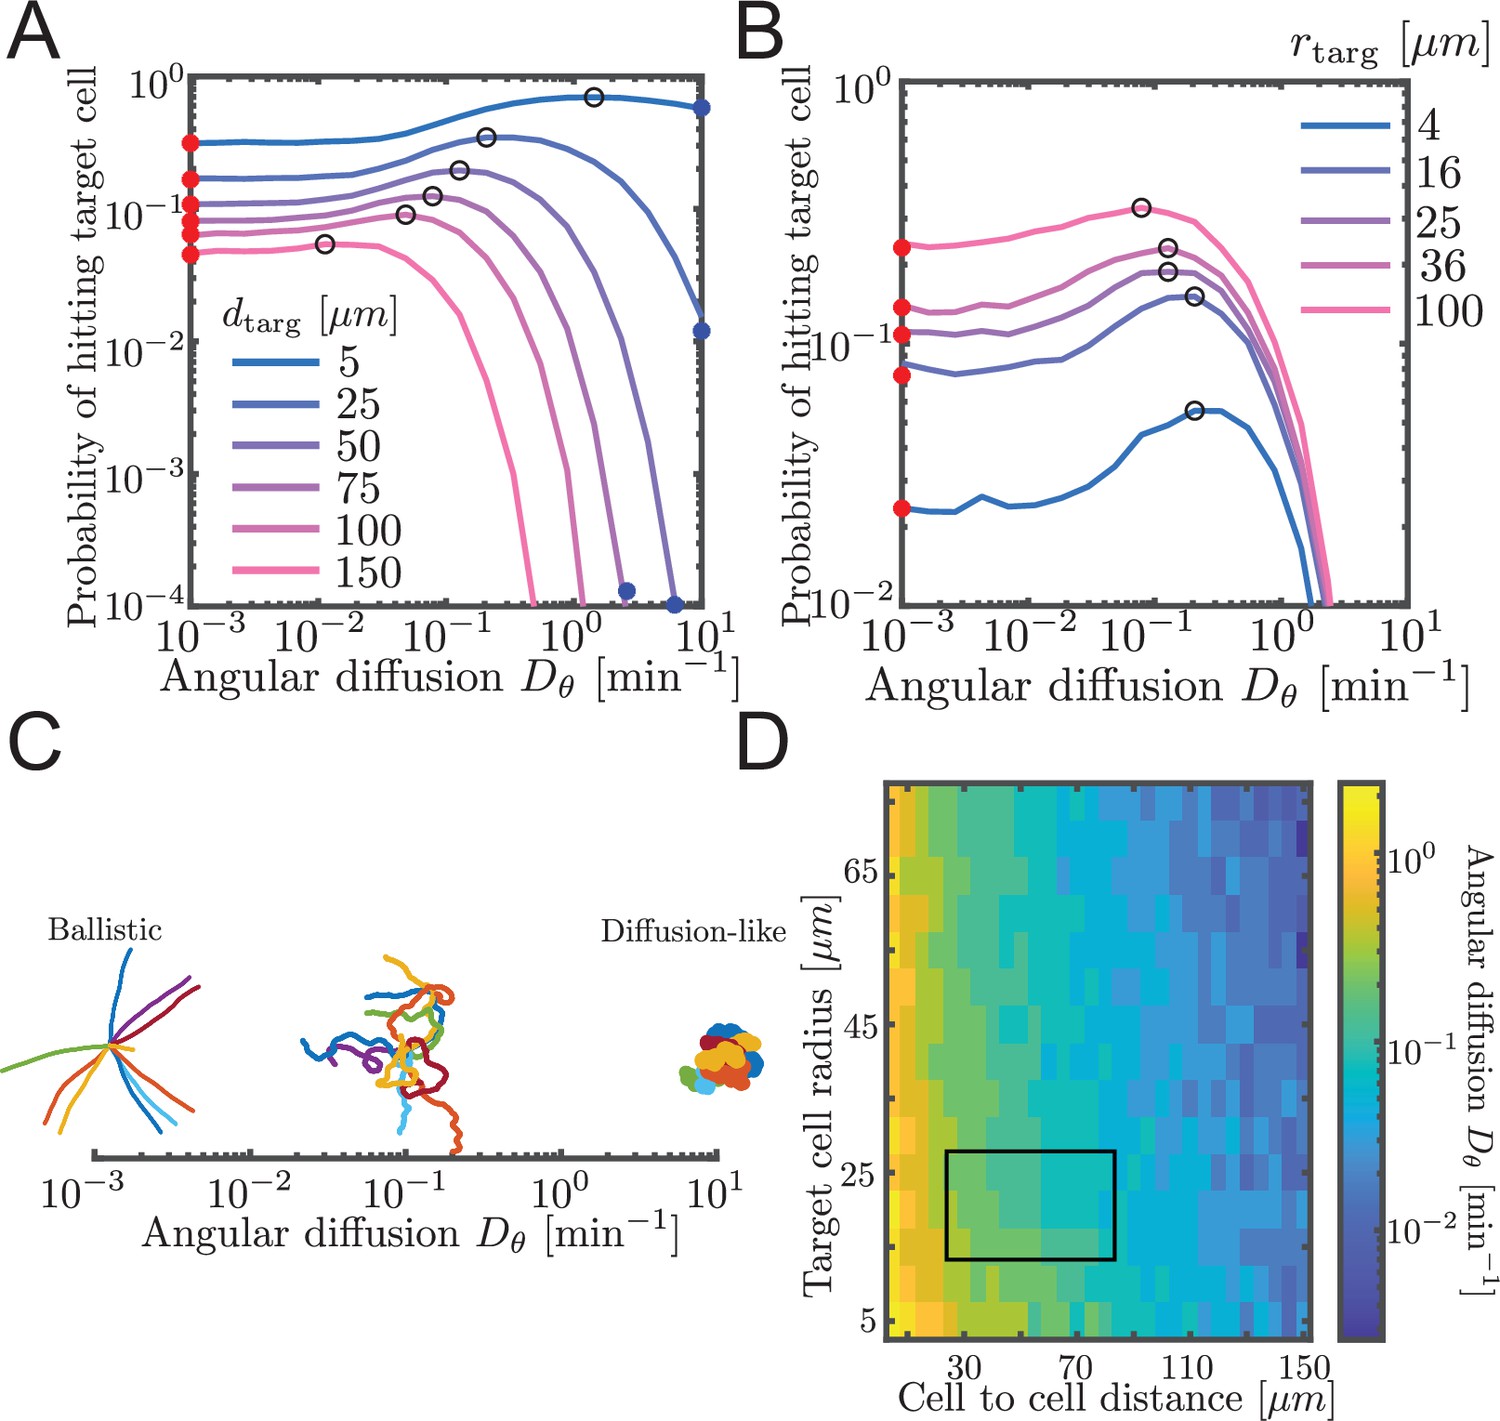
Probability to contact a target cell is maximized by a balance between ballistic search and diffusion-like search.
(A, B) Simulated airineme target search for various . The values of that leads to the highest search success probability are shown as black open circles. Theoretical values for ballistic limit from Equation 6 are shown as red circles. (A) Varying distances between the target and the source cell, while fixing the target cell radius at 25 µm. We validate simulation results with survival probability PDE at high from Equation 7, shown in blue circles. (B) Varying target cell radii while fixing the distance between the target and the source. For the biologically relevant parameter (), optimal angular diffusion is around . (C) Qualitative behavior of airineme target search depends on . (D) Optimal for a larger range of cell-to-cell distances and target cell radii. Rectangular region shows biologically relevant parameters.
Figure 3—figure supplement 1
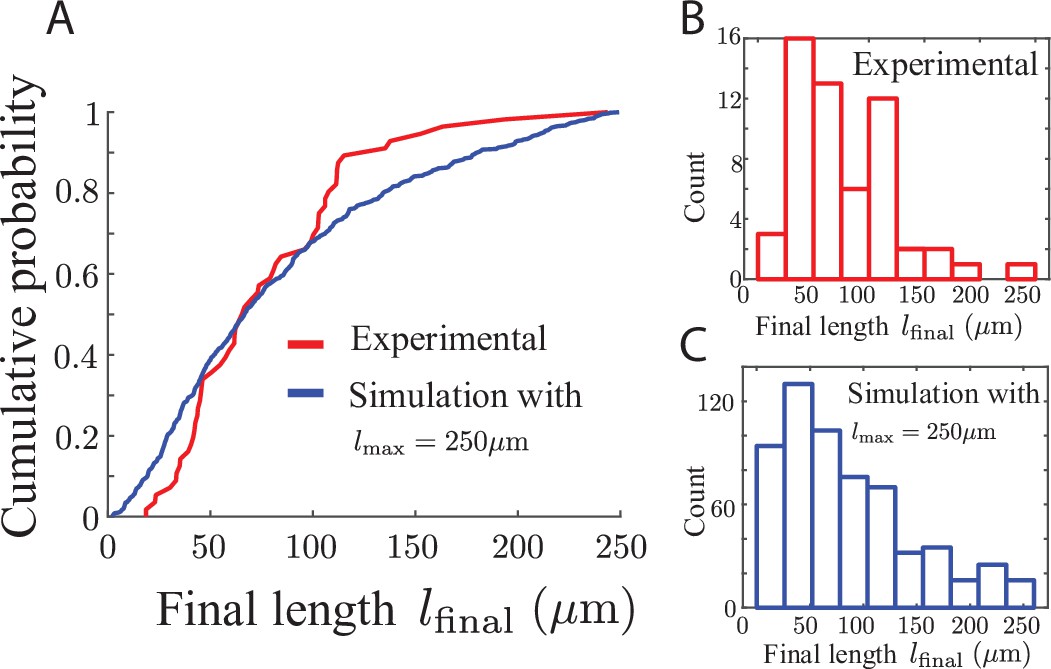
Final lengths of airinemes.
For the model parameter lmax, which is the length at which an airineme stops searching if it has not yet found a target, we wondered whether a single number would be appropriate or whether we needed to use a distribution to capture the variability of airineme lengths. We measure the experimental quantity lfinal, which is the length of airinemes when they stop growing, whether or not they have made contact with a target cell, shown in red in (A, B) ( airinemes). We run simulations in which target cells are randomly placed according to 2D Poisson statistics with mean distance and measured their length distribution when they stop growing lfinal, shown in blue in (A, C) (again, whether or not they have made contact with a target). We find that the distributions for experimental data and simulated data agree qualitatively when . Note that the variability in both experimental and simulated distributions is of similar magnitude, suggesting that the randomness in observed airineme length arises from the randomness in target cell placement.
Figure 3—figure supplement 2
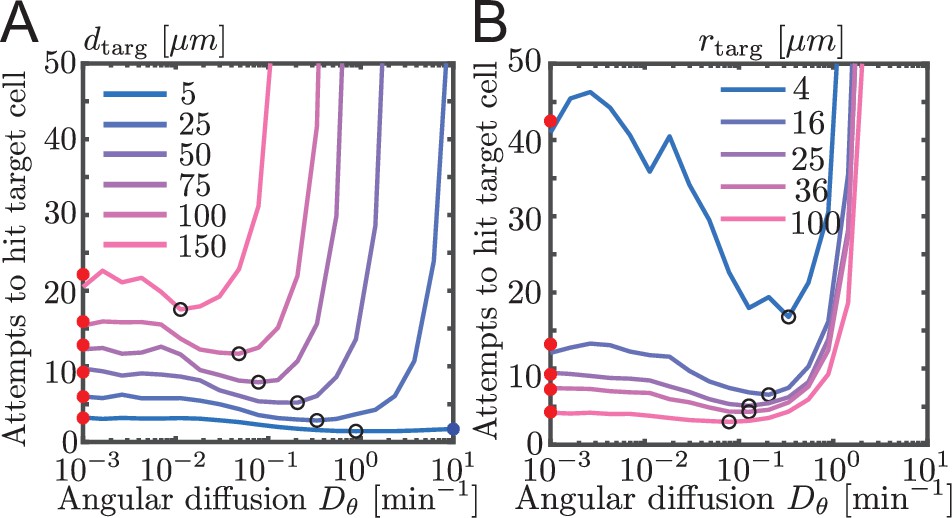
Simulated contact success shown as number of attempts instead of probability of contact.
Same as Figure 3A and B, but showing contact success as mean number of attempts ().
Figure 4 with 1 supplement
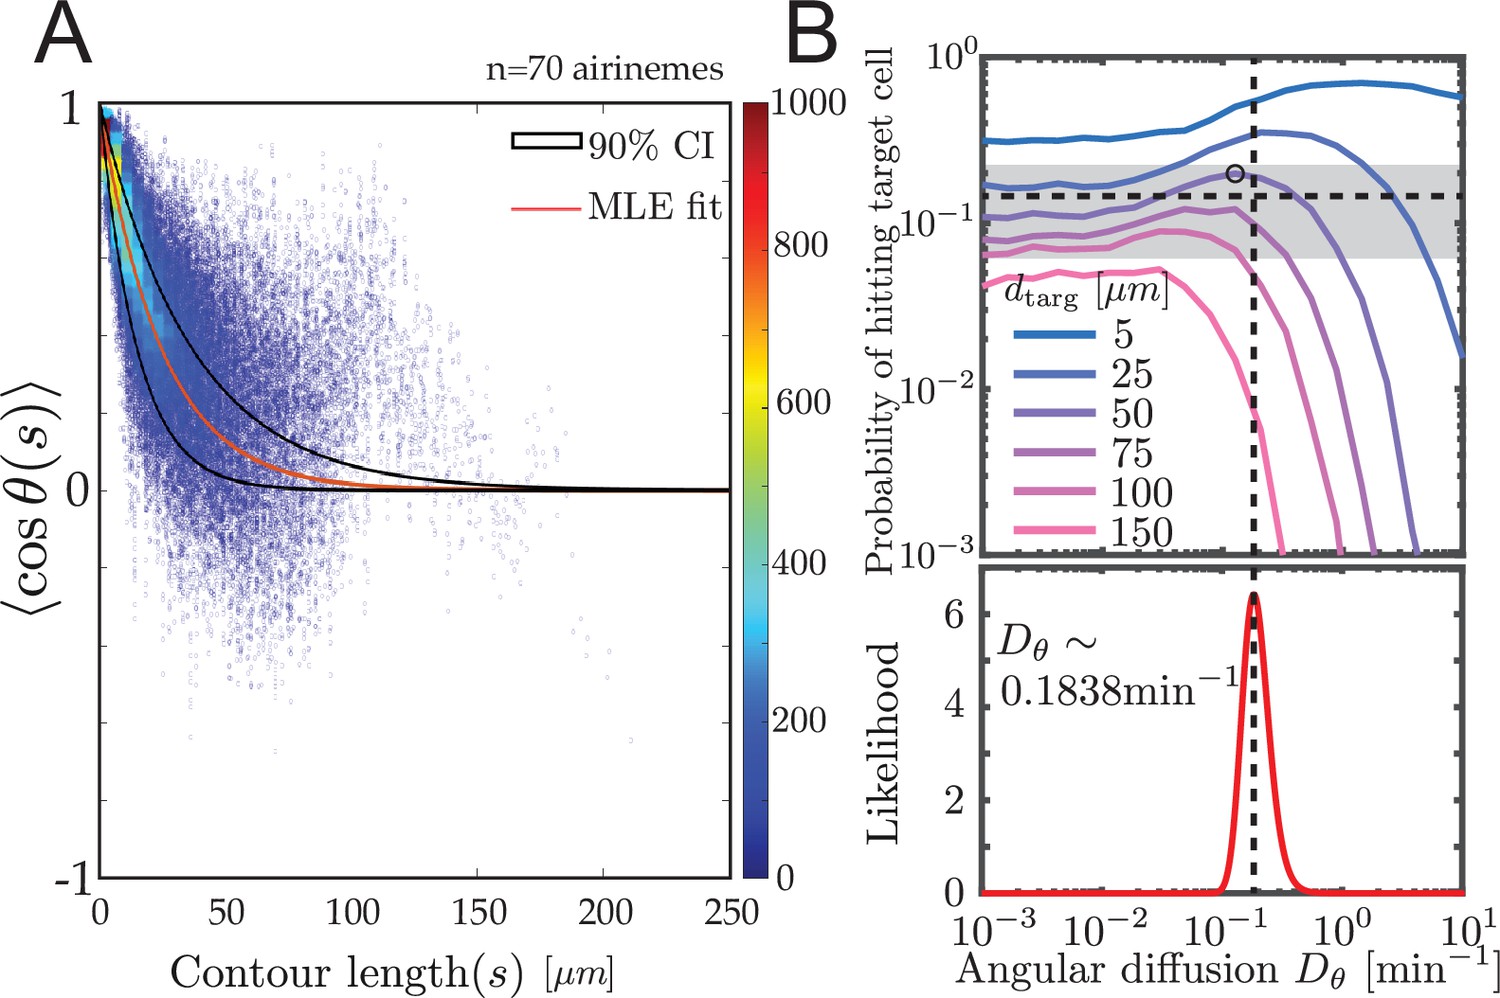
Experimental airineme curvature agrees with the optimal curvature.
(A) Orientation autocorrelation function. We measure tangent angles at 5596 points along 70 airinemes, and then compute the likelihood function (B, bottom) of fit to Equation 1. Best-fit curve is shown as red with a 90% confidence interval shown in black. Blue dots and heatmap were generated using a moving average with a window of 10 nearest data points and the heatscatter MATLAB function. (B) Bottom: we find that the best-fit airineme curvature from maximum likelihood estimation is . We find that this value is similar to the that optimizes contact probability for the biologically relevant target cell distance (top). The experimentally observed probability of contact per airineme, center estimate (horizontal dashed line), and 90% confidence interval (gray area) are also shown.
Figure 4—figure supplement 1
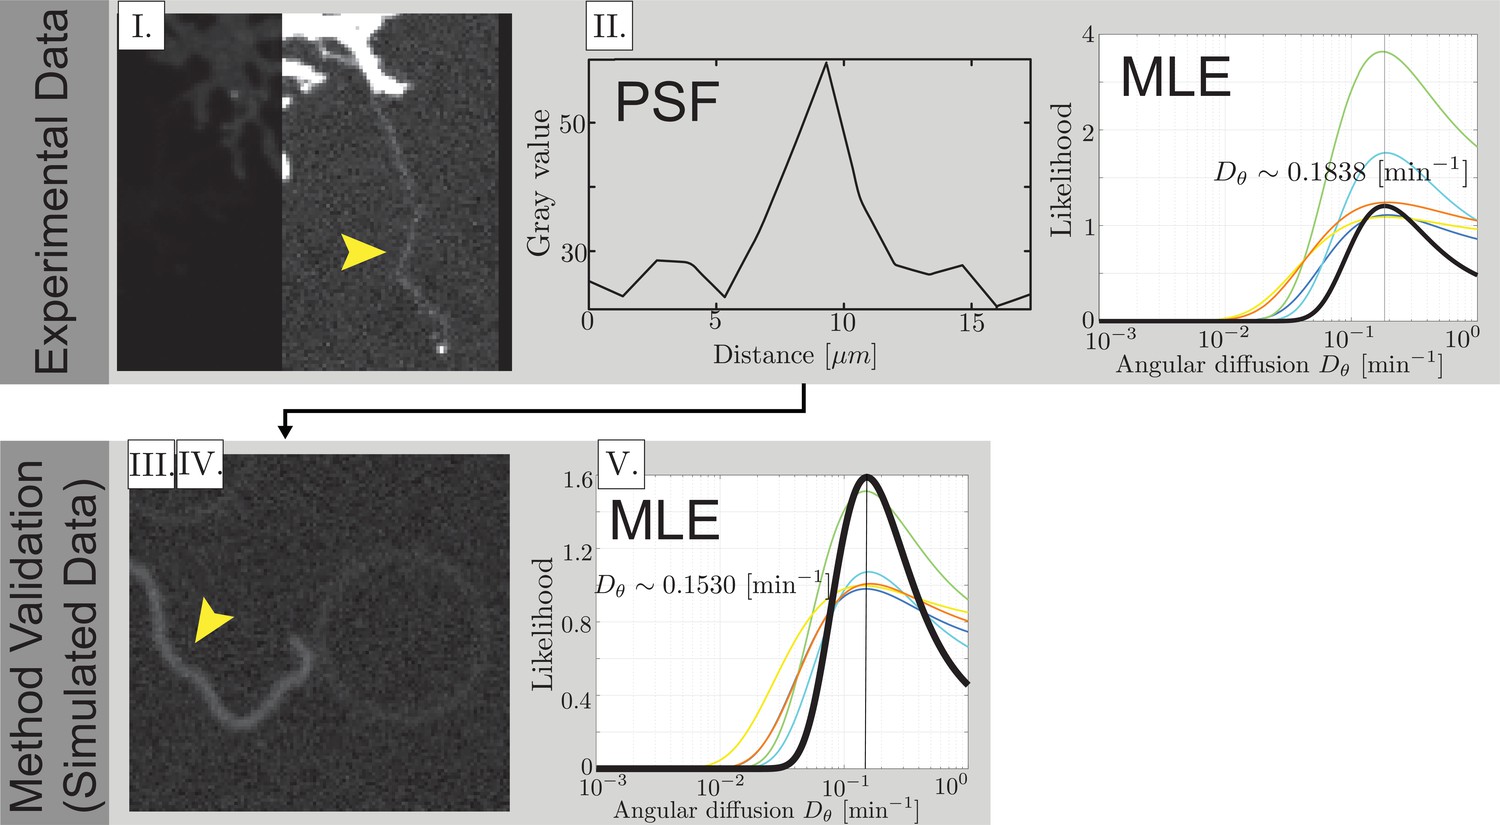
Experimental data analysis method validation and data collection.
(I) Fully extended airineme micrograph image. Arrow indicates the airineme. (II) Extraction of the average noise level from image. (III) Images of simulated airinemes are convoluted to have the same statistical noise properties of the experimental image. We use a ‘ground truth’ . (IV) In order to characterize technical variation in our analysis pipeline, five people used a manual image analysis pipeline to locate points along airinemes. From these points, curvatures and autocorrelation functions were computed, and likelihoods extracted. Curvature of simulated airineme images and likelihood distributions are shown as colored curves. Black curve shows the likelihood distribution for combined data. (V) The maximum likelihood value was close to the simulation input , with typically 2% error. The most erroneous (yellow curve) was 7% and corresponds to the manual entry of the corresponding author, JA. (Top right) Likelihoods of estimates from experimental images from five people (colored curves) and combined (black curve).
Figure 5 with 2 supplements
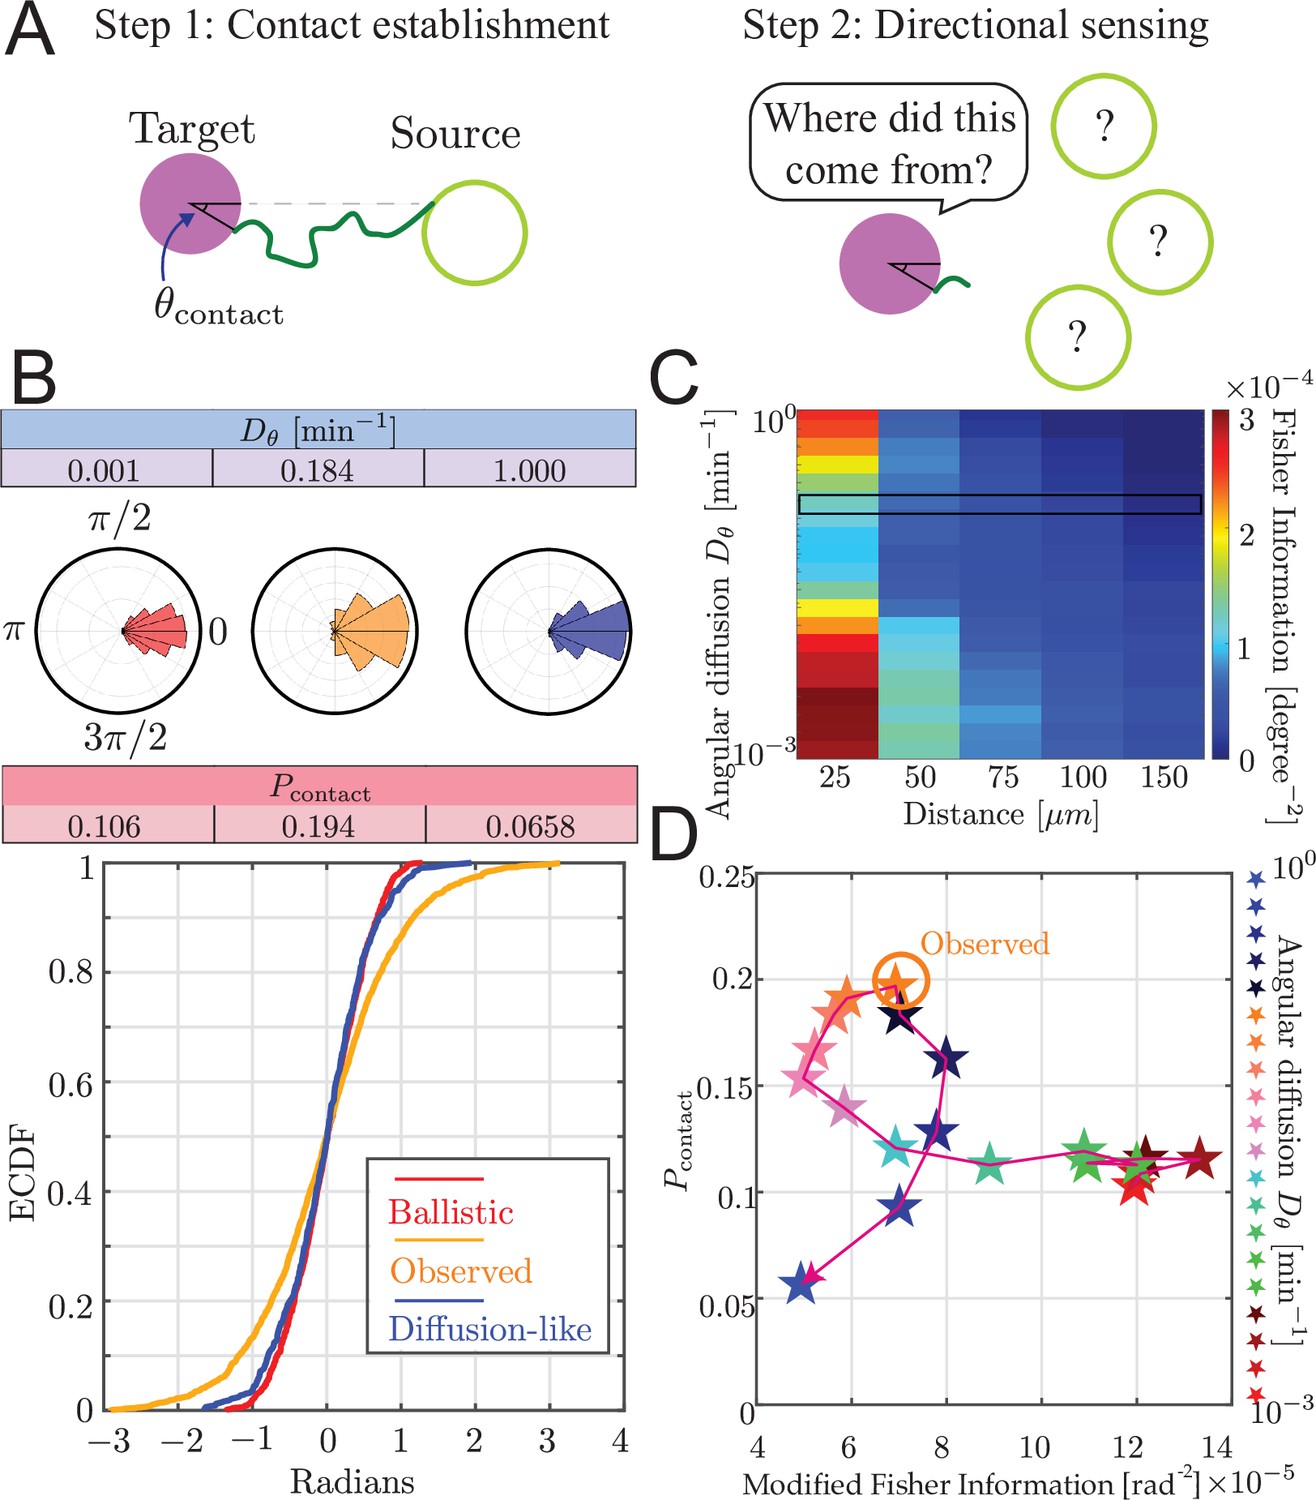
Trade-off between airineme directional sensing information and the probability of contacting the target cell.
(A) Given that the source cell is located at , the distribution of angles at which the airineme contacts the target cell. (B) Given a source cell is located at , the distribution of angles at which the airineme contacts the target cell. Angle distributions with higher variance indicate poorer directional sensing. Three angular diffusion values (near ballistic limit, experimentally observed, and near diffusion limit) are shown. (C) Directional sensing accuracy, quantified using the modified Fisher information (FI) Equation 9, for different source-to-target distances and different ranges of angular diffusion values are tested, while fixing target cell radius at 25 µm. Black rectangular region shows the FI values for the observed airineme curvature. (D) Relationship between the contact probability and FI for a range of (increasing with direction of arrow).
Figure 5—figure supplement 1
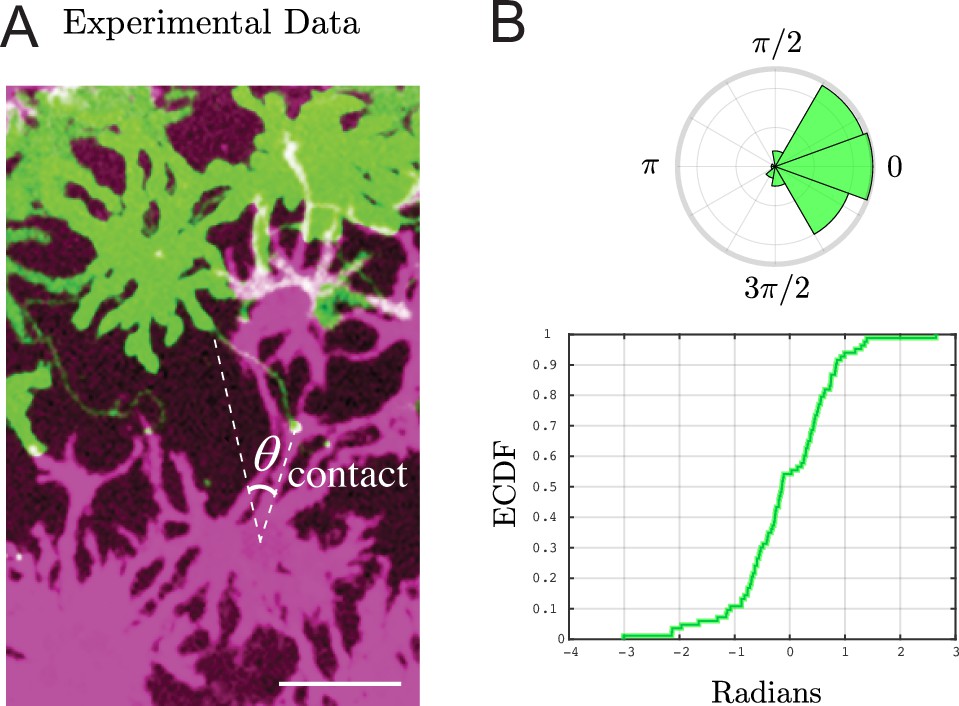
Experimental measurement of contact angle and directional information.
(A) Representative image of source cell (green), airineme (light green, touching two white lines), and target cell (purple). To estimate the contact angle distribution, we draw a line from the source of the airineme to the center of the nucleus of the target cell, then another line from here to the airineme contact point. Scale bar is 50 μm. (B) The angle distribution of contact angles shown in an angular histogram (top) and empirical cumulative distribution (bottom). From these, compute (unmodified) Fisher information (FI) of , and modified FI to be from Equation 9. Data from airinemes.
Figure 5—figure supplement 2
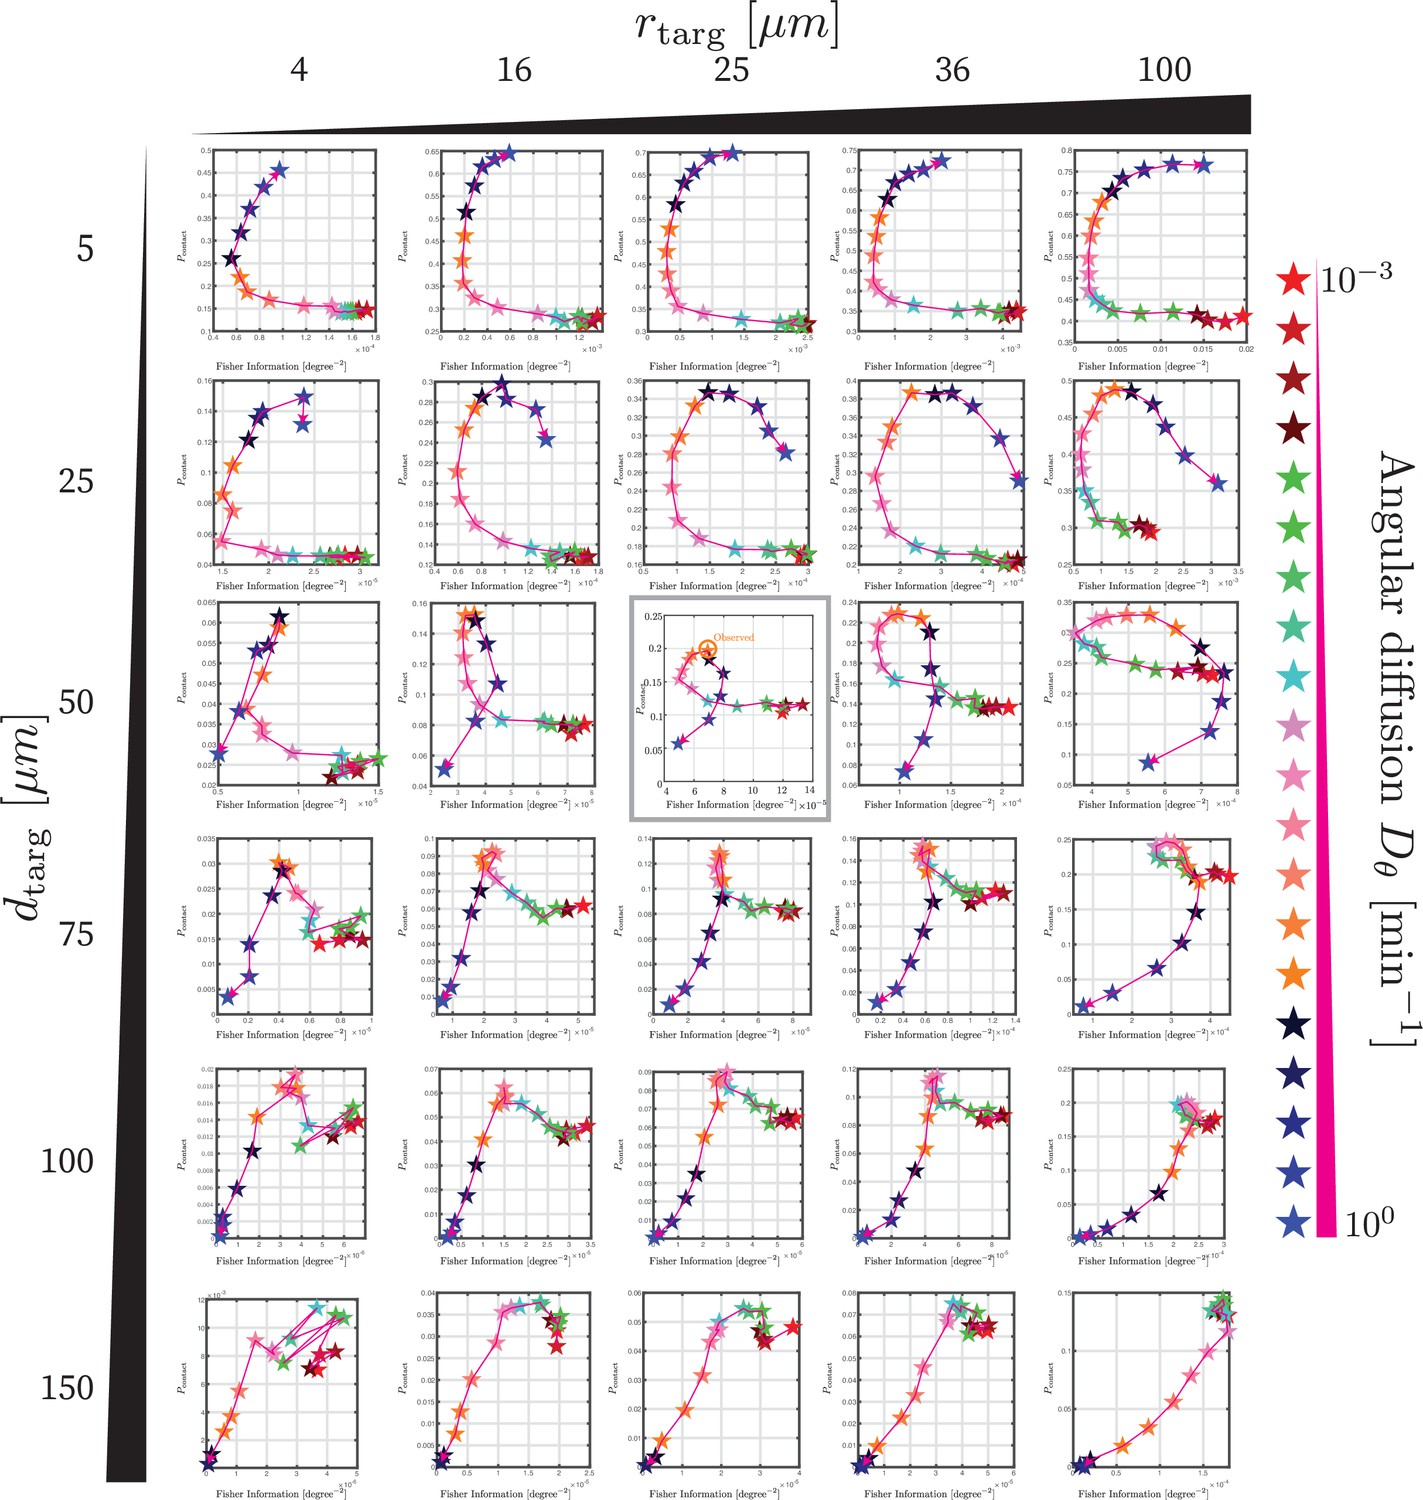
Trade-off between directional sensing and contact probability for range of parameters.
Each plot shows, identically to Figure 5D, the contact probability (vertical axis) versus the directional information (modified Fisher information defined in Equation 9) for a range of angular diffusion coefficients indicated by color along a parametric curve. The grid of plots shows this for a range of distances to the target dtarg and target sizes rtarg. Note that although we do not explicitly explore lmax, since these plots have not been nondimensionalized, the parametric curve for a different lmax can be obtained by rescaling the results shown.
Tables
Table 1
Parameter values.
| Symbol | Meaning | Estimate and value used | Source |
|---|---|---|---|
| lmax | Maximum length of airineme | 250 μm | Figure 3—figure supplement 1 |
| Velocity of airineme growth | 4.5 μm (1.4–12 μm, N = 929) | Eom et al., 2015 | |
| dtarg | Distance to target cell | 51 μm (33–84 μm, N = 70) | Eom et al., 2015 |
| rtarg | Target cell radius | 15–25 μm | Ryu et al., 2016 |
| Angular diffusion | Estimated here |
Key resources table
| Reagent type (species) or resource | Designation | Source or reference | Identifiers | Additional information |
|---|---|---|---|---|
| Genetic reagent (Danio rerio) | Tg(tyrp1b: PALM-mCherry) | Eom et al., 2015 | RRID:ZDB-TGCONSTRCT-141218-3 | |
| Recombinant DNA reagent | aox5: palmEGFP (plasmid) | Eom et al., 2015 | RRID:ZDB-TGCONSTRCT-160414-1 | |
| Software | ImageJ | http://imagej.nih.gov/ij/ | RRID:SCR_003070 | |
| Software | MATLAB R2021b | http://www.mathworks.com/ |
Additional files
Download links
A two-part list of links to download the article, or parts of the article, in various formats.
Downloads (link to download the article as PDF)
Open citations (links to open the citations from this article in various online reference manager services)
Cite this article (links to download the citations from this article in formats compatible with various reference manager tools)
Zebrafish airinemes optimize their shape between ballistic and diffusive search
eLife 11:e75690.
https://doi.org/10.7554/eLife.75690


