Shared mechanisms of auditory and non-auditory vocal learning in the songbird brain
- Neuroscience Graduate Program, Graduate Division of Biological and Biomedical Sciences, Laney Graduate School, Emory University, United States
- Department of Biology, Emory University, United States
- Center for Integrative Neuroscience, University of California, San Francisco, United States
- Howard Hughes Medical Institute, University of California, San Francisco, United States
Figures
Figure 1
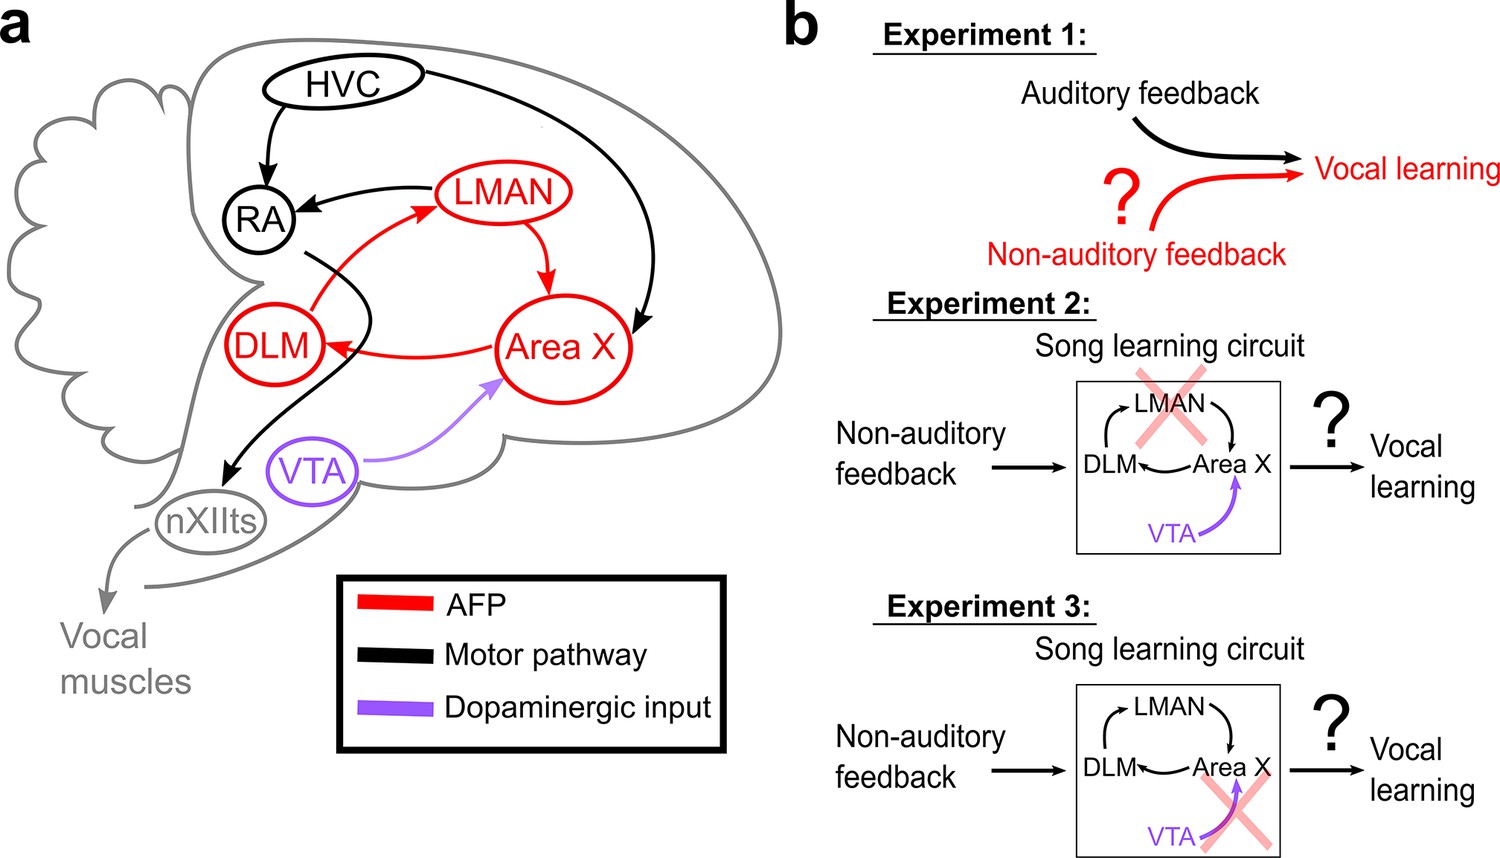
Schematic of songbird neural circuitry and hypotheses tested.
(a) Sagittal schematic view of songbird brain circuitry. Brain nuclei of the motor pathway – the neural circuit for vocal production – are black. Brain nuclei of the anterior forebrain pathway (AFP) – the neural circuit for vocal learning – are red. Ventral Tegmental Area (VTA, shown in purple) provides dopaminergic input into Area X, the basal ganglia nucleus of the AFP. (b) The three primary hypotheses tested in this article. In the first set of experiments, we tested whether non-auditory input can drive adaptive changes to adult song (Experiment 1). In the second set of experiments, we assessed the necessity of LMAN for non-auditory vocal learning (Experiment 2). In the third set of experiments, we tested the necessity of dopaminergic projections to Area X for non-auditory vocal learning (Experiment 3).
Figure 2 with 7 supplements

Non-auditory feedback drives vocal learning.
(a) Timeline of vocal learning experiments in this example bird. The order of the auditory vs. non-auditory experiments was randomized across birds. (b) Top: spectrograms and song syllables (labeled b–f) including target syllable (‘d’). Bottom: baseline pitch distribution and pitch threshold. Cutaneous stimulation was provided during renditions of the target syllable above a chosen pitch threshold (‘hit’). (c) Each dot represents the pitch of one rendition of the target syllable. Renditions in the ‘hit’ range rapidly triggered a cutaneous stimulation (within 40 ms of syllable onset). During washout, cutaneous stimulation was discontinued. (d) Cumulative distribution function (CDF) plot showing the probability a value of pitch from a distribution falls at or below the value on the x-axis. The pitch distribution at the end of cutaneous stimulation training was significantly greater than baseline (two-sample Kolmogorov–Smirnov test, p=1.178e-12). End of washout distribution was not significantly different from baseline (two-sample Kolmogorov–Smirnov test, p=0.606). Panels (b–d) show data from the same experiment. (e) Adaptive pitch change (in semitones) of the target syllables during cutaneous stimulation training, grouped across 13 experiments. The mean change during training was significantly greater than baseline (the probability of resampled mean pitch on all three training days 2 and 3 lesser than or equal to zero was Pboot < 0.0010, indicated by filled circles). (f) Learning magnitudes (adaptive pitch change by end of training) in individual birds that underwent both white noise and cutaneous stimulation training (n = 14). Open squares indicate birds that did not undergo craniotomies for sham LMAN lesions and received cutaneous stimulation on their neck, open circles indicate birds that did not undergo craniotomies for sham LMAN lesions and received cutaneous stimulation on their scalp, and closed circles indicate birds that underwent LMAN sham operations and received cutaneous stimulation on their scalp. No significant difference in learning magnitudes during cutaneous stimulation training vs. during white noise training (paired t-test, p=0.313).
-
Figure 2—source data 1
Source data for analyses in Figure 2.
- https://cdn.elifesciences.org/articles/75691/elife-75691-fig2-data1-v2.zip
-
Figure 2—source data 2
Source data for analyses in Figure 2—figure supplement 5 and Figure 2—figure supplement 6.
- https://cdn.elifesciences.org/articles/75691/elife-75691-fig2-data2-v2.zip
-
Figure 2—source data 3
Source data for analyses in Figure 2—figure supplement 7.
- https://cdn.elifesciences.org/articles/75691/elife-75691-fig2-data3-v2.zip
-
Figure 2—source code 1
Source code for use with Figure 2—source data 1 for analyses in Figure 2B-D.
- https://cdn.elifesciences.org/articles/75691/elife-75691-fig2-code1-v2.zip
-
Figure 2—source code 2
Source code for use with Figure 2—source data 1 for analyses in Figure 2E.
- https://cdn.elifesciences.org/articles/75691/elife-75691-fig2-code2-v2.zip
-
Figure 2—source code 3
Source code for use with Figure 2—source data 2 for analyses in Figure 2—figure supplement 5 and Figure 2—figure supplement 6.
- https://cdn.elifesciences.org/articles/75691/elife-75691-fig2-code3-v2.zip
-
Figure 2—source code 4
Source code for use with Figure 2—source data 3 for analyses in Figure 2—figure supplement 7.
- https://cdn.elifesciences.org/articles/75691/elife-75691-fig2-code4-v2.zip
Figure 2—figure supplement 1
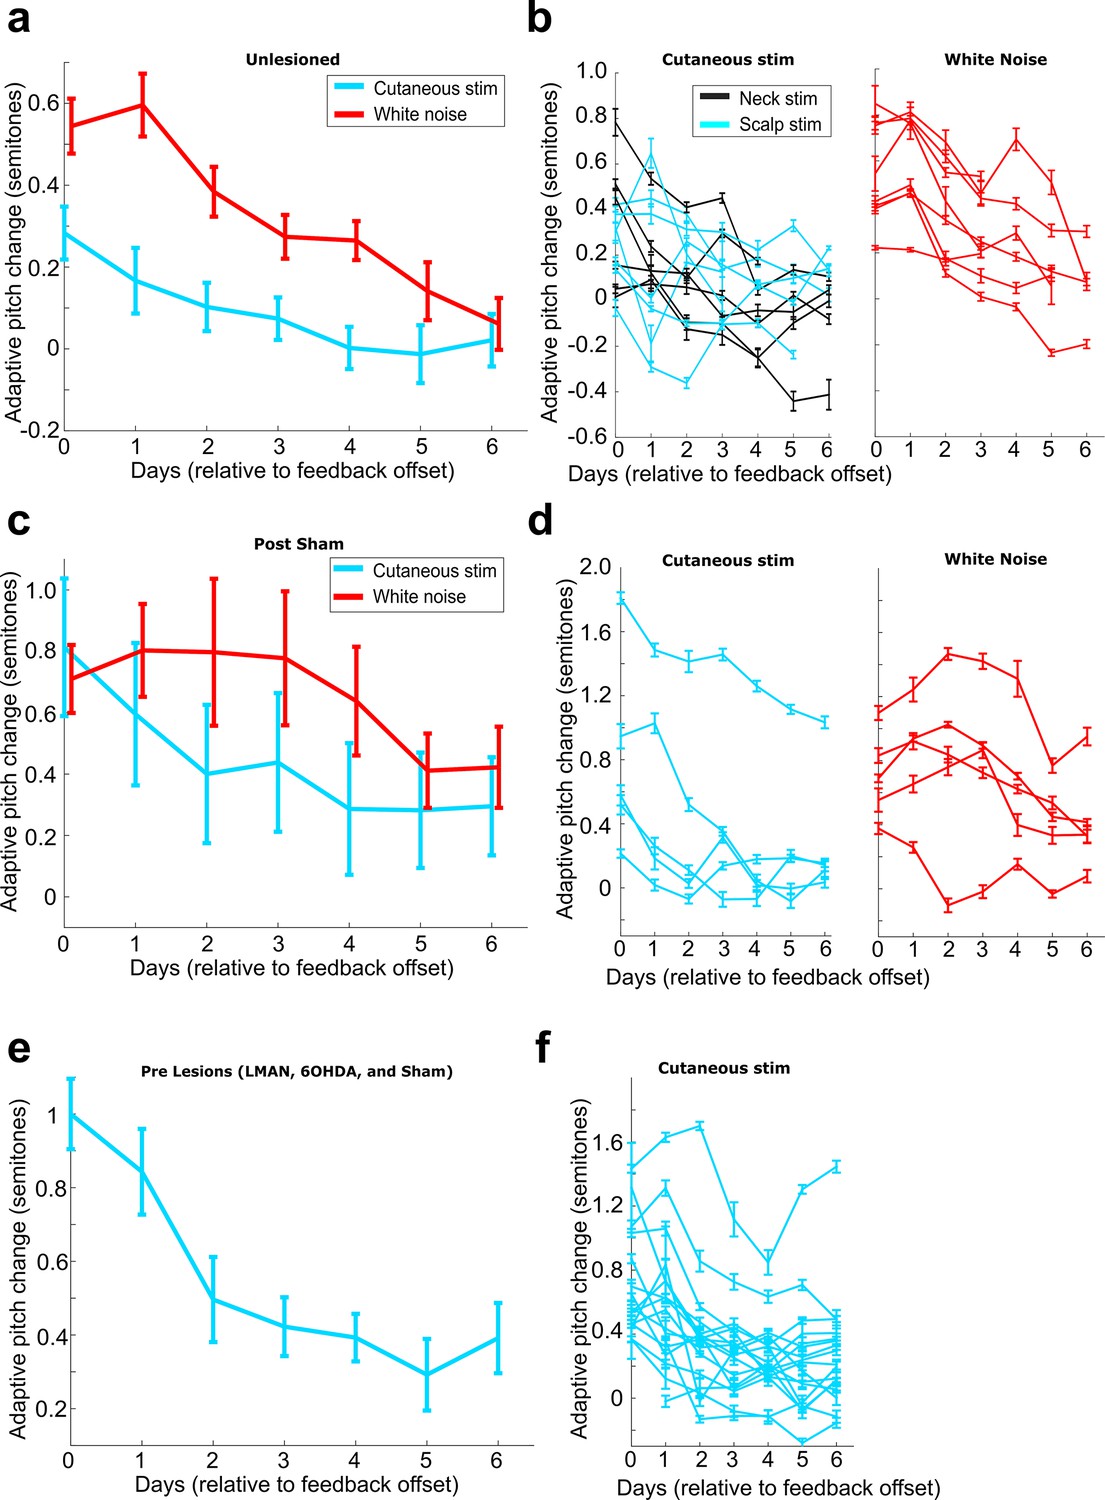
Rates of washout across different experimental conditions.
(a) Adaptive pitch change (measured relative to baseline) during washout from the group of birds that received no craniotomies for LMAN, 6-OHDA, or sham lesions (n = 13 experiments). Adaptive pitch change did not significantly differ between white noise and cutaneous stimulation training experiments on any of the days of washout (0.498 < Pboot < 0.535 on each day of washout, where 0.025 < Pboot < 0.975 indicates no significant difference between means). (b) The same washout data from (a), except each trace is the data from an individual experiment. (c) Adaptive pitch change (measured relative to baseline) during washout from the sham-lesioned dataset (n = 5 experiments). Adaptive pitch change did not significantly differ between white noise and cutaneous stimulation training experiments on any of the days of washout (0.370 < Pboot < 0.900). (d) The same washout data from (c), except each trace is the data from an individual experiment. (e) Adaptive pitch change (measured relative to baseline) during washout from all prelesion experiments in birds that later received craniotomies for LMAN, 6-OHDA, or sham lesions, n = 16. (f) The same washout data from (e), except each trace is the data from an individual experiment.
Figure 2—figure supplement 2
Amount of pitch change on each day of cutaneous stimulation training for each individual experiment.
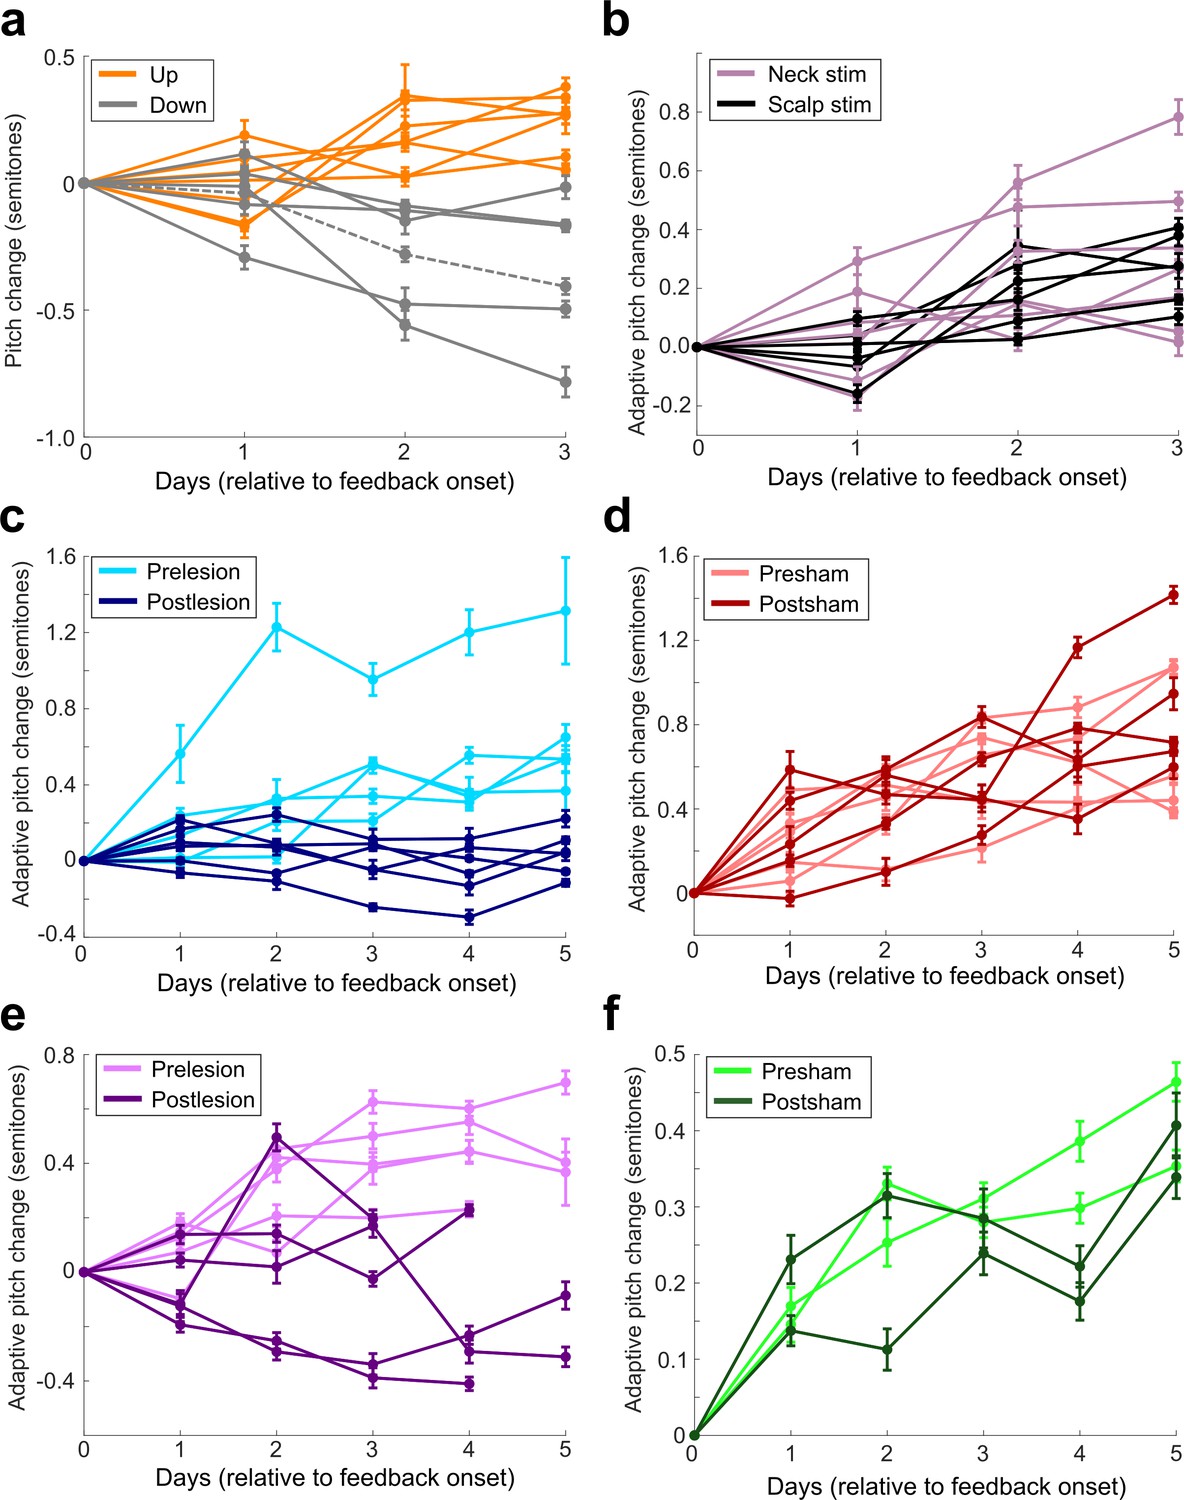
(a) All experiments performed in birds that did not undergo any craniotomies for LMAN, 6-OHDA, or sham lesions. Orange are experiments where upward pitch change resulted in less frequent triggering of cutaneous stimulations. Gray are experiments where downward pitch change resulted in less frequent triggering of cutaneous stimulations. Dashed gray line indicates the experiment chosen as the example shown in Figure 2. (b) All experiments performed in birds that did not undergo any craniotomies for LMAN, 6-OHDA, or sham lesions. Purple shows birds where stimulating electrodes were placed on their neck, and black shows birds where stimulating electrodes were placed on the birds’ scalps. Approximate location of the scalp electrodes relative to Y0 was 4.47 ML, 6.3 AP. There was no significant difference in magnitude of learning between scalp-implanted and neck-implanted birds (0.679 < Pboot < 0.891). (c) Results from all experiments performed in birds that underwent LMAN lesions. (d) Results from all experiments performed in birds that underwent LMAN sham operations. (e) Results from all experiments performed in birds that underwent 6-OHDA lesions. The final day of training had fewer data points because multiple experiments had to be stopped early due to pandemic-related disruptions. (f) Results from all experiments performed in birds that underwent 6-OHDA sham operations.
Figure 2—figure supplement 3
LMAN lesions and 6-OHDA injections in Area X impair auditory-driven vocal learning.
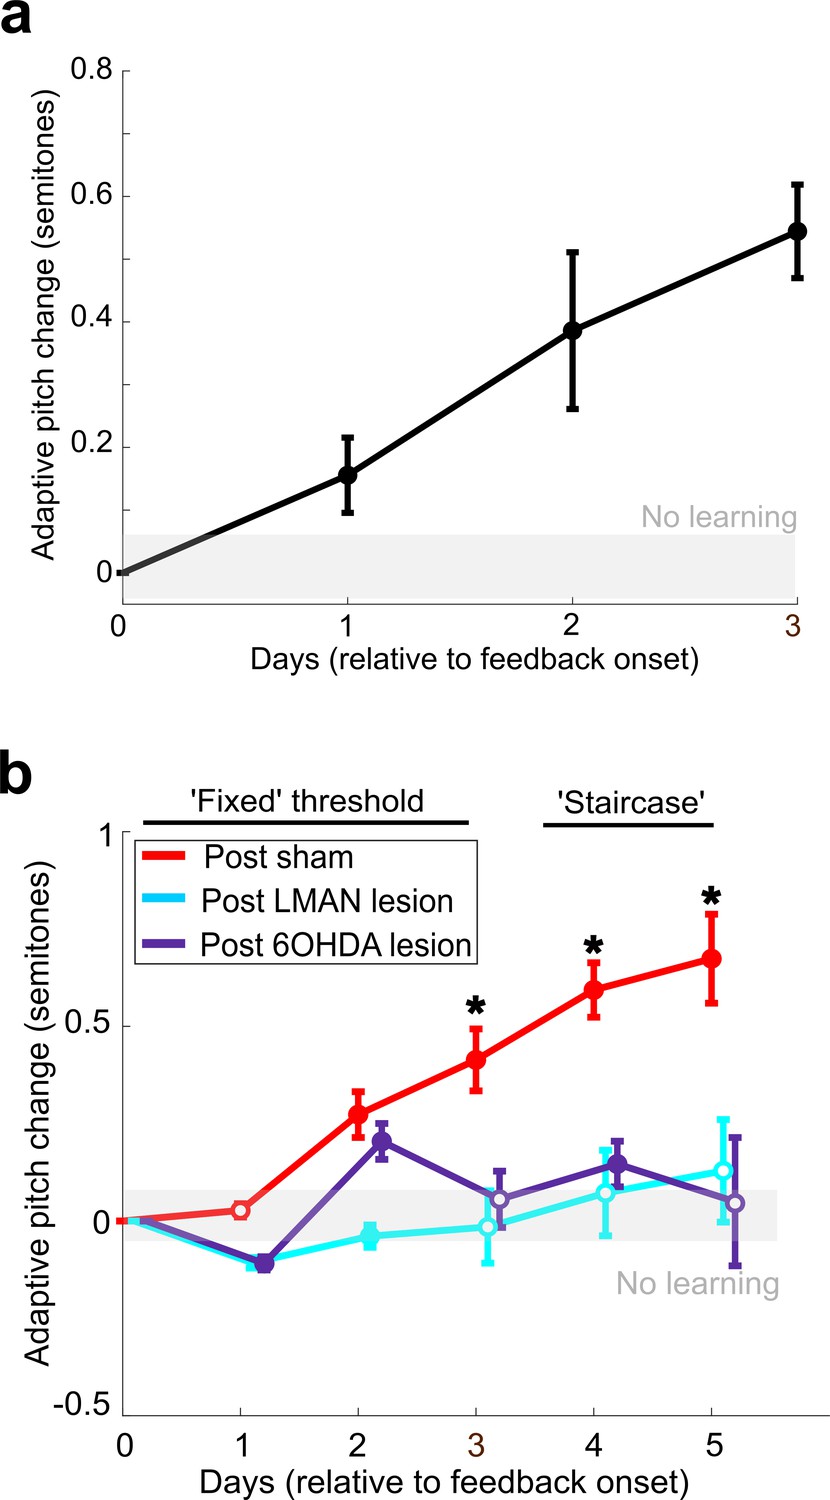
(a) Adaptive change in target syllable pitch (in semitones) during 3 days of white noise training in eight birds that did not undergo any lesions or sham operations. The probability of resampled mean pitch on each day of training lesser than or equal to zero was Pboot < 0.0010. (b) Learning magnitudes (adaptive change in target syllable pitch in semitones) during 5 days of white noise training in birds that underwent sham operations, LMAN lesions, and 6-OHDA lesions. Only postsham learning magnitude was consistently significantly greater than baseline (the probability of resampled mean pitch on each of the final 4 days of training lesser than or equal to zero was Pboot < 0.0010). Post-LMAN lesion learning magnitudes and post-6-OHDA learning magnitudes were both significantly less than postsham (the probability of resampled mean pitch of post-LMAN lesion data on the final 3 days of training lesser than or equal to resampled mean pitch of postsham data was Pboot < 0.0010 for comparison of sham to LMAN-lesioned and sham to 6-OHDA lesion).
Figure 2—figure supplement 4

Analysis of acute effects of cutaneous stimulation on target syllable pitch.
(a) Left: for each experiment throughout all datasets described in this article, we calculated the pitch of every catch trial that occurred during each day of cutaneous stimulation training, normalized to the mean pitch of all trials that triggered cutaneous stimulations. We excluded all experiments with less than 10 catch trials. Error bars are SEM. No individual experiment differed significantly from 1 (t-test, 0.071 < p < 0.997). Right: same as in (left), but we analyzed randomly selected trials from a baseline recording day for each experiment. For each experiment, we randomly selected the same number of trials that were used for the catch vs. stim analysis. There was no significant difference between this dataset and the normalized catch trials (paired t-test, p=0.557). (b) Same as in (a), but we analyzed the duration of the target syllable instead of pitch. 13/19 individual experiments did not differ significantly from 1 (t-test, 0.149 < p < 0.935). There was no significant difference between the randomly selected dataset (right) and the normalized catch trials (left) (paired t-test, p=0.140). (c) Same as in (a), but we analyzed the sound amplitude of the target syllable instead of pitch. No individual experiment differed significantly from 1 (t-test, 0.116 < p < 0.959). There was no significant difference between the randomly selected dataset (right) and the normalized catch trials (left) (paired t-test, p=0.242). (d) Same as in (a), but we analyzed the spectral entropy of the target syllable instead of pitch. No individual experiment differed significantly from 1 (t-test, 0.052 < p < 0.998). There was no significant difference between the randomly selected dataset (right) and the normalized catch trials (left) (paired t-test, p=0.138).
Figure 2—figure supplement 5
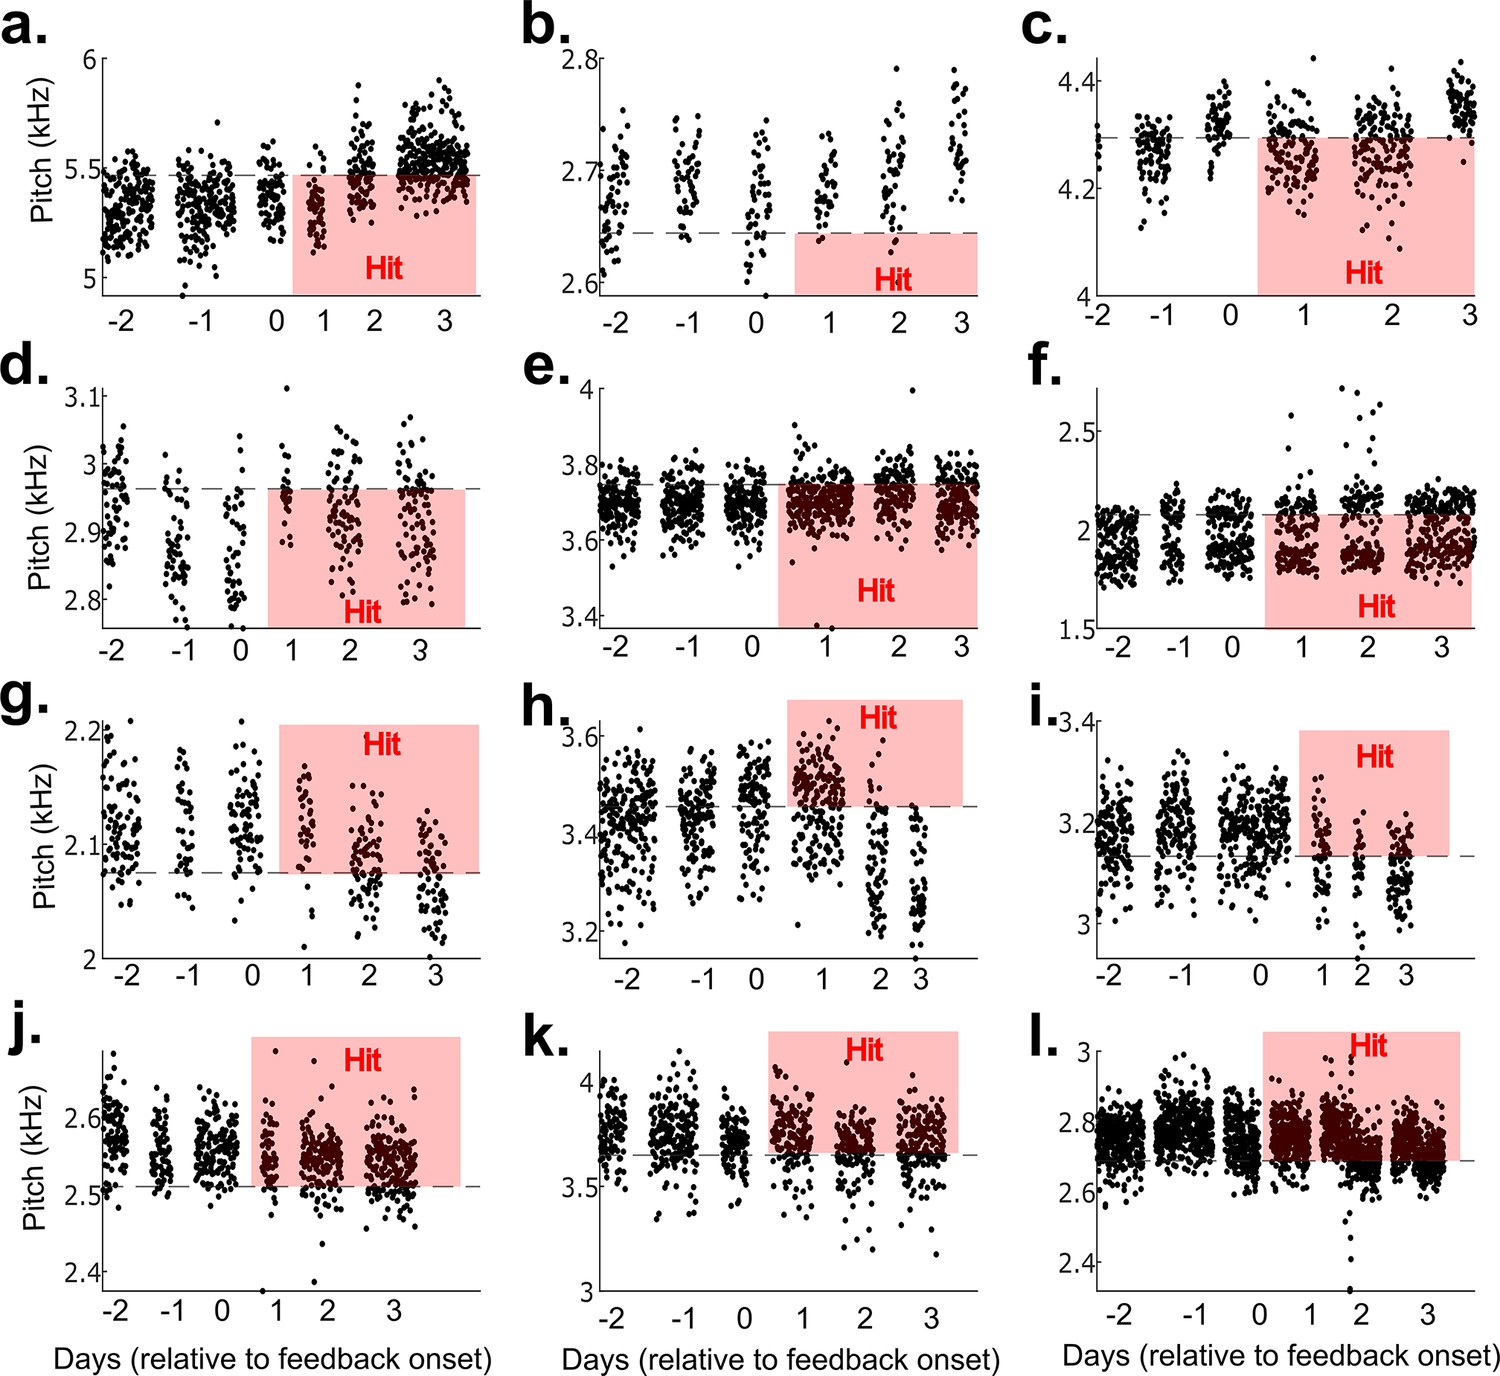
Results from 12 example non-auditory vocal learning experiments.
(a–l) Data from 12 example experiments from each bird that did not undergo brain operations. Each dot represents the pitch of one rendition of the target syllable. Renditions in the ‘hit’ range rapidly triggered a cutaneous stimulation (within 40 ms of syllable onset).
Figure 2—figure supplement 6
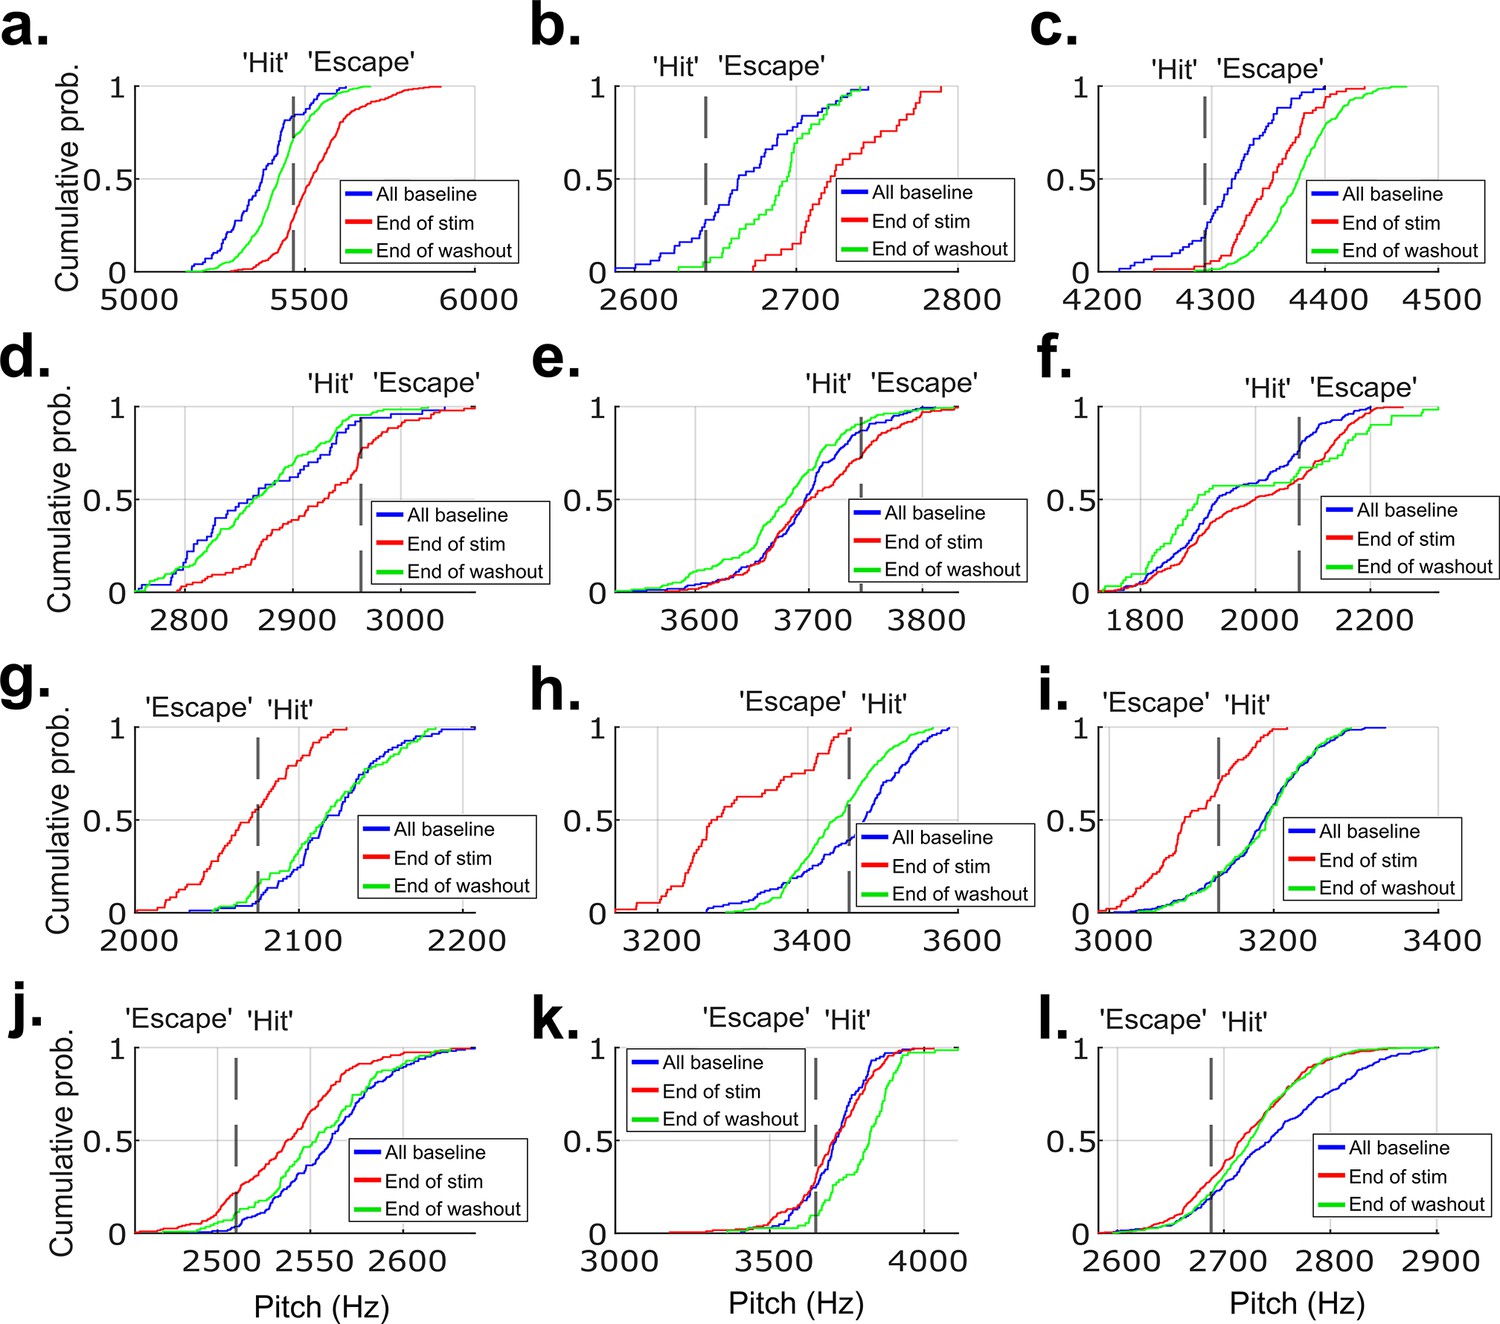
CDF plots showing the probability a value of pitch from a distribution falls at or below the value on the x-axis for 12 example experiments from each of the birds that did not undergo brain operations.
These are the same example experiments from Figure 2—figure supplement 5, in the same order. (a–l) show data from these example experiments. The pitch distribution on the final day of cutaneous stimulation training significantly differed from the distribution of all baseline pitches in 11 out of the 12 experiments (p<0.05, two-sample Kolmogorov–Smirnov test).
Figure 2—figure supplement 7
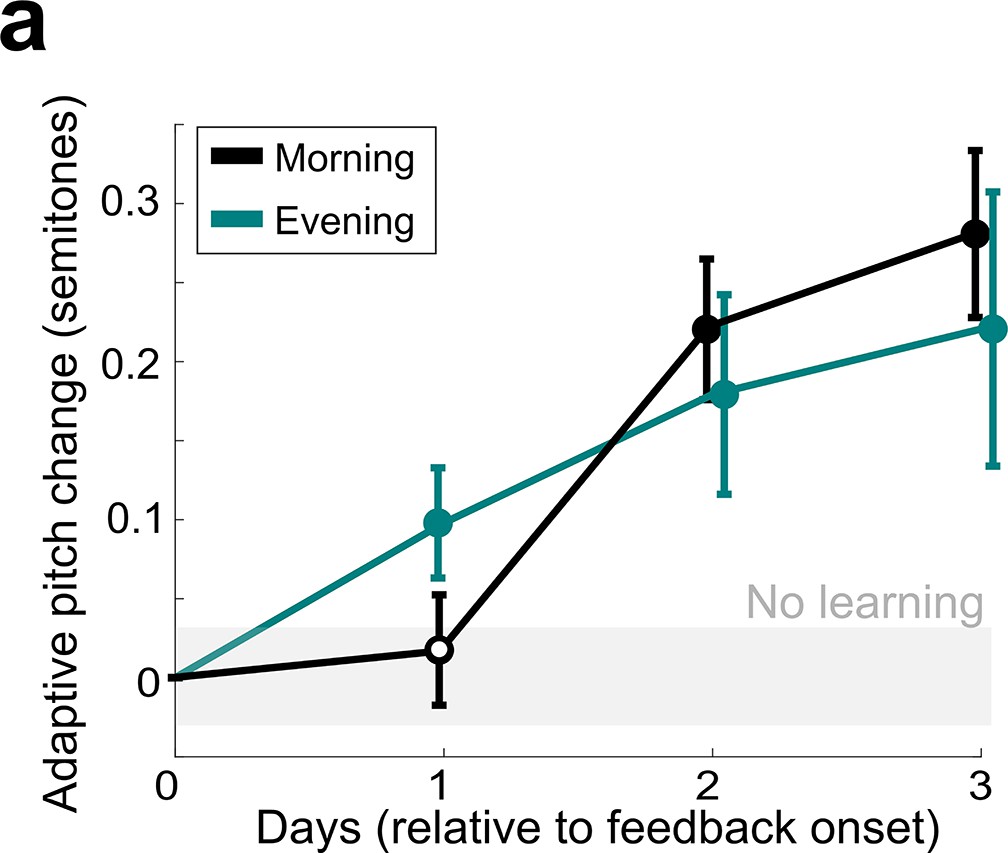
Comparison of non-auditory vocal learning when measured in the morning and in the evening.
(a) Adaptive pitch change (in semitones) of the target syllables during cutaneous stimulation training, grouped across 13 experiments in birds that did not undergo craniotomies for LMAN, 6-OHDA, or sham lesions, measured by analyzing songs produced in the morning (black) or songs produced in the evening (green). The mean change during training was significantly greater than baseline for both morning and evening song analysis (in both cases, the probability of resampled mean pitch on all three training days 2 and 3 lesser than or equal to zero was Pboot < 0.0010, indicated by filled circles). Learning magnitudes between morning and evening songs did not significantly differ (0.1668 < Pboot < 0.9512 on all days of training).
Figure 3 with 2 supplements
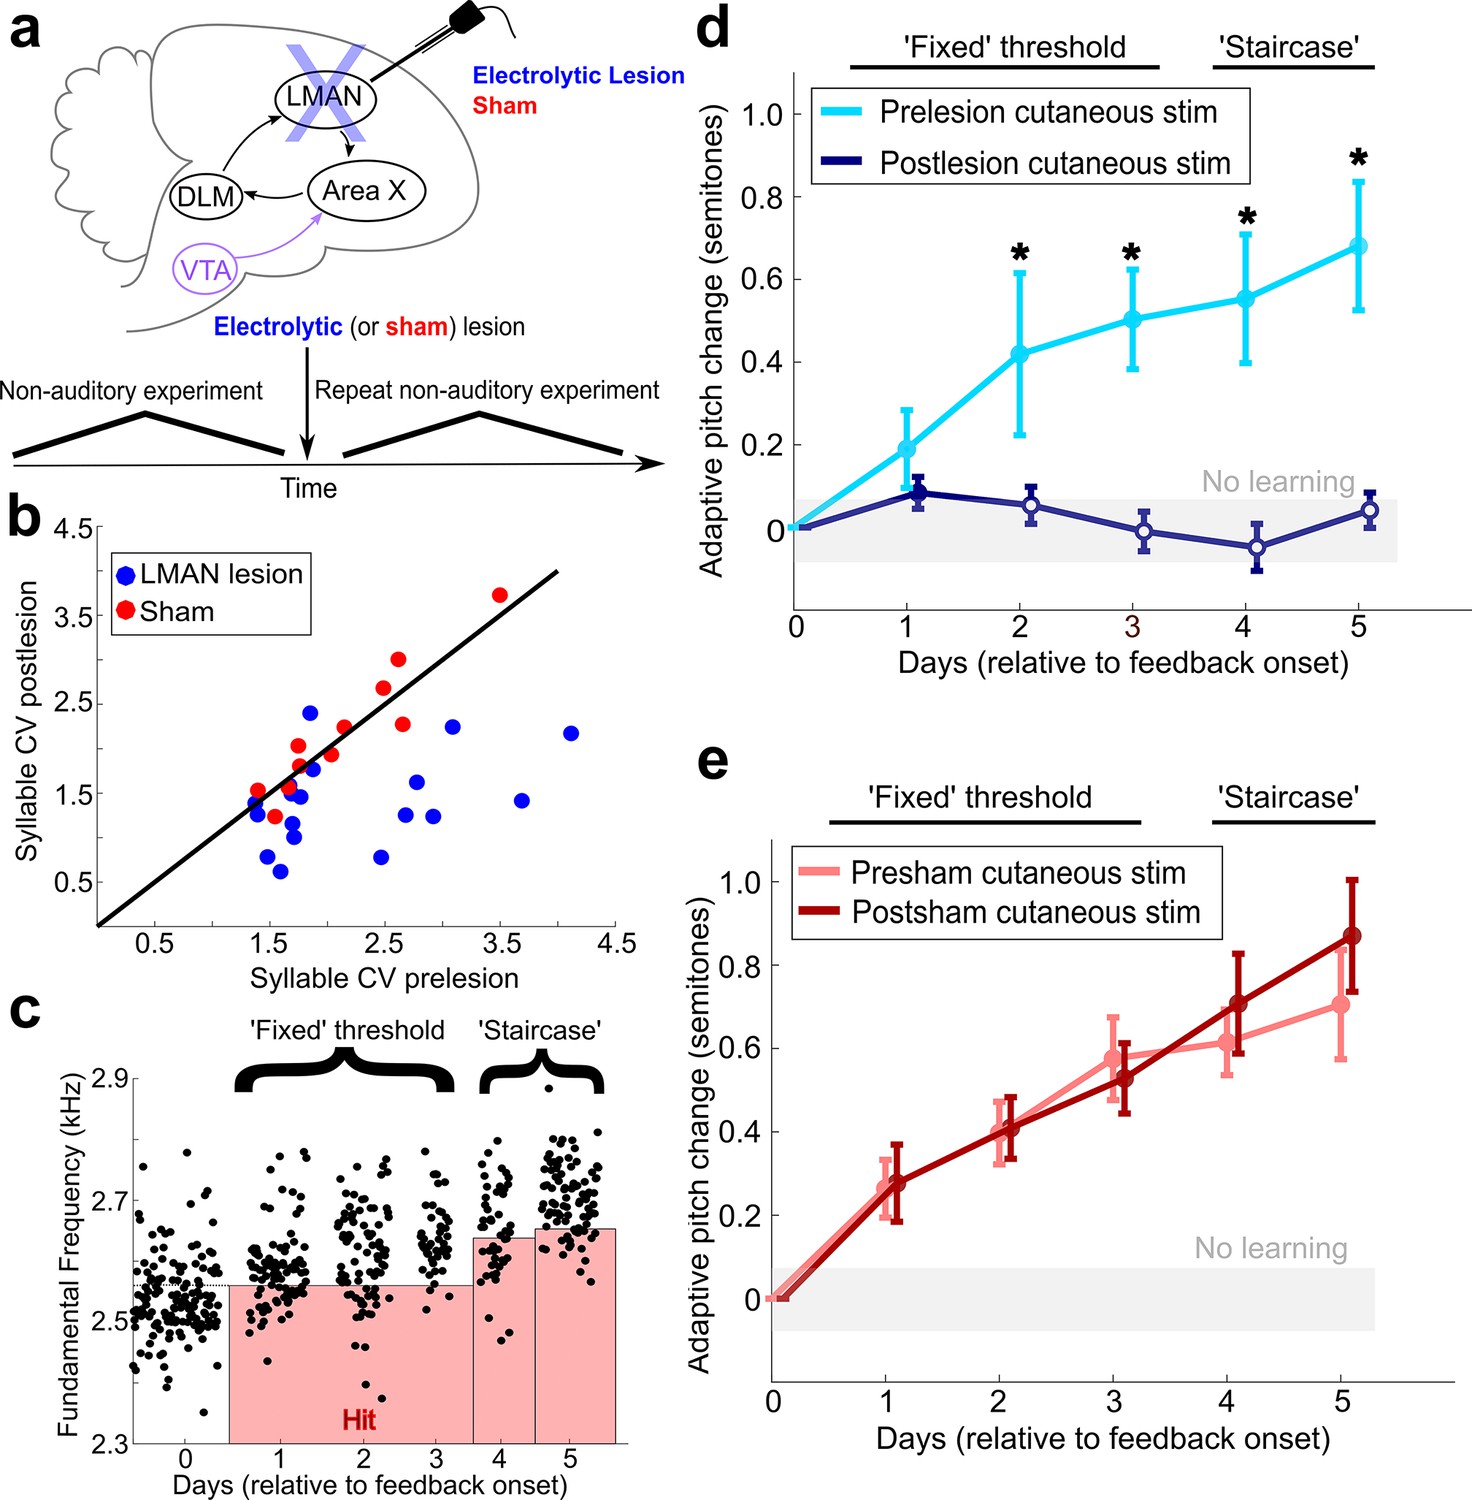
LMAN is required for non-auditory vocal learning.
(a) Timeline for electrolytic lesions of LMAN and sham operations. (b) CV of syllable pitch pre- vs. postlesion and pre- vs. postsham. LMAN lesions induced a significant reduction in pitch CV, sham operations did not (paired t-tests, p=0.002, p=0.911, respectively). (c) Prelesion experiment. Training consisted of 3 days using a fixed pitch threshold, then additional days where the threshold was changed each morning (‘staircase’). Each dot represents the pitch of a rendition of the target syllable. (d) Adaptive pitch change (in semitones) during cutaneous stimulation training (n = 6 LMAN-lesioned birds). Prelesion learning magnitude was significantly greater than baseline (the probability of resampled mean pitch on each day of training lesser than or equal to zero was Pboot < 0.0010, indicated by filled circles). Postlesion learning magnitude did not significantly differ from baseline (0.297 < Pboot < 0.660 on each of the final 4 days of training). Prelesion learning magnitude was significantly greater than postlesion learning magnitude (the probability of resampled mean pitch of prelesion data on the final 4 days of training lesser than or equal to resampled mean pitch of postlesion data was Pboot < 0.0070, indicated by asterisks). (e) Adaptive pitch change during cutaneous stimulation training (n = 5 sham-operated birds). Learning magnitudes were significantly greater than baseline both pre- and postsham (the probability of resampled mean pitch on each day of training lesser than or equal to zero was Pboot < 0.0010, indicated by filled circles). Learning magnitudes pre- vs. postsham did not significantly differ (0.120 < Pboot < 0.524 on all days of training).
-
Figure 3—source data 1
Source data for analysis in Figure 3B.
- https://cdn.elifesciences.org/articles/75691/elife-75691-fig3-data1-v2.zip
-
Figure 3—source data 2
Source data for analyses in Figure 3C, D.
- https://cdn.elifesciences.org/articles/75691/elife-75691-fig3-data2-v2.zip
-
Figure 3—source data 3
Source data for analysis in Figure 3E.
- https://cdn.elifesciences.org/articles/75691/elife-75691-fig3-data3-v2.zip
-
Figure 3—source code 1
Source code for use with Figure 3—source data 1 for analysis in Figure 3B.
- https://cdn.elifesciences.org/articles/75691/elife-75691-fig3-code1-v2.zip
-
Figure 3—source code 2
Source code for use with Figure 3—source data 2 for analysis in Figure 3C.
- https://cdn.elifesciences.org/articles/75691/elife-75691-fig3-code2-v2.zip
-
Figure 3—source code 3
Source code for use with Figure 3—source data 2 for analysis in Figure 3D.
- https://cdn.elifesciences.org/articles/75691/elife-75691-fig3-code3-v2.zip
-
Figure 3—source code 4
Source code for use with Figure 3—source data 3 for analysis in Figure 3E.
- https://cdn.elifesciences.org/articles/75691/elife-75691-fig3-code4-v2.zip
Figure 3—figure supplement 1
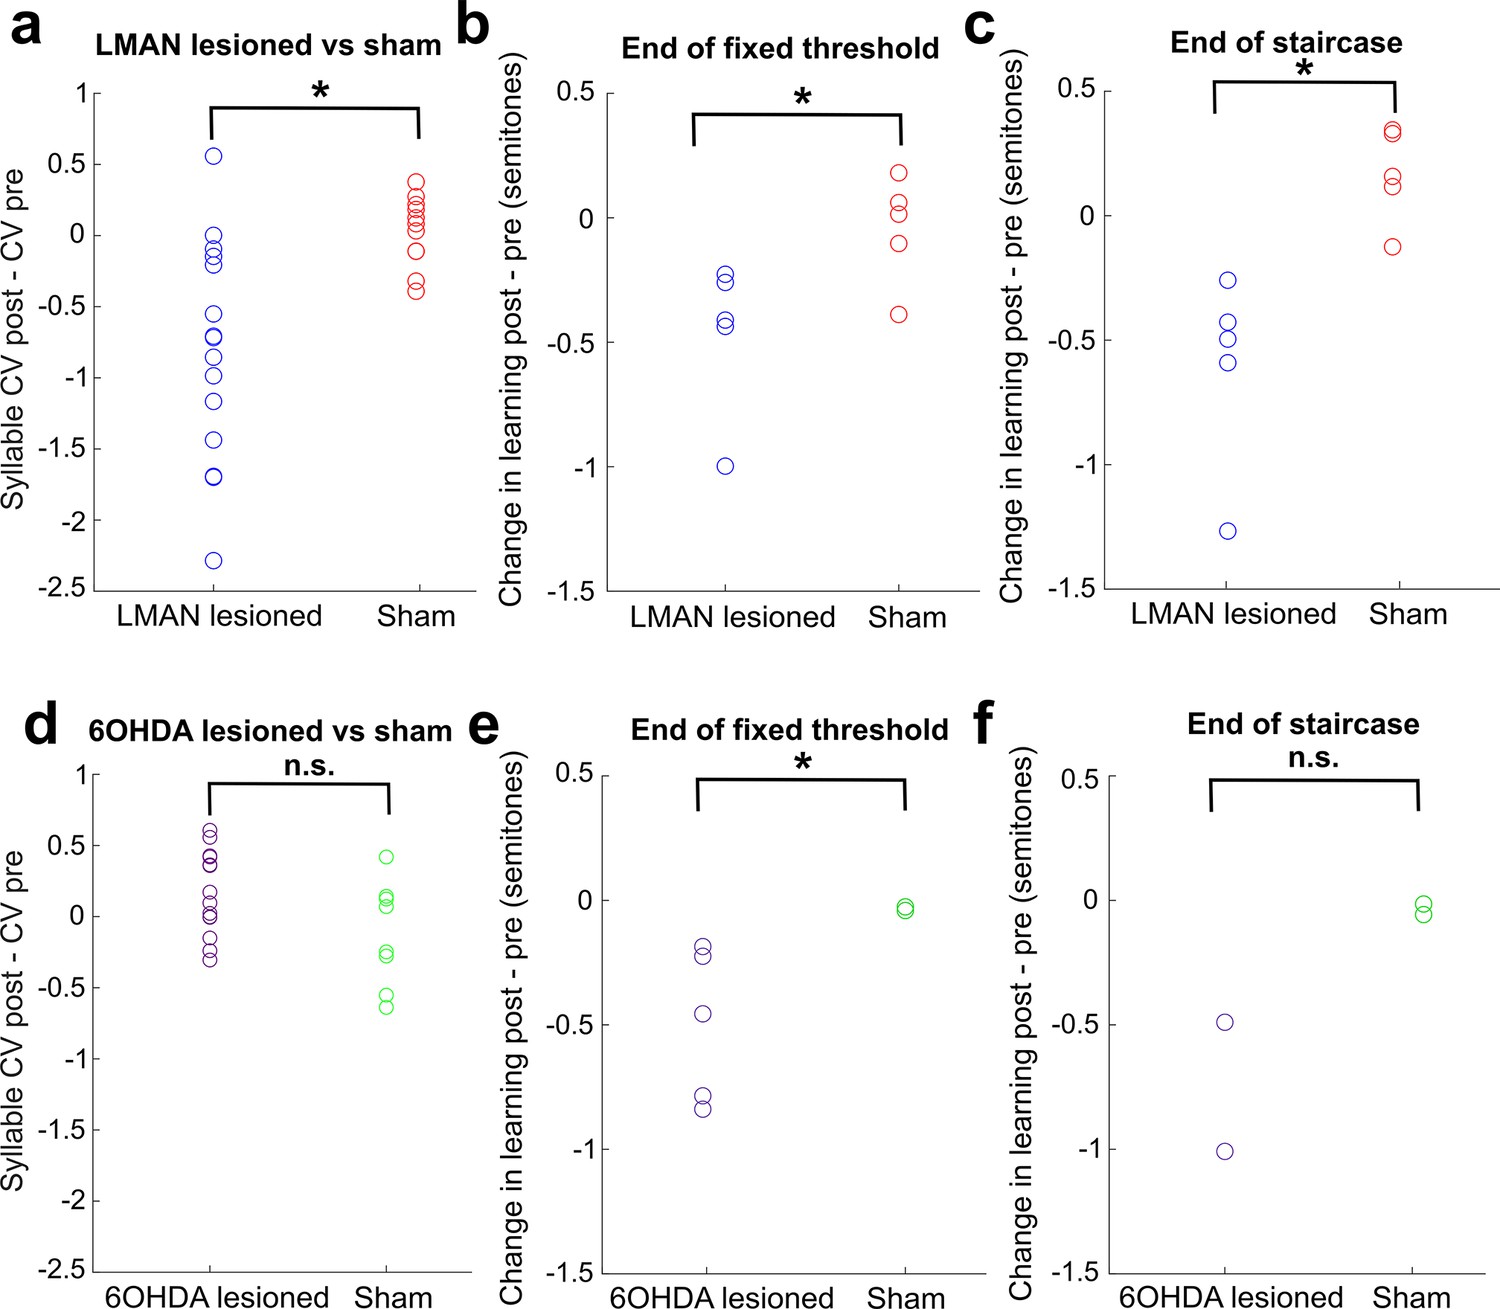
Direct comparison of CV changes and learning changes between sham and lesioned (LMAN lesioned and 6-OHDA lesioned) groups.
(a) Change in syllable CV in LMAN-lesioned and sham-operated birds. Each data point represents the CV postlesion – CV prelesion of one individual song syllable. LMAN lesions induced a significant reduction in syllable CV compared to sham operations (two-sample Kolmogorov–Smirnov test, p=0.003). (b) Lesion-induced change in learning magnitude (measured at the end of 3 days of cutaneous stimulation training) in LMAN-lesioned and sham-operated birds. The lesion-induced change in learning magnitude (post – pre) for LMAN-lesioned birds was significantly greater than sham (two-sample Kolmogorov–Smirnov test: p=0.036). (c) Same as (b), except learning magnitude was measured at the end of the extended staircase portion of training. The lesion-induced change in learning magnitude (post – pre) in LMAN-lesioned birds was significantly greater than in sham-operated birds (two-sample Kolmogorov–Smirnov test, p=0.004). (d) Change in syllable CV in 6-OHDA-lesioned and sham-operated birds. Each data point represents the CV postlesion – CV prelesion of one individual song syllable. 6-OHDA lesions did not induce a significant reduction in syllable CV compared to sham operations (two-sample Kolmogorov–Smirnov test, p=0.209). (e) Lesion-induced change in learning magnitude (measured at the end of 3 days of training) in 6-OHDA-lesioned and sham-operated birds. The lesion-induced change in learning magnitude (post – pre) in 6-OHDA-lesioned birds was significantly greater than in sham-operated birds (two-sample Kolmogorov–Smirnov test, p=0.036). (f) Same as (e), except learning magnitude was measured at the end of the staircase portion of training.
Figure 3—figure supplement 2

LMAN lesion histological analysis.
(a) Example images of Nissl-stained brain tissue. Tissue from sham-operated bird on the left and tissue from LMAN-lesioned bird on the right. Red boxes highlight the locations of LMAN. (b) CDF plot of optical density (OD) ratios (OD of LMAN/OD of non-LMAN-pallium) in lesioned and sham-operated birds. Each line shows the OD ratios from each individual LMAN lesioned bird, and the black line shows the OD ratios from the grouped sham dataset. (c) CDF plot of OD ratios in lesioned and sham-operated birds. Blue line shows the OD ratios from the grouped LMAN lesion dataset, and the red line shows the OD ratios from the grouped sham dataset (two-sample Kolmogorov–Smirnov test, p<0.001).
Figure 4 with 2 supplements
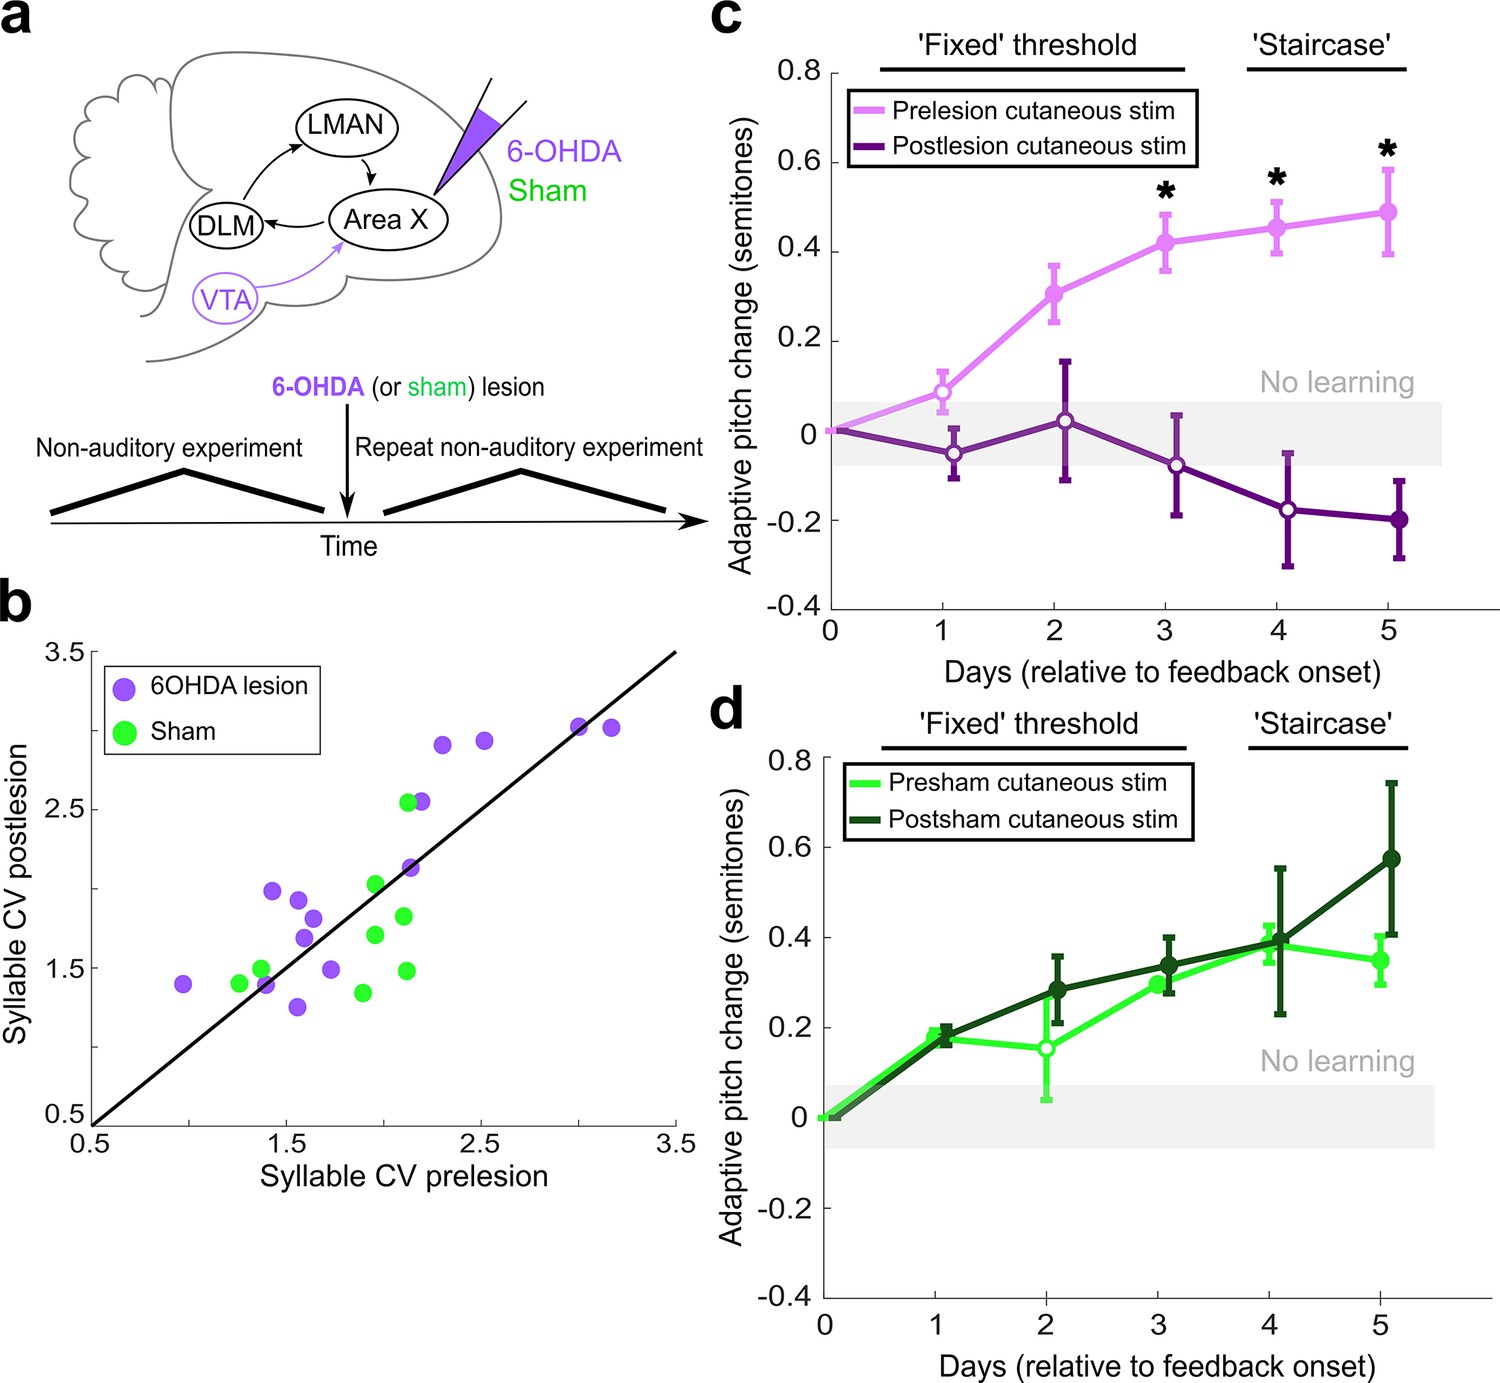
Dopaminergic input to Area X is required for non-auditory vocal learning.
(a) Timeline for 6-OHDA and saline (sham) injections into Area X. (b) CV of syllable pitch pre- vs. postlesion and pre- vs. postsham. Neither dopamine lesions nor shams induced significant changes in pitch CV (paired t-tests, p=0.397 and p=0.531, respectively). (c) Adaptive pitch change (in semitones) during cutaneous stimulation training (n = 5 lesioned birds). Prelesion learning magnitude was significantly greater than baseline (the probability of resampled mean pitch on each of the final 4 days of training lesser than or equal to zero was Pboot < 0.010, indicated by filled circles). Postlesion learning magnitude did not significantly differ from baseline except for on the final day, when the mean changed in the anti-adaptive direction (Pboot > 0.067 on training days 1–4, Pboot < 0.0010 on training day 5). Prelesion learning magnitude was significantly greater than postlesion learning magnitude (the probability of resampled mean pitch from prelesion dataset on each of the final 3 days of training lesser than or equal to resampled mean pitch from postlesion dataset was Pboot < 0.0010, indicated by asterisks). (d) Adaptive pitch change (in semitones) during cutaneous stimulation training (n = 3 sham-lesioned birds). Learning magnitudes were significantly greater than baseline both pre- and postsham (the probability of resampled mean pitch from presham and postsham datasets on each day other than day 2 of training lesser than or equal to zero was Pboot < 0.0010, indicated by filled circles). Learning magnitudes pre- vs. postsham did not significantly differ (0.653 < Pboot < 0.931 on all days of training).
-
Figure 4—source data 1
Source data for analysis in Figure 4B.
- https://cdn.elifesciences.org/articles/75691/elife-75691-fig4-data1-v2.zip
-
Figure 4—source data 2
Source data for analysis in Figure 4C.
- https://cdn.elifesciences.org/articles/75691/elife-75691-fig4-data2-v2.zip
-
Figure 4—source data 3
Source data for analysis in Figure 4D.
- https://cdn.elifesciences.org/articles/75691/elife-75691-fig4-data3-v2.zip
-
Figure 4—source code 1
Source code for use with Figure 4—source data 1 for analysis in Figure 4B.
- https://cdn.elifesciences.org/articles/75691/elife-75691-fig4-code1-v2.zip
-
Figure 4—source code 2
Source code for use with Figure 4—source data 2 for analysis in Figure 4C.
- https://cdn.elifesciences.org/articles/75691/elife-75691-fig4-code2-v2.zip
-
Figure 4—source code 3
Source code for use with Figure 4—source data 3 for analysis in Figure 4D.
- https://cdn.elifesciences.org/articles/75691/elife-75691-fig4-code3-v2.zip
Figure 4—figure supplement 1
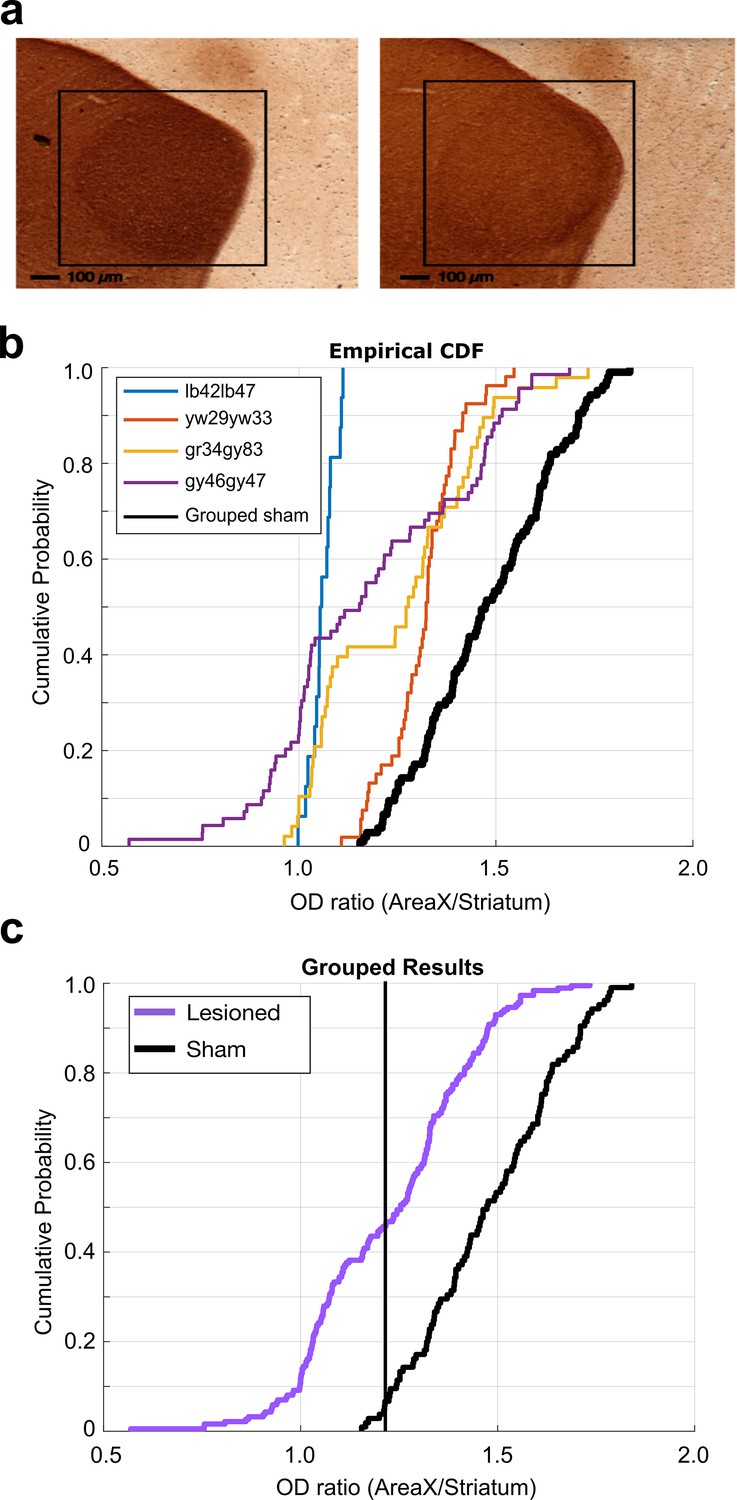
6-OHDA lesion histological analysis.
(a) Example images of TH-stained brain tissue. Tissue from sham-operated bird on the left and tissue from 6-OHDA-lesioned bird on the right. Black boxes highlight the locations of Area X. (b) Cumulative probability plot of optical density (OD) ratios (OD of Area X/OD of non-X-striatum) in 6-OHDA-lesioned and sham-operated birds. Each line shows the OD ratios from each individual 6-OHDA-lesioned bird, and the black line shows the OD ratios from the grouped sham dataset. (c) CDF plot of OD ratios in lesioned and control birds. Purple line shows the OD ratios from the grouped 6-OHDA-lesioned dataset, and the black line shows the OD ratios from the grouped sham dataset (two-sample Kolmogorov–Smirnov test, p<0.001).
Figure 4—figure supplement 2
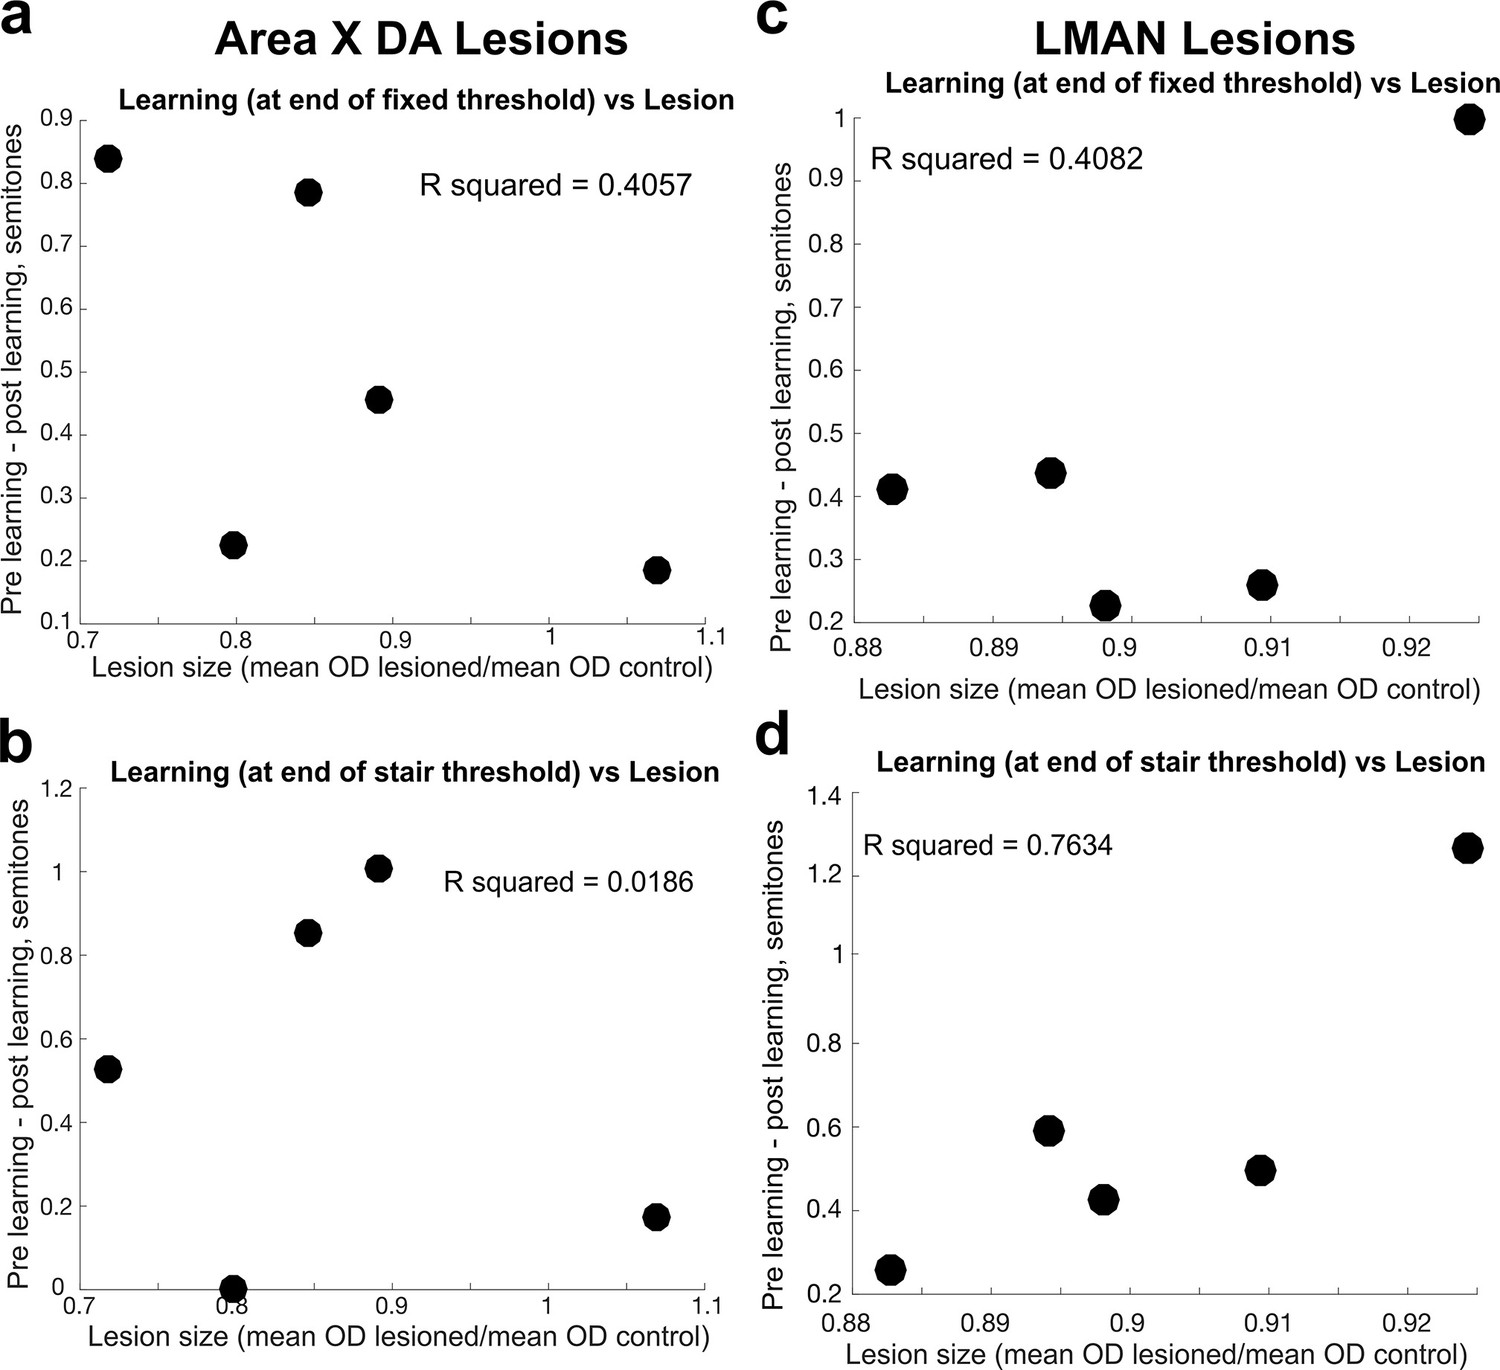
Comparison of lesion magnitude and learning deficit.
(a) For each bird, the difference between the magnitude of learning, calculated at the end of 3 days of cutaneous stimulation training, prelesion vs. postlesion, compared to the magnitude of the Area X dopamine lesion in 6-OHDA-injected birds, measured by the ratio of the mean optical density (OD) of the lesioned tissue to the mean OD of control tissue. Each dot represents the results from each individual bird. (b) Same as in (a), but the magnitude of learning was assessed at the end of the additional days of staircase training. (c) For each bird, the difference between the magnitude of learning prelesion and the magnitude of learning postlesion (in both cases, the magnitude of learning is measured at the end of the 3 days of fixed threshold training, compared to the size of the LMAN lesion in electrolytically lesioned birds, measured by the ratio of the mean OD of the lesioned tissue to the mean OD of control tissue). Each dot represents the results from each individual bird. (d) Same as in (c), but the magnitude of learning was assessed at the end of the additional days of staircase training.
Additional files
Download links
A two-part list of links to download the article, or parts of the article, in various formats.
Downloads (link to download the article as PDF)
Open citations (links to open the citations from this article in various online reference manager services)
Cite this article (links to download the citations from this article in formats compatible with various reference manager tools)
Shared mechanisms of auditory and non-auditory vocal learning in the songbird brain
eLife 11:e75691.
https://doi.org/10.7554/eLife.75691


