A striatal circuit balances learned fear in the presence and absence of sensory cues
- Laboratory for Synaptic Mechanisms, Brain Mind Institute, School of Life Science, Ecole Polytechnique Fédérale de Lausanne, Switzerland
Figures
Figure 1 with 5 supplements
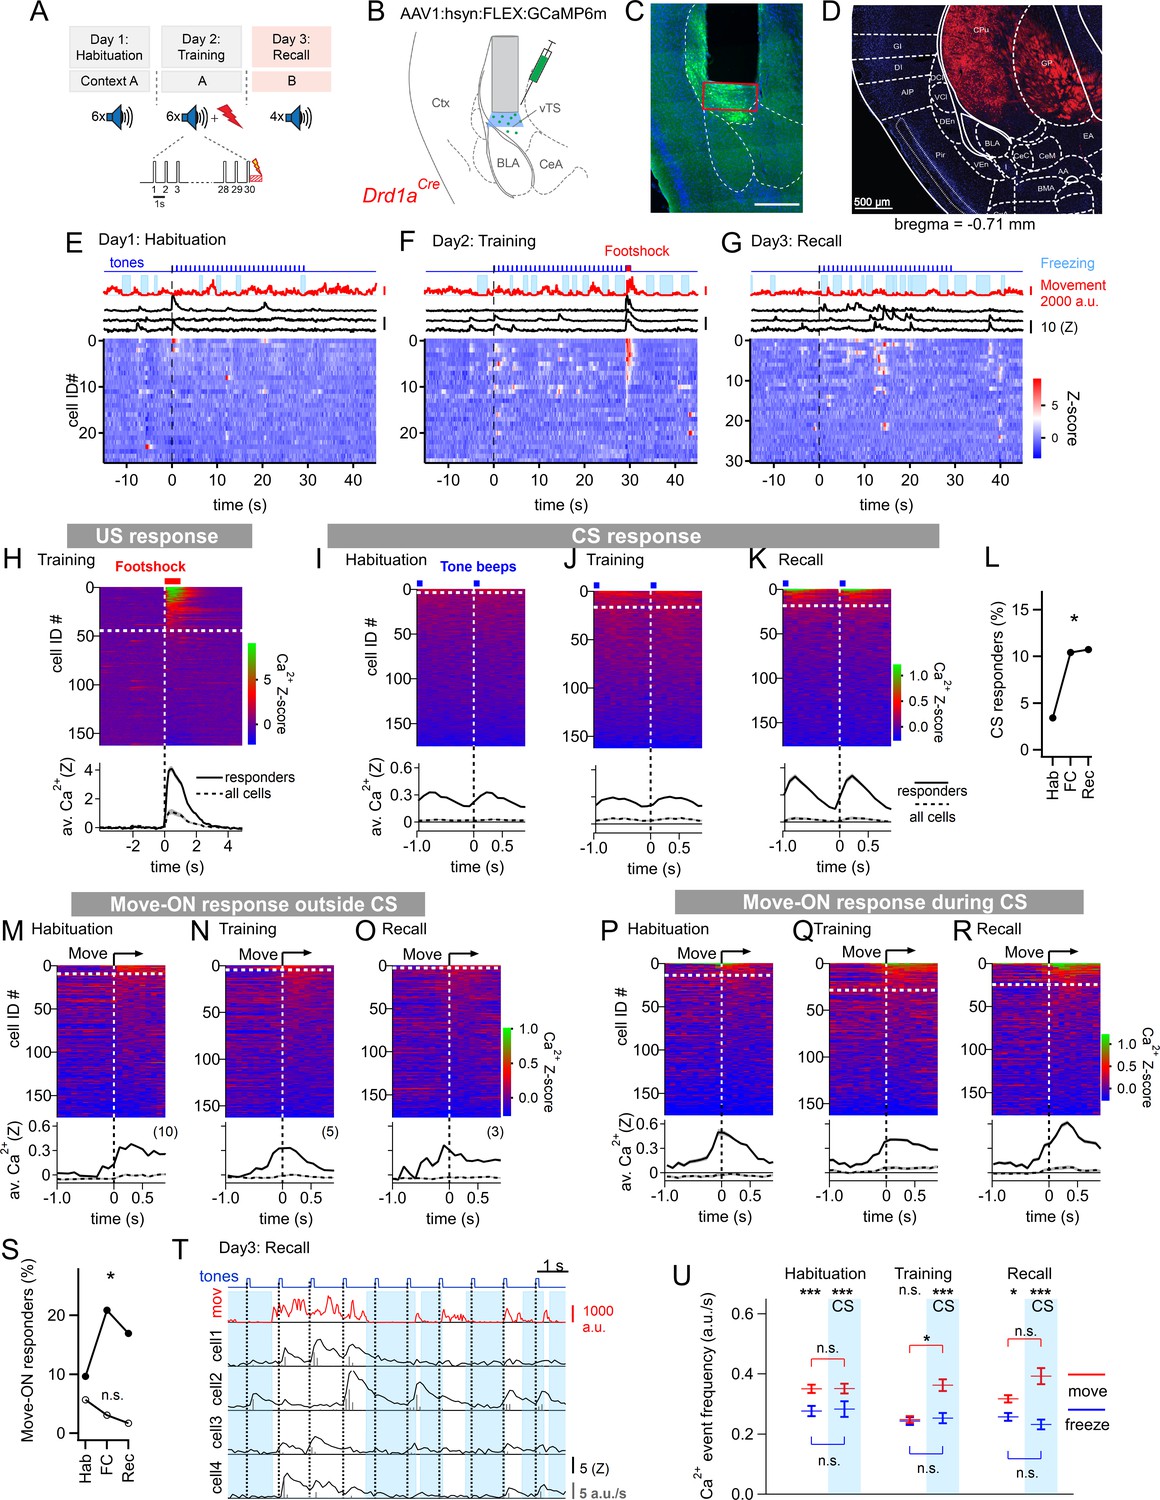
Miniature microscope Ca2+-imaging of D1R+ neurons in the vTS reveals coding for tones and movement during fear learning.
(A) Outline of the fear learning protocol. (B) Experimental scheme of the injection of an AAV vector and placement of the GRIN lens in the vTS of Drd1aCre mice. (C) Posthoc fluorescence microscopy image from an injected Drd1aCre mouse expressing GCaMP6m (green channel; blue channel: DAPI). The black region indicates the position of the GRIN lens. The putative imaging area is depicted with a red rectangle. Scalebar, 500 µm. (D) tdTomato expression in Drd1aCre x Rosa26LSL-tdTomato mice indicates localization of D1R+ neurons in the vTS, but not in neighboring cortical - nor amygdalar structures. (E - G) Movement traces - and freezing-state of an example mouse (red traces and light blue areas, respectively), Z-scored Ca2+ traces for three example neurons (black traces); and color-coded Z-scored Ca2+ traces for all neurons in one example mouse (bottom). Data are from the fourth CS presentation of day 1 (E), the fourth CS-US presentation of day 2 (F), and the second CS presentation on day 3 (G). (H) Color-coded Z-scored Ca2+ responses to footshocks in all imaged D1R+ neurons from N=8 mice. Responses with Z>1 in a time interval of [0; 1 s] were considered as significant (see white dashed line). The bottom panel shows the average ± S.E.M. of Ca2+ traces for all responders (n=45 neurons; black trace ± gray shades), and the average ± S.E.M. across all neurons (n=163; dashed black trace ± gray shades). (I - K) Z-scored Ca2+ traces aligned to tone beeps (CS) during the habituation day, training day, and recall day (I, J, K, respectively). Responses with an average Z-score >0.2 in the time interval [0; 0.5 s] were considered significant. The black traces in the lower panel follow the same logics as in (H). (L) Percentage of tone - responsive neurons for each day. (M - O) Color-coded Z-scored Ca2+ traces aligned to the movement - ON events, analyzed at times in-between CS blocks, for the habituation -, training - and recall days, as indicated (top panel). The traces in the bottom panel were analyzed as in (H). (P - R) Ca2+ traces aligned to the movement - ON events, analyzed during the 30 s tone blocks (CS), for the habituation -, training - and recall days (P, Q, and R respectively). (S) Percentage of movement - ON responding neurons during the CS, and in the absence of a CS (closed, and open symbols, respectively). (T) Example traces of, from top to bottom, times of tone beeps (blue trace); movement index (red trace); and Ca2+ traces from four example neurons in one mouse; times of freezing are highlighted by light blue. The detection of Ca2+ - events and their amplitudes by a deconvolution analysis is indicated by vertical bars (see Materials and methods). (U) The amplitude - weighted frequency of Ca2+ events (average ± S.E.M.) is plotted separately for the four combinations of CS / no CS epochs, and movement / freezing states of the mice, for the habituation, training, and fear memory recall day. The presence of a CS is indicated by the blue bars. For statistical parameters, see Results text.
-
Figure 1—source data 1
Raw data and statistical tests for Figure 1 and its supplements.
- https://cdn.elifesciences.org/articles/75703/elife-75703-fig1-data1-v2.xlsx
Figure 1—figure supplement 1
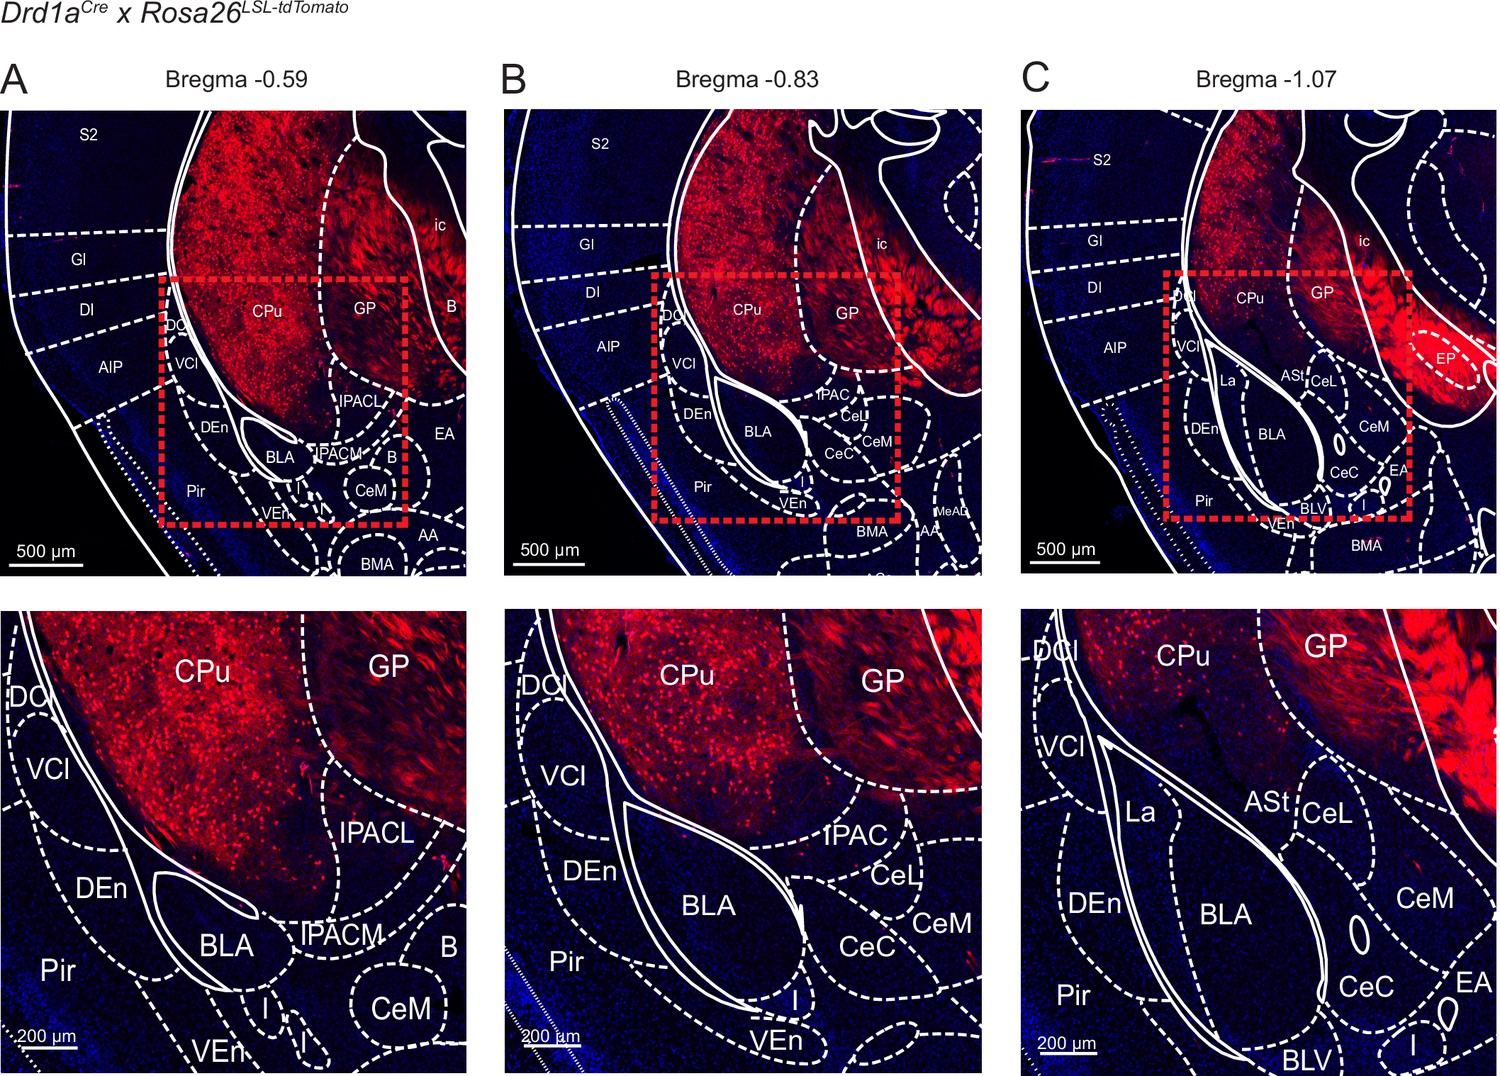
Localization of Cre-expressing cells in the vTS of Drd1aCre x Rosa26LSL-tdTomato mice.
Drd1aCre mice were bred with the Rosa26LSL-tdTomato reporter line, to drive the expression of tdTomato in Cre - positive neurons. Shown is every 6th section (40 µm thickness) at three relevant a-p levels on the level of the posterior striatum (A, B, C; Franklin and Paxinos, 2016). The mouse brain atlas images of Franklin and Paxinos, 2016 were overlaid at the indicated Bregma levels. The lower panels show magnifications, as indicated by dashed boxes in the upper panels. Note that in the Drd1aCre mouse line used for our study (EY217 BAC transgenic mouse line of the GenSAT project, see Materials and methods), no Cre expression is driven in cortex -, amygdala -, and claustrum structures laterally and ventrally to the vTS (see also Gerfen et al., 2013), and images for the EY217 BAC transgenic mouse line on the GenSAT website; (http://www.gensat.org/). Rather, Cre - expression is limited to neurons in the vTS (labeed as ‘CPu’, for ‘caudate putamen’, in the mouse brain atlas overlays). The meaning of the abbreviation of other brain areas is like in Franklin and Paxinos, 2016; see also Figure 7—source data 2.
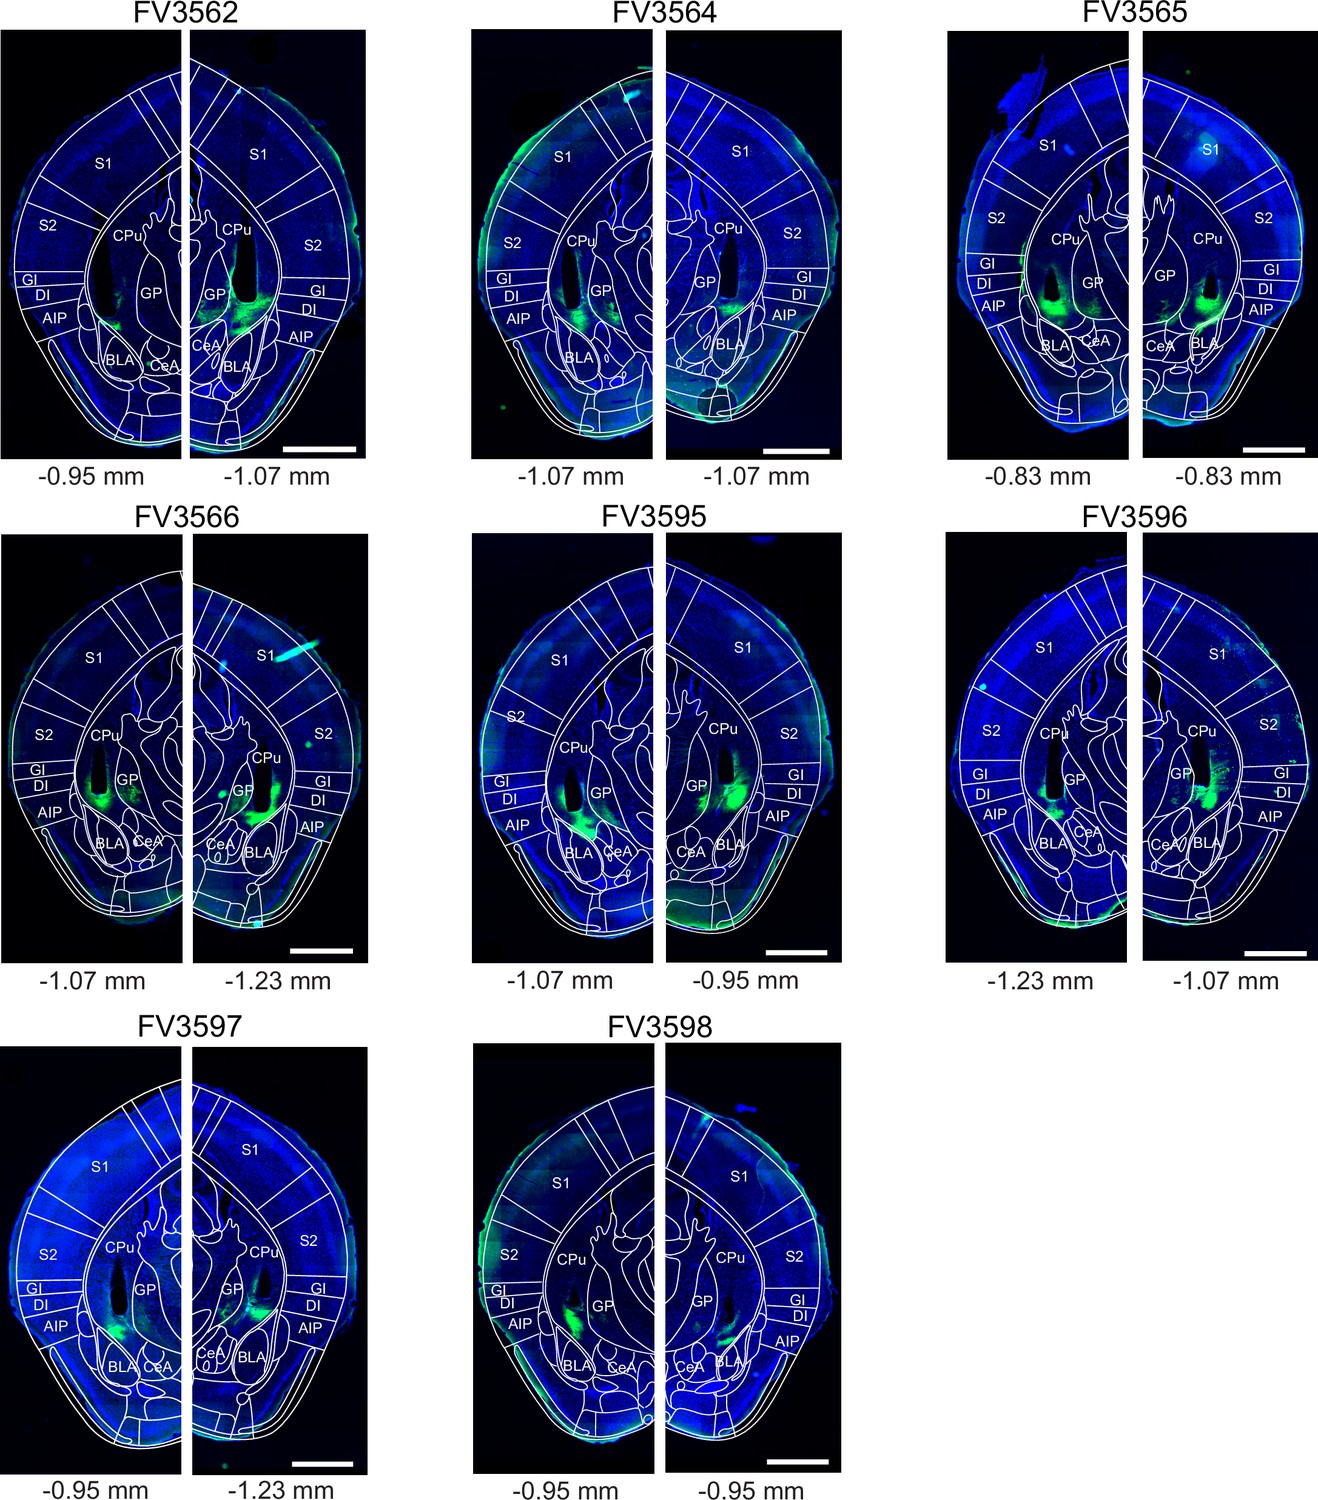
Figure 1—figure supplement 2
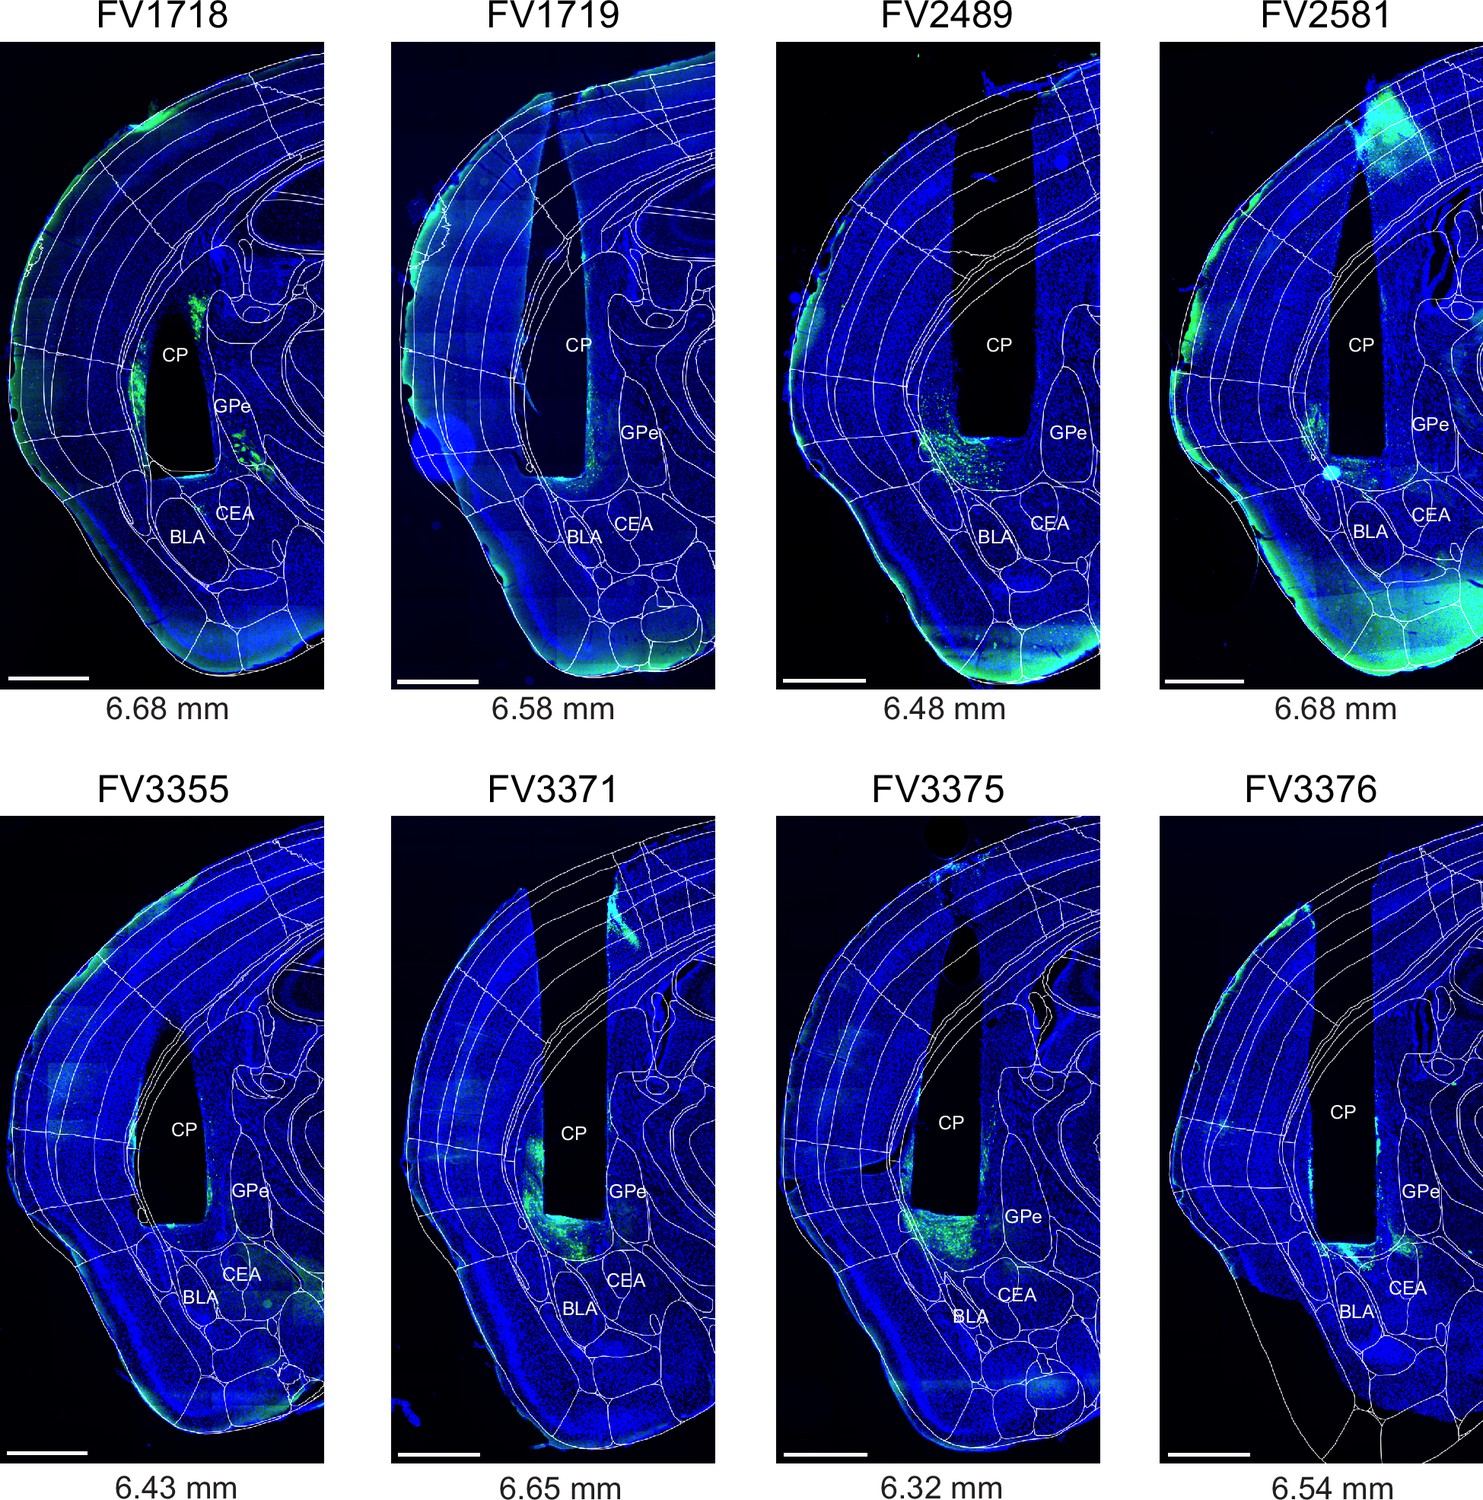
Post - hoc histology of GCaMP6m expression and GRIN lens placement in Drd1aCre mice.
Following experiments (Figure 1), the brains of Drd1aCre mice were fixed by transcardial perfusion with paraformaldehyde (PFA), and 40 µm coronal sections were prepared. The fluorescence of GCaMP6m (green channel) and DAPI (blue) was imaged in a slide scanner (see Materials and methods). The section containing a cross-section through the center of GRIN lens aperture (black non-fluorescent hues in each image) is shown for each mouse (N=8). On each image, the outlines of the Allen Brain Atlas are overlaid (white lines), after registration to the image using ABBA alignment tool (see Materials and methods). Numbers below each panel indicate a-p positions of the GRIN lens aperture centers in the Allen Brain Atlas space. Codes above each panel refer to the mouse identification number. Scale bars, 1 mm.
Figure 1—figure supplement 3
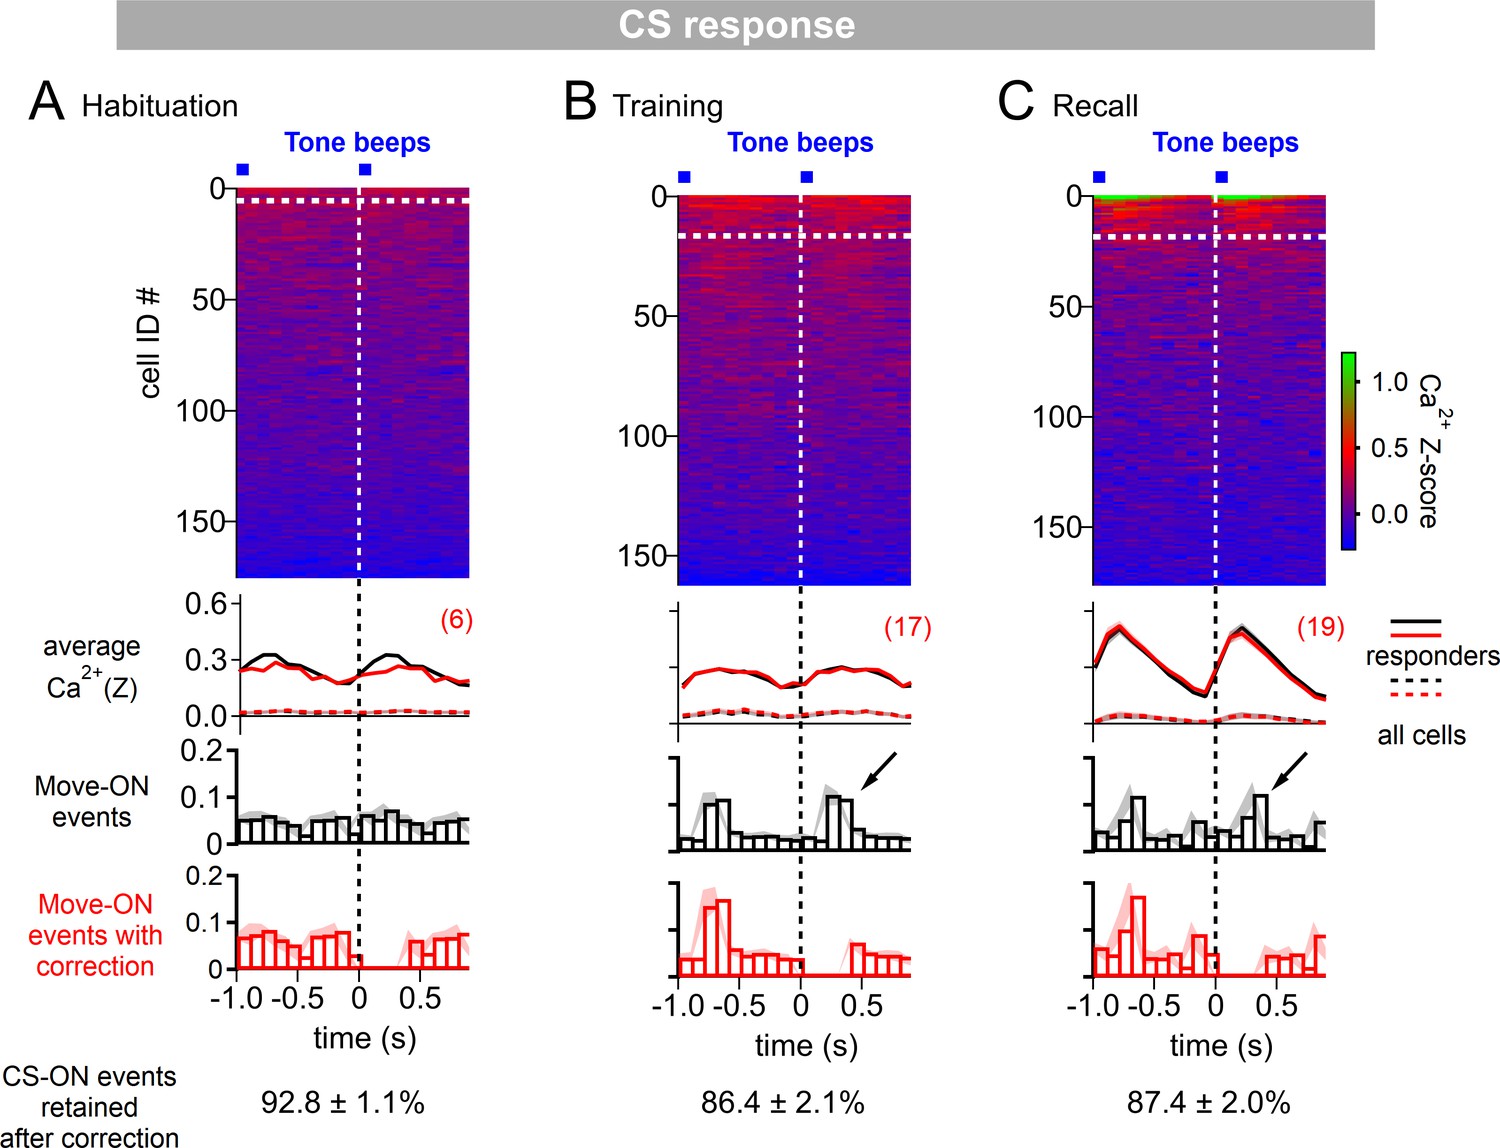
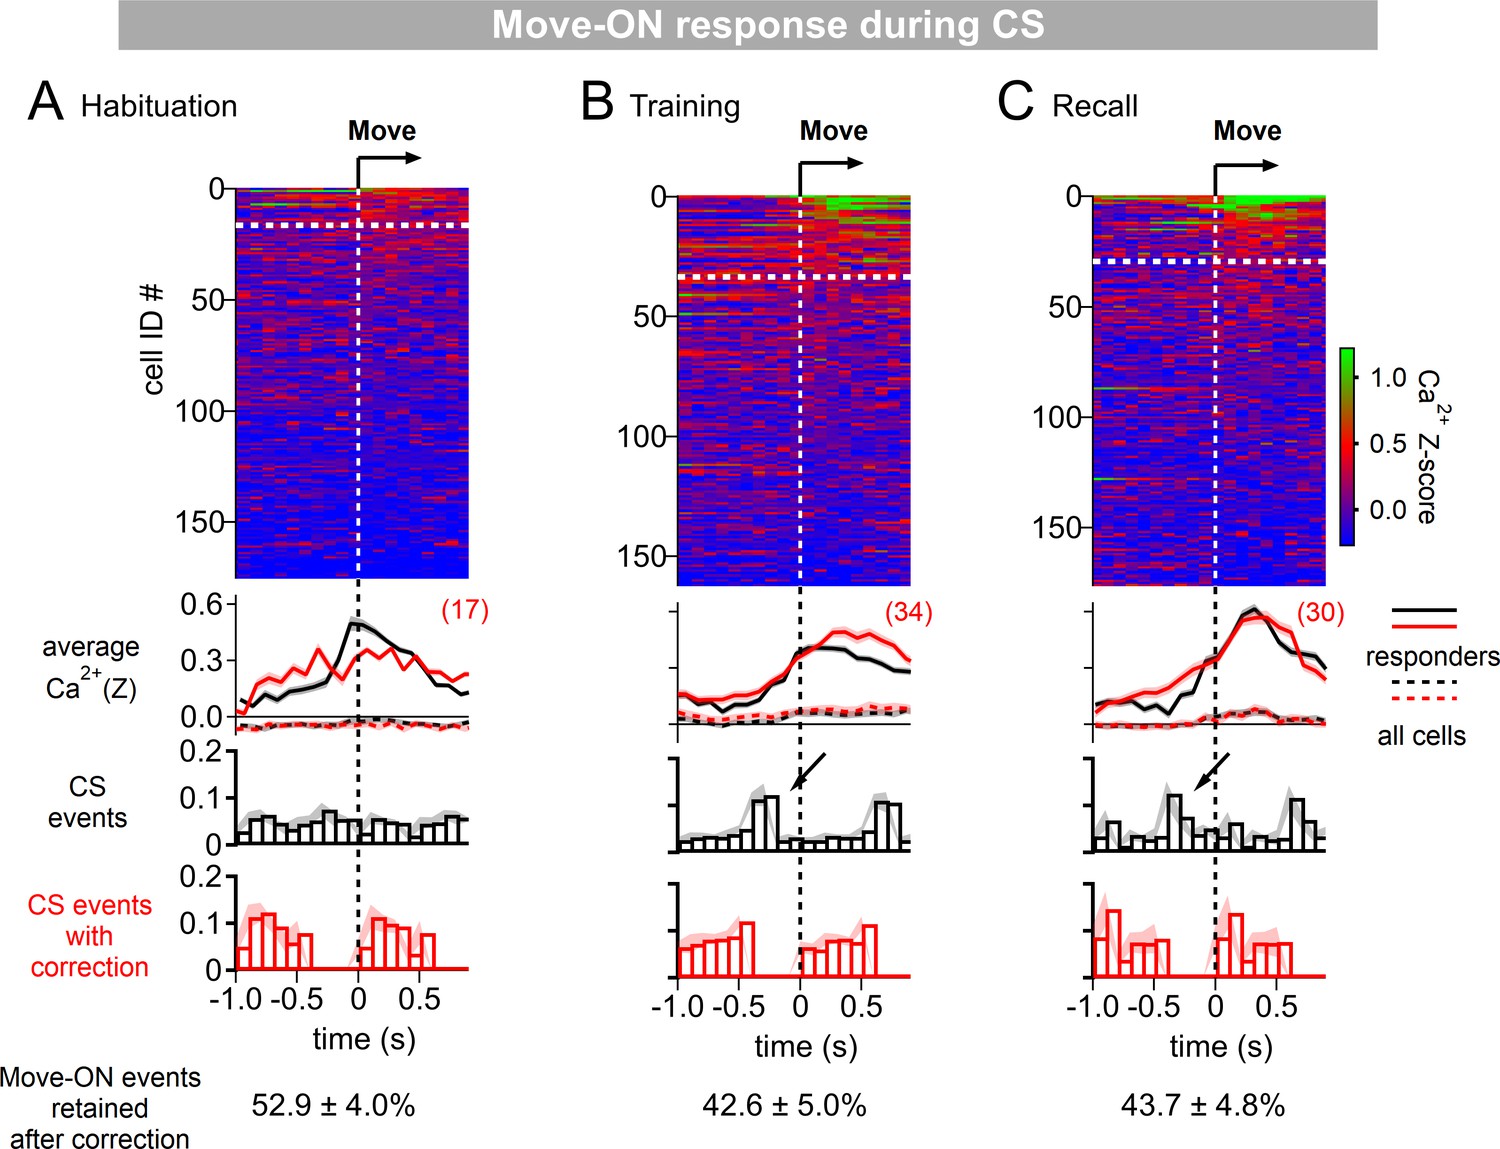
Correction of CS responses for movement - ON responses.
(A - C) Ca2+ responses were aligned to tone beeps as in Figure 1I-K. In addition, a histogram of the movement - ON events during these times was computed (third panel, black histograms). This revealed that on the training day (B) and on the recall day (C), about 10–15% of the tones were followed at 0–400ms by a movement (see arrows), indicating that under these conditions, some tones induced movement initiation of the mice. Because movement - ON transitions can by themselves induce an activity of D1R+ neurons (Figure 1M-O), we removed those events that were followed by a movement (around 85–90% of all events were retained; see exact values at the bottom, averaged across the N=8 imaged Drd1aCre mice). This led to movement - corrected averaged Ca2+ traces that were slightly changed as compared to the average Ca2+ traces without omission of events (second panel, red traces; compare with original traces, black). The movement - ON histograms after correction for synchronous movement - ON transitions is also shown (bottom panel, red histograms). The plot of color-coded Z-scored Ca2+ responses (top panel) refers to the data after correction for movement - ON events. The number of CS - responding neurons were analyzed from this corrected data (top panel, white dashed lines; numbers of responders indicated in red), and used for the analysis in Figure 1L.
Figure 1—figure supplement 4
Correction of movement - ON responses for CS – responses.
(A - C) Ca2+ responses were aligned to movement-ON transitions during the CS (same data as in Figure 1P-R). In addition, histograms of the CS events relative to the movement-ON events were computed (third panel, black histograms). This revealed that many movement-ON transitions were preceded by a tone event (by ~200–400ms; arrows), again suggesting that tones likely cause movement-ON events with a certain probability, a phenomenon especially visible during the training-recall sessions (see also Figure 1—figure supplement 2). Because tones can themselves cause activity in D1R+ neurons (Figure 1), we removed those events which were preceded at 0–400ms by a tone. Despite the relatively high number of coinciding events, there were no marked changes between the corrected - and non-corrected Ca2+ responses (second panel from top, compared red [corrected] and black [non-corrected] traces). The number of movement-ON responders was calculated after this correction (see top panel white dashed lines, and red numbers), and used for the analysis in Figure 1S.
Figure 1—figure supplement 5
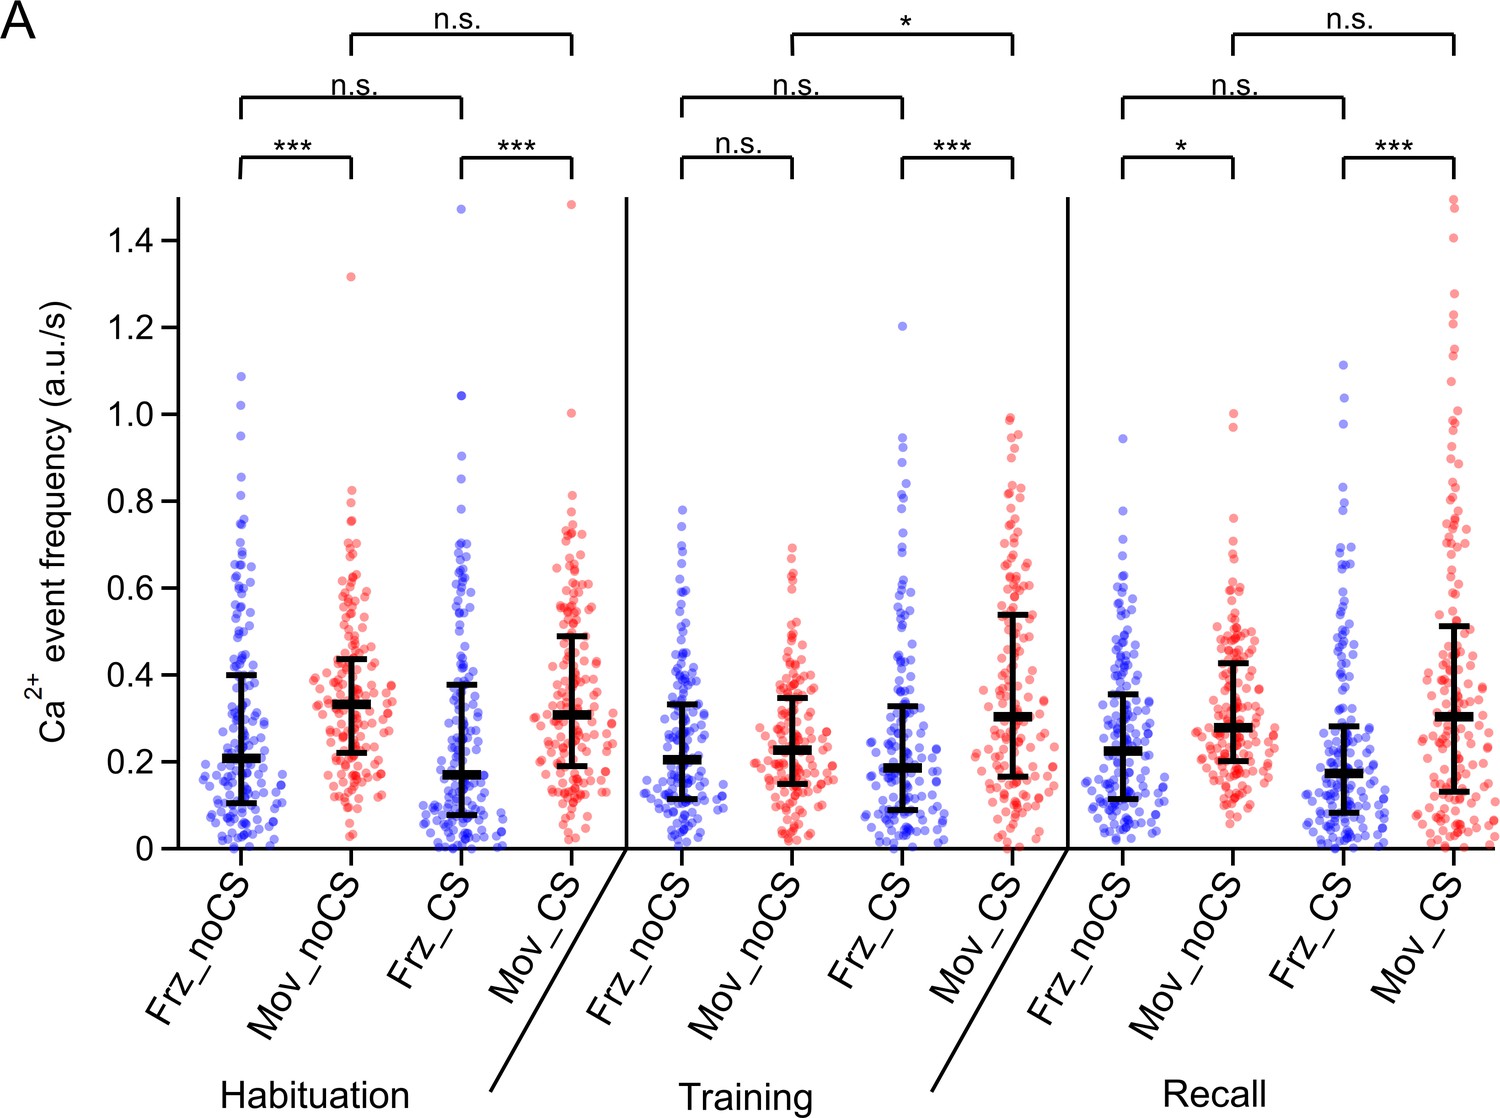
Individual data points and statistical comparison for the Ca2+ event frequencies for four different conditions.
The amplitude - weighted Ca2+ event frequency of the data in Figure 1U are re-plotted together with their underlying individual data points from each imaged neuron (n=176, 163, and 177 on the habituation-, training-, and recall day, respectively). Here, different to the meaning of symbols in Figure 1U, the medians of each distribution (horizontal bars) and the 25–75% inter-quantile range (vertical bars) are indicated. Abbreviations: Frz_noCS: freezing, in the absence of CS; Mov_noCS: movement, in the absence of CS; Frz_CS: freezing, during the CS; Mov_CS: movement, during the CS. The p-values of the statistical comparisons are (post-hoc Dunn’s multiple comparison tests, following Kruskal-Wallis test; KW = 138.3; p<0.0001): (1) Habituation day: Frz_noCS vs Mov_noCS, p<0.0001; Frz_noCS vs Frz_CS, p>0.99; Mov_noCS vs Mov_CS, p>0.99; Frz_CS vs Mov_CS, p<0.0001. (2) Training day: Frz_noCS vs Mov_noCS, p>0.99; Frz_noCS vs Frz_CS, p>0.99; Mov_noCS vs Mov_CS, p=0.0163; Frz_CS vs Mov_CS, p<0.0001. (3) Recall day: Frz_noCS vs Mov_noCS, p=0.0167; Frz_noCS vs Frz_CS, p>0.99; Mov_noCS vs Mov_CS, p>0.99; Frz_CS vs Mov_CS, p<0.0001. See also Statistics table for Figure 1, for more details on p - values and further statistical parameters.
Figure 2 with 1 supplement
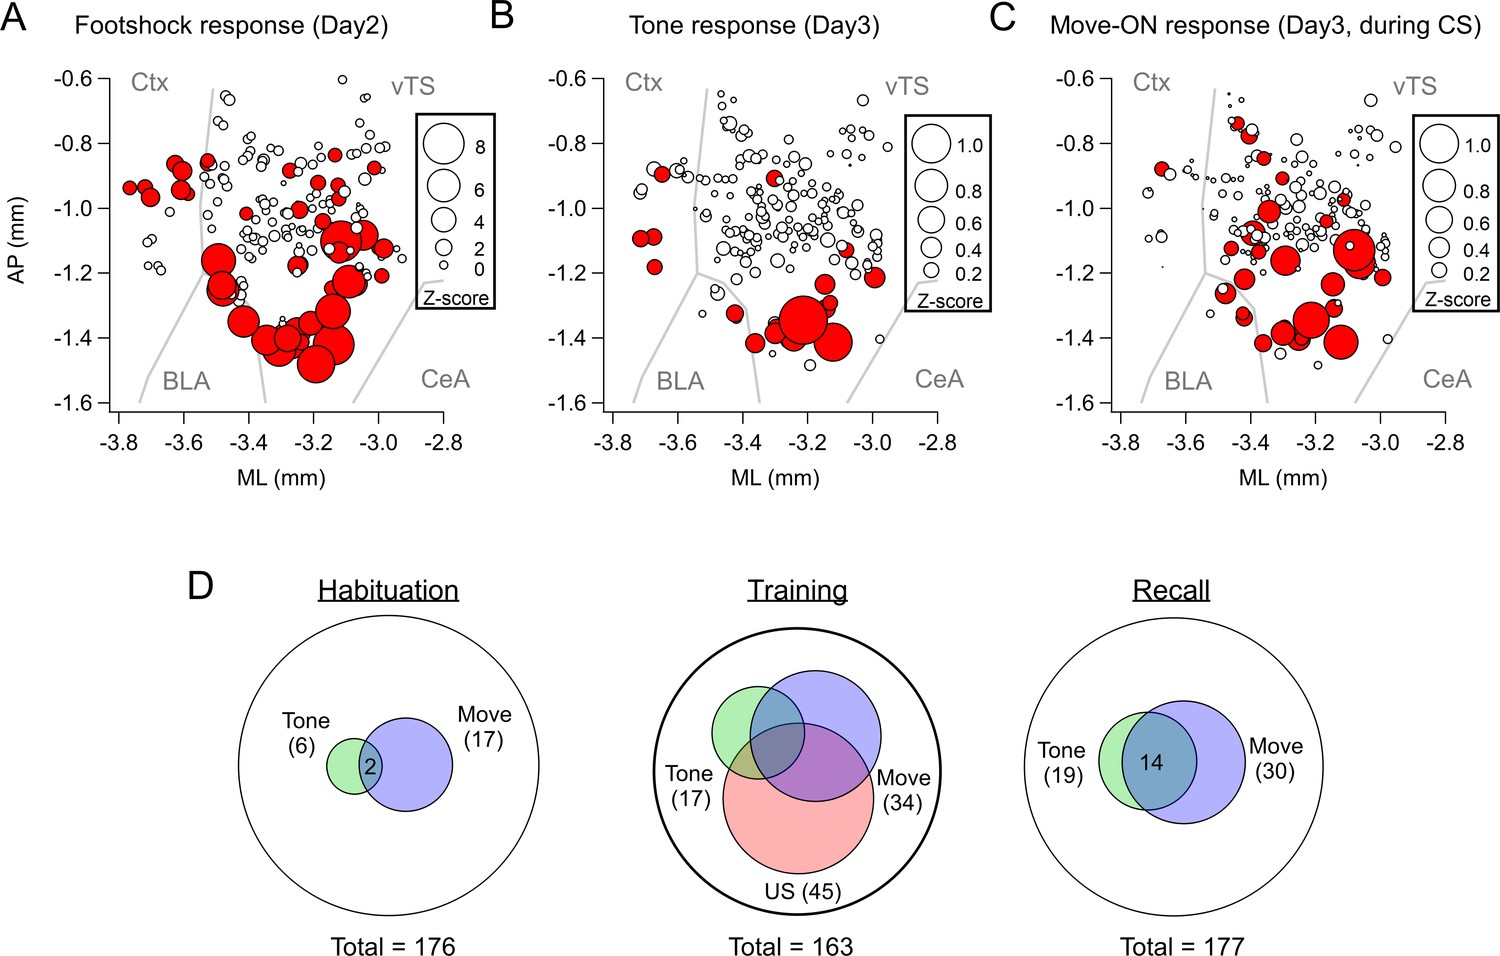
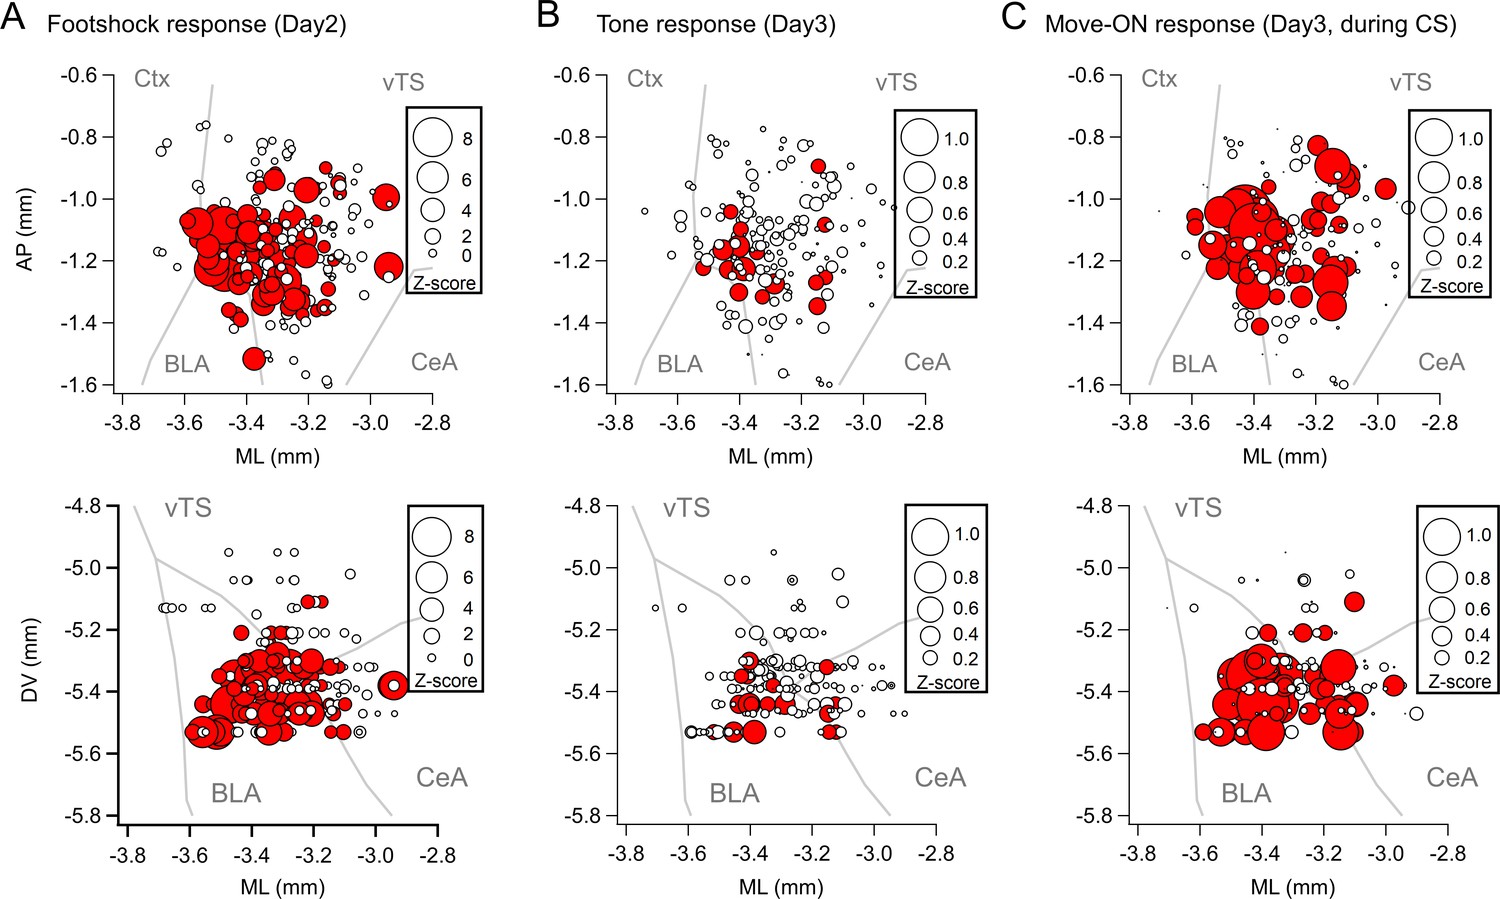
Spatial localization of the imaged D1R+ vTS neurons, and overlap of neurons coding for sensory events and movement state.
(A–C) Maps with the position of all imaged D1R+ vTS neurons, plotted as projection on the horizontal plane. Shown are the footshock-responses (A), the tone (CS) responses as imaged on day3 (B), and the movement-onset responses imaged on day 3 (C). Neurons are drawn in red when their response was considered significant (average Z-score >1 for footshock responses; average Z-score >0.2 for tone, and movement - ON responses; note different scales of the circles). For a coarse orientation, outlines of the amygdalar nuclei (basolateral amygdala; ‘BLA’ and central amygdala, ‘CeA’) and cortex (‘Ctx’) are shown. (D) Venn diagrams showing the overlap of neuronal populations within the D1R+ vTS neurons that respond to tones (green), to movement-ON events (blue), and to footshock stimulation (red; on day 2 only). Note the increased number of neurons responding to tones and movement - onset during fear memory recall, and the overlap of these sub-populations (right panel).
Figure 2—figure supplement 1
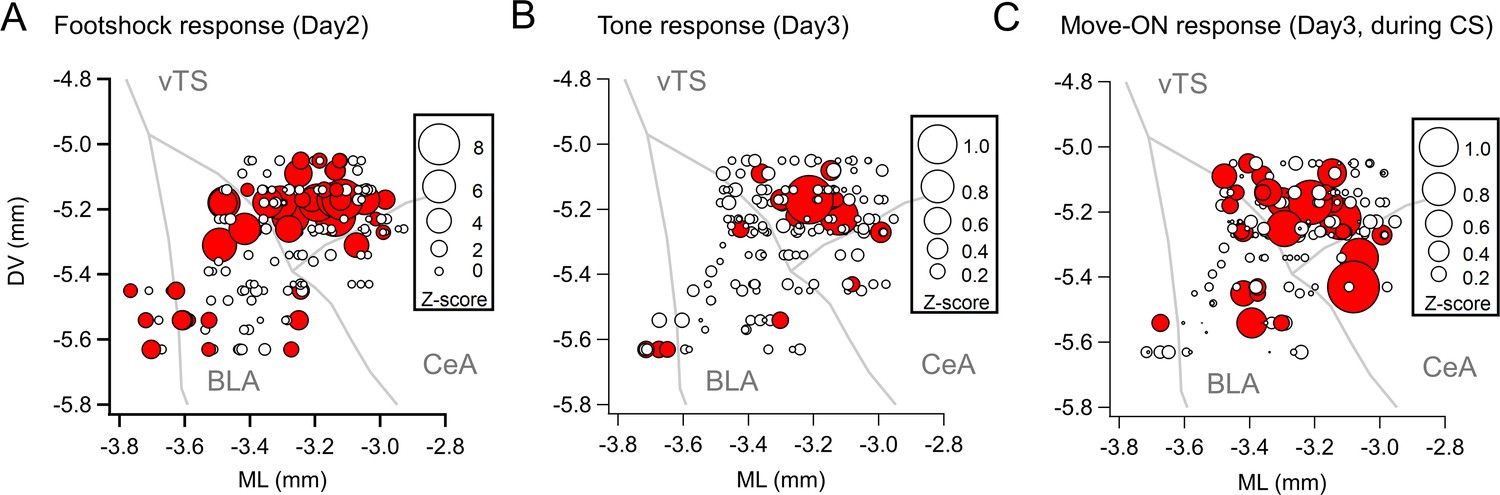
Maps with the position of the imaged D1R+ neurons, plotted as a projection onto the coronal plane.
Same data as in Figure 2A–C, but here plotted as a projection onto the coronal plane, to illustrate the dorso-ventral distribution of imaged neurons. Note that the apparent localization of neurons in BLA and CeA is an artifact of the projection of the 3D data, and that the different a-p locations of these neurons has to be taken into account (see Figure 2A–C).
Figure 3 with 4 supplements
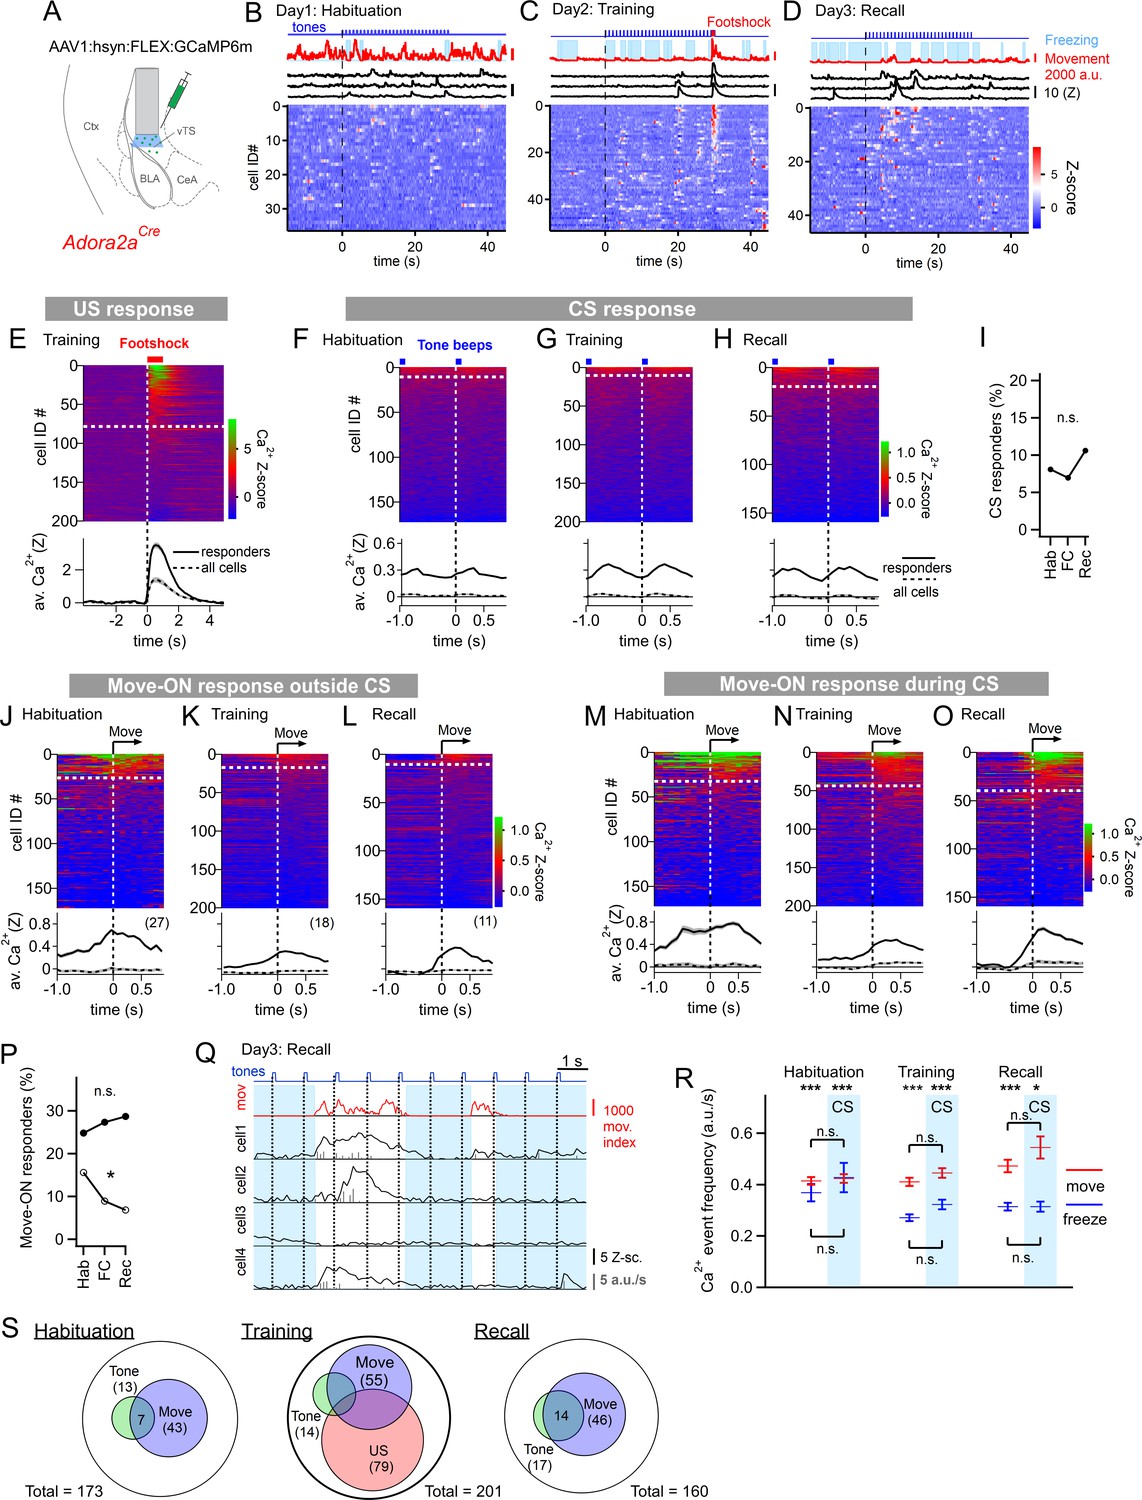
Adora+ neurons in the vTS code for footshocks and movement onset, but CS coding is less present.
(A) Experimental scheme of the injection of an AAV vector and placement of the GRIN lens in Adora2aCre mice. (B–D) Movement traces - and freezing-state of an example mouse (red traces and light blue areas, respectively), Z-scored Ca2+ traces for three example neurons (black traces); and color-coded Z-scored Ca2+ traces for all neurons in one example mouse (bottom). Data are from the second CS presentation of day 1 (D), the fourth CS-US presentation of day 2 (E), and the second CS presentation on day 3 (F). (E) Z-scored Ca2+ responses to footshocks in all imaged Adora+ neurons from N=8 mice; responses with average Z>1 in the interval of [0; 1 s] were considered as significant (traces above dashed white line). The bottom panel shows the average ± S.E.M. of Ca2+ traces for all responders (n=79 neurons; black trace ± gray shades), and the average ± S.E.M. across all neurons (n=201; dashed black trace ± gray shades). (F – H). Color-coded Z-scored Ca2+ traces aligned to tone beeps (CS) during the habituation day, training day, and recall day (F, G, H, respectively). Responses with average Z-score >0.2 in the time interval of [0; 0.5 s] were considered significant; the black traces in the lower panel were calculated as in (E). (I) Percentage of tone-responsive neurons for each day. (J - L). Ca2+ responses to movement-ON events, analyzed outside the CS blocks, for the habituation-, training-, and recall days (J, K, and L, respectively). The top and bottom panels follow the same logics as in (E). (M - O) Ca2+ responses to movement-ON events, analyzed during the 30 s tone blocks (CS), for the habituation, training, and recall days as indicated. (P) Percentage of movement - ON responders in the presence and absence of a CS (closed, and open symbols). (Q) Illustration of the Ca2+ deconvolution approach for four example neurons in a Adora2aCre mouse. From top to bottom, times of tone beeps (blue trace); movement index (red trace); and Ca2+ traces from four example neurons; times of freezing are highlighted by light blue. Vertical gray bars indicate the timing and amplitude of the detected Ca2+ events. (R) The amplitude-weighted frequency of Ca2+ events (average ± S.E.M.), analyzed separately for the four combinations of CS / no CS times, and movement / freezing states of the mice, for the 3 fear learning days. The presence of a CS is indicated by the blue bars. The p-values for the indicated statistical comparisons are reported in the Results text. (S) Venn diagrams showing the overlap of neuronal populations within the Adora+ vTS neurons that respond to tones (green), to movement-onset transitions (blue), and to footshock stimulation.
-
Figure 3—source data 1
Raw data and statistical tests for Figure 3 and its supplements.
- https://cdn.elifesciences.org/articles/75703/elife-75703-fig3-data1-v2.xlsx
Figure 3—figure supplement 1
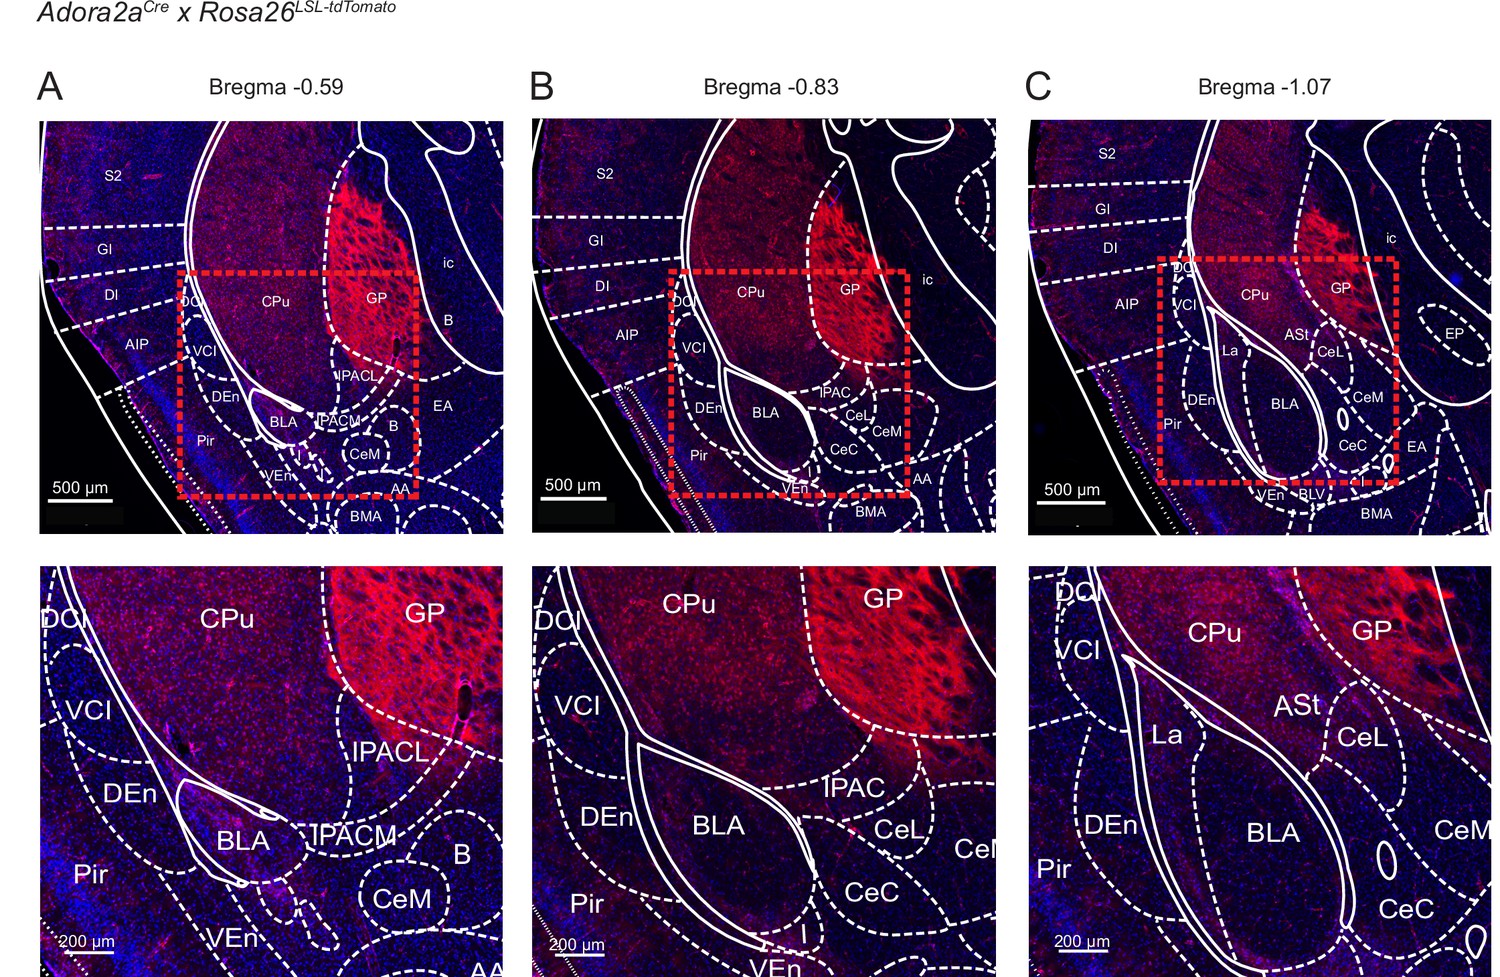
Localization of Cre-expressing cells in the vTS of Adora2aCre x Rosa26LSL-tdTomato mice.
Adora2aCre mice were bred with the Rosa26LSL-tdTomato reporter line, to drive the expression of tdTomato in Cre-positive neurons. Shown is every 6th section (40 µm thickness) at three relevant a-p levels on the level of the posterior striatum (A, B, C). Mouse brain atlas images, at their indicated Bregma levels, were overlaid (Franklin and Paxinos, 2016). Note the localization of Adora+ neurons in the vTS (labeled ‘CPu’ for caudate putamen), and the presence of axons in the globus pallidus, external segment (GPe).
Figure 3—figure supplement 2
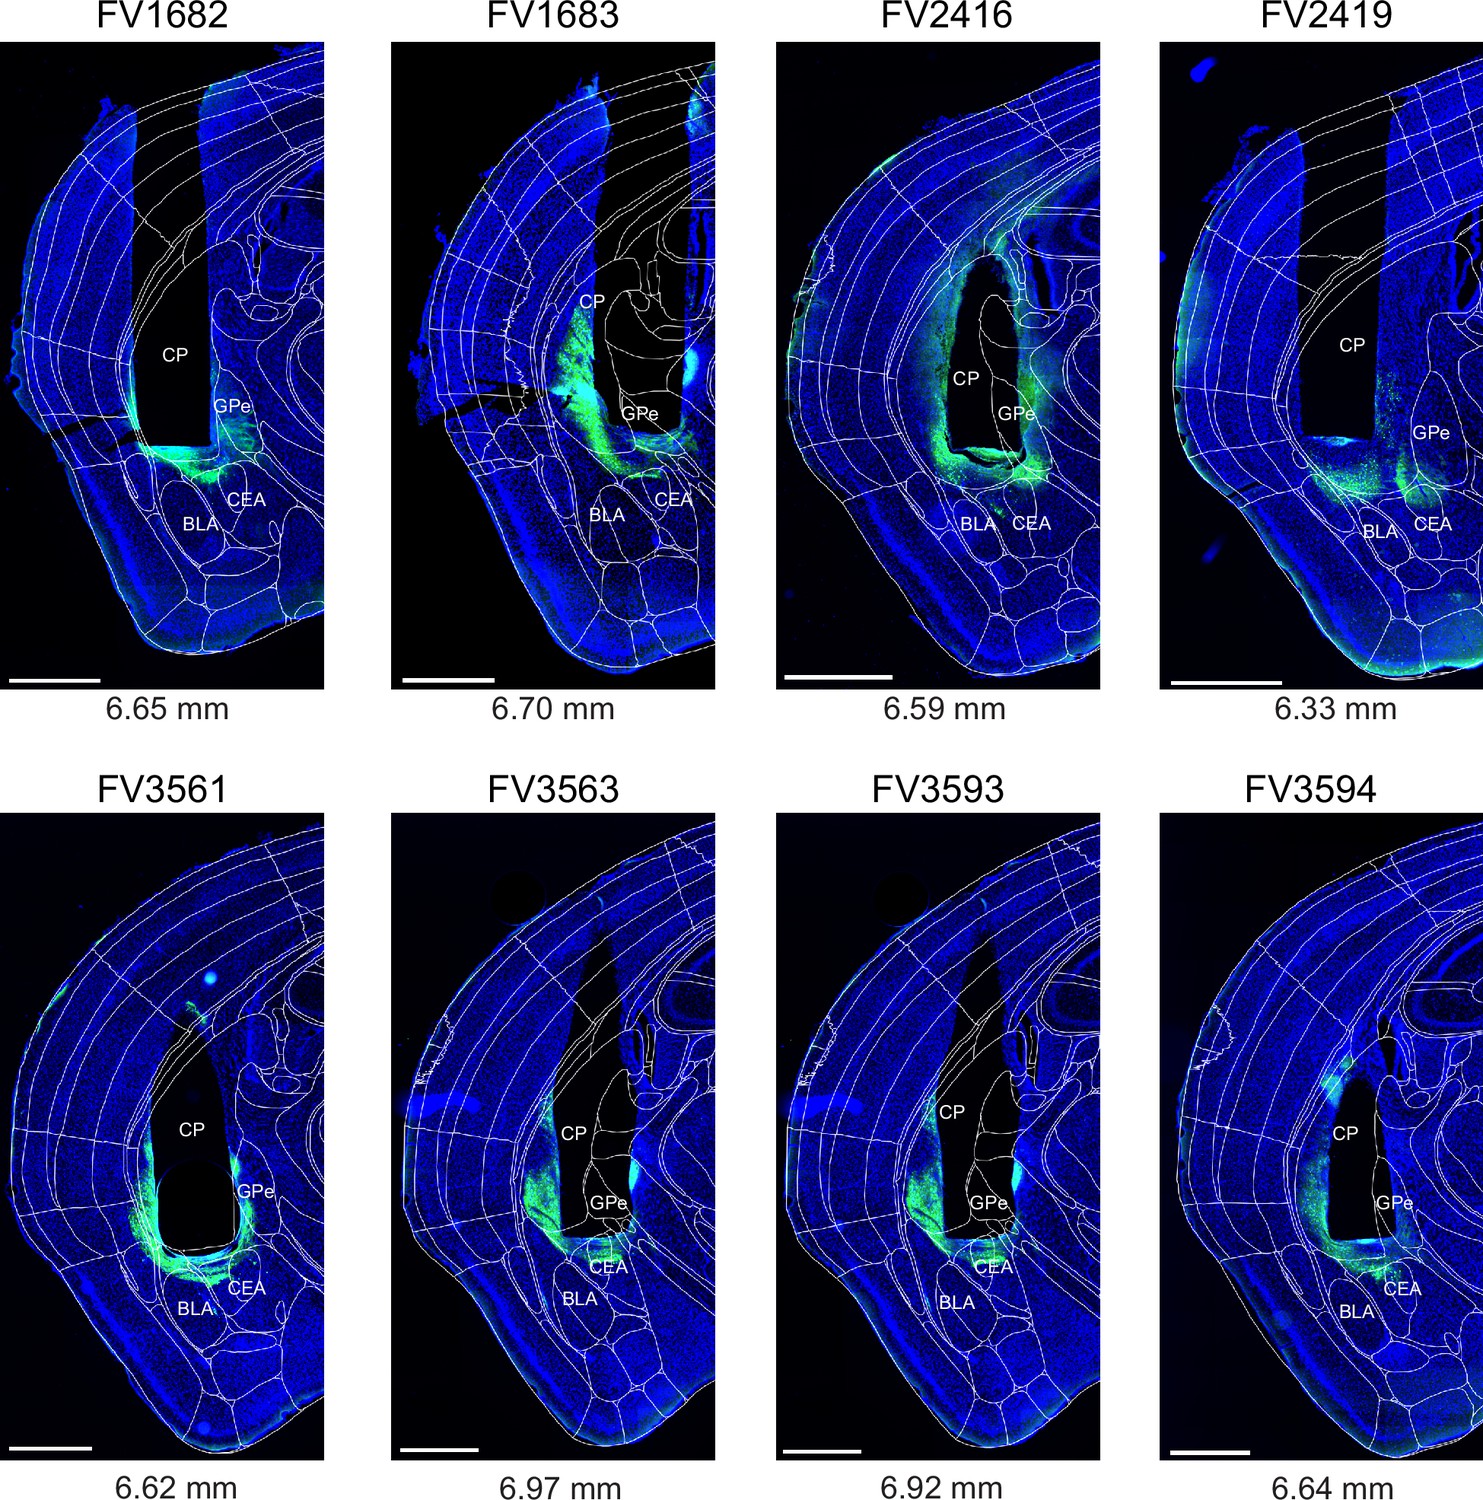
Post-hoc histology of GCaMP6m expression and GRIN lens placement in Adora2aCre mice.
Images of the brain sections containing a cross-section through the center of GRIN lens aperture (black non-fluorescent hues in each image) are shown for each Adora2aCre mouse (N=8) from the experiment shown in Figure 3. The fluorescence of GCaMP6m (green channel) and DAPI (blue) was imaged in a slide scanner (see Materials and methods). The outlines of the Allen Brain Atlas are overlaid (white lines), after registration to the image using ABBA alignment tool (see Materials and methods). Numbers below each panel indicate a-p positions of the GRIN lens aperture centers in the Allen Brain Atlas space. Codes above each panel refer to the mouse identification number. Scale bars, 1 mm.
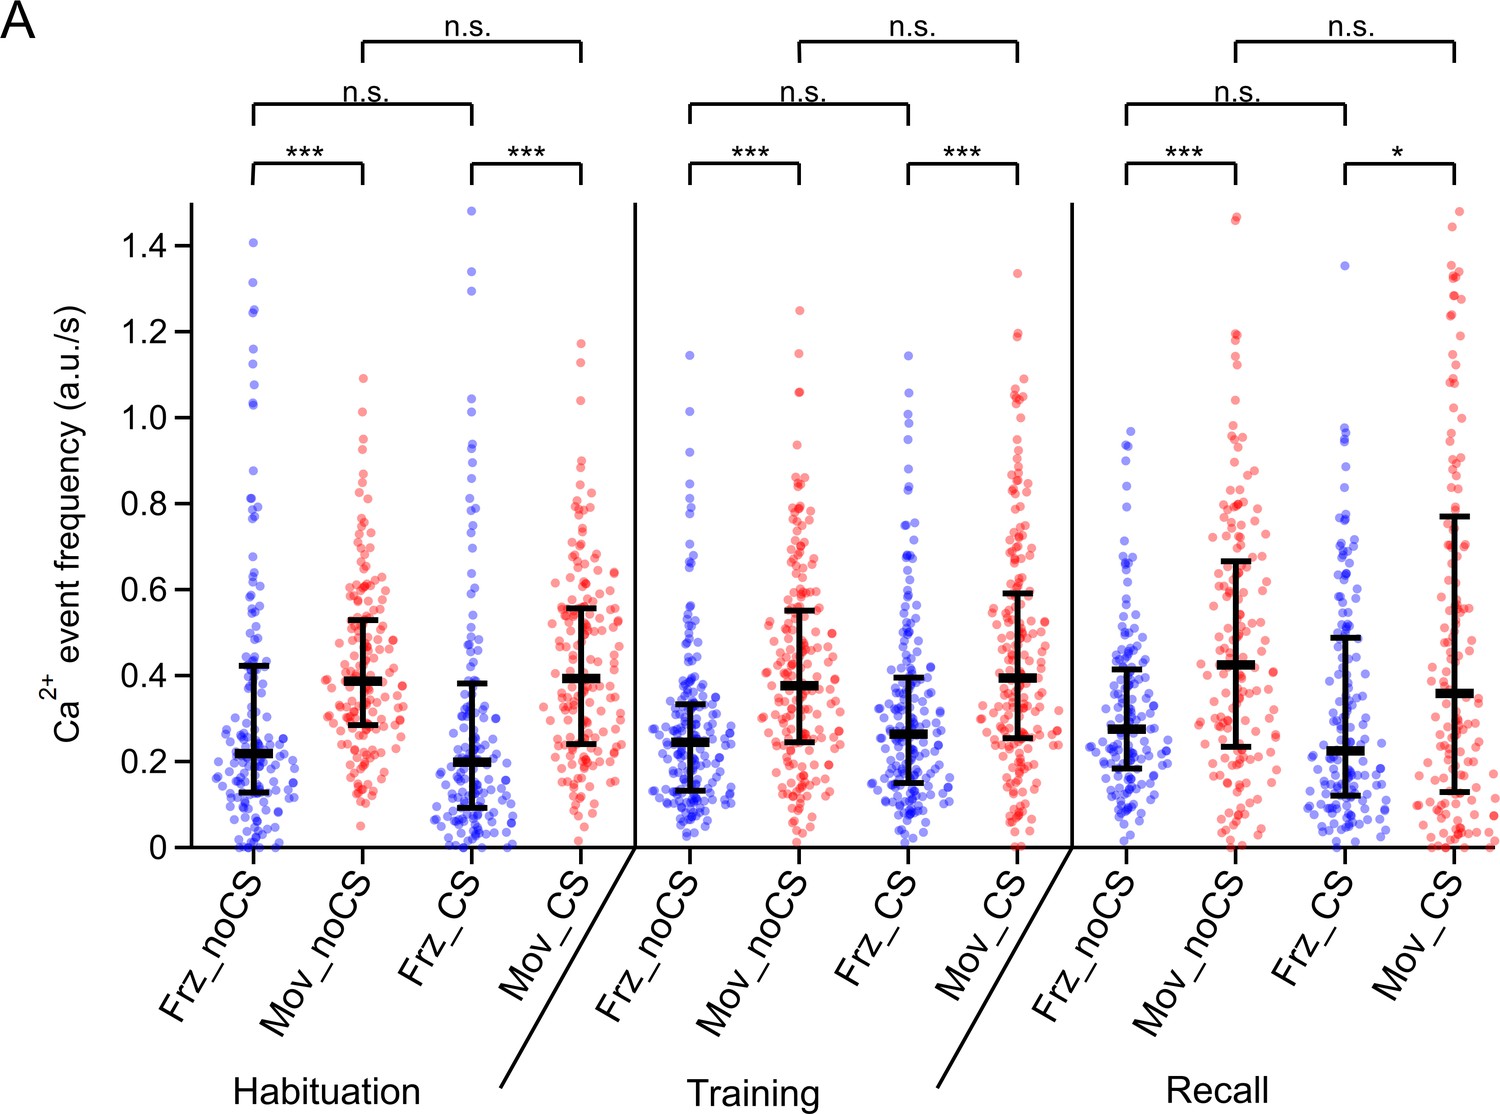
Figure 3—figure supplement 3
Individual data points and statistical comparison for the Ca2+ event frequencies for four different conditions.
The amplitude-weighted Ca2+ event frequency of the data in Figure 3R are re-plotted together with their underlying individual data points from each imaged neuron (n=173, 201, and 160 on the habituation-, training-, and recall day, respectively). Here, the medians of each distribution (horizontal bars) and the 25–75% interquantile ranges (vertical bars) are indicated. Abbreviations: Frz_noCS: freezing, in the absence of CS; Mov_noCS: movement, in the absence of CS; Frz_CS: freezing, during the CS; Mov_CS: movement, during the CS. The p-values of the statistical comparisons are (post-hoc Dunn’s multiple comparison tests, following Kruskal-Wallis test; KW = 184.6; p<0.0001): (1) Habituation day: Frz_noCS vs Mov_noCS, p<0.0001; Frz_noCS vs Frz_CS, p>0.99; Mov_noCS vs Mov_CS, p>0.99; Frz_CS vs Mov_CS, p<0.0001. (2) Training day: Frz_noCS vs Mov_noCS, p<0.0001; Frz_noCS vs Frz_CS, p>0.99; Mov_noCS vs Mov_CS, p>0.99; Frz_CS vs Mov_CS, p<0.0001. (3) Recall day: Frz_noCS vs Mov_noCS, p=0.0004; Frz_noCS vs Frz_CS, p>0.99; Mov_noCS vs Mov_CS, p>0.99; Frz_CS vs Mov_CS, p=0.012. See also Statistics table for Figure 1, for more details on p-values and further statistical parameters.
Figure 3—figure supplement 4
Maps with the position and Ca2+ signal intensity of the imaged Adora+ vTS neurons.
Data from N=8 Adora2aCre mice is plotted for the US - responses on the training day, tone (CS) responses on the recall day, and movement-ON responses on the recall day (A, B, and C respectively). The maps in the upper and lower panels are plotted as projections onto the horizontal and coronal plane, respectively. Note that the apparent localization of neurons in BLA and CeA, especially in the 'coronal section' views shown in the lower panels, is an artifact of the projection of the 3D data. Indeed, the different a-p locations of the neurons has to be taken into account to assess their true location (see upper panels).
Figure 4 with 4 supplements
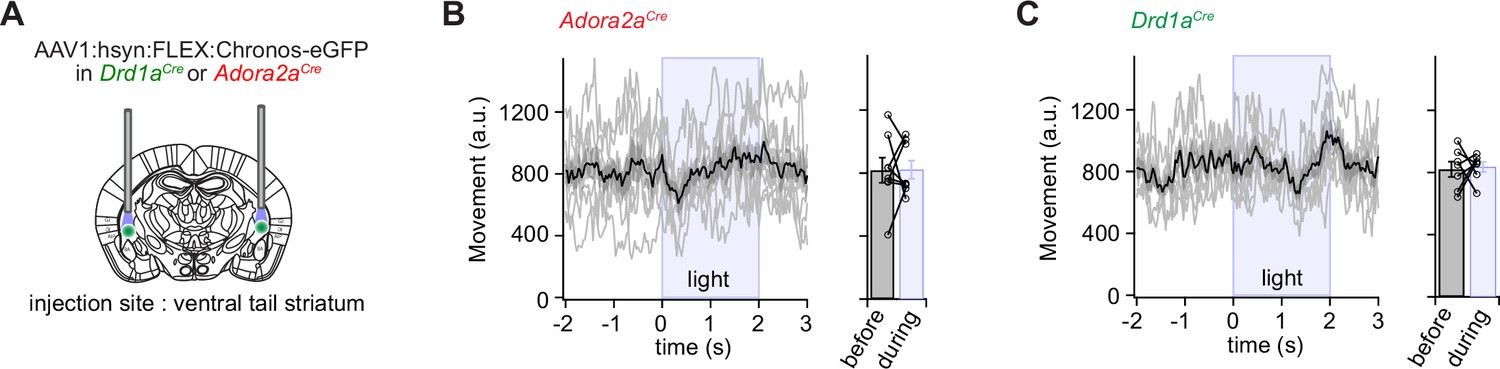
Optogenetic stimulation of D1R+ and Adora+ vTS neurons has no direct effect on movement.
(A) Scheme showing the bilateral placement of optic fibers over each vTS, and the injection of an AAV vector driving the Cre-dependent expression of Chronos. (B) Left, Adora2aCre mice expressing Chronos in Adora+ neurons of the vTS were allowed to explore the fear conditioning chamber, and six trains of blue light stimuli (50 pulses of 1ms length, 25 Hz) were applied. The average movement indices for N=8 mice are shown, centered around the time of light stimulation. Right, individual and average movement data for N=8 mice, for 2 s intervals before and during optogenetic stimulation. (C) Analogous experiment to the one in (B), now performed for Drd1aCre mice expressing Chronos in a Cre-dependent manner in the vTS (N=7 mice). Note that optogenetic stimulation of neither Adora+ neurons (B), nor of D1R+ neurons led to notable changes in the movement of mice (see Results for the statistical parameters).
-
Figure 4—source data 1
Raw data and statistical tests for Figure 4 and its supplements.
- https://cdn.elifesciences.org/articles/75703/elife-75703-fig4-data1-v2.xlsx
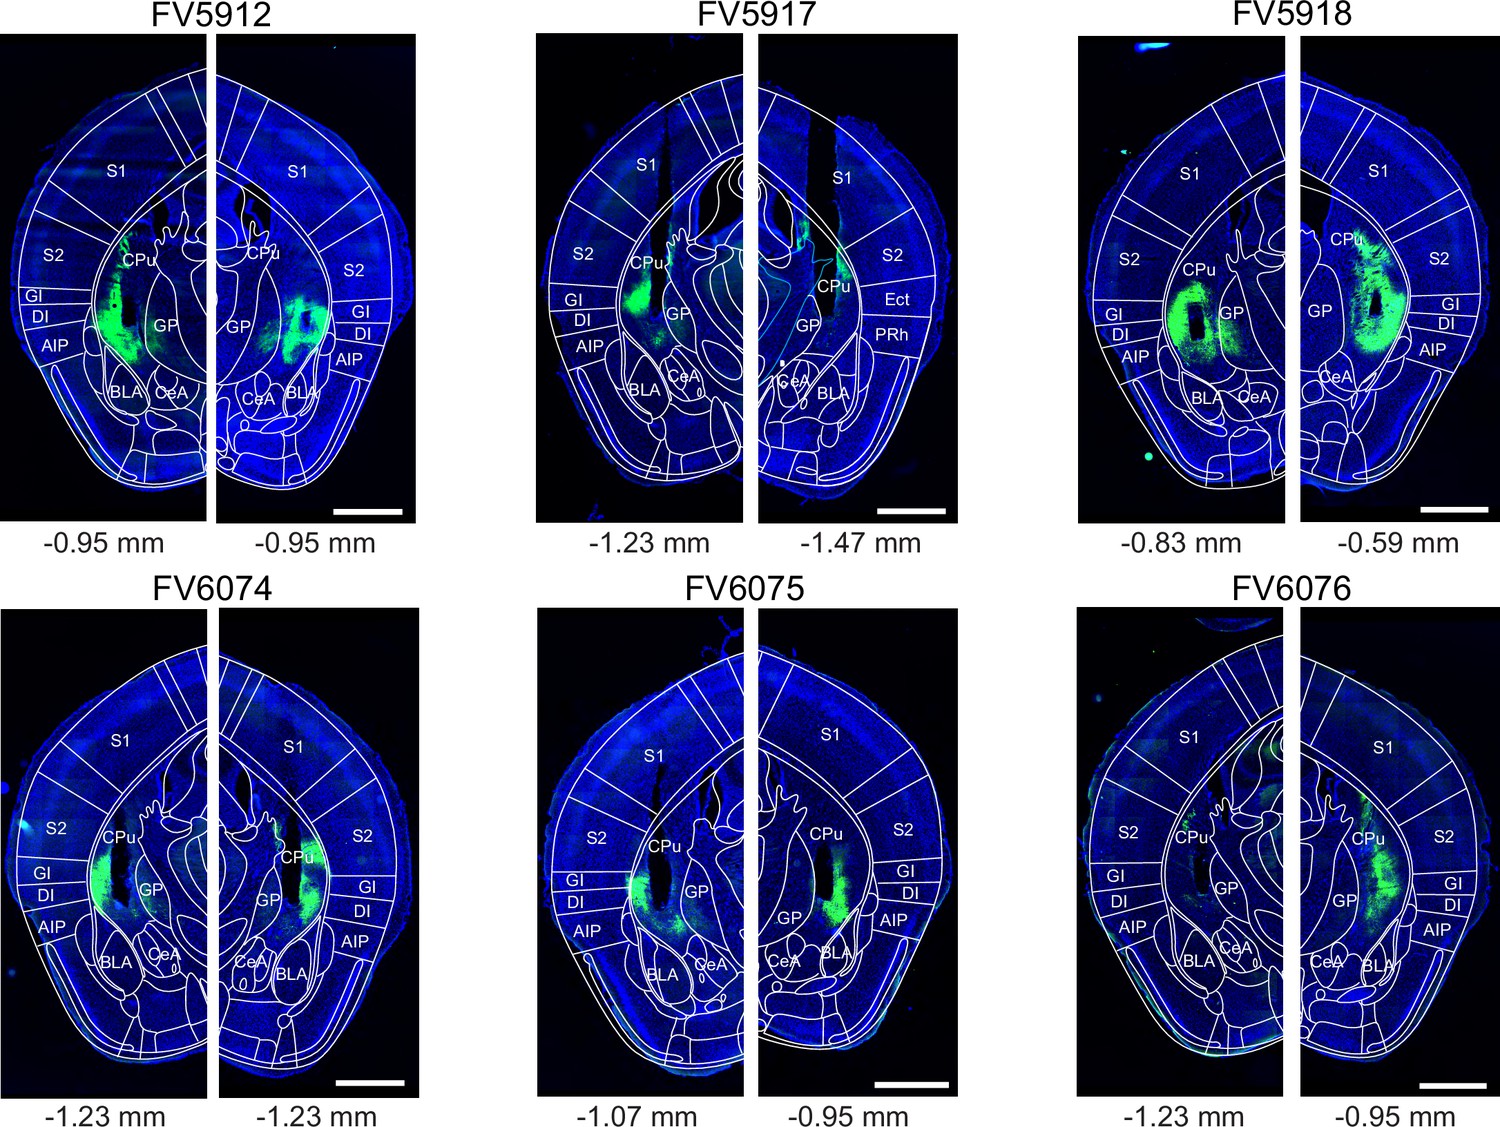
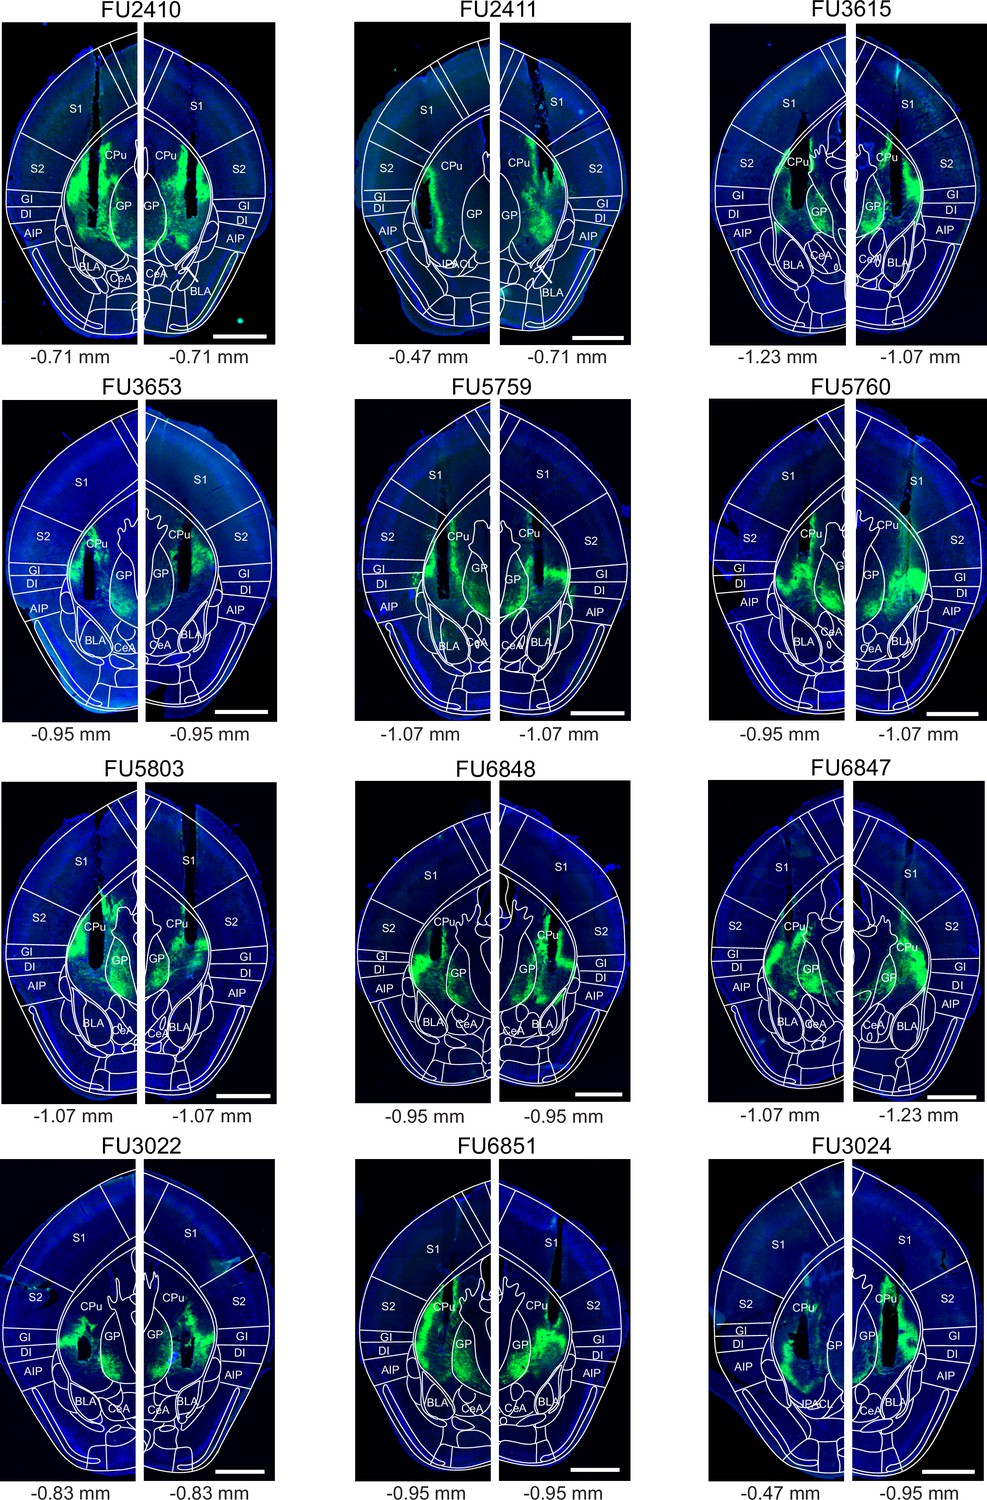
Figure 4—figure supplement 1
Post-hoc histology of Chronos expression and optic fiber placement in Adora2aCre mice.
Fluorescent slide scanner images of the Adora2aCre brain sections containing the end point of the optic fiber (black non-fluorescent hues in each image) for each brain side for each mouse (N=8) from the experiment shown in Figure 4A and B. Arch-eGFP is shown in green channel, DAPI is in blue. On each image, the mouse brain atlas outline of the estimated corresponding a-p position was superimposed (see indicated bregma values below each panel; Franklin and Paxinos, 2016). Codes above each panel refer to the mouse identification number. Scale bars, 1 mm.
Figure 4—figure supplement 2
Post-hoc histology of Chronos expression and optic fiber placement in Drd1aCre mice.
Fluorescent slide scanner images of the Adora2aCre brain sections containing the end point of the optic fiber (black non-fluorescent hues in each image) for each brain side for the mice from the experiment shown in Figure 4A and C. Arch-eGFP is in green, DAPI is in blue. On each image, the mouse brain atlas outline of the estimated corresponding a-p position was superimposed (see indicated bregma values below each panel; Franklin and Paxinos, 2016). Codes above each panel refer to the mouse identification number. Scale bars, 1 mm.
Figure 4—figure supplement 3
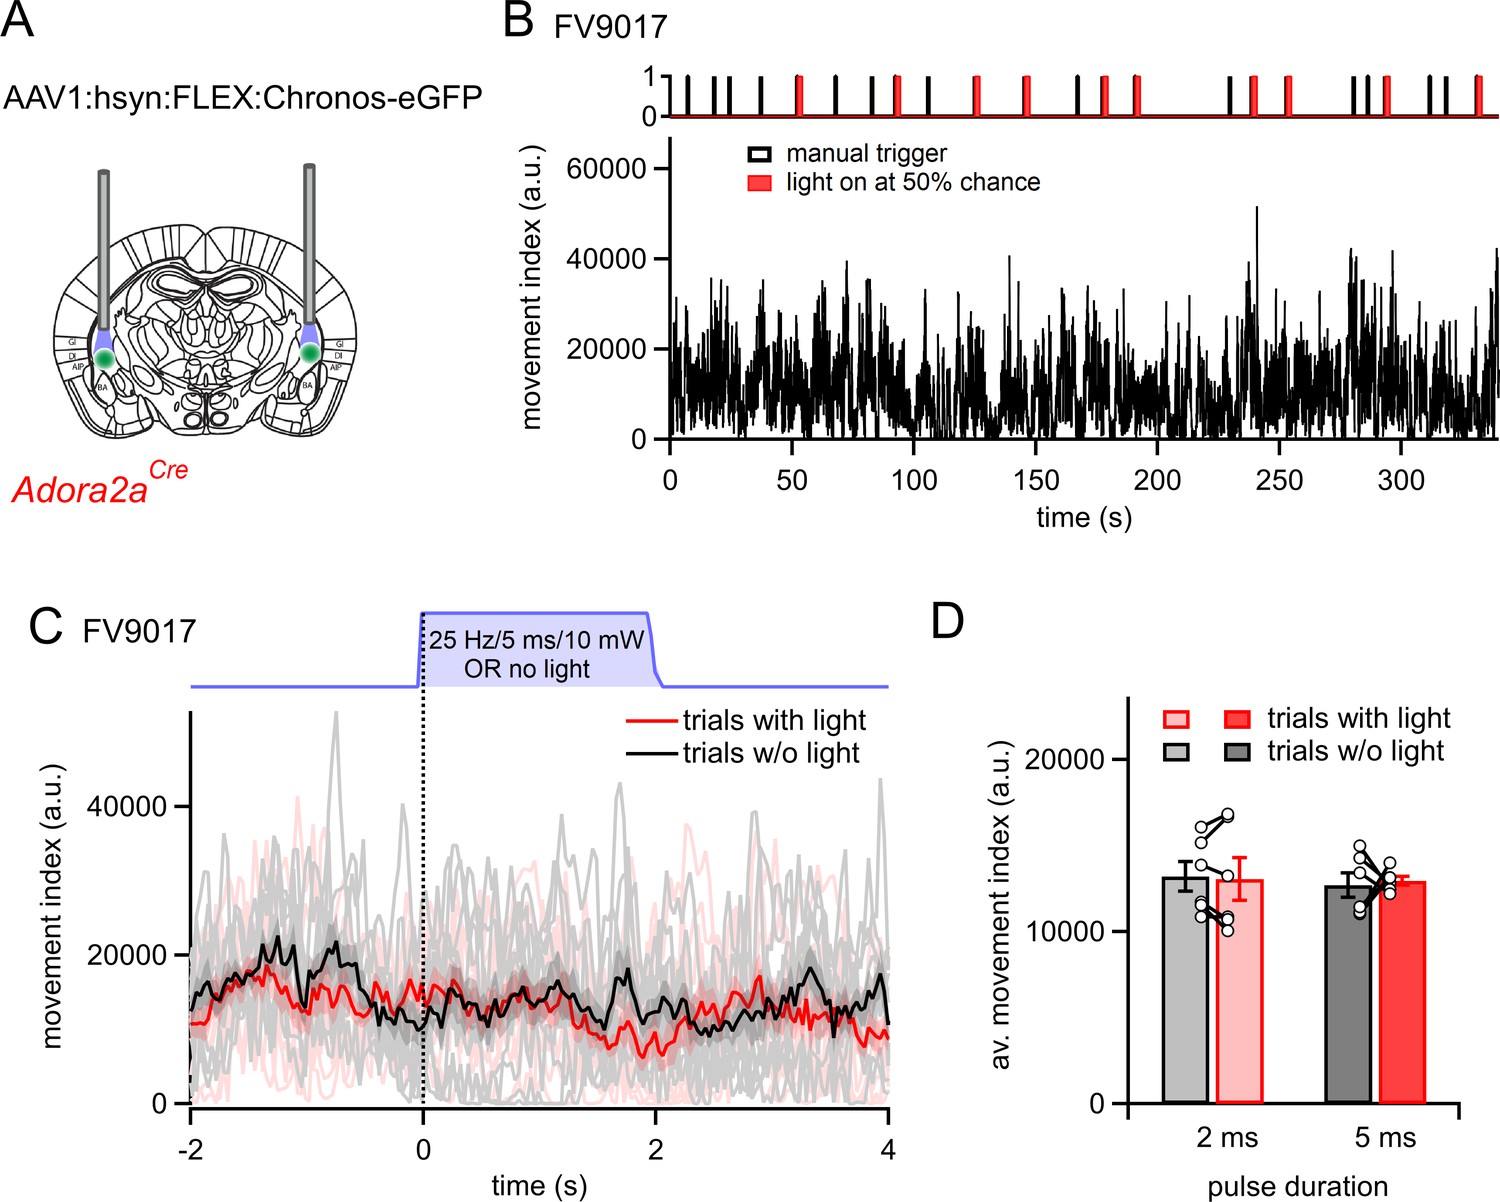
Additional optogenetic stimulation experiments with longer pulse widths.
(A) Scheme of the experimental approach. In this series of experiments, N=6 Adora2aCre mice were prepared for bilateral optogenetic stimulation experiments in the vTS in the same manner as in Figure 4, but longer durations blue light pulses were used (2 - and 5ms). (B) Example movement traces of one mouse. Trains of blue light stimuli (2ms pulse width; repeated at 25 Hz for 2 s) were triggered by the experimenter; however, the chance that a light stimulus occurred was determined randomly by the Ethovision XT 13 software at a 50% chance level. (C) Overlay of movement traces in the same mouse as in (B), separated for events in which a light stimulus occurred (pink individual traces, and red average trace), and events in which no stimulus occurred (gray, and black traces). Note that light stimuli (red trace) did not change the movement index of the mice in any obvious way. (D) Quantification for N=6 mice. There was no significance difference between the movement index during trials with light as compared to trials without light, neither for pulses with 2ms duration, nor for pulses with 5ms duration (p=0.75, t5=0.331, and p=0.80, t5=0.27; paired t-test).
Figure 4—figure supplement 4
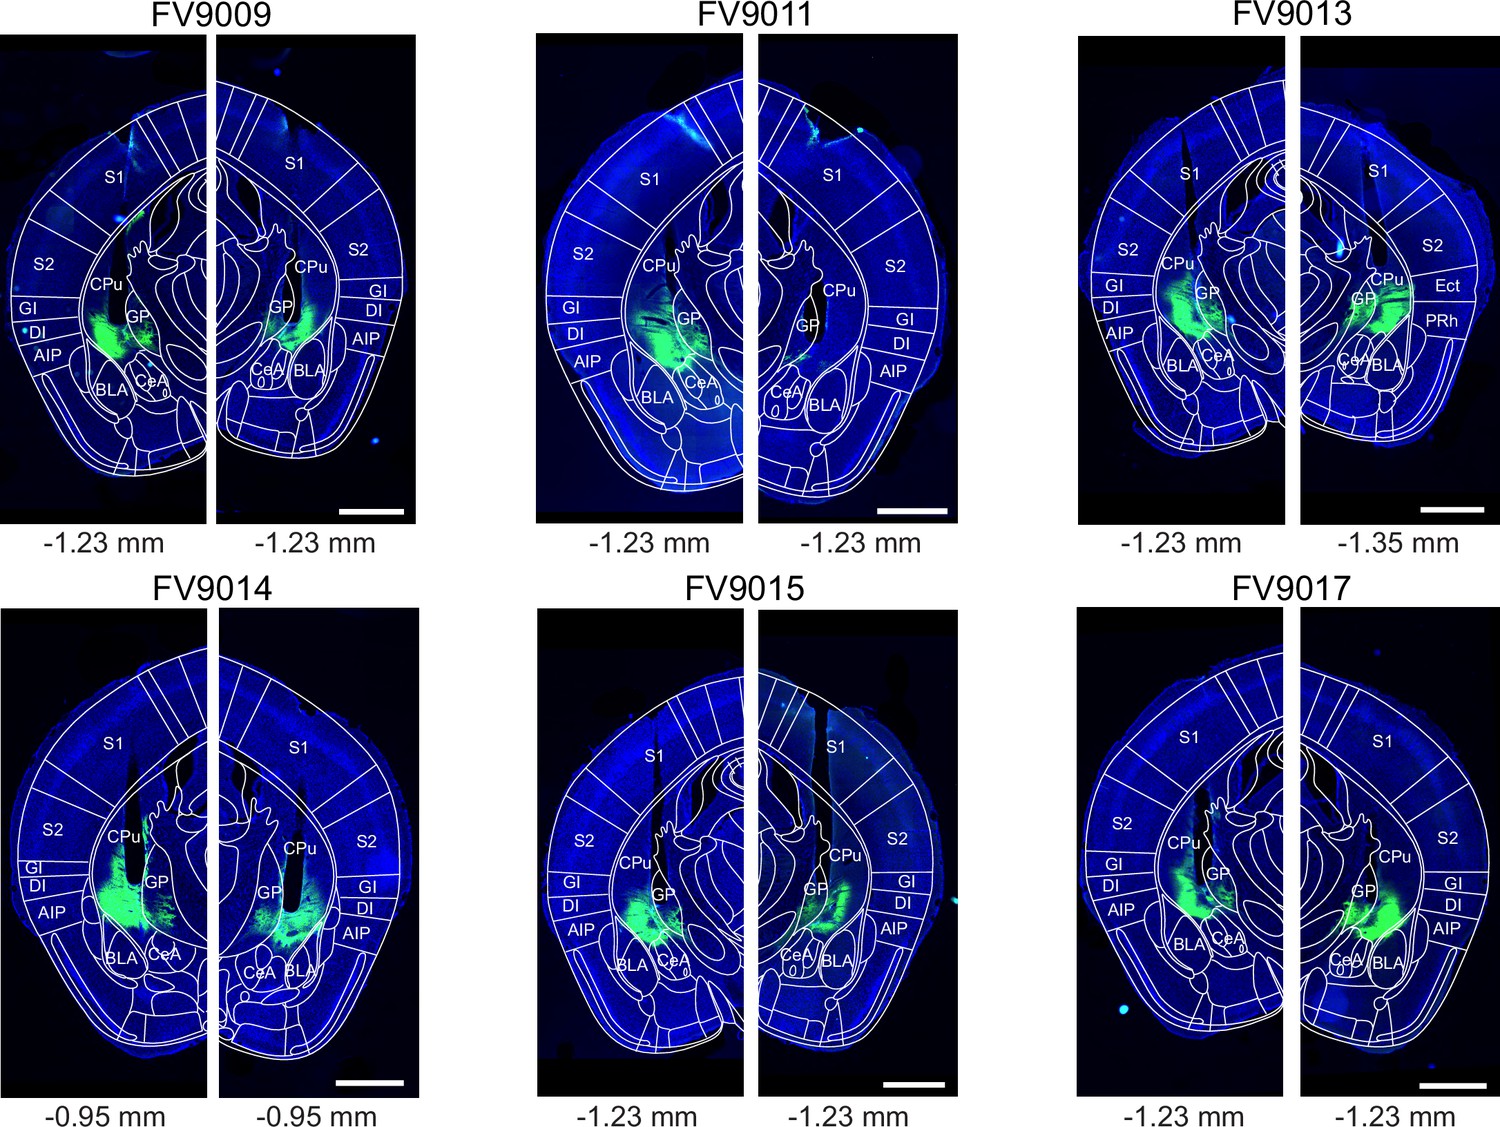
Post - hoc histology of Chronos expression and optic fiber placement, for the additional experiments with Adora2aCre mice.
Fluorescent slide scanner images of the Adora2aCre brain sections containing the end point of the optic fiber (black non-fluorescent hues in each image) for each brain side for each mouse (N=6) from the additional stimulation experiment using prolonged light pulses (see Figure 4—figure supplement 3). Arch-eGFP is shown in green channel, DAPI is in blue. On each image, the mouse brain atlas outline of the estimated corresponding a-p position was superimposed (see indicated bregma values below each panel; Franklin and Paxinos, 2016). Codes above each panel refer to the mouse identification number. Scale bars, 1 mm.
Figure 5 with 2 supplements

Optogenetic inhibition of D1R+ vTS neurons during footshock reduces the formation of an auditory-cued fear memory.
(A) Scheme showing the bi-lateral injection in Drd1aCre mice of an AAV vector driving the expression of either Arch or eGFP (for controls), and the placement of optic fibers over each vTS. (B) Behavioral paradigm outlining the 3-day fear learning protocol, and the application of yellow light during the footshock presentation on the training day. (C) Freezing levels during 30 s CS presentations on the habituation day for the control mice (expressing eGFP; black circles), and for Arch-expressing mice (green circles). (D) Time-binned average percent freezing traces for control mice (black data) and Arch-expressing mice (green data; bin width is 10 s in both cases). Light blue boxes indicate the 30 s CS presentation periods. Gray bars (bottom) indicate epochs of ‘no CS’ analysis. Vertical orange lines indicate the times of footshock presentation. (E) Quantification of freezing during the training day for the control mice and Arch-expressing mice (black and green data, respectively). Freezing was averaged during the 30 s CS presentations (filled circles, left) and for the no CS epochs (open circles, right). (F) Time-resolved freezing during the cued retrieval on day 3. Note the increases in freezing driven by each CS presentation in control mice (black trace, average of N=10 eGFP expressing mice), which were smaller in amplitude in Arch-expressing mice (N=12, green trace). Light blue areas and gray bars (bottom) indicate times of CS presentation, and epochs of ‘no CS’ analysis, respectively. (G) Quantification of freezing during the 30 s CS presentation (left) and during the no CS epochs (right). Note the significant reduction of freezing during the CS in the Arch group (see Results for statistical parameters).
-
Figure 5—source data 1
Raw data and statistical tests for Figure 5 and its supplements.
- https://cdn.elifesciences.org/articles/75703/elife-75703-fig5-data1-v2.xlsx
Figure 5—figure supplement 1
Post-hoc histology of Arch expression and optic fiber placement in Drd1aCre mice.
Following experiments (Figure 5), the brains of Drd1aCre mice were fixed by transcardial perfusion with paraformaldehyde (PFA), and 40 µm coronal sections were prepared. The fluorescence of Arch-eGFP (green channel) and DAPI (blue) was imaged in a slide scanner (see Materials and methods). The section containing the end point of the optic fiber (see black non-fluorescent hues in each image) on each brain side for each mouse is shown (N=12 Arch-expressing Drd1aCre mice of Figure 5). On each image, the mouse brain atlas image of the estimated corresponding a-p position was superimposed (see indicated bregma values below each panel; Franklin and Paxinos, 2016). Codes above each panel refer to the mouse identification number. Scale bars, 1 mm.
Figure 5—figure supplement 2
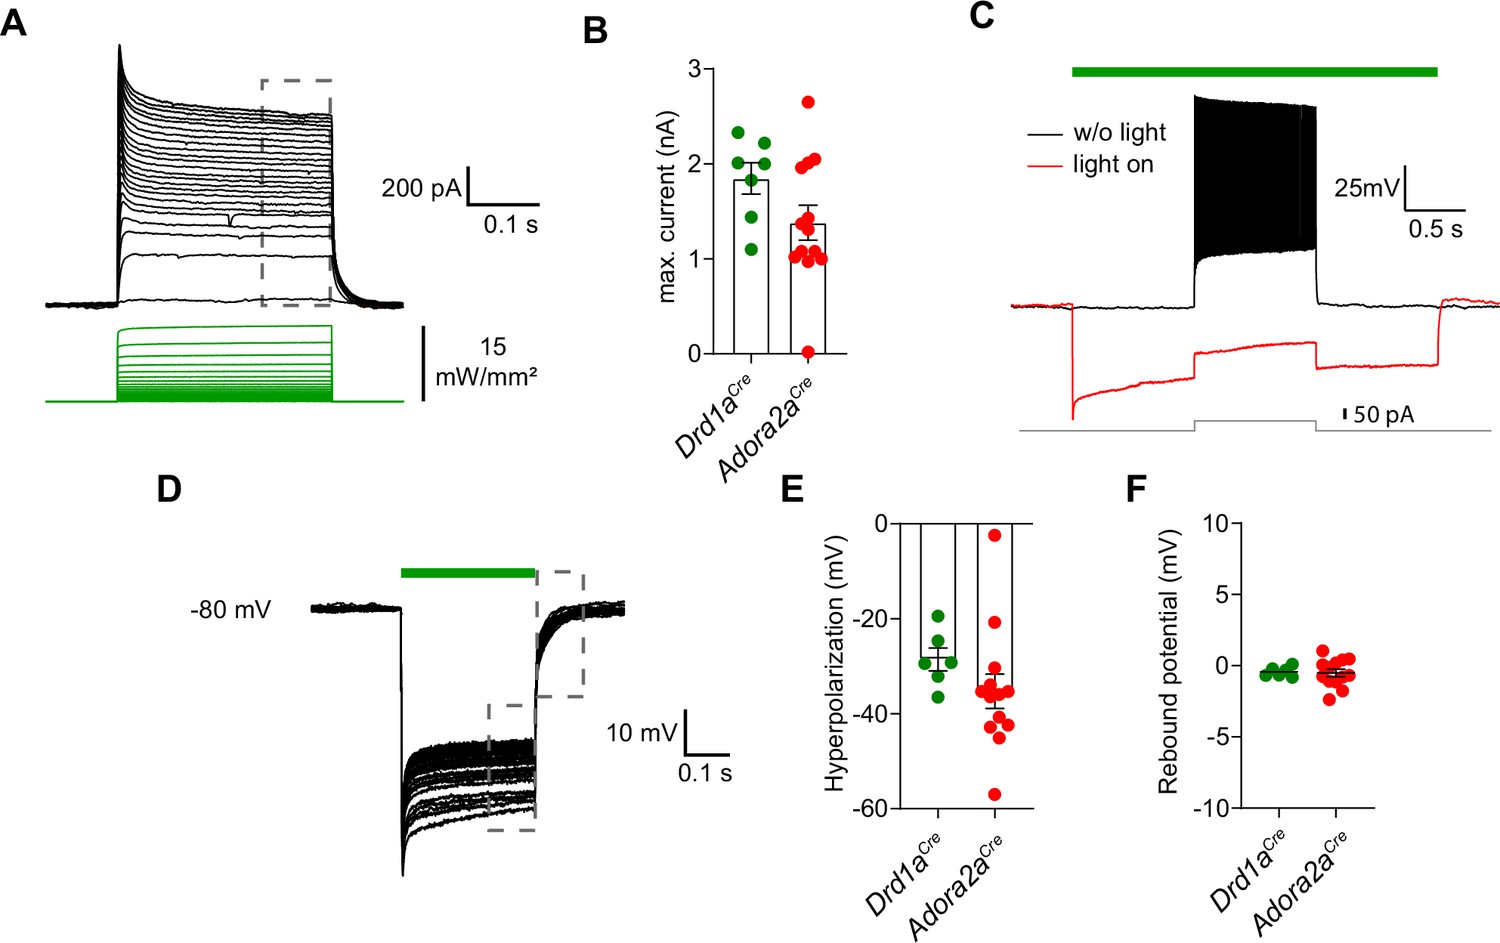
Properties of light-activated archaerhodopsin in D1R+ - and Adora+ vTS neurons.
(A)Drd1aCre x Rosa26LSL-tdTomato mice, or Adora2aCre x Rosa26LSL-tdTomato mice were injected with AAV1:CAG:FLEX:Arch-eGFP AAV vector into the vTS, and patch-clamp recordings of Arch-expressing neurons were performed 3 weeks later in slices of the vTS at 34 °C. Example of light-induced currents evoked by 300ms exposures with increasing light (530 nm) intensities in an Adora+ neuron expressing Arch. Maximal light intensity was 15 mW/mm2; the holding potential was –70 mV. (B) Quantification of the maximal plateau current measured at the end of the light pulse (gray dashed box in A) for D1R+ - (n=7) and Adora+ vTS neurons (n=13) expressing Arch. (C) Example traces recorded in current-clamp showing that light exposure (3 s) was sufficient to block APs generated by a 1 s current injection (no light, black trace; with light, red trace). This observation was made in all neurons recorded under current-clamp. (D–F) Repeated light exposures (300ms pulses at 1 Hz, 30 times) were applied to test for the efficiency of repeated hyperpolarizations, and for possible rebound APs after light offset. Hyperpolarization (E) and rebound potentials (F) were quantified for D1R+ (n=6) and Adora+ vTS neurons (n=13).
Figure 6 with 1 supplement
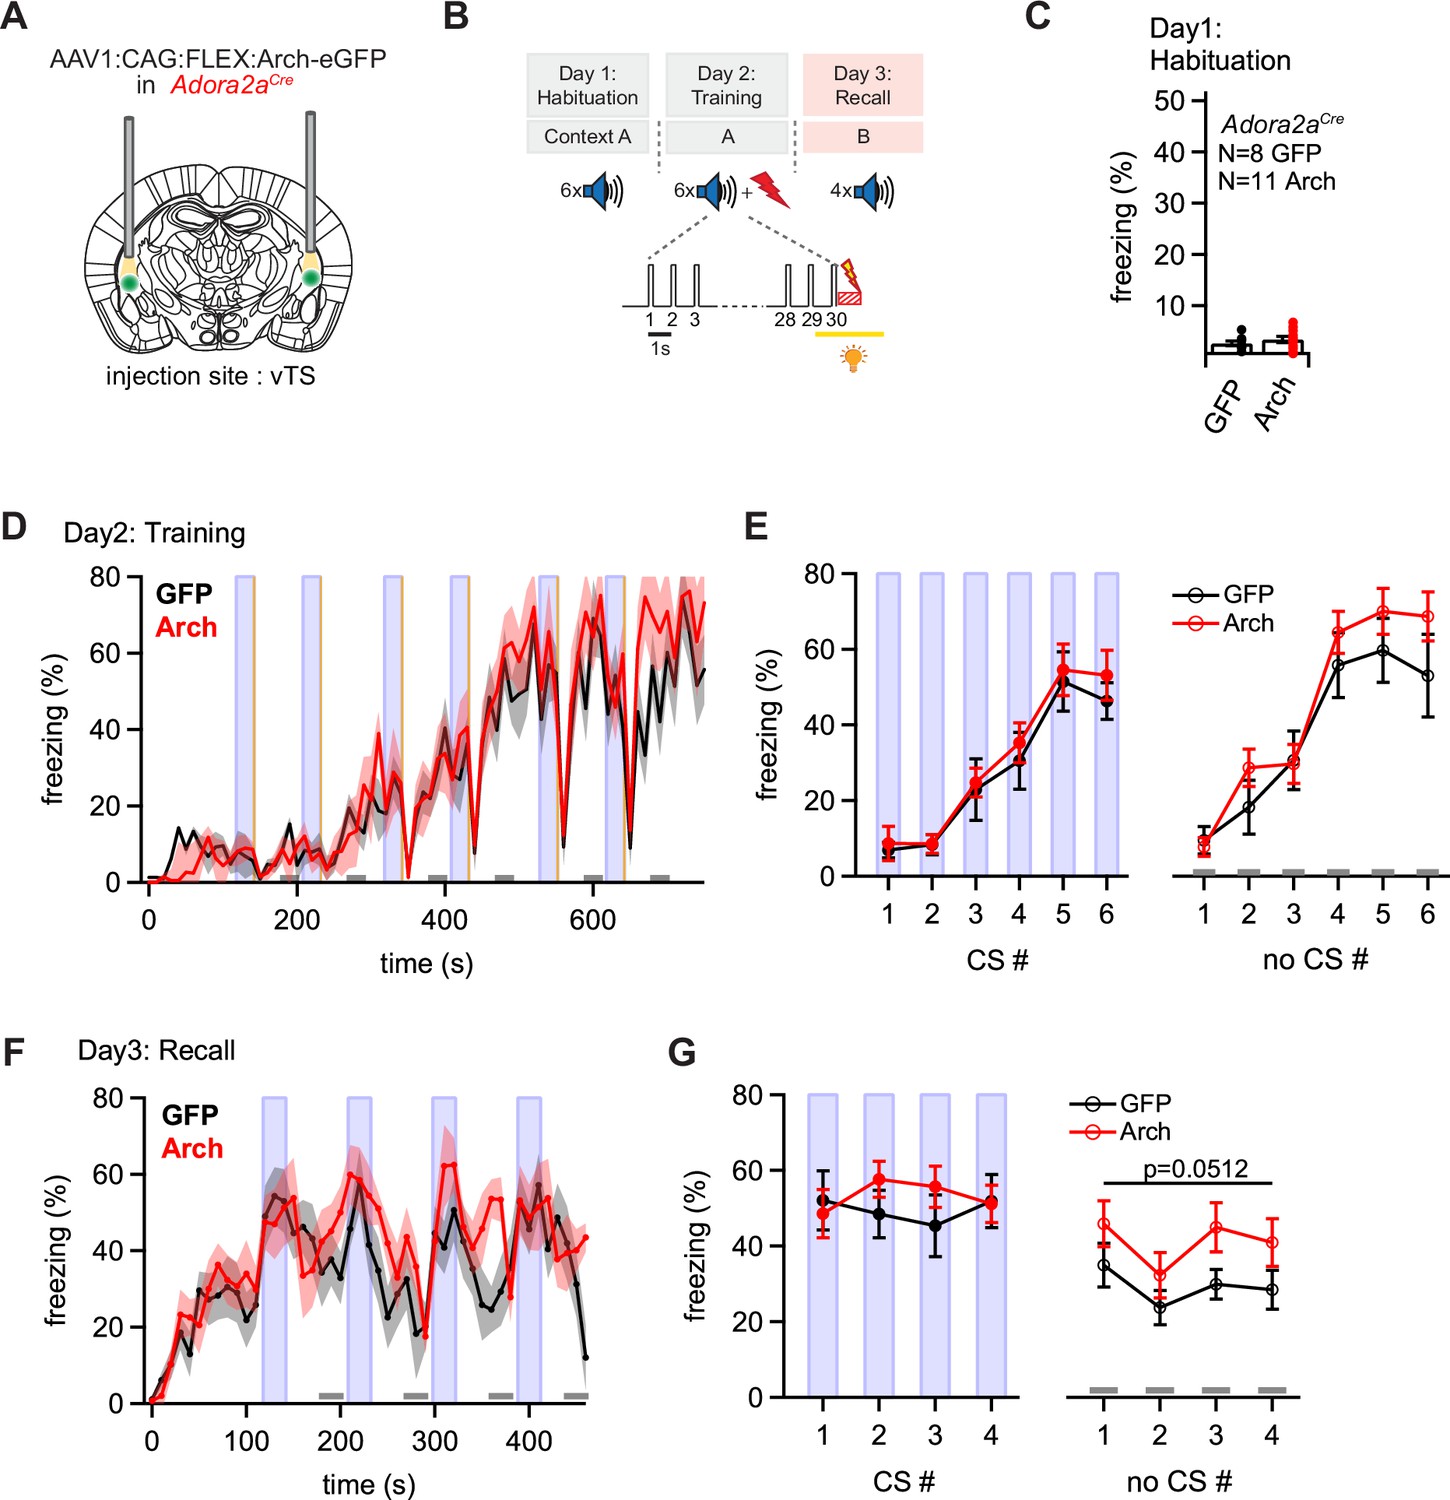
Optogenetic inhibition reveals a role of Adora+ vTS neurons in suppressing freezing in the absence of a learned CS.
(A) Scheme of the experimental approach, during which Arch (or eGFP, for controls) was expressed Cre-dependently in Adora2aCre mice in the vTS, and optic fibers were placed in the vTS above the injection sites. (B) Behavioral paradigm (upper panel), and scheme of the application of yellow light during the footshock stimulus (US) on the training day (lower panel). (C) Freezing levels during CS presentations on the habituation day for mice expressing eGFP (control group; black data) and for Arch-expressing mice (red data). (D) Time-resolved analysis of freezing for control mice (black trace, average of N=8 mice) and Arch-expressing mice (red trace, N=11 mice). The light blue areas and gray bars (bottom) indicate the time of CS presentation, and the time windows for ‘no CS’ analysis. (E) Quantification of freezing during the CS (left), and during the 30 s ‘no CS’ epochs (right), for control mice (black) and for Arch-expressing mice (red). (F) Time-resolved freezing during the fear memory recall day. The light blue areas and gray bars (bottom) indicate the time of CS presentation, and the analysis window for ‘no CS’ analysis. (G) Average percent of time spent freezing, analyzed during the 30 s CS presentations (left), and during the no CS epochs (right) of the fear memory retrieval day, for both groups of mice. There was a trend towards an enhanced freezing in the Arch group at times when no CS was present (right; p=0.0512; two-way repeated measures ANOVA; see Results for further statistical parameters).
-
Figure 6—source data 1
Raw data and statistical tests for Figure 6.
- https://cdn.elifesciences.org/articles/75703/elife-75703-fig6-data1-v2.xlsx
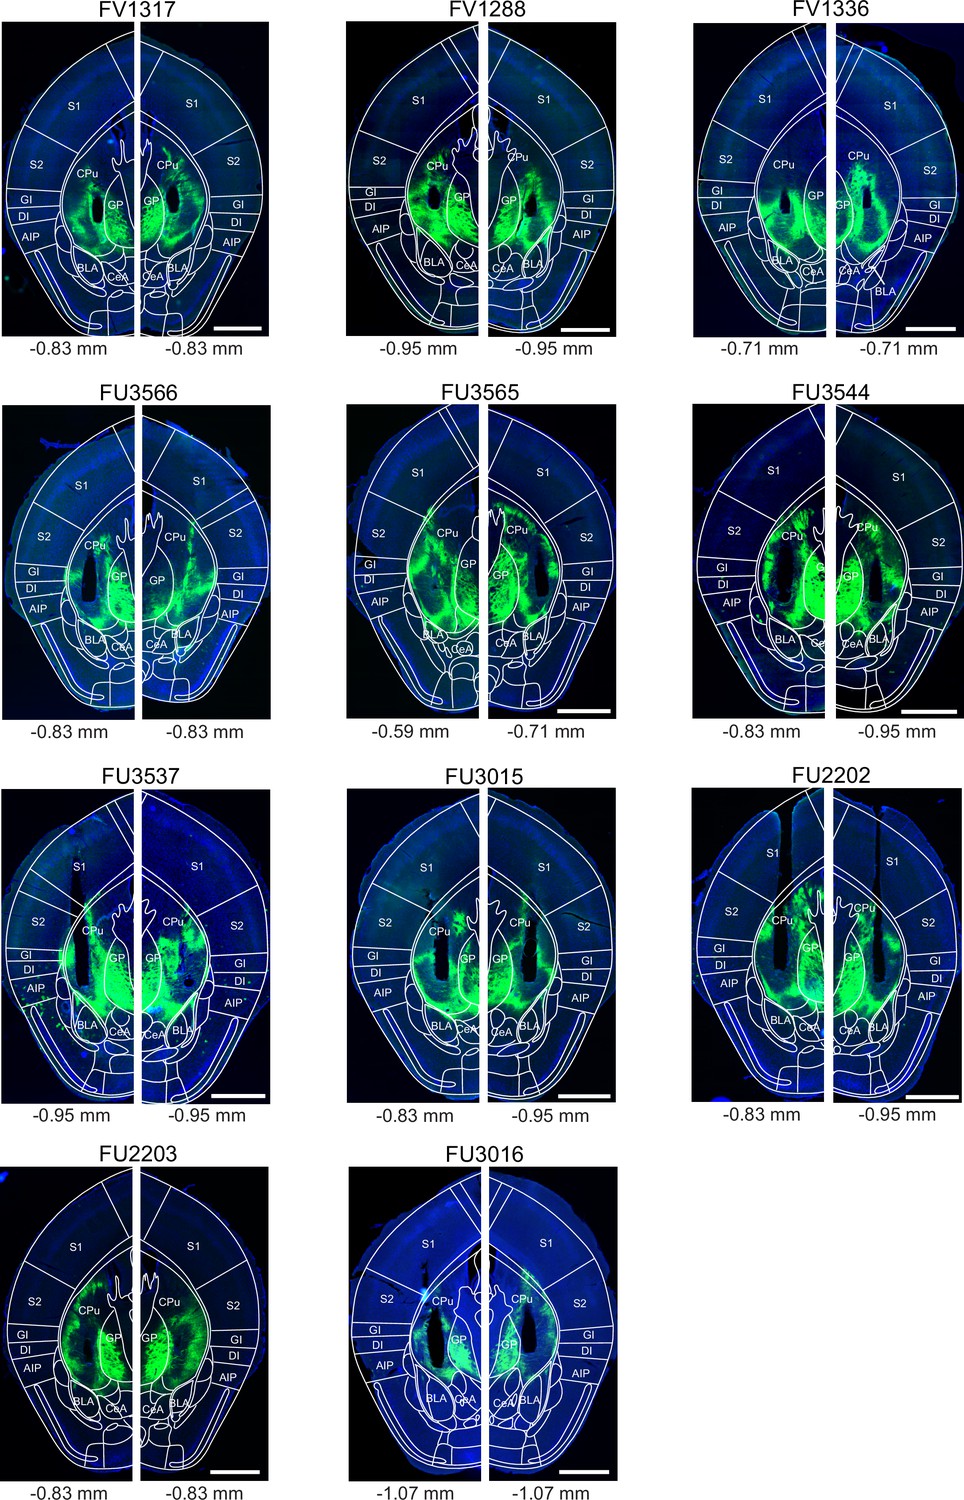
Figure 6—figure supplement 1
Post-hoc histology of Arch expression and optic fiber placement in Adora2aCre mice.
The post-hoc histological results for N=11 Arch-expressing Adora2aCre mice from Figure 6 is shown, in the same display as Figure 5—figure supplement 1 for Drd1aCre mice. Note that the ventral half of the tail striatum (thus, the vTS) was targeted at an a-p position of roughly –0.9 mm relative to Bregma (the striatum is labeled as ‘CPu’ in the overlaid brain atlas images of Franklin and Paxinos, 2016). Scale bars, 1 mm.
Figure 7 with 3 supplements
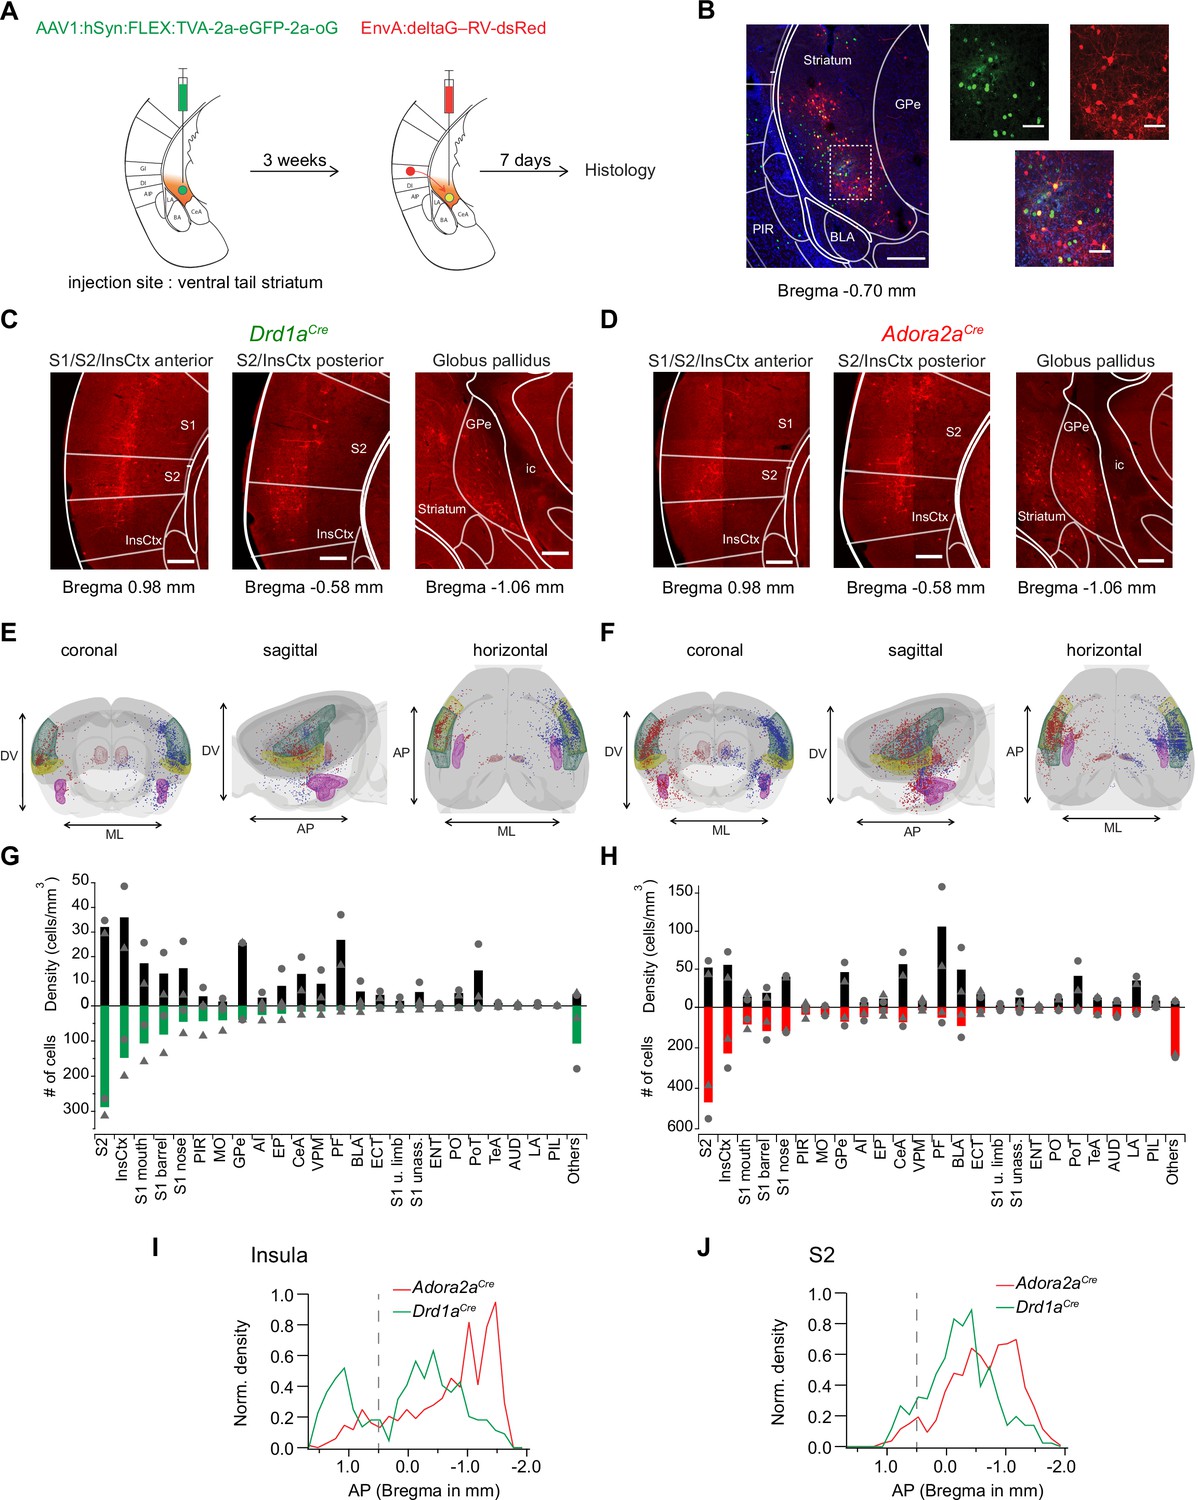
Retrograde transsynaptic tracing of brain-wide inputs to D1R+ and Adora+ vTS neurons.
(A) Scheme of the experimental protocol for rabies-virus mediated transsynaptic tracing. (B) Left, Example confocal images of the injection site in a Drd1aCre mouse, Right, confocal images at a higher magnification taken from the boxed area of the left image. Green, red and blue channels are eGFP-labeled cells expressing the helper viruses (green), rabies-virus expressing cells (red) and DAPI labeling (blue, only shown in the overlay images). Scale bars, 200 µm (left) and 50 µm (right). (C, D) Example widefield epifluorescence images of rabies virus-labeled presynaptic neurons in coronal sections, from a Drd1aCre mouse (C) and an Adora2aCre mouse (D). The abbreviations of brain areas are shown in Figure 7—source data 2. Scalebars, 250 µm. (E, F) Localizations of presynaptic neurons plotted in a 3D brain model, both for Drd1aCre (E) and Adora2aCre (F) mice. Each brain shows the results of two animals (blue and red dots) with one dataset being artificially mirrored on the other hemisphere for each genotype. For orientation, some brain areas are highlighted (S2 – green, InsCtx – yellow, PF – red, BLA – pink). (G, H) Quantification of labeled neurons for each brain area. Upwards and downward data signify cell density and absolute number of cells, quantified for N=2 mice of each genotype. Data from single animals are plotted as filled gray circles and triangles. (I, J) Distribution of presynaptic neurons along the anterior-posterior axis in the insular cortex (I), and in the secondary somatosensory cortex (J). The dashed line indicates the border between the anterior and posterior insular cortex according to Franklin and Paxinos, 2016.
-
Figure 7—source data 1
Raw data for Figure 7.
- https://cdn.elifesciences.org/articles/75703/elife-75703-fig7-data1-v2.xlsx
-
Figure 7—source data 2
List of abbreviations of brain areas.
- https://cdn.elifesciences.org/articles/75703/elife-75703-fig7-data2-v2.xlsx
Figure 7—figure supplement 1
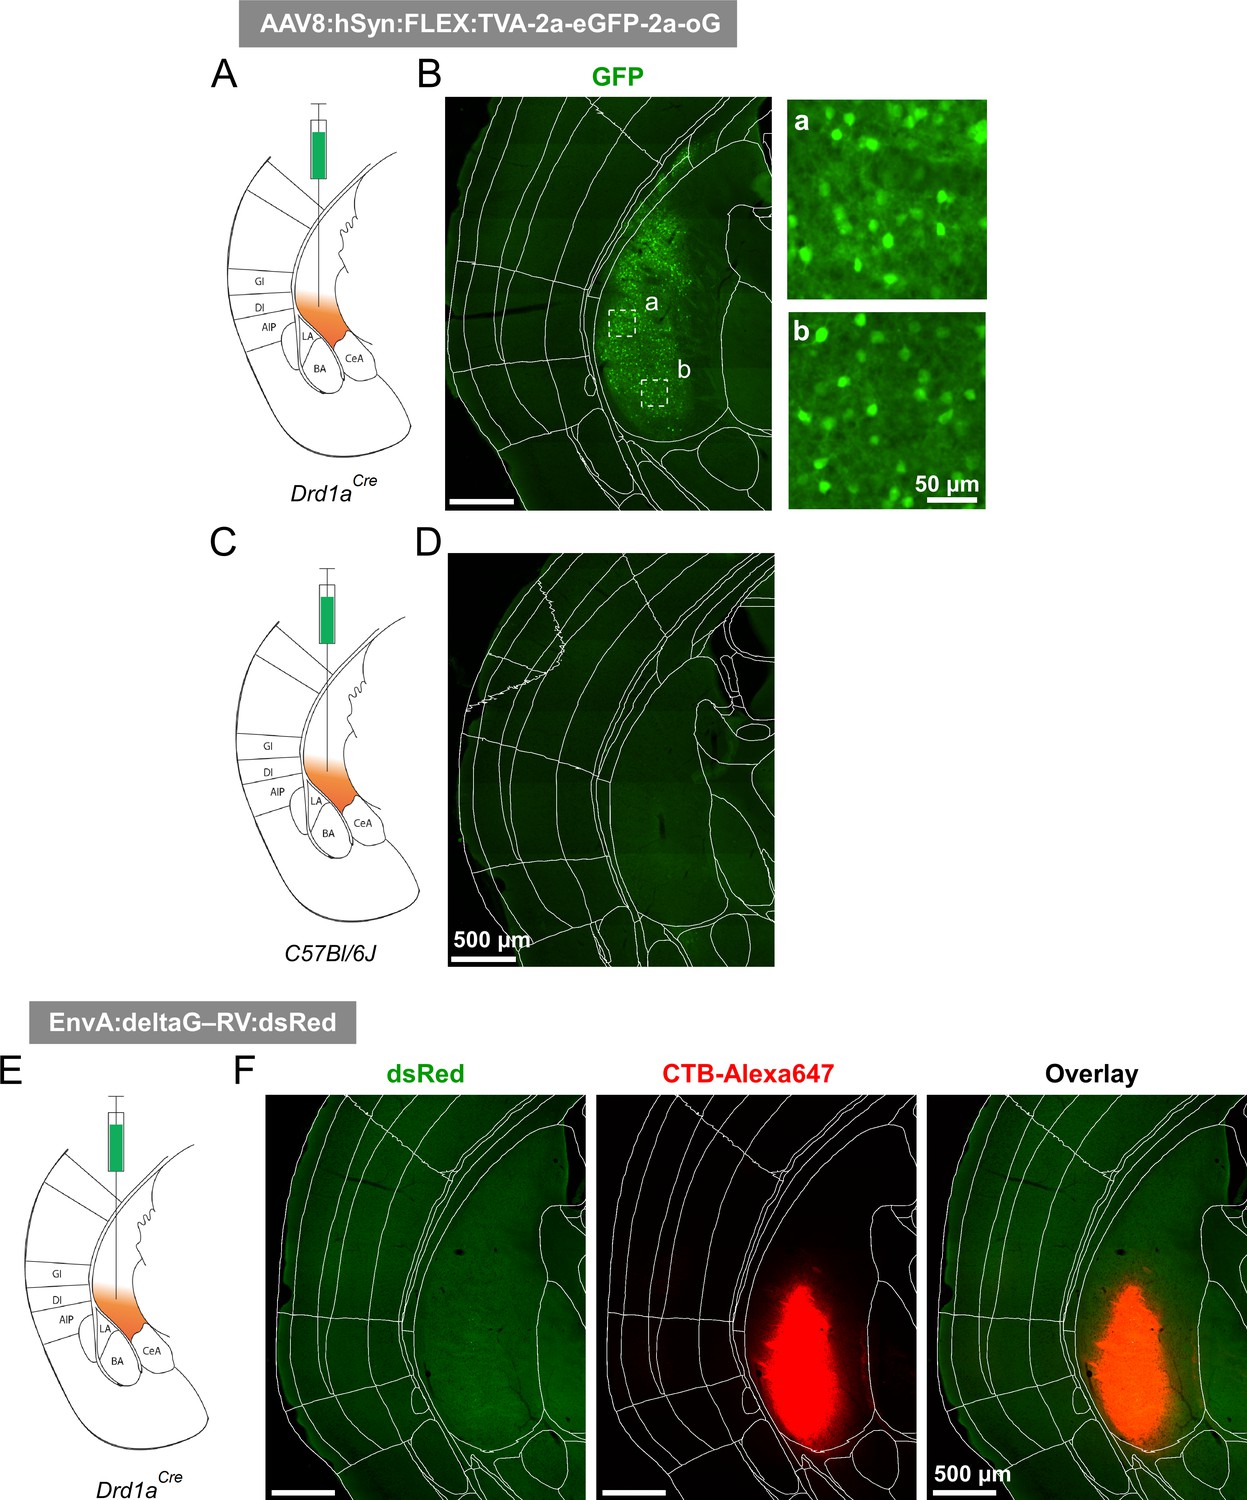
Control experiments for the specificity of helper-virus, and rabies virus expression.
(A - D) The helper virus, AAV8:hSyn:FLEX:TVA-2a-eGFP-2a-oG was injected into the vTS of a Drd1aCre mouse (A, B), or into the vTS of a C57BL/6 J mouse as a negative control (C, D). This resulted in the Cre-dependent expression of eGFP in the Drd1aCre mouse (B, and insets at higher magnification), whereas the same injection in the C57BL/6 J mouse did not induce detectable expression of eGFP (D), thus documenting the specificity of the Cre-dependent expression of the helper viral constructs in Drd1aCre mice. (E, F) The pseudotyped glycoprotein G-deficient rabies virus, which can drive the expression of dsRed in TVA- and oG expressing cells, was injected into the vTS of a Drd1aCre mouse, which had not undergone a previous injection with the helper AAV8 virus. Choleratoxin (CTB)-Alexa647 was co-injected to document successful targeting of the vTS (F, red channel). No dsRed expression was observed (F, green channel), thus documenting that successful transduction with deltaG-RV, and therefore, retrograde transsynaptic activity of the rabies virus, requires previous Cre-dependent expression of TVA.
Figure 7—figure supplement 2
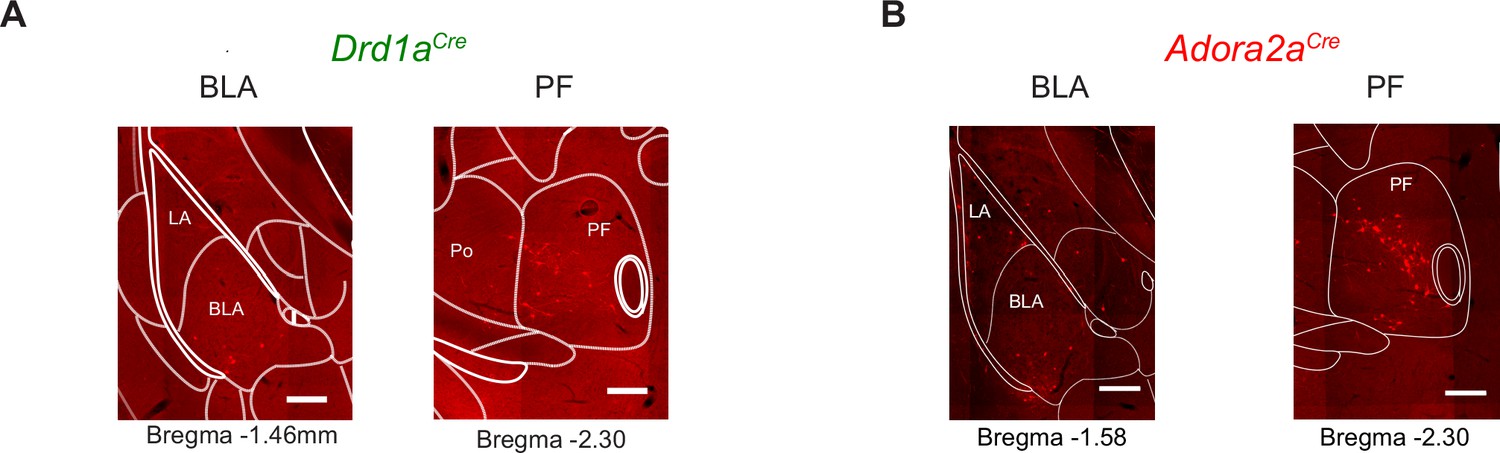
Example images for transsynaptically retrogradely labeled neurons in the BLA and PF.
The data are from the same experiments as shown in Figure 7. The images on the left sides of each panel illustrate a weak density of labeled neurons in the amygdalar region of both a Drd1aCre (A) and an Adora2aCre (B) mouse (left images, CeA, BLA, and LA, see also Figure 7G and H for the quantifications). The images on the right sides illustrate labeling in a confined region of the PF, indicating a notably high density of back-labeled neurons in the PF (see also Figure 7G and H for the quantifications, and Figure 7—source data 2 for the abbreviations of brain areas).
Figure 7—figure supplement 3
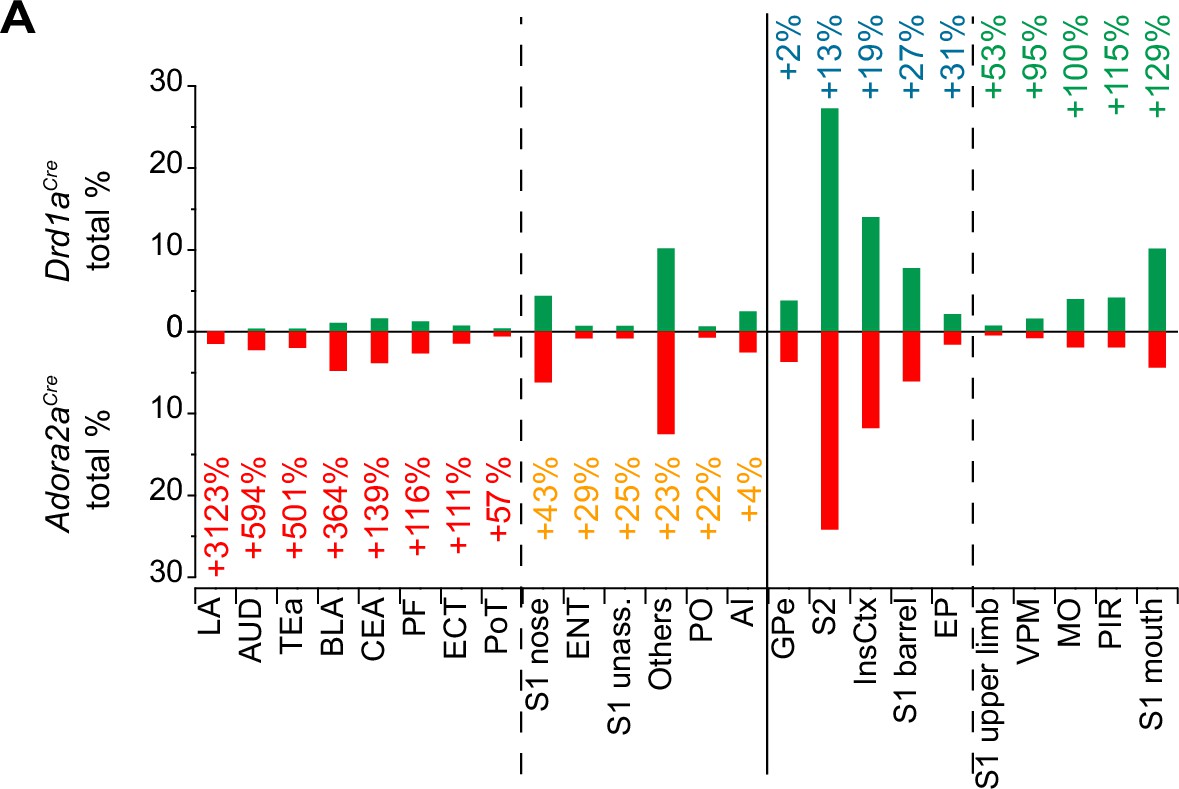
Analysis of the number of back-labeled neurons in Adora2aCre mice relative to Drd1aCre.
The data in Figure 7G and H was re-sorted, to highlight differences in back-labeling between Drd1aCre and Adora2aCre mice. Brain areas with the highest relative backlabeling for Adora+ starter neurons in the vTS (as compared to D1R+ starter cells) are shown from left to right; the relative difference in backlabeling is indicated by numbers. Note that Adora+ vTS neurons, as compared to D1R+ neurons, showed larger proportions of back-labeled presynaptic neurons in the lateral amygdala (LA), auditory cortex (AUD), temporal association cortex (TeA), basolateral amygdala (BLA), central amygdala (CeA), and posterior triangular thalamic nucleus (PoT); interestingly, these areas process auditory- and multimodal sensory information relevant for associative learning (see references in Results). Note that the back-labeling was also higher in the PiL (posterior intralaminar thalamic nucleus), but because there were no back-labeled neurons in Drd1aCre mice, the PiL was not entered to this list. On the other hand, a higher proportion of neurons providing input to D1R+, as compared to Adora+ vTS neurons, was found in the S1, in the somatosensory thalamus (VPM), motor cortex (MO) and piriform cortex (PIR).
Figure 8 with 1 supplement
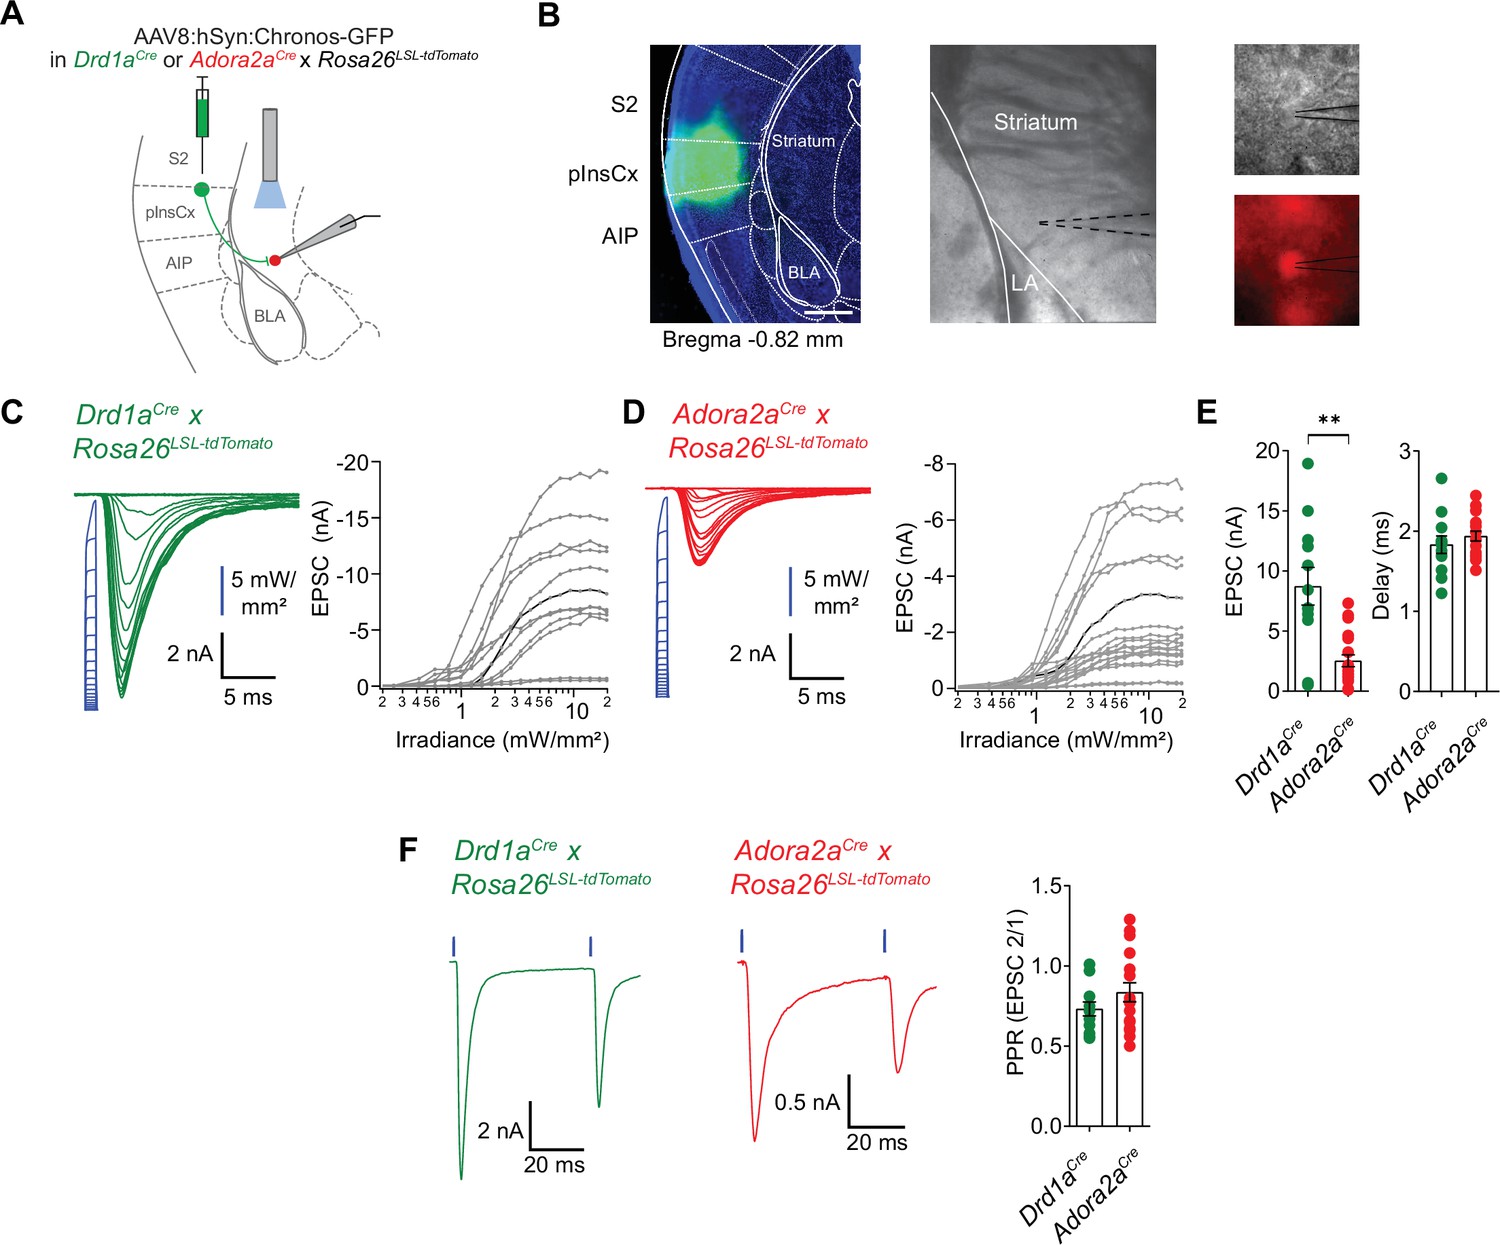
pInsCx provides strong excitatory inputs onto D1R+ - and Adora+ neurons in the vTS .
(A) Experimental scheme of injection of an AAV vector driving the expression of Chronos into the pInsCx, and subsequent slice electrophysiology in the vTS. (B) Left, example fluorescence images of the injection site in the cortex expressing Chonos-eGFP (scalebar, 500 µm); middle, overview brightfield image with the position of the patch pipette (black dotted lines) in the vTS; right, higher magnification images of a recorded example cell (brightfield, top; and tdTomato fluorescence, bottom). (C, D) Left, EPSCs recorded by stimulating with 1ms light pulses of increasing intensities (blue, photodiode-recorded trace), and right, the resulting input-output curve of EPSC amplitude versus light intensity, with data from all recorded cells overlaid. The example cell shown on the left is highlighted in black in the right panel. Data is shown for D1R+ vTS neurons (C, n=12 recordings) and Adora+ vTS neurons (D, n=19 recordings). (E) Quantification of the maximal amplitude of EPSCs (left), and of the EPSC delay (right) measured in D1R+ - and Adora+ vTS neurons (n=12 and n=19 recordings, respectively). (F) Example traces (left, and middle panel) and quantification of PPR of optogenetically evoked EPSCs in D1R+ neurons (green; n=12 recordings) and Adora+ neurons (red; n=19 recordings).
-
Figure 8—source data 1
Raw data and statistical tests for Figure 8 and its supplements.
- https://cdn.elifesciences.org/articles/75703/elife-75703-fig8-data1-v2.xlsx
Figure 8—figure supplement 1
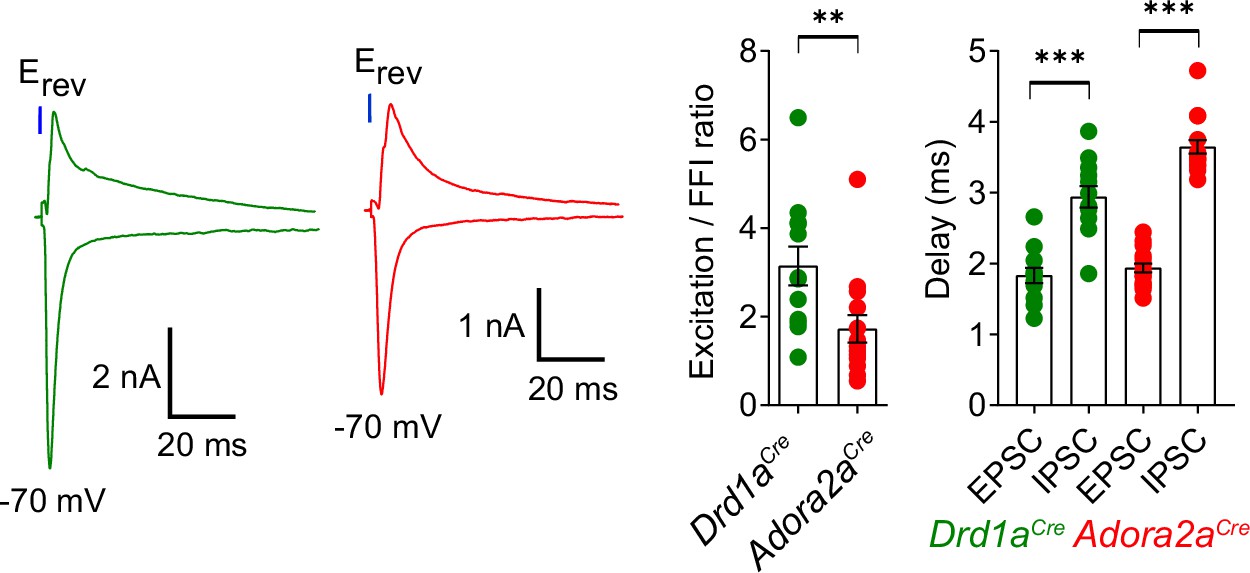
Ratio of direct excitation to feedforward inhibition differs at the synapse from pInsCx to D1R+ vTS neurons versus Adora+ neurons.
Optogenetically-evoked EPSCs were measured at –70 mV, and subsequently recordings were made at the reversal potential for the EPSCs (+5 to+15 mV across experiments). This revealed robust optogenetically-evoked inhibitory postsynaptic currents (IPSCs). The left panel shows example traces (green: for a Drd1aCre x Rosa26LSL-tdTomato mouse; red, for a Adora2aCre x Rosa26LSL-tdTomato mouse). The middle panel shows the quantification of the E/I ratio, which was significantly larger in D1R+neurons than in Adora+ neurons (p=0.0054, U=31, Mann-Whitney test; n=12 D1R+ and n=14 Adora+ vTS neurons). The right panel shows the quantification of latency between the start of the light pulse and the respective PSC (green data points, for n=12 D1R+ neurons; red data points, for n=14 Adora+ vTS neurons). For each neuron type, the delays for the EPSCs (direct excitation) were significantly shorter than the delays for IPSCs; we therefore interpret the latter as feedforward inhibition (D1R+ neurons: p=0.0001, t11=5.831, paired t-test; Adora+ neurons: w=153, p<0.0001, Wilcoxon matched-pairs signed-rank test). Data are shown as average ± SEM.
Figure 9
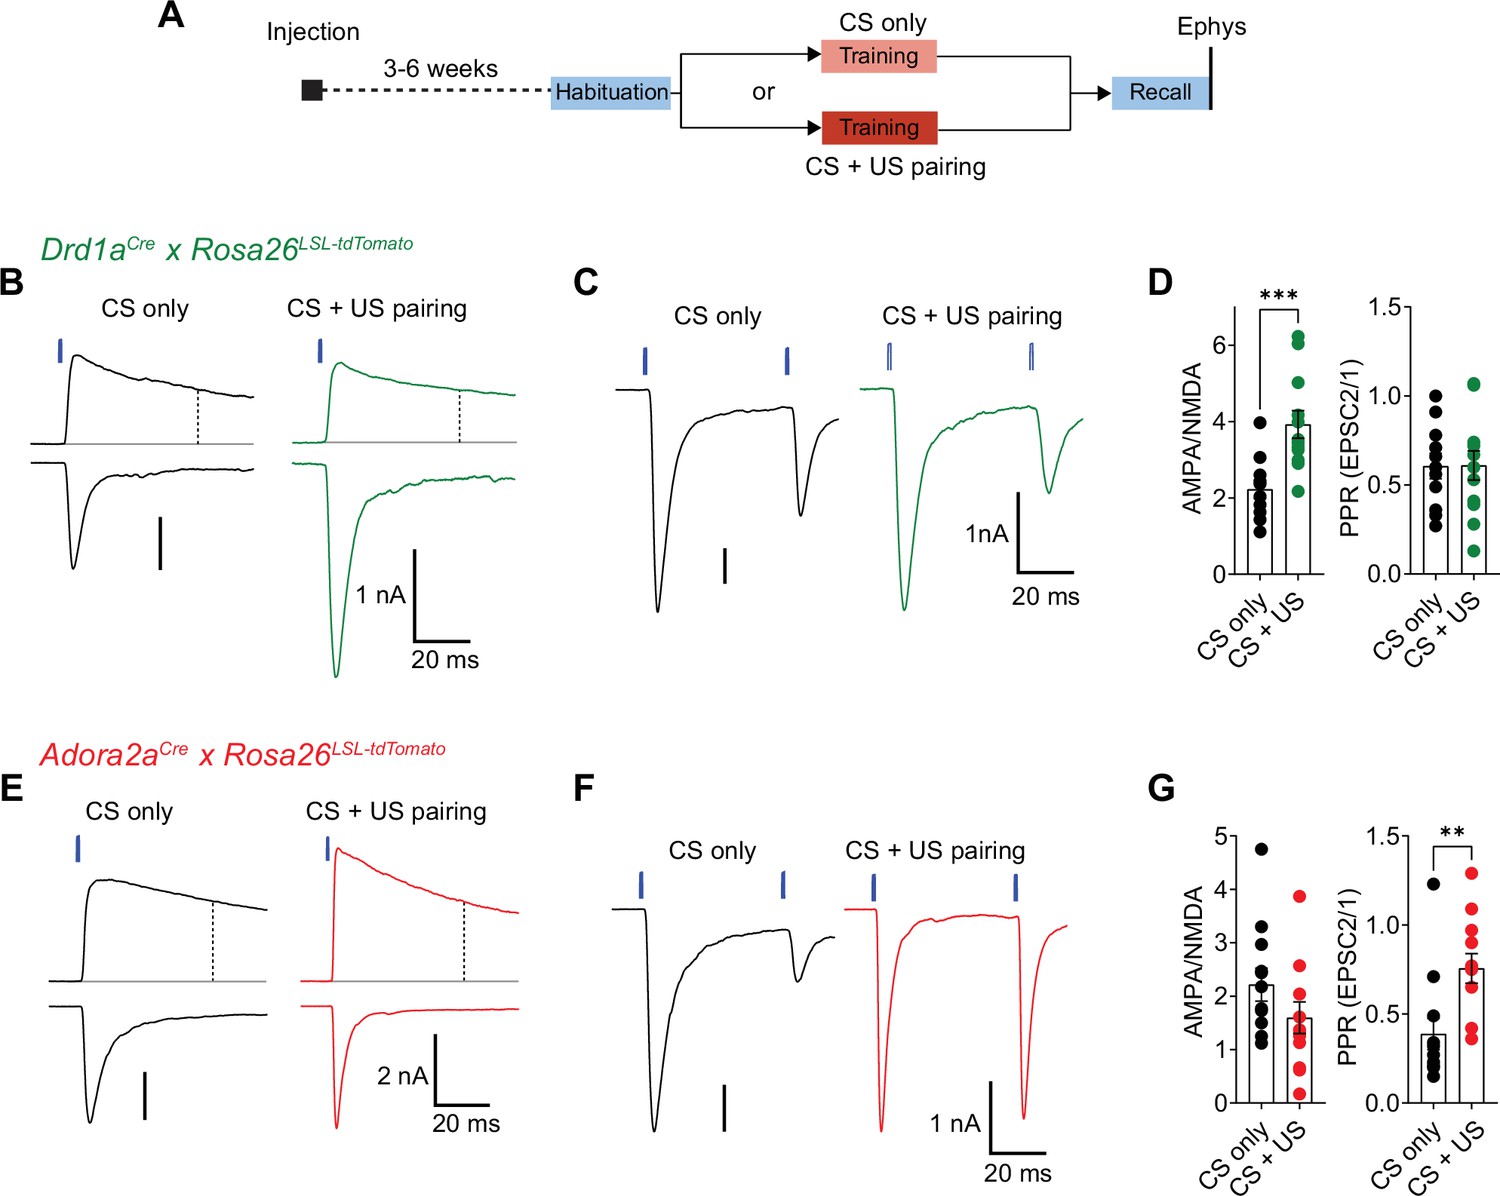
Fear learning induces long-term plasticity with opposite outcomes at pInsCx synapses onto D1R+ - and Adora+ vTS neurons.
(A) Timeline of the ex vivo optogenetic assessment of plasticity following fear learning. See Results for details. (B - D) Measurements of AMPA/NMDA - ratios and PPR in two experimental groups (‘CS-only’ versus ‘CS+US pairing’) in Drd1aCre x Rosa26LSL-tdTomato mice, to target the recording of direct pathway vTS neurons. (B) NMDA-EPSCs recorded at + 50 mV (top traces), and AMPA-EPSCs recorded at –70 mV (bottom traces), recorded in example D1R+ neurons from each experimental group. Vertical dashed line indicates the time of analysis of NMDA-EPSC. (C) AMPA-EPSCs (- 70 mV) recorded for the measurement of PPR (50ms inter-stimulus interval), shown for one example D1R+ neuron from each experimental group. (D) Quantification of AMPA/NMDA ratios and PPR recorded in each experimental group of Drd1aCre x Rosa26LSL-tdTomato mice (CS only, n=11 recordings; CS+US pairing, n=12). Note the significantly increased AMPA/NMDA ratio in the CS+US pairing group as compared to the CS-only group (P=0.001; unpaired t-test), whereas the PPR was unchanged (P=0.97, unpaired t-test). (E - G) Measurements of AMPA/NMDA - ratios and PPR in two experimental groups (‘CS-only’ versus ‘CS+US pairing’) in Adora2aCre x Rosa26LSL-tdTomato mice. (E) NMDA-EPSCs (top traces), and AMPA-EPSCs (bottom traces) recorded in example Adora+ neurons from each experimental group. (F) Example traces for the measurement of PPR of AMPA-EPSCs at - 70 mV, recorded in example Adora+ neurons of each experimental group. (G) Quantification of AMPA/NMDA ratios, and paired-pulse ratios recorded in each experimental group of the Adora2aCre x Rosa26LSL-tdTomato mice (CS only, n=12 recordings; CS+US pairing, n=12). Note the significantly increased PPR in the CS+US pairing group as compared to the CS-only group (p=0.001; Mann-Whitney test). For further statistical parameters, see Results text.
-
Figure 9—source data 1
Raw data and statistical tests for Figure 9.
- https://cdn.elifesciences.org/articles/75703/elife-75703-fig9-data1-v2.xlsx
Tables
Key resources table
| Reagent type (species) or resource | Designation | Source or reference | Identifiers | Additional information |
|---|---|---|---|---|
| Strain, strain background (M. musculus) | C57BL/6J | The Jackson laboratory | Jax:000664 | |
| Genetic reagent (M. musculus) | Drd1aCre | PMID:17855595; PMID:24360541 | MGI:4366803; MMRRC:030778-UCD; RRID:MMRRC_030778-UCD | STOCK Tg(Drd1-cre)EY217 Gsat/Mmucd |
| Genetic reagent (M. musculus) | Adora2aCre | PMID:17855595; PMID:24360541 | MGI:4361654; MMRRC:036158-UCD; RRID:MMRRC_036158-UCD | B6.FVB(Cg)-Tg(Adora2a- cre)KG139Gsat/Mmucd |
| Genetic reagent (M. musculus) | Rosa26LSL-tdTomato | PMID:20023653 | Jax:007909; MGI:3809523; RRID:IMSR_JAX:007909 | B6.Cg-Gt(ROSA) 26Sortm9(CAG-tdTomato)Hze/J |
| Recombinant DNA reagent | AAV1:hSyn:FLEX: GCaMP6m (viral vector) | Viral vector facility, University of Zürich | ZurichVVF:v290-1 | (6.8e12/ml) |
| Recombinant DNA reagent | AAV1:hSyn:FLEX: Chronos-eGFP (viral vector) | University of North Carolina vector core | UNC:Boyden-AAV-Syn-Chronos-GFP | (2.8e12/ml) |
| Recombinant DNA reagent | AAV1:CAG:FLEX: Arch-eGFP (viral vector) | University of North Carolina vector core | UNC:Boyden-AAV-CAG-FLEX-Arch-GFP | (2.05e12/ml) |
| Recombinant DNA reagent | AAV1:CBA:FLEX: Arch-eGFP (viral vector) | University of Pennsylvania vector core | UPenn:AV-1-PV2432;Addgene:22222-AAV1 | (5.48e12/ml) |
| Recombinant DNA reagent | AAV1:CAG:FLEX: eGFP (viral vector) | University of North Carolina vector core | UNC:Boyden-AAV-CAG-FLEX-GFP | (4.4e12/ml) |
| Recombinant DNA reagent | AAV8:hSyn:Chronos- eGFP (viral vector) | University of North Carolina vector core | UNC:Boyden-AAV-Syn-Chronos-GFP | (6.5e12/ml) |
| Recombinant DNA reagent | AAV8:CAG:FLEX: tdTomato (viral vector) | University of North Carolina vector core | UNC:Boyden-AAV-CAG-FLEX-tdTomato | (6.5e12/ml) |
| Recombinant DNA reagent | AAV1:hSyn:FLEX:TVA-2a-eGFP-2a-oG (viral vector) | Viral vector facility, University of Zürich | ZurichVVF:v243-1; Addgene:85225 | (5.3e12/ml) |
| Recombinant DNA reagent | EnvA:deltaG–RV: dsRed (viral vector) | PMID:21867879 | Addgene:32638 | |
| Commercial assay or kit | Fluoroshield mounting medium with DAPI | Sigma Aldrich | Sigma:F6057-20ML | |
| Chemical compound, drug | gabazine | Abcam | Abcam:ab120042; Sigma:SR95531 | |
| Software, algorithm | VideoFreeze | Med Associates Inc | Med Associates:VideoFreeze | |
| Software, algorithm | EthoVision XT | Noldus Information Technologies | Noldus:EthoVisionXT13; RRID:SCR_000441 | version 13 |
| Software, algorithm | ezTrack | PMID:31882950 | RRID:SCR_021496 | https://github.com/denisecailab/ezTrack |
| Software, algorithm | Igor Pro | Wavemetrics Inc | RRID:SCR_000325 | version 7.08, 64 bit |
| Software, algorithm | Inscopix Data Processing Software | Inscopix Inc | Inscopix:IDPS | |
| Software, algorithm | CaImAn | PMID:30652683 | RRID:SCR_021152 | https://caiman.readthedocs.io/ |
| Software, algorithm | SHARP-Track | doi:10.1101/447995 | https://github.com/cortex-lab/allenCCF | |
| Software, algorithm | Brainrender | PMID:33739286 | RRID:SCR_022328 | https://edspace.american.edu/openbehavior/project/brainrender/ |
| Software, algorithm | ABBA | doi:10.3389/fcomp.2021.780026 | BIOP:ABBA | https://github.com/BIOP/ijp-imagetoatlas |
| Software, algorithm | FIJI | PMID:22743772 | RRID:SCR_002285 | http://fiji.sc |
| Software, algorithm | Adobe Illustrator | Adobe Corporation | RRID:SCR_010279 | http://www.adobe.com/products/illustrator.html |
| Software, algorithm | GraphPad Prism | GraphPad Software | RRID:SCR_002798 | version 9 |
| Software, algorithm | NeuroMatic | PMID:29670519 | RRID:SCR_004186 | plugin for IgorPro |
| Other | steretotaxic frame for small animals | David Kopf Instruments | David Kopf Instruments: Model 942 | used with Model 921 mouse adapter |
| Other | hydraulic one-axis manipulator | Narishige | MO-10 | for virus injections; see Materials and methods |
| Other | 600 µm / 7.3 mm ProView(TM) GRIN lens | Inscopix Inc | Inscopix:1050–004413 | used with nVista3.0 system |
| Other | nVista imaging system | Inscopix Inc | Inscopix:nVista3.0; RRID:SCR_017407 | for Ca2+ imaging of neurons in freely moving mice; see Materials and methods |
| Other | optic fiber implants | Thorlabs Inc | Thorlabs:FT200EMT | 200 µm core / 0.39 NA / 230 µm outer diameter |
| Other | ceramic ferrule | Thorlabs Inc | Thorlabs:CFLC230 | 230 µm bore / 1.25 mm outer diameter |
| Other | blue light curing dental cement | Ivoclar Vivadent AG | Ivoclar Vivadent:Tetric EvoFlow | for securing implants at the skull surface |
| Other | light curing adhesive | Kulzer GmbH | Kulzer:iBond Total Etch | for treatment of skull before application of dental cement |
| Other | fear conditioning apparatus | Med Associates Inc | Med Associates:MED- VFC-OPTO-M | see Materials and methods |
| Other | electric footshock stimulator | Med Associates Inc | Med Associates:ENV-414S | used within the fear conditioning apparatus |
| Other | 561 nm solid-state laser | Changchun New Industries Optoelectronics Technology (CNI) | CNI:MGL-FN-561-AOM | fiber coupled, maximum output 100 mW; for in- vivo activation of Arch |
| Other | 473 nm solid-state laser | Changchun New Industries Optoelectronics Technology (CNI) | CNI:MBL-FN-473–150 mW | fiber coupled, maximum output 150 mW; for in-vivo activation of Chronos, see Materials and methods |
| Other | vibrating microtome VT1200S | Leica Microsystems | RRID:SCR_020243 | for preparation of brain slices; see Materials and methods |
| Other | patch-clamp amplifier EPC10/2 | HEKA Elektronik | RRID:SCR_018399 | for whole-cell patch-clamp recordings; see Materials and methods |
| Other | fluorescent microscope BX51WI | Olympus | RRID:SCR_018949 | to visualize neurons for whole-cell patch-clamp; see Materials and methods |
| Other | high-power LED, blue | Cree Inc | Cree:XPEBRY-L1-0000-00P02 | 460 nm; to excite Chronos in slices; see Materials and methods |
| Other | high-power LED, green | Cree Inc | Cree:XPEBGR-L1-0000-00D02 | 530 nm; to activate Arch in slices; see Materials and methods |
| Other | LED driver | Mightex Systems | Mightex Systems:BLS-1000–2 | |
| Other | silicone photodetector | Thorlabs Inc | Thorlabs:DET36A/M | to measure the time-course of LED light pulse in slice experiments; see Figure 8C and D and Materials and methods |
| Other | slide scanning fluorescent microscope | Olympus | Olympus:VS120-L100; RRID:SCR_018411 | for imaging post-hoc histology sections; see Materials and methods |
| Other | sliding microtome Microm HM450 | ThermoFisher Scientific | RRID:SCR_015959 | to prepare histological brain sections; see Materials and methods |
| Other | confocal microscope | Leica SP8 | RRID:SCR_018169 | for imaging post-hoc histology sections; see Materials and methods |
Additional files
Download links
A two-part list of links to download the article, or parts of the article, in various formats.
Downloads (link to download the article as PDF)
Open citations (links to open the citations from this article in various online reference manager services)
Cite this article (links to download the citations from this article in formats compatible with various reference manager tools)
A striatal circuit balances learned fear in the presence and absence of sensory cues
eLife 12:e75703.
https://doi.org/10.7554/eLife.75703


