Slow fluctuations in ongoing brain activity decrease in amplitude with ageing yet their impact on task-related evoked responses is dissociable from behavior
- CIBIT-ICNAS, University of Coimbra, Portugal
- Faculty of Medicine, University of Coimbra, Portugal
Figures
Figure 1
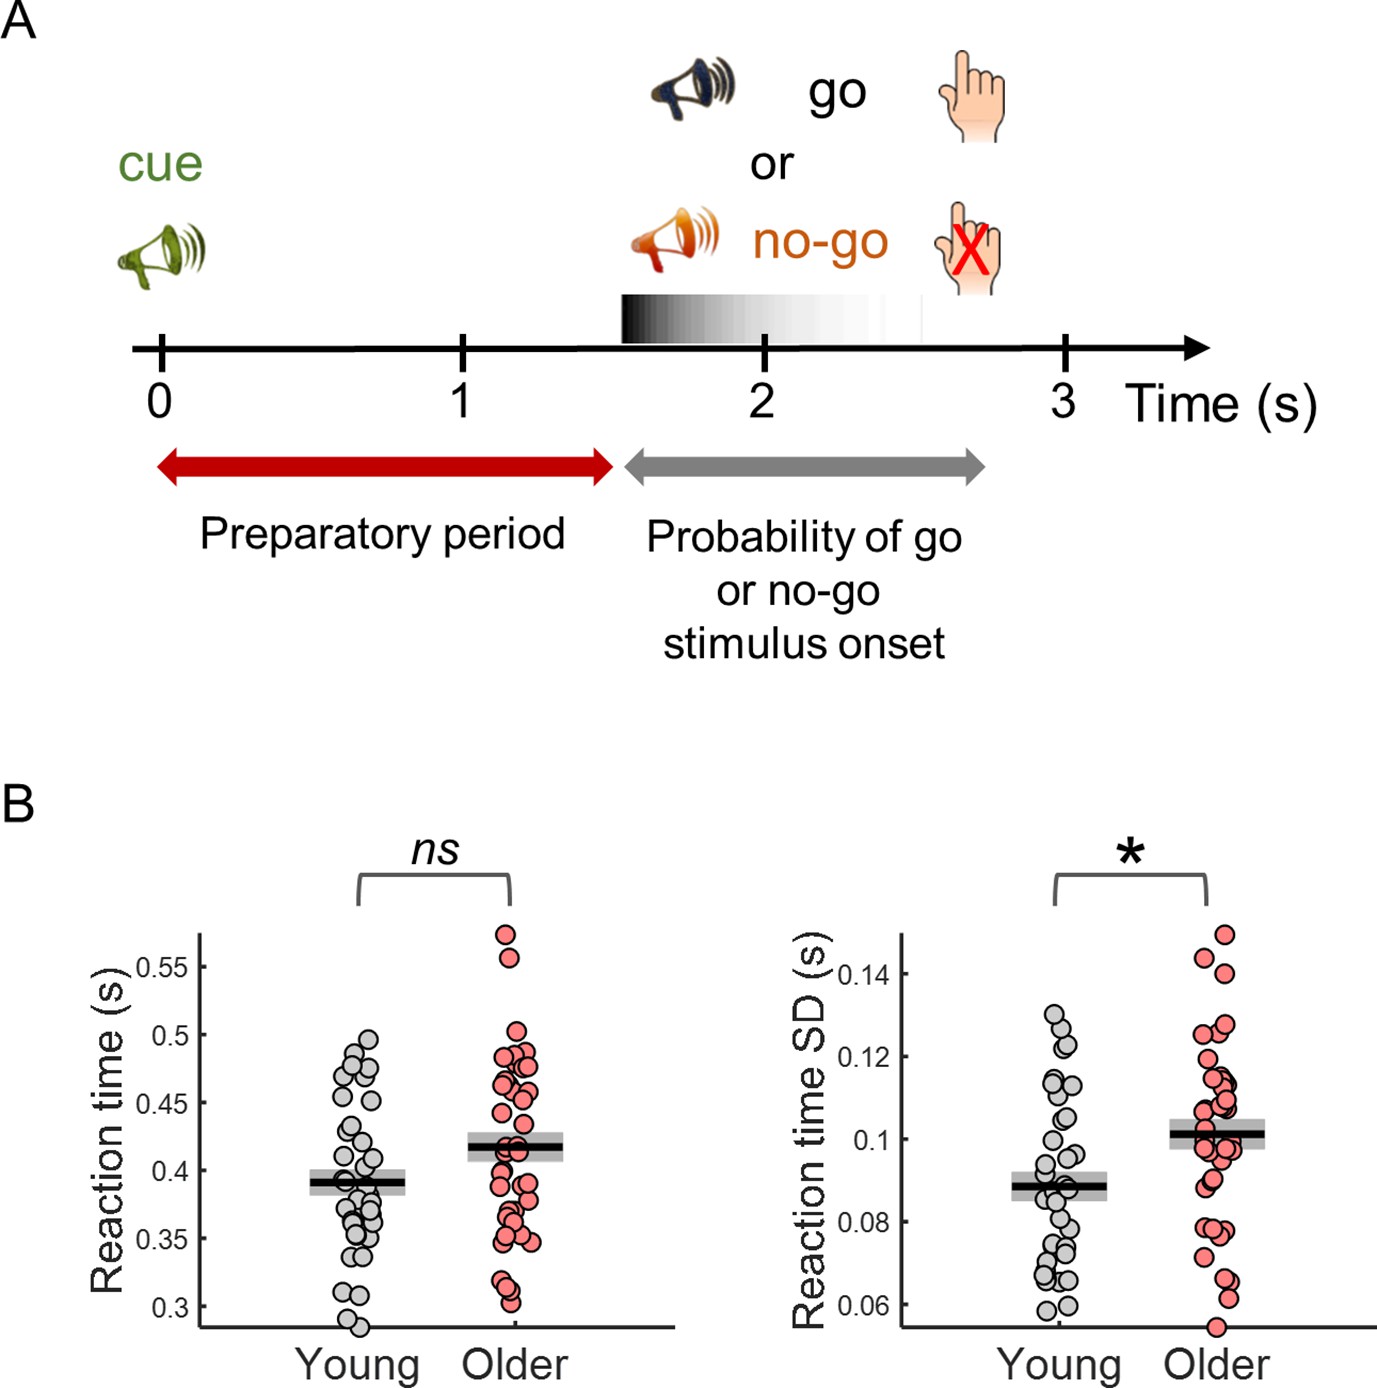
Behavioral task design and reaction time results.
(A) Participants performed a cued auditory go/no-go task. The warning cue presented at the beginning of the trial was followed by a go or a no-go stimulus. Participants were instructed to respond with their right index finger as fast as possible upon detection of the go stimulus and to withhold the response in no-go trials. Auditory stimuli were pure tones of different frequencies (cue – 1500 Hz; go – 1700 Hz; no-go – 1300 Hz). (B) Median reaction time (left) and reaction time variability [across trials standard deviation (SD)] (right). Black horizontal line depicts mean across participants and grey box ± standard error of the mean. * p< 0.05; ns = not significant, in independent samples t-tests comparing across groups.
Figure 2 with 1 supplement
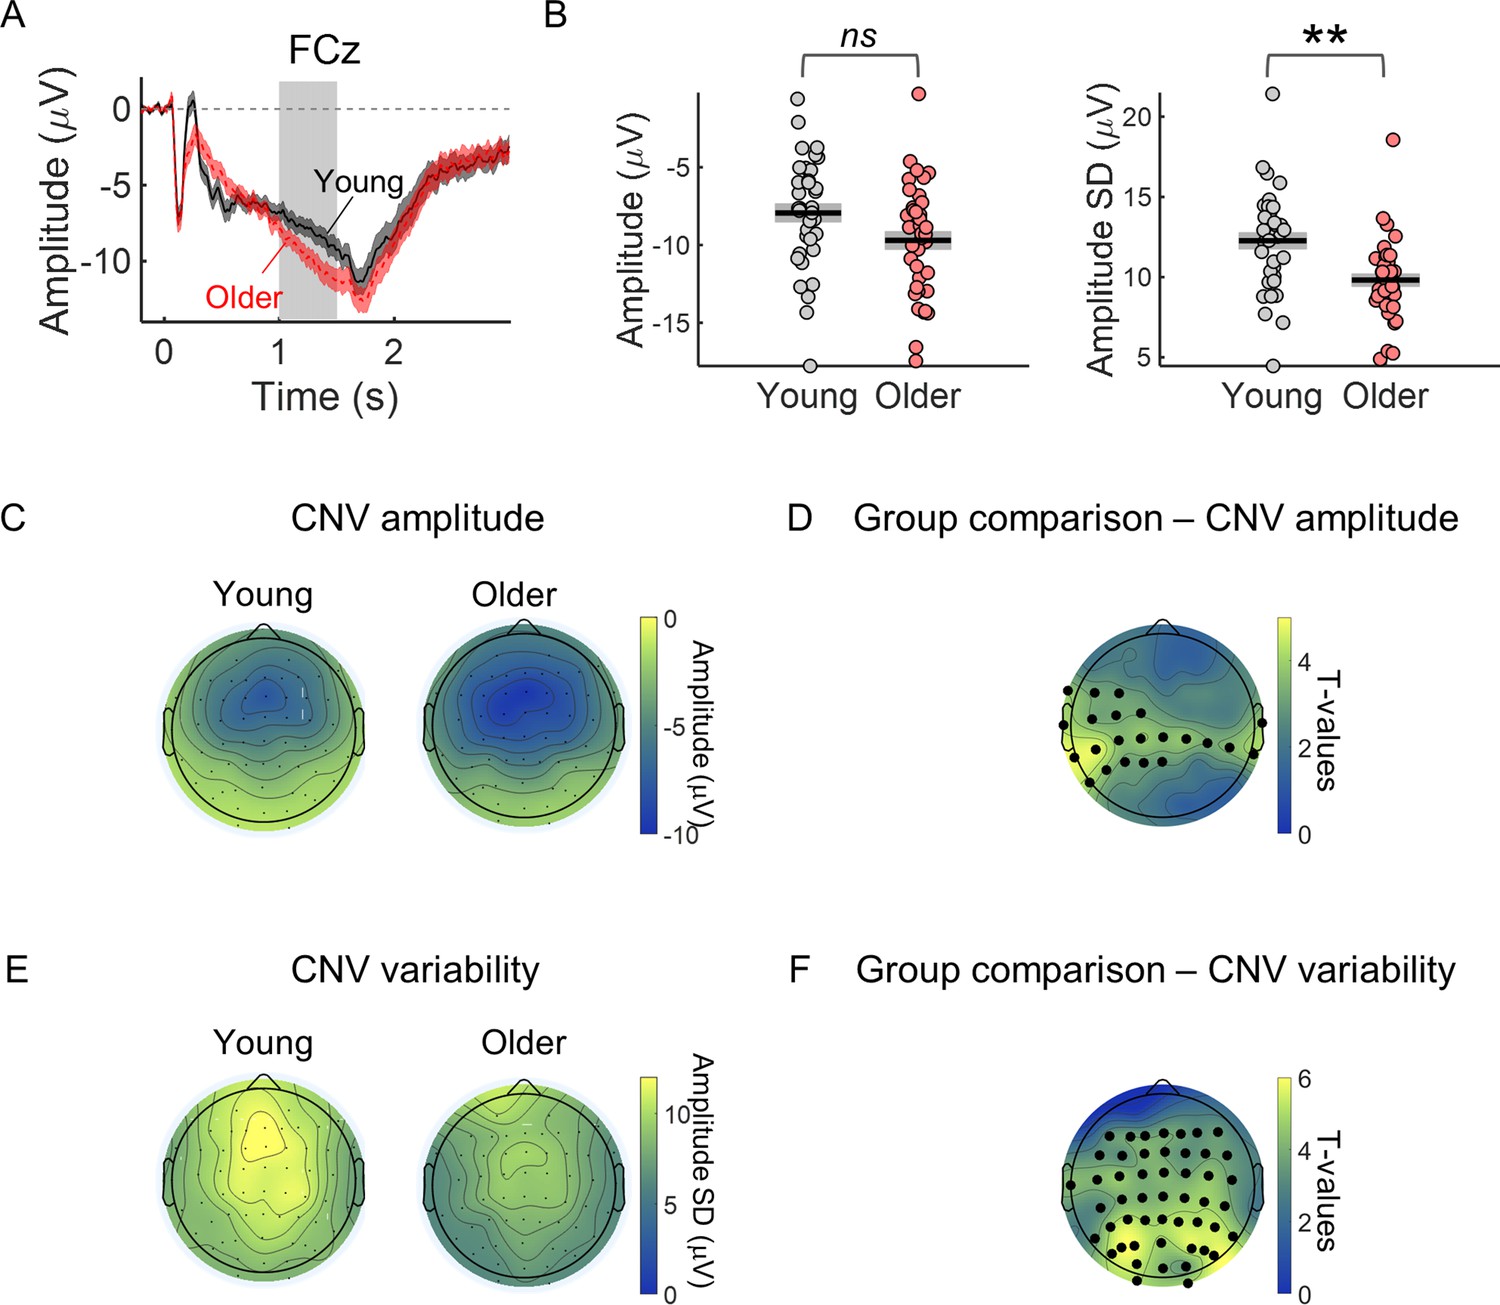
CNV variability is significantly decreased in the older group.
(A) Cue-locked ERP measured in the electrode FCz (mean ± SEM across participants). Grey background highlights the time window used to average the ERP amplitude within each trial to study group differences in CNV amplitude and across trials CNV amplitude variability (1–1.5 s after cue onset). This time window was chosen to include the period of highest amplitude of the preparatory response while avoiding any activity related to target processing and therefore positioned just before the earliest target onset (1.5 s after cue onset). (B) Left, FCz CNV amplitude. Right, FCz CNV variability (across trials SD). Graphs depict individual data points (circles), mean (black horizontal line) and ± SEM across participants (grey box). ** p<0.01; ns = not significant, in independent samples t-tests comparing across groups after controlling for multiple comparisons across EEG channels. (C) Scalp topography depicting average CNV amplitude. (E) Scalp topographies of CNV variability. (D and F) Scalp topographies of t-values from independent samples t-tests comparing young and older participants at each electrode location. Correction for multiple comparisons was achieved using permutation tests and the ‘tmax’ method for adjusting the p values (Blair and Karniski, 1993; Groppe et al., 2011). Black circles highlight the electrodes where the group difference was significant after controlling for multiple comparisons (p<0.05).
Figure 2—figure supplement 1
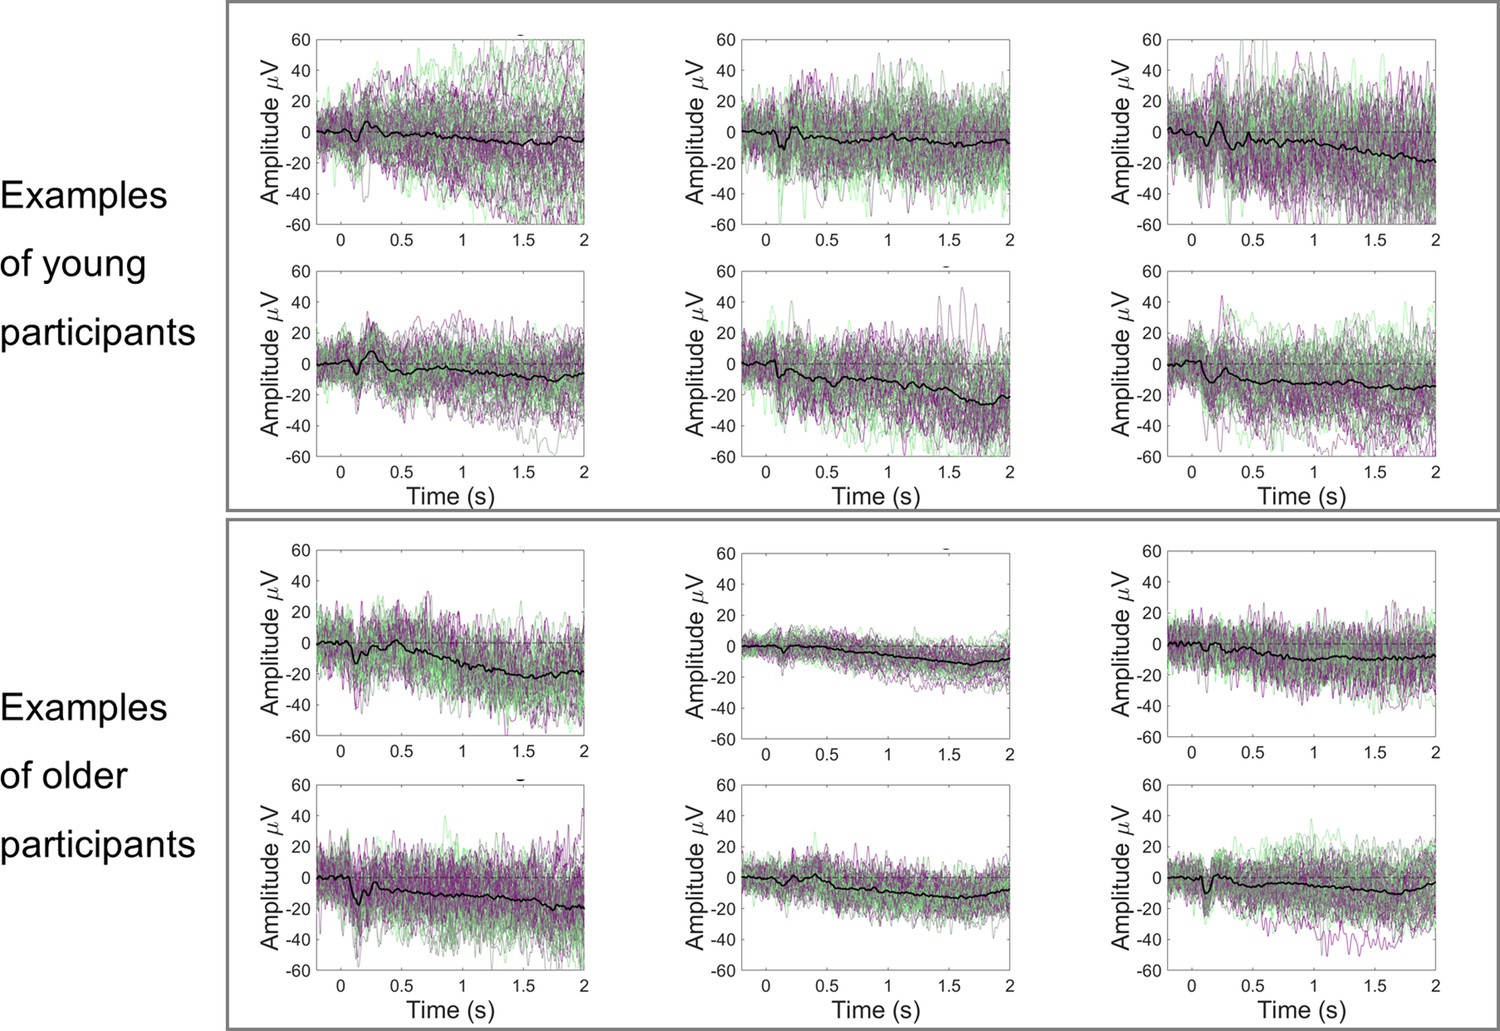
Examples of cue-locked event-related potentials (ERPs) from young and older participants showing higher trial-by-trial variability in the young participants.
Black line represents the across trials average response; green-purple lines represent single-trial responses.
Figure 3

Within-subject correlation analyses between CNV amplitude and reaction time.
(A) Scalp topographies of average correlation coefficients. Black circles highlight electrodes where correlation coefficients were significantly different from zero after controlling for multiple comparisons. Graph on the right shows individual data points (circles), mean (black horizontal line) and ± standard error of the mean across participants (grey box) of correlation coefficients for electrode C5 marked in the scalp topography with an asterisk. Statistical comparisons: one sample t-test including all participants (** p<0.01) / independent samples t-test comparing across groups (ns, not significant). (B) ERPs at electrode C5 divided within each participant in quintiles according to reaction time. Fast responses were associated with more negative CNV amplitudes in both groups. Data are represented as mean ± standard error of the mean across participants.
Figure 4 with 1 supplement

The variability of the cue-locked pupil dilation (PD) response is significantly reduced in older individuals.
(A) Cue-locked pupil dilation response in young and older participants (mean ± SEM across participants). Grey background highlights time window (1–1.5 s after cue onset) where the PD amplitude was averaged within each trial to study the pupil dilation response elicited by the cue stimulus during the preparatory period before target onset. (B) Left, amplitude of PD response in young and older adults. Right, trial-by-trial variability in PD response (across trials standard deviation of PD amplitude) in young and older adults. Graphs depict individual data points (circles), mean (black horizontal line) and ± standard error of the mean across participants (grey box). *** p<0.001; ns = not significant, in independent samples t-tests comparing across groups.
Figure 4—figure supplement 1
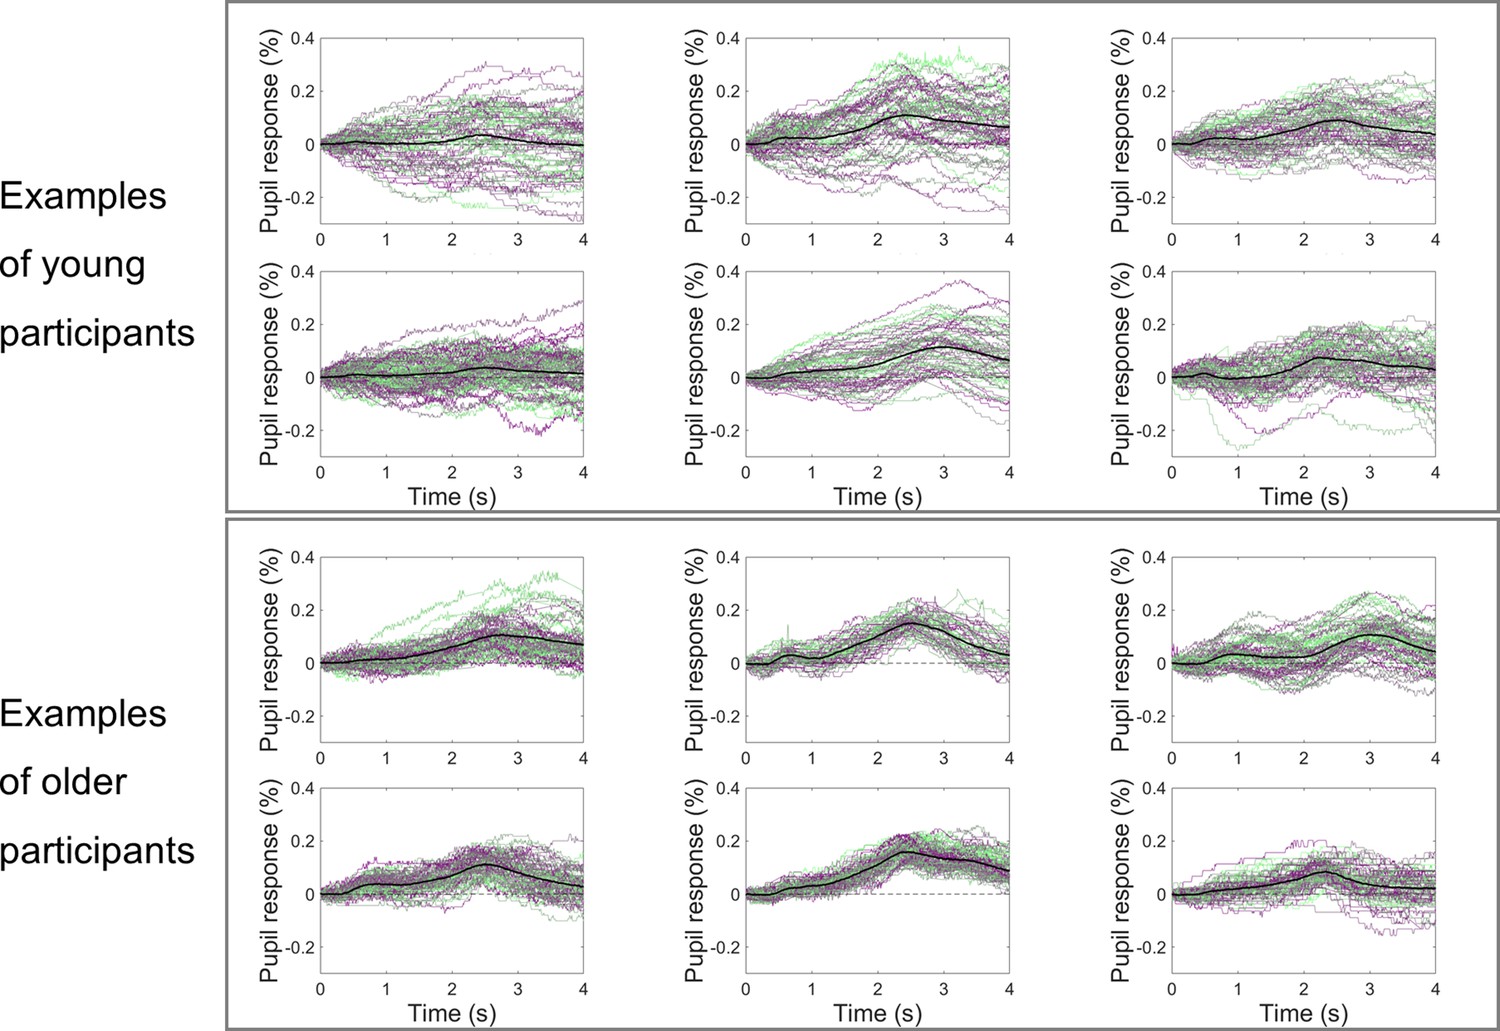
Examples of cue-locked pupil dilation responses from young and older participants showing higher trial-by-trial variability in the young participants.
Black line represents the across trials average response; green-purple lines represent single-trial responses.
Figure 5 with 1 supplement
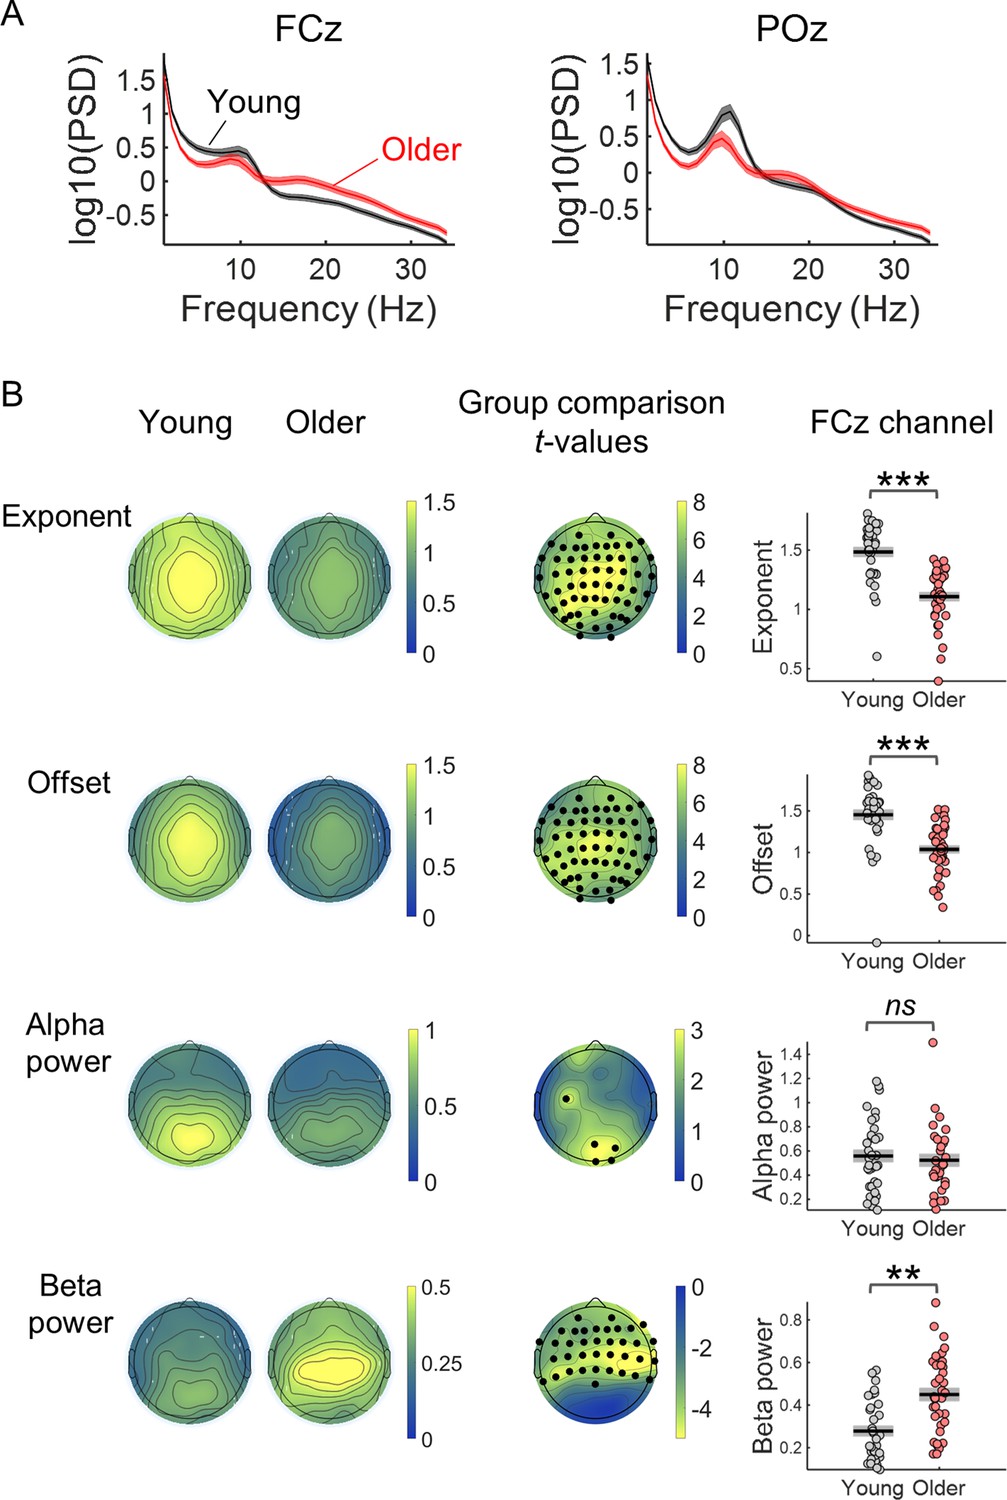
Comparison of the properties of the power spectral density (PSD) of the EEG pre-stimulus signal of young and older adults.
(A) PSDs of the EEG signal in a window of 3.5 s before cue-onset measured in two EEG channels: the FCz, a frontocentral electrode where the preparatory CNV had maximal amplitude, and the POz, a parietocentral electrode where alpha oscillations were most prominent. Plots depict across participants mean ± standard error of the mean. (B) Scalp topographies of the average aperiodic parameters, exponent and offset, and alpha and beta power, extracted from the pre-stimulus PSD of each group of participants. Group differences for each of the parameters studied were estimated using independent t-tests. Channels that showed significant differences after controlling for multiple comparisons are highlighted in black. The graphs on the right show the exponent, offset, alpha power and beta power of the PSDs of young and older groups measured in the channel FCz. Graphs depict individual data points (circles), mean (black horizontal line) and ± standard error of the mean across participants (grey box). Participants where alpha or beta peaks were not detected were excluded from these graphs. **p<0.01; ***p<0.001; ns = not significant, in independent samples t-tests comparing across groups.
Figure 5—figure supplement 1
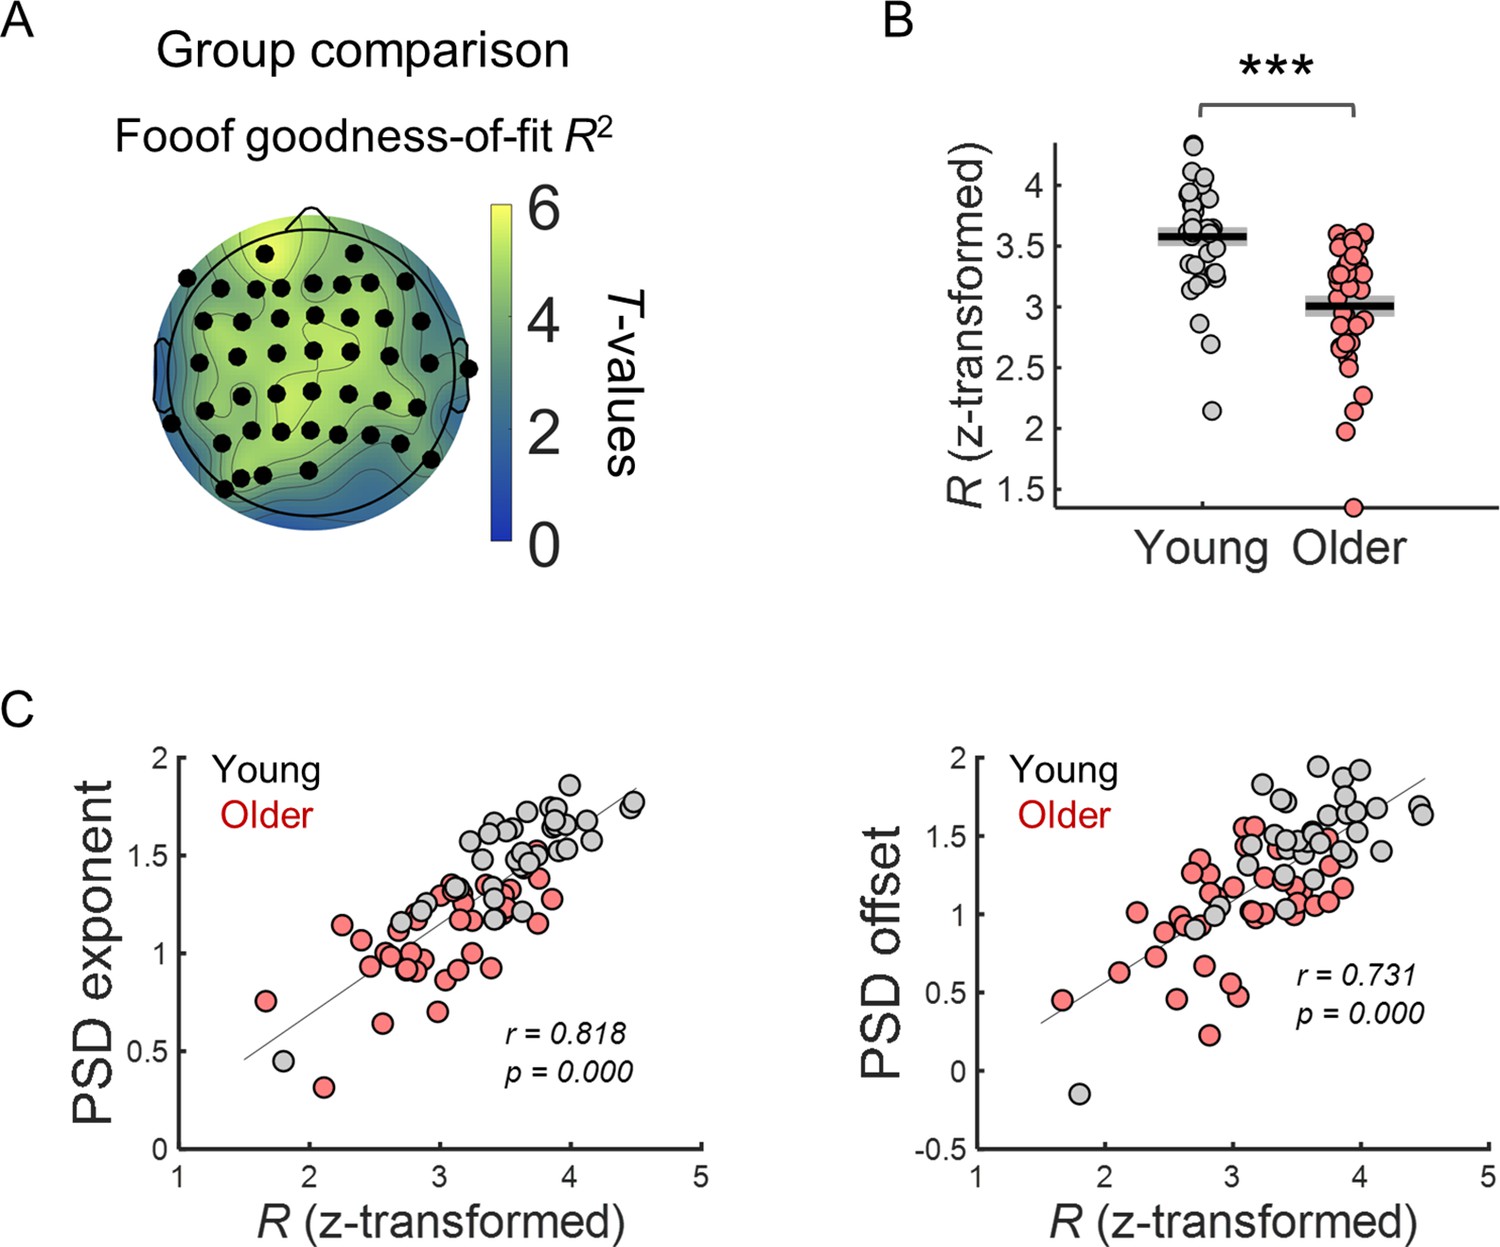
Goodness-of-fit of FOOOF model fitting to EEG spectral data was significantly different across groups and correlated with the model aperiodic parameters, exponent and offset.
(A) Scalp topographies of t-values from independent t-tests comparing goodness-of-fit R values (transformed into Fisher’s Z) across groups. Channels highlighted in black show statistically significant group differences after controlling for multiple comparisons. (B) Goodness-of-fit R (transformed into Fisher’s Z) of spectral data measured in electrode FCz. (C) FCz exponent and offset parameters plotted against goodness-of-fit R (transformed into Fisher’s Z). *** p<0.001 in independent samples t-test.
Figure 6 with 1 supplement
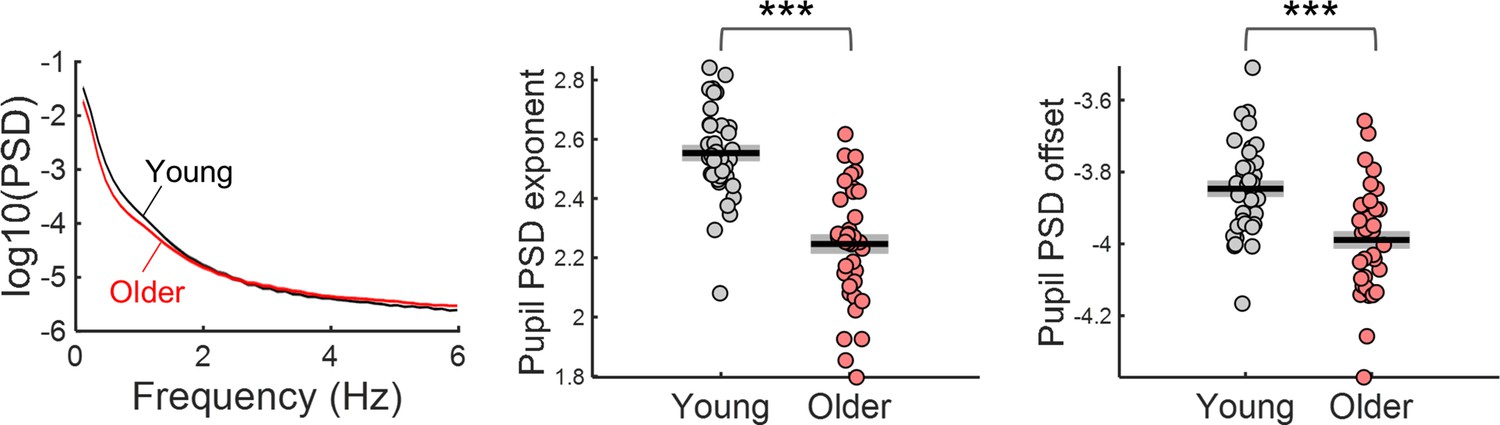
Power spectral density (PSD) of ongoing pupil signals acquired during passive fixation under constant luminance conditions.
Left, PSD graph represents across participants mean ± standard error of the mean of the young and older group. Centre and right, aperiodic parameters exponent and offset of young and older participants. Graphs depict individual data points (circles), mean (black horizontal line) and ± standard error of the mean across participants (grey box). *** p-value < 0.001 in independent samples t-tests.
Figure 6—figure supplement 1
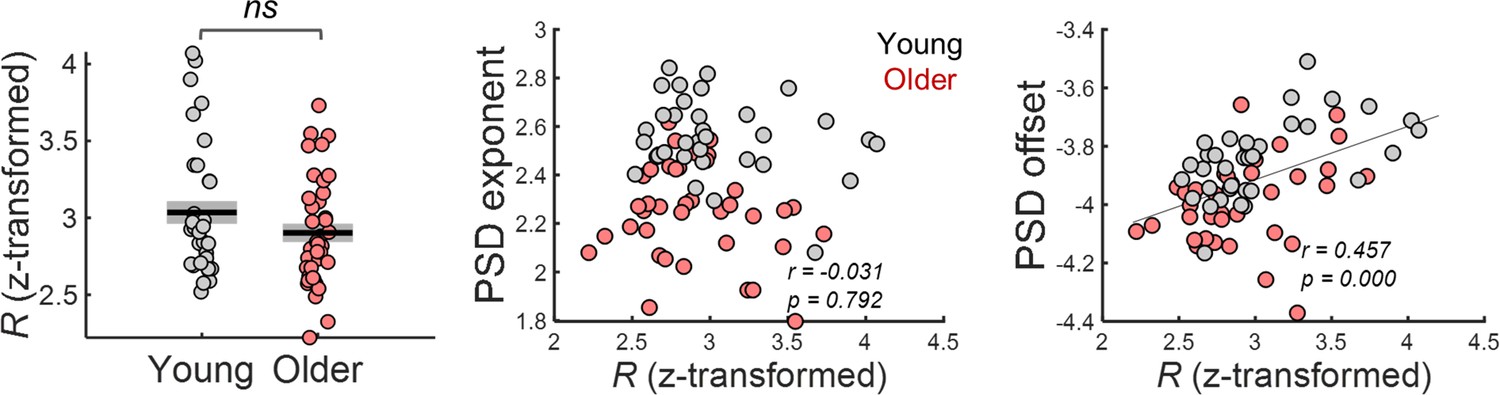
Goodness-of-fit of FOOOF model fitting to spectral pupil data, R (transformed into Fisher’s Z) was similar across groups [independent t-test: t(71) = 1.45, p=0.151].
Pupil power spectral density (PSD) offset but not the PSD exponent correlated with the R values (transformed into Fisher’s Z).
Figure 7 with 1 supplement
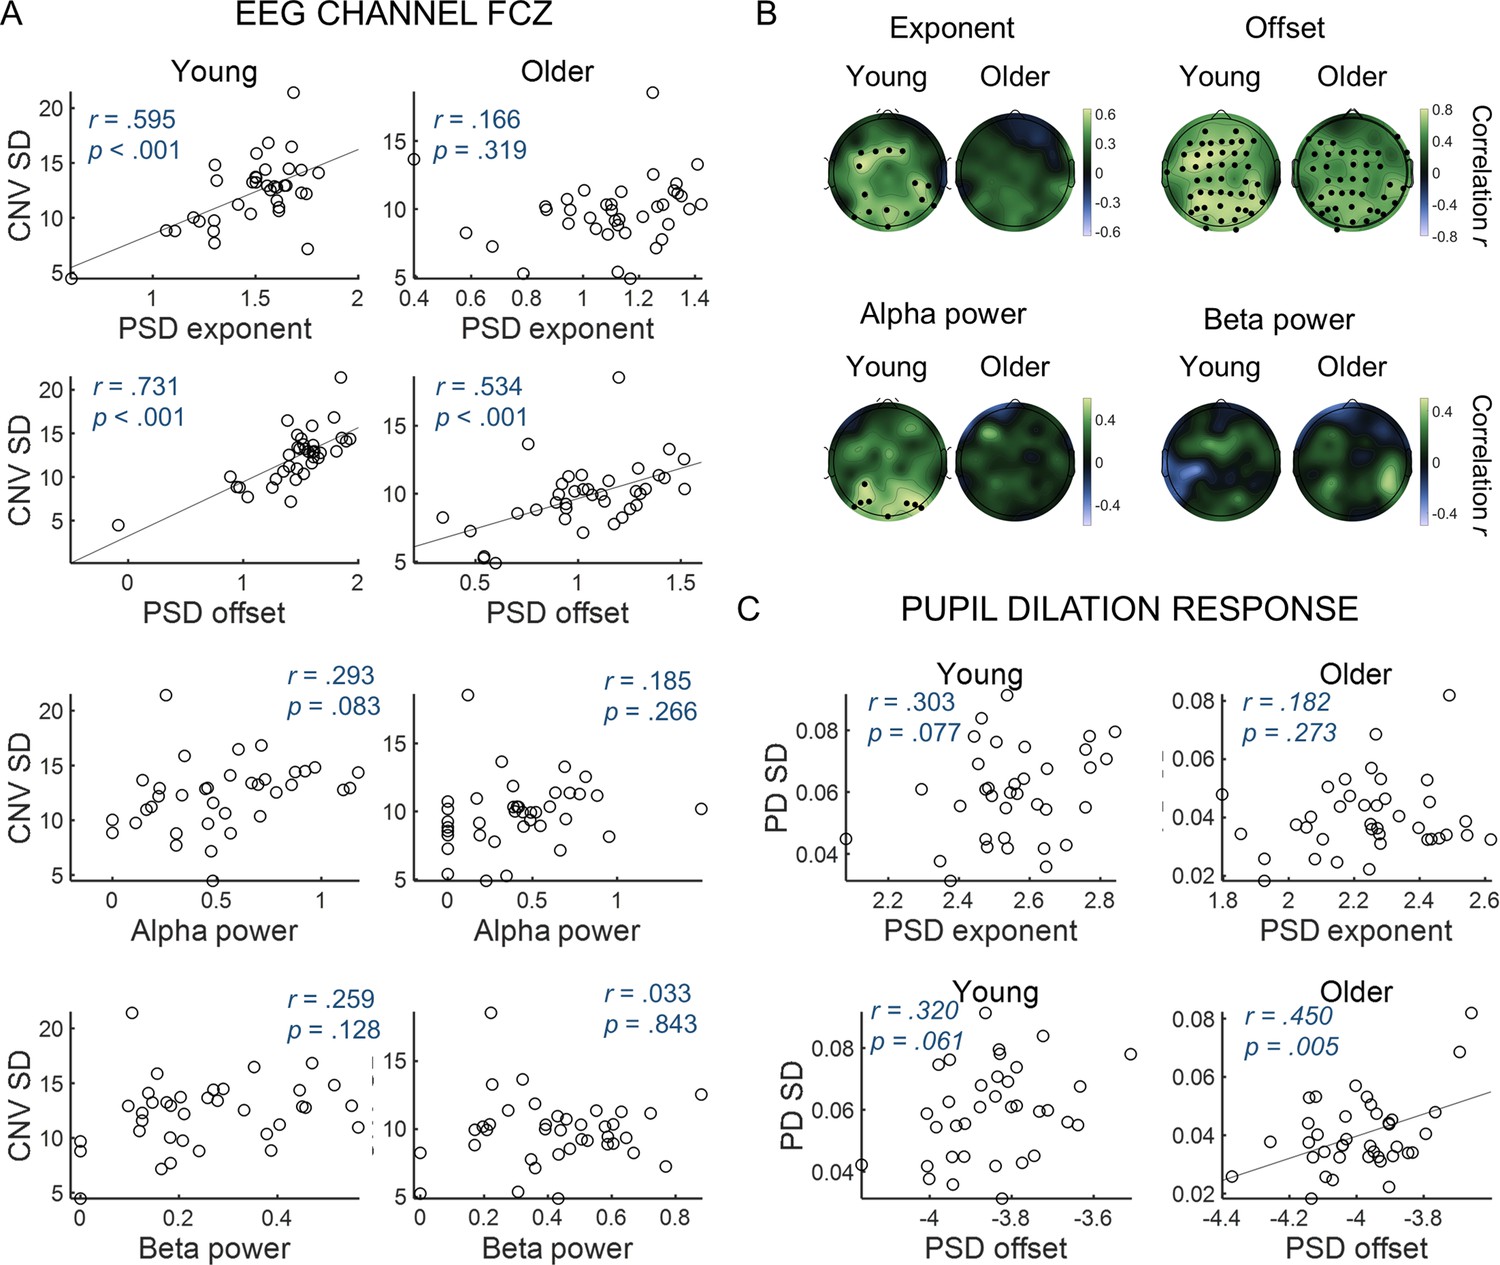
Variability in the amplitude of the evoked responses correlates with parameters of the power spectral density (PSD) of the ongoing signals.
(A) CNV variability measured in the FCz channel plotted against (from top to bottom) exponent, offset, alpha power or beta power estimated from the PSDs of ongoing pre-stimulus EEG signal measured in the same EEG channel. The correlation p-values shown were not corrected for multiple comparisons. (B) Scalp topographies of correlation coefficients between CNV variability and exponent, offset, alpha power or beta power estimated from the PSDs of ongoing pre-stimulus EEG signal. Black circles highlight electrodes where the correlations were significant after controlling for multiple comparisons. (C) Variability in the pupil dilation (PD) response [PD standard deviation (SD)] plotted against the aperiod parameters of the PSD of the ongoing pupil signal, exponent and offset.
Figure 7—figure supplement 1
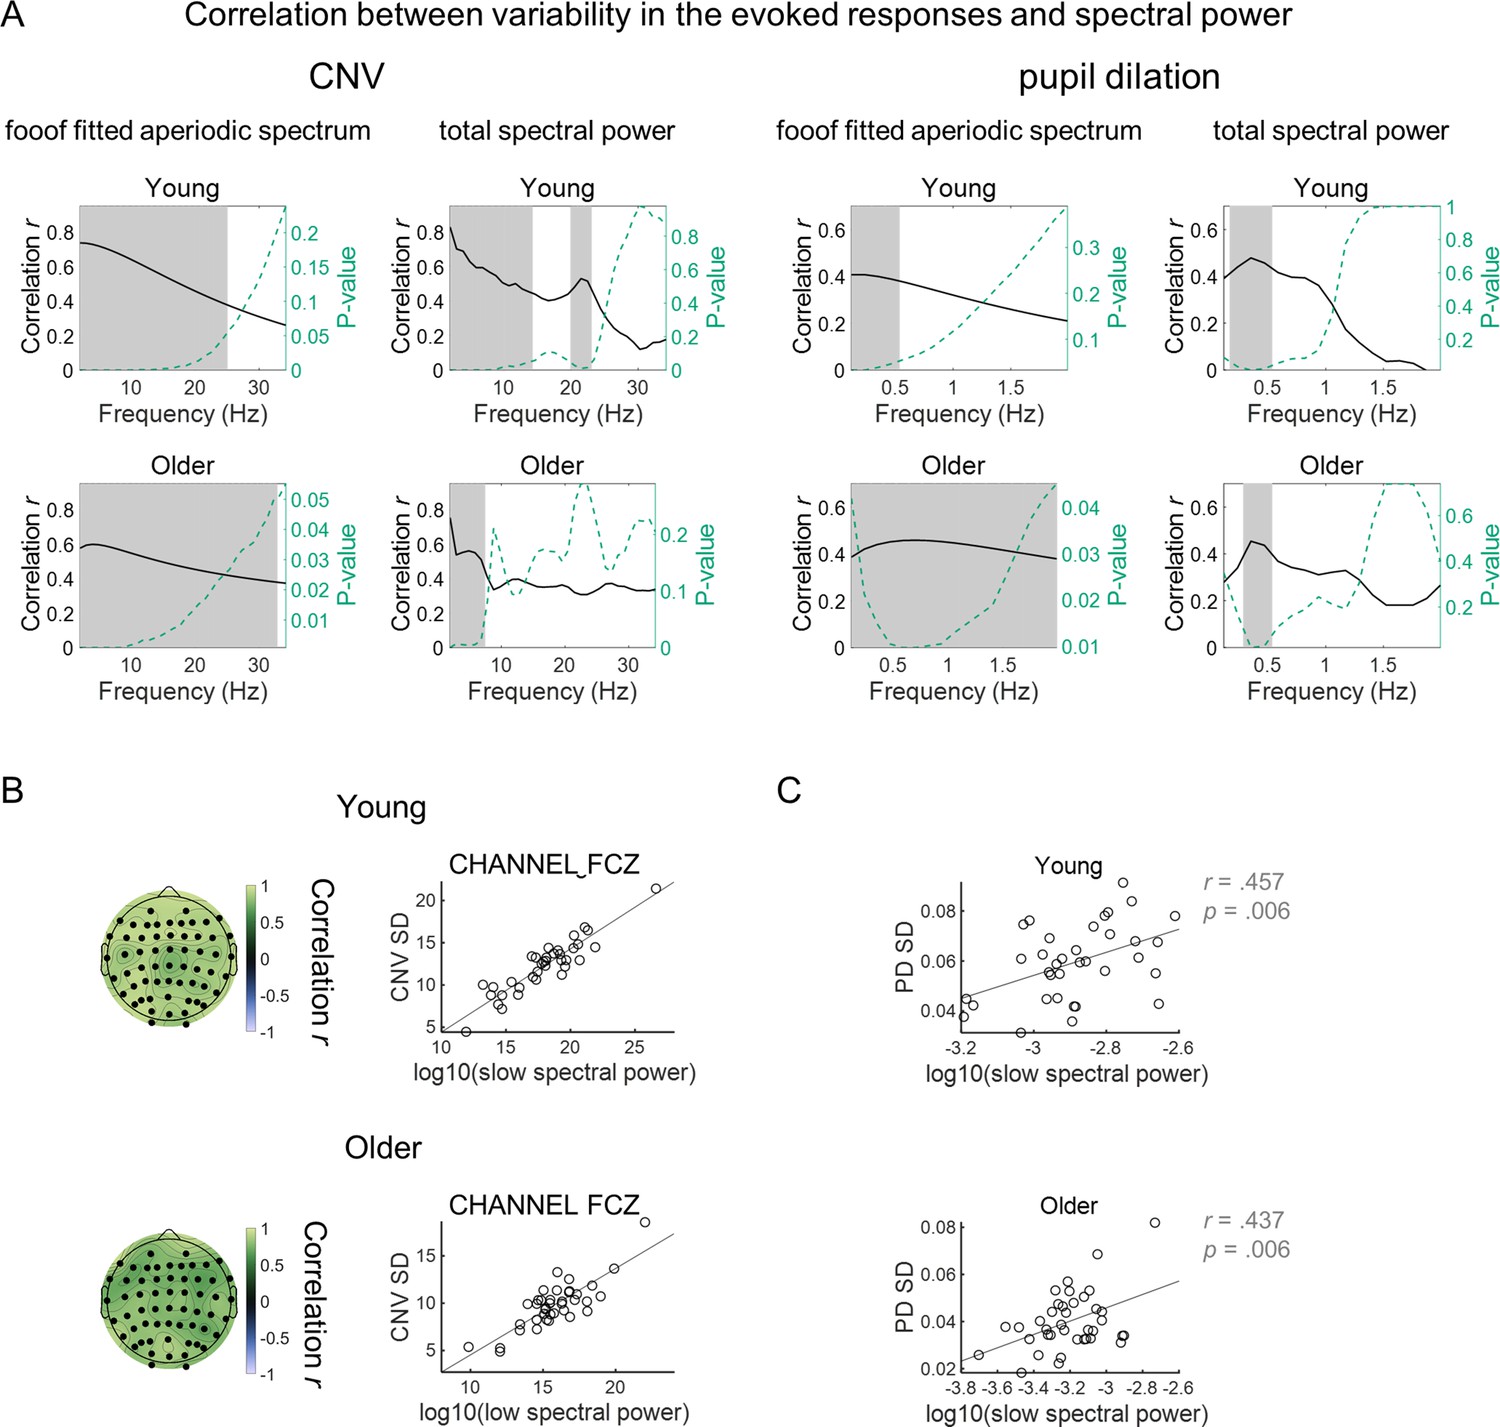
Power spectral densities (PSD) of ongoing signals correlate with variability in the evoked responses.
(A) Pearson’s linear correlation coefficients between the PSD at each frequency and the variability in the evoked responses of each participant. In the EEG signal, correlation between PSD and CNV variability was calculated in the FCz channel where the preparatory response presented highest amplitude. Grey background highlights the frequencies for which the correlation was significant. Permutation tests and the ‘max statistic’ method were used for adjusting the p-values at each frequency for multiple comparisons. (B) Left, scalp topographies of average correlation coefficients between CNV variability and power of PSDs of ongoing pre-stimulus EEG signal at 1 Hz, where correlation was highest in (A). Black circles highlight EEG channels where correlation coefficients were significantly different from zero after controlling for multiple comparisons. Right, CNV variability measured in the FCz channel plotted against power of PSDs of ongoing pre-stimulus EEG signal at 1 Hz measured in the same channel. (C) Pupil dilation (PD) response variability plotted against the power of PSDs of ongoing pupil signal at.4 Hz, the frequency at which correlation was highest in (A).
Figure 8
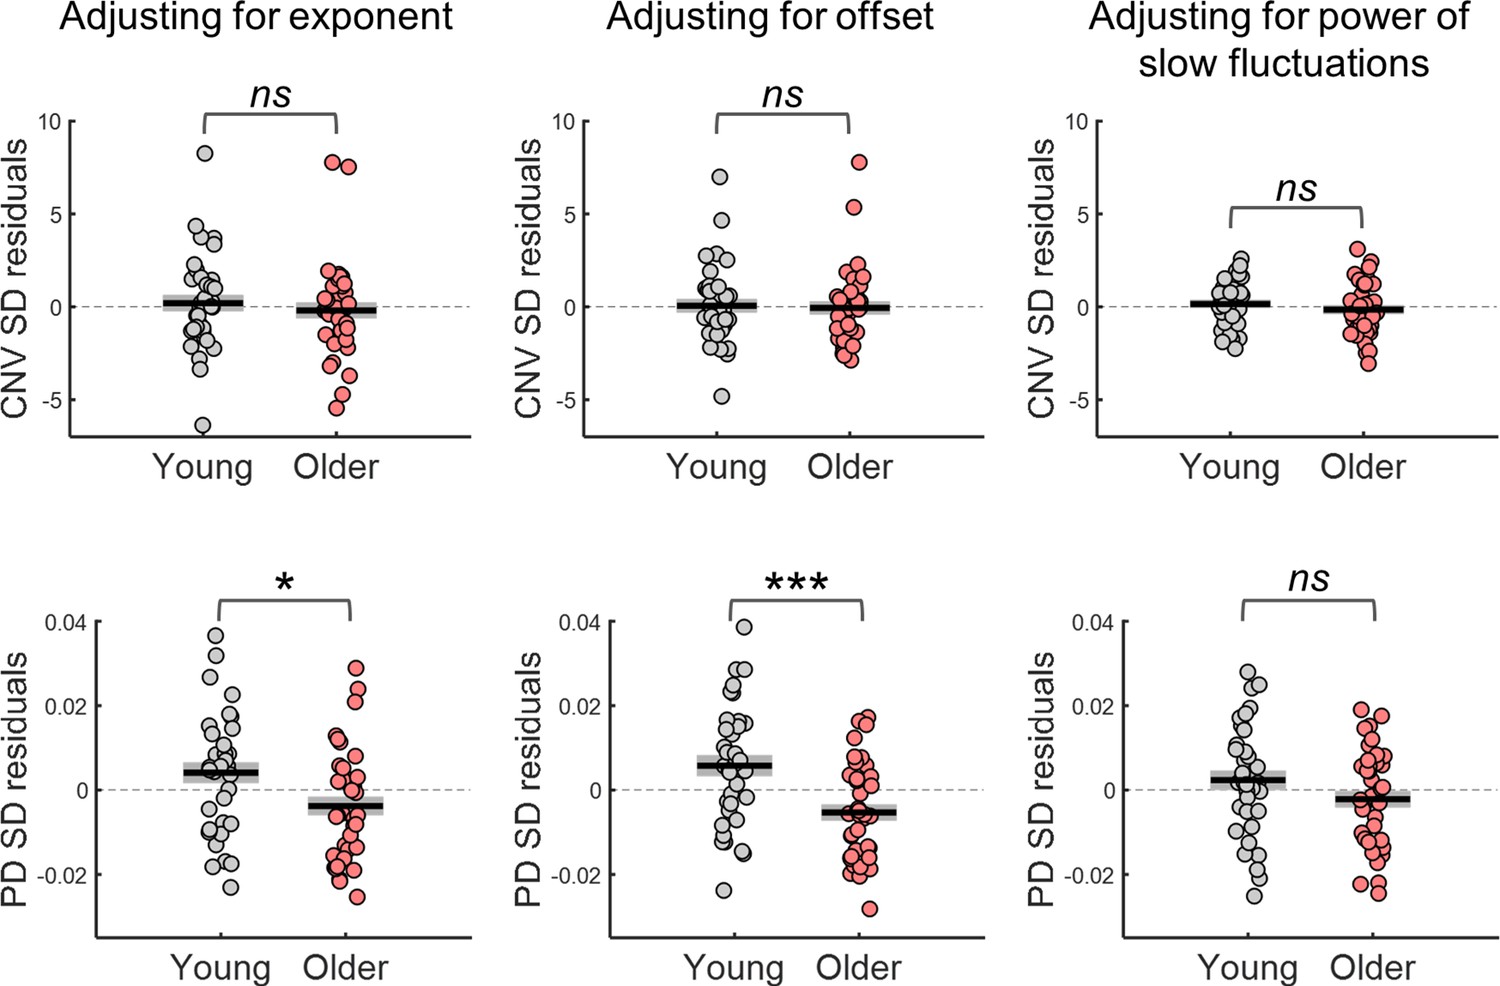
Variability in the amplitude of the evoked responses after adjusting for differences in the parameters of the power spectral density (PSD) of the respective ongoing signals.
Top, variability in CNV amplitude measured at electrode FCz; bottom, variability in pupil dilation (PD) responses. Left, adjusted for the PSD’s exponent; centre, adjusted for the PSD’s offset; right, adjusted for the power of the slow fluctuations (power at 1 Hz in the EEG and power at.44 Hz in the pupil signal). Graphs depict individual data points (circles), mean (black horizontal line) and ± standard error of the mean across participants (grey box). * p<0.05; *** p<0.001; ns = not significant, in independent samples t-tests comparing across groups.
Figure 9
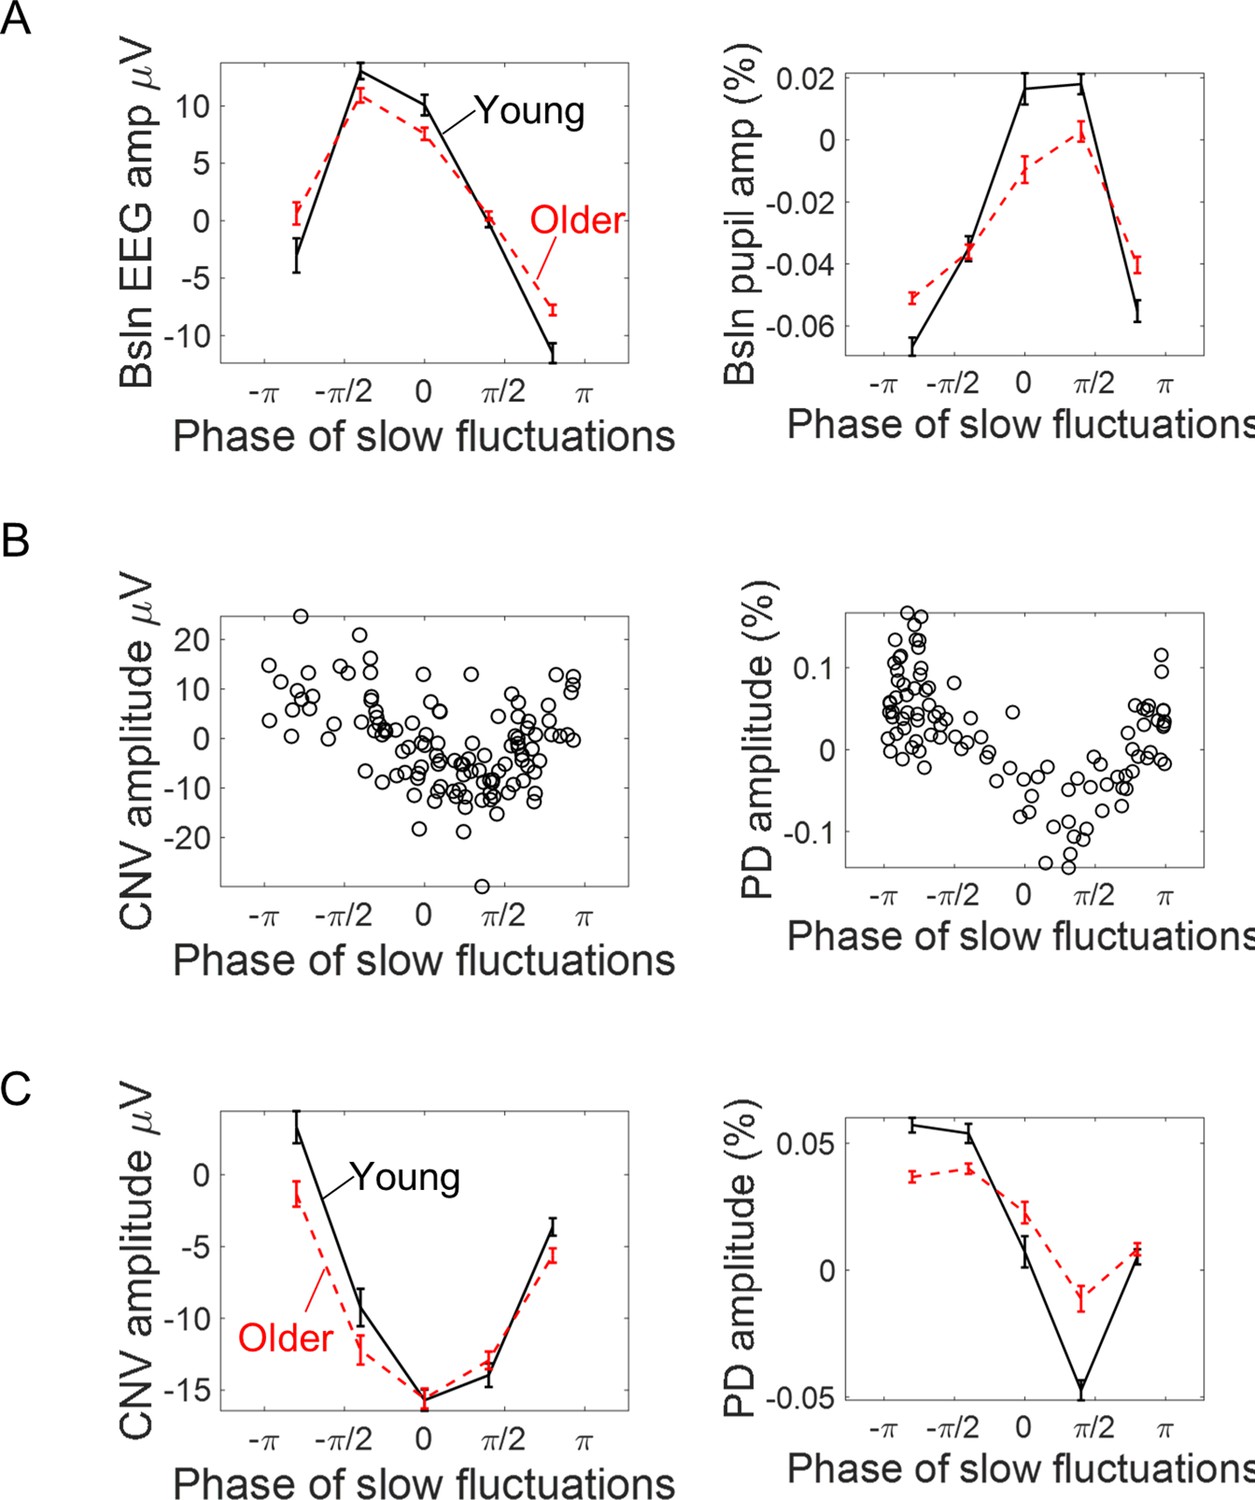
Association between the phase of slow ongoing fluctuations at cue-onset and the amplitude of the evoked responses in the EEG (left) and pupil (right) signals.
(A) Baseline (pre-cue) signal amplitude sorted accordingly to the estimated signal phase (mean ± standard error of the mean across participants). As expected, signal amplitude reaches its peak at zero phase and its minimum at ± π. (B) Example data from two participants showing how the single trial amplitude of the evoked responses changed with the phase of the ongoing slow fluctuations. (C) Amplitude of the evoked responses split into quintiles (within each participant) according to the phase of the ongoing signals at cue-onset (mean ± standard error of the mean across participants).
Figure 10
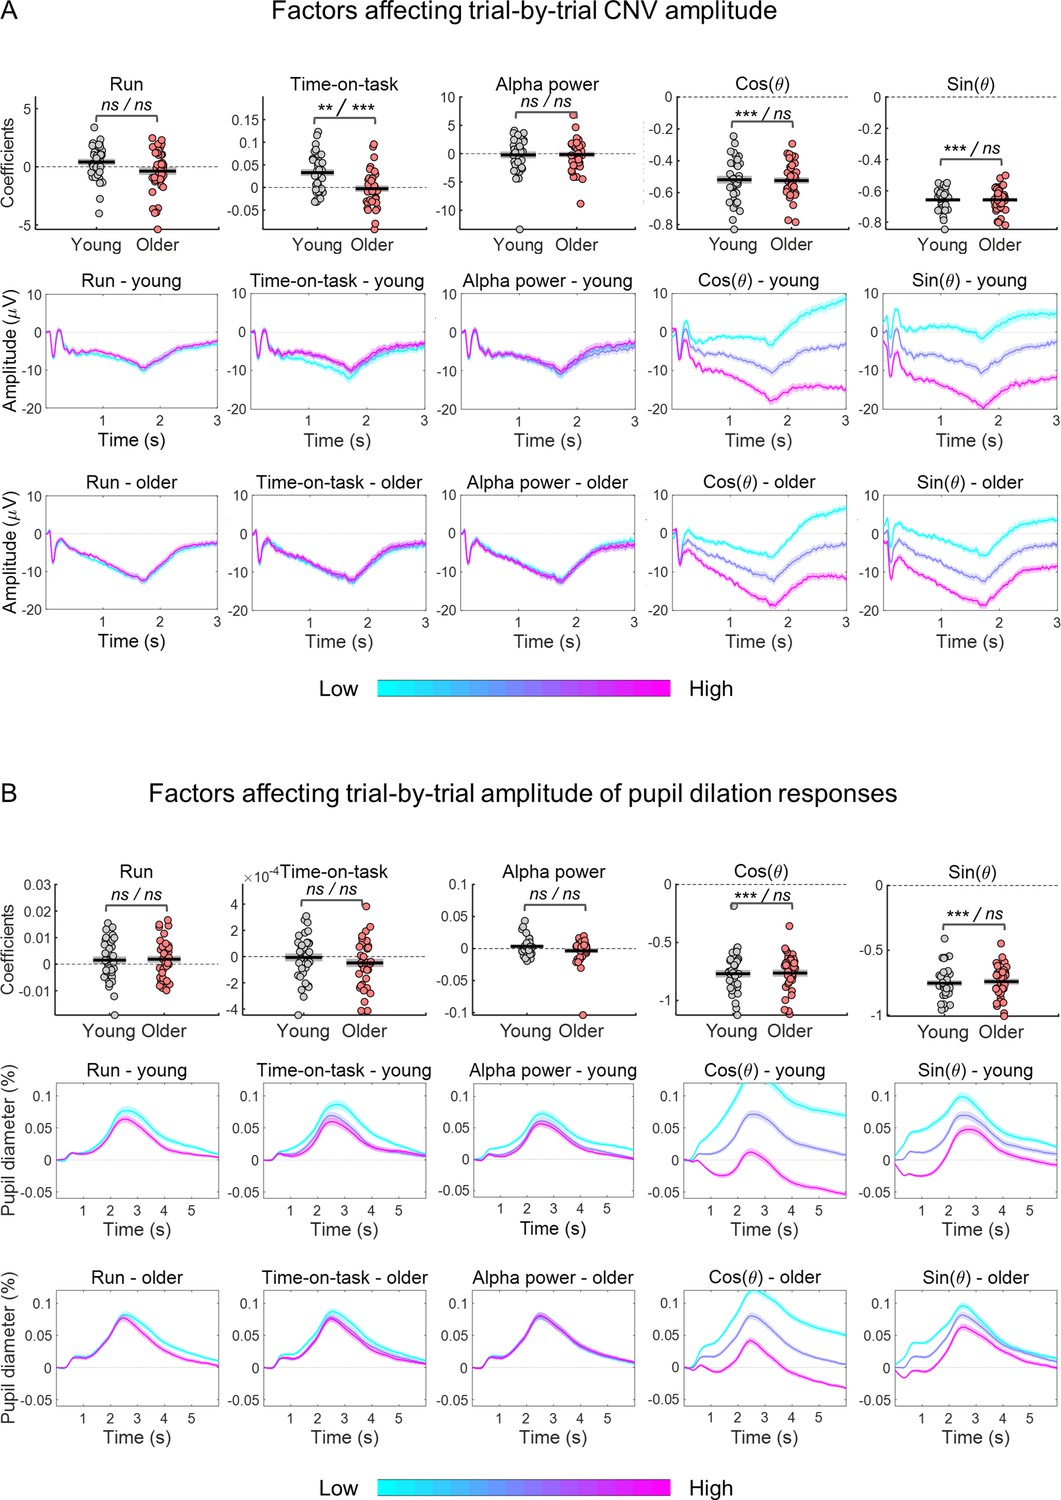
Estimated coefficients from within-subject generalized linear regression models (GLMs) including as response variable the amplitude of the evoked response and as predictors the effects of time-on-task, pre-stimulus alpha power and the cosine and sine of the phase at cue-onset of the ongoing slow fluctuations.
Run was included as categorical predictor. (A) Effect of predictors on CNV amplitude measured at FCz. (B) Effect of predictors on pupil dilation response (PD) amplitude. (A and B) Top, graphs depicting estimated coefficients (circles = individual data points; black horizontal line = across participants mean; grey box = ± standard error of the mean across participants). Middle and bottom, cue-locked evoked responses divided in tertiles (within each participant) sorted according to each of the predictors (mean ± standard error of the mean across participants). Note, that the graphs show raw responses not adjusted for the other predictors. Statistical comparisons: one sample t-test including all participants / independent samples t-test comparing across groups - ** p<0.01; *** p<0.001; ns = not significant.
Figure 11 with 1 supplement
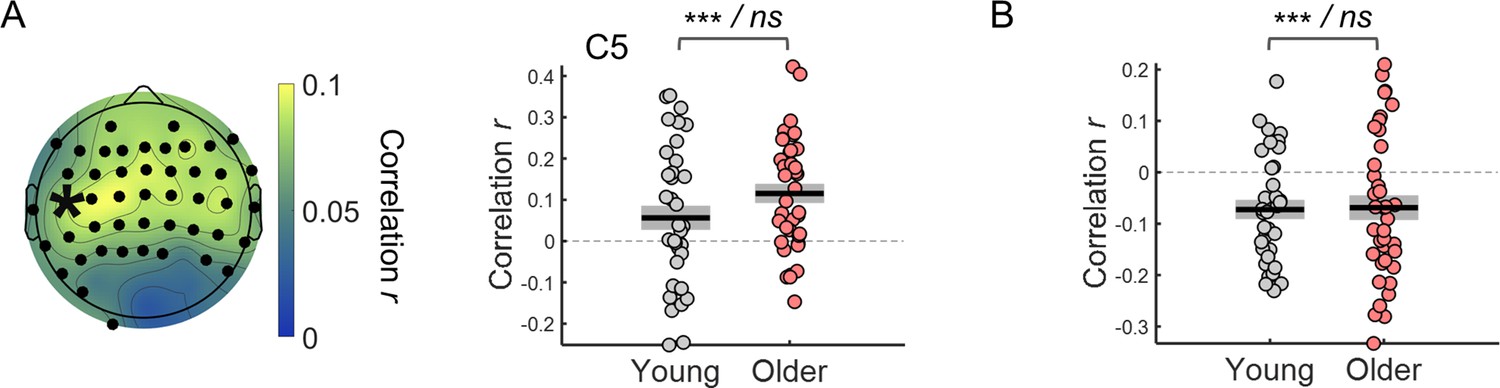
Within-subject correlation between single trial amplitude of the preparatory evoked responses adjusted for the effect of the ongoing signal fluctuations and reaction time.
(A) Left, scalp topographies of correlation coefficients. Electrodes where the correlation coefficients were significantly different from zero after controlling for multiple comparisons are highlighted in black. Right, example of correlation coefficients between the CNV amplitude adjusted for ongoing signal phase fluctuations measured in the channel C5 (marked with an asterisk in the scalp topography) and reaction time. (B) Correlation coefficients between the amplitude of the pupil dilation responses adjusted for the phase of the ongoing signal fluctuations and reaction time (circles = individual data points; black horizontal line = across participants mean; grey box = ± standard error of the mean across participants). Statistical comparisons: one sample t-test including all participants / independent samples t-test comparing across groups - *** p<0.001; ns = not significant.
Figure 11—figure supplement 1
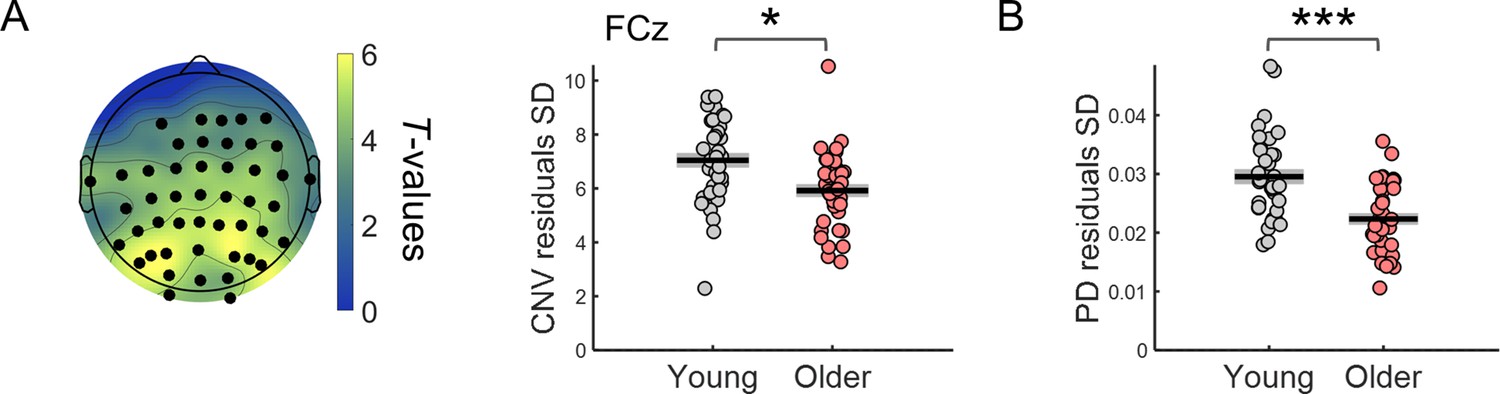
After regressing out the effect of ongoing slow fluctuations the variability of the evoked responses was still significantly reduced in the older group.
(A) Left, scalp topographies of t-values from independent samples t-tests comparing the across trials standard deviation (SD) of CNV amplitude adjusted for the phase of ongoing EEG signal at cue-onset, in young and older individuals. Black circles highlight EEG channels that show significant group differences after controlling for multiple comparisons. Right, CNV amplitude SD after regressing out the effect of the phase of ongoing EEG slow fluctuations at cue-onset measured at the EEG channel FCz. (B) Pupil dilation (PD) response SD after regressing out the effect of the phase of ongoing pupil slow fluctuations at cue-onset. Independent samples t-test revealed a significant effect of group [t(71)=4.68, p<0.001]. Circles = individual data points; black horizontal line = across participants mean; grey box = ± standard error of the mean across participants. *** p<0.001; * p<0.05, in independent samples t-tests comparing across groups.
Figure 12
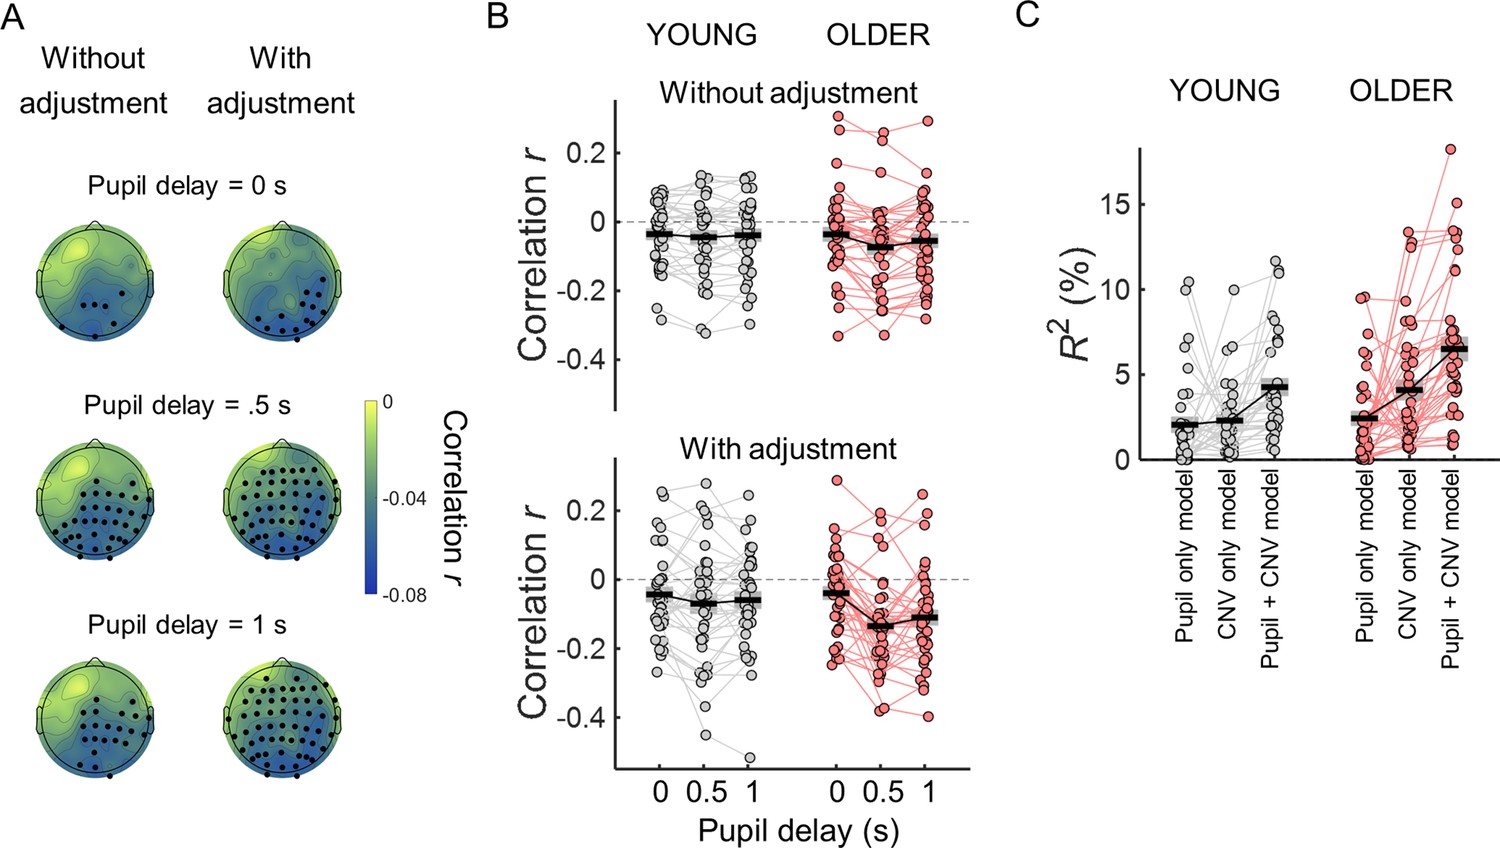
The CNV and the pupil response are correlated, nevertheless each contributes independently towards reaction time.
(A) Scalp topographies of within-subject correlation values between single trial CNV amplitude values and single trial pupil dilation (PD) amplitude values (across participants average correlation coefficients including all participants) for the three time windows used to calculate pupil dilation average amplitude. Correlation coefficients were estimated using the ‘raw’ amplitude of the preparatory evoked responses (left), or after adjusting the amplitude of the evoked responses for the effect of the ongoing slow signal fluctuations (right). EEG channels where the correlation coefficients were significantly different from zero after controlling for multiple comparisons are highlighted in black. (B) Across channels average correlation coefficients between single-trial CNV and pupil responses for both age groups for the three pupil time windows and adjusting or not the signals for the effect of the ongoing slow signal fluctuations. (C) Total variance explained (R2) by the multiple regression models including reaction time as dependent variable and as independent variables CNV and/or PD residuals adjusted for the signal phase at baseline. Circles = individual data points; black horizontal line = across participants mean; grey box = ± standard error of the mean across participants.
Additional files
Download links
A two-part list of links to download the article, or parts of the article, in various formats.
Downloads (link to download the article as PDF)
Open citations (links to open the citations from this article in various online reference manager services)
Cite this article (links to download the citations from this article in formats compatible with various reference manager tools)
Slow fluctuations in ongoing brain activity decrease in amplitude with ageing yet their impact on task-related evoked responses is dissociable from behavior
eLife 11:e75722.
https://doi.org/10.7554/eLife.75722


