Association analyses of host genetics, root-colonizing microbes, and plant phenotypes under different nitrogen conditions in maize
- Department of Agronomy and Horticulture, University of Nebraska-Lincoln, United States
- Center for Plant Science Innovation, University of Nebraska-Lincoln, United States
- Department of Biochemistry, University of Nebraska-Lincoln, United States
- Department of Plant Pathology, University of Nebraska-Lincoln, United States
- Biological Systems Engineering Department, University of Nebraska-Lincoln, United States
Figures
Figure 1 with 3 supplements
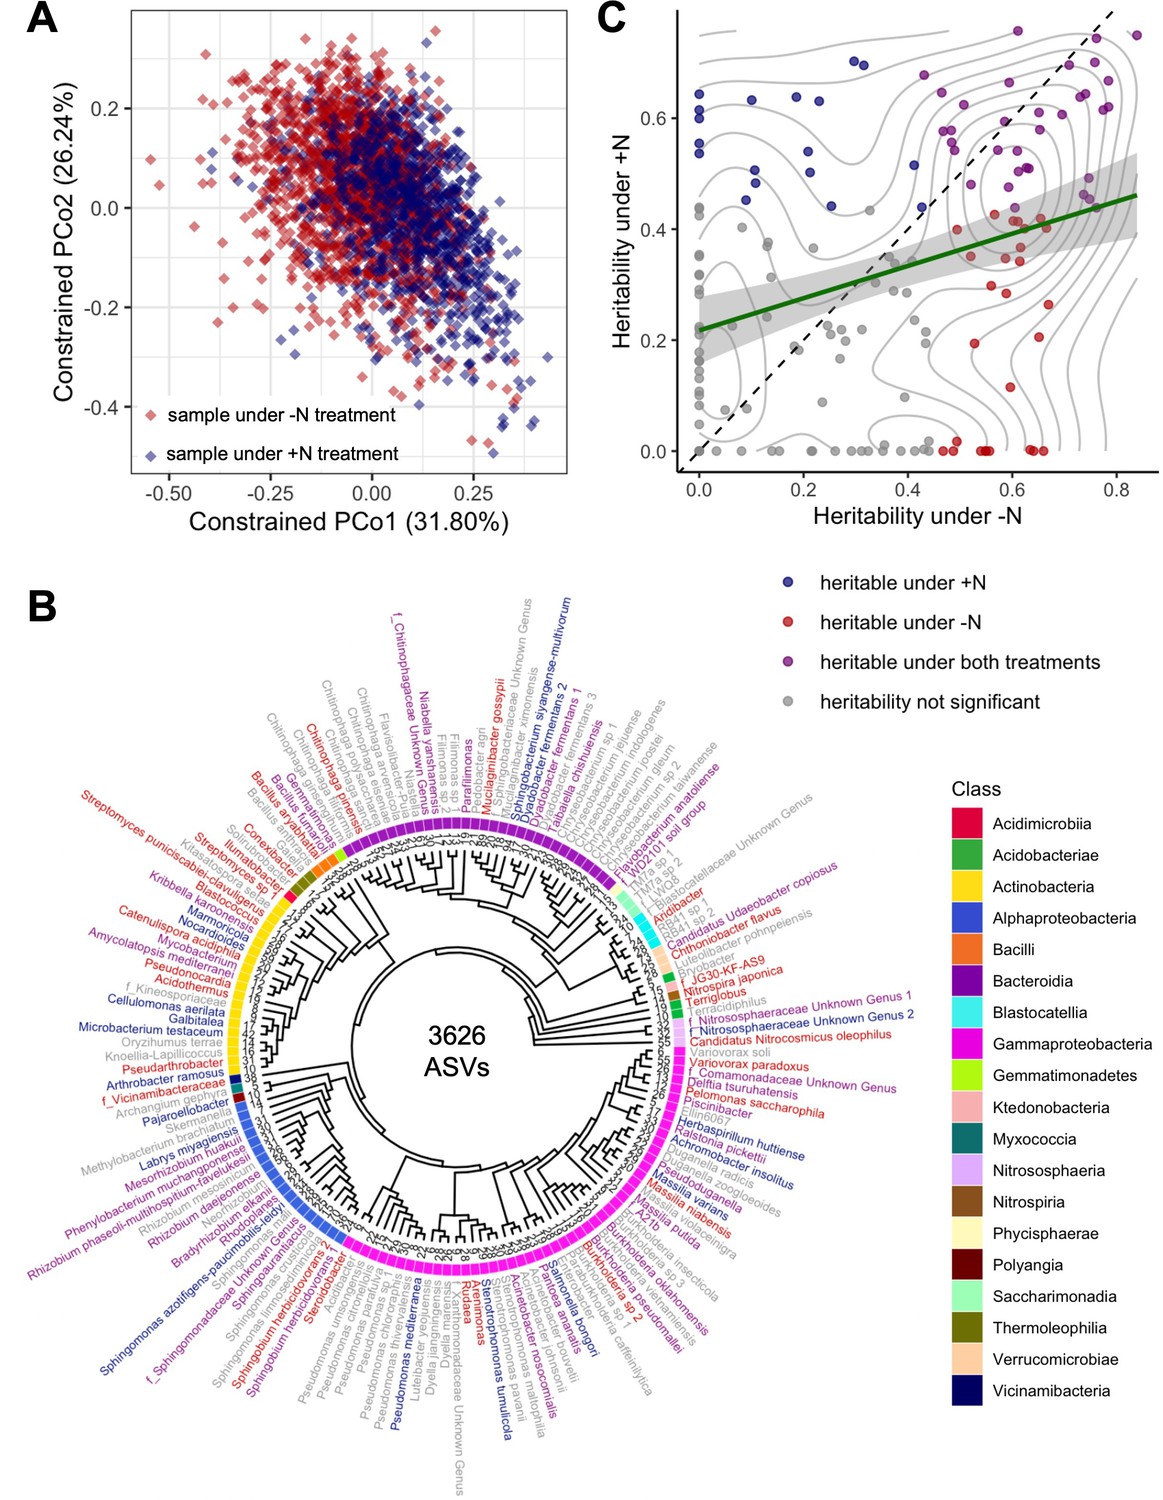
Diversity, phylogenetics, and heritability of rhizobiome traits.
(A) Constrained ordination analysis showing the largest two principal coordinates calculated from the abundances of 3626 ASVs. Each diamond represents one sample collected from plants under +N (blue) and -N (red) treatment, respectively. Note the separation of N treatments along PCo1. (B) Phylogenetic tree of 150 taxonomic groups of rhizosphere microbiota (‘rhizobiome traits’) generated by clustering 3626 ASVs. Families are prefixed with ‘f_’, genus and species names are given where known. Numbers at tree tips indicate distinct ASVs in each group. Label colors indicate heritability of each rhizobiome trait as in panel C. (C) Heritability (h2) calculated for all 150 rhizobiome traits under +N and -N treatments. Green line indicates linear regression with 95% confidence interval, r2=0.104. Diagonal dashed line denotes identity. Gray lines mark density of data points. Colors indicate whether traits are significantly heritable under either or both N treatments, as determined through a permutation analysis using 1000 permutations.
Figure 1—figure supplement 1
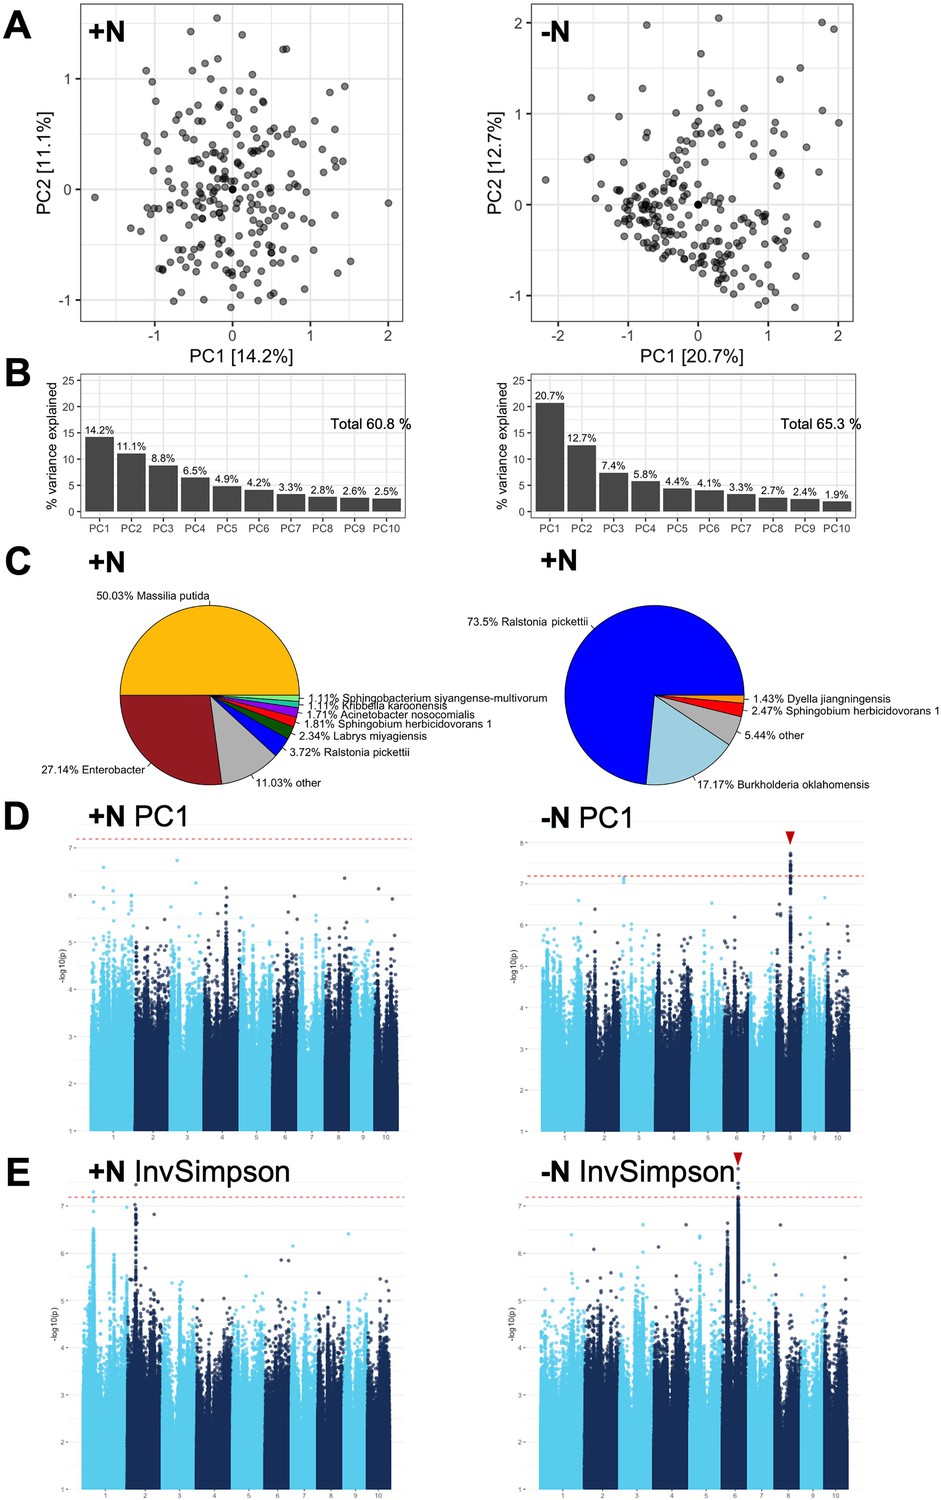
GWAS of high-level rhizobiome traits.
(A, B) The first 10 principal components were calculated for both the high N (left) and low N (right) treatment using the best linear unbiased prediction (BLUPs) of the log(relative abundance) of 3618 ASVs in 230 maize genotypes. Total variance explained was 60.8% for +N and 65.3% for -N. (C) The largest contributors to PC1 differed between the two experimental conditions. Microbial groups that account for at least 1% of total variance are annotated in the pie charts. (D, E). Notable GWAS signals above the significance threshold (dashed red line) were observed in the -N treatment for PC1 and the InvSimpson diversity metric (red arrows), indicating genomic loci that affect high-level metrics of the rhizobiome. The other PCs and diversity metrics had no strong GWAS signals and were not shown.
Figure 1—figure supplement 2
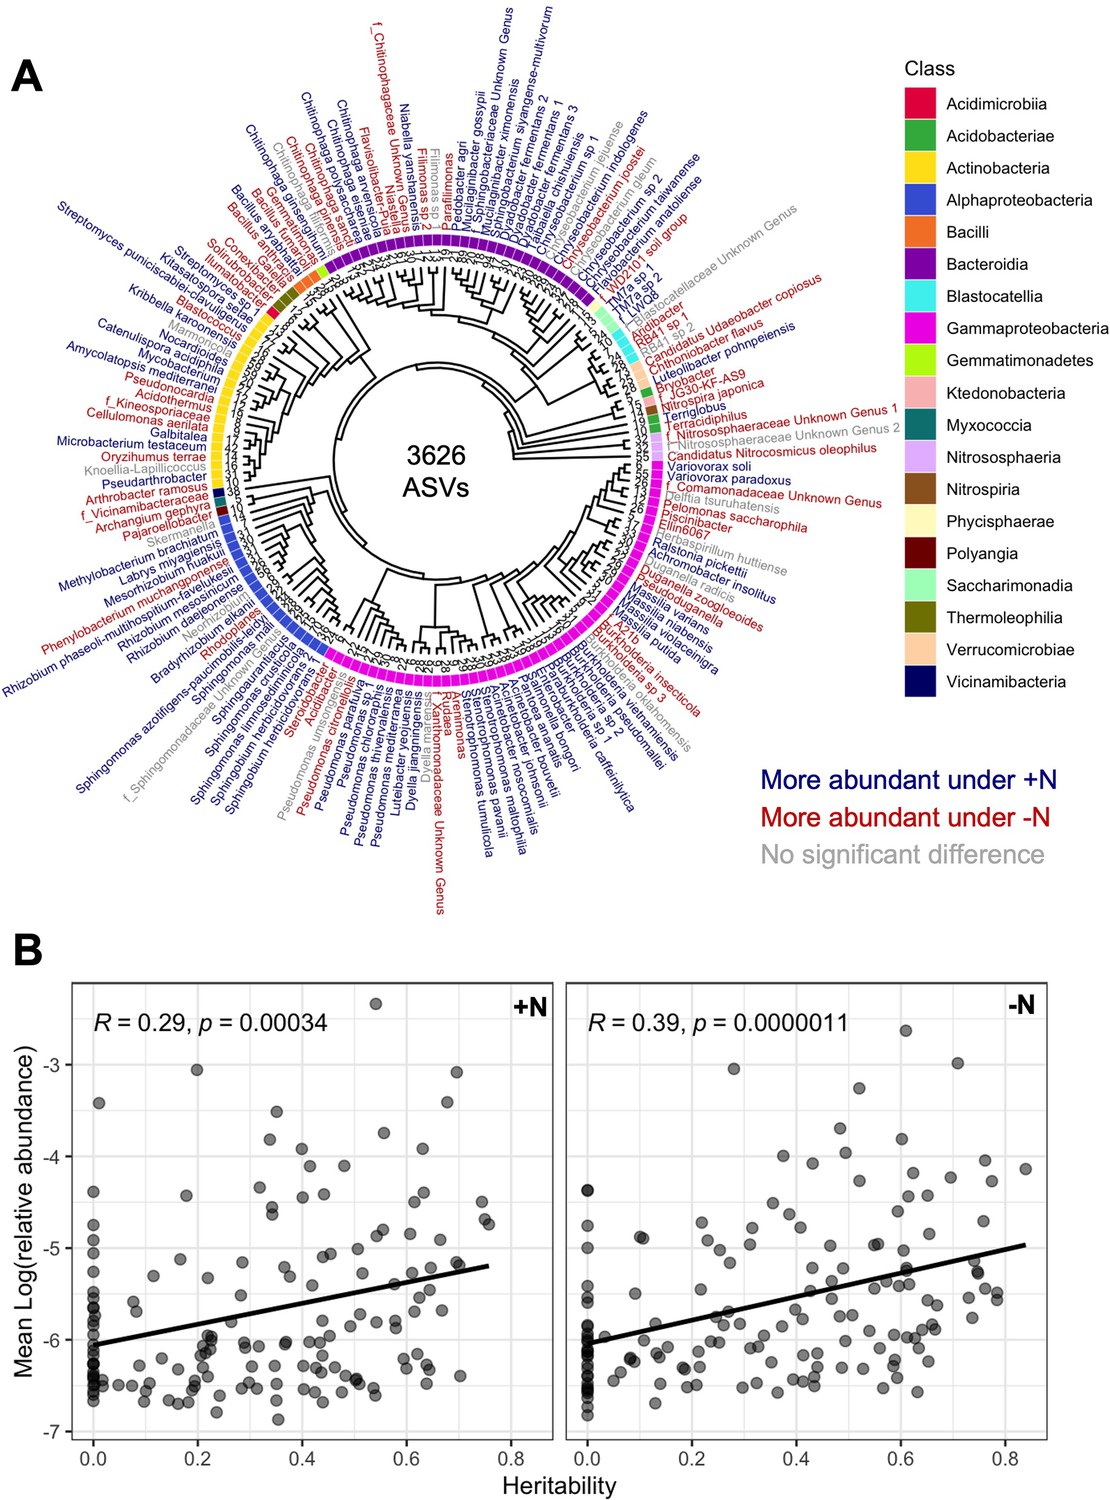
Abundance and heritability of 150 microbial groups.
(A) Phylogenetic tree of 150 microbial groups. Colors indicate differential abundance between the +N and -N treatment. (B) The mean abundance (mean BLUP of log(relative abundance) across 230 maize genotypes) of each microbial group was plotted against the heritability score in the +N and -N treatment. A positive correlation is observed in both environments, indicating that more abundant microbes in the rhizosphere also tend to be more heritable.
Figure 1—figure supplement 3
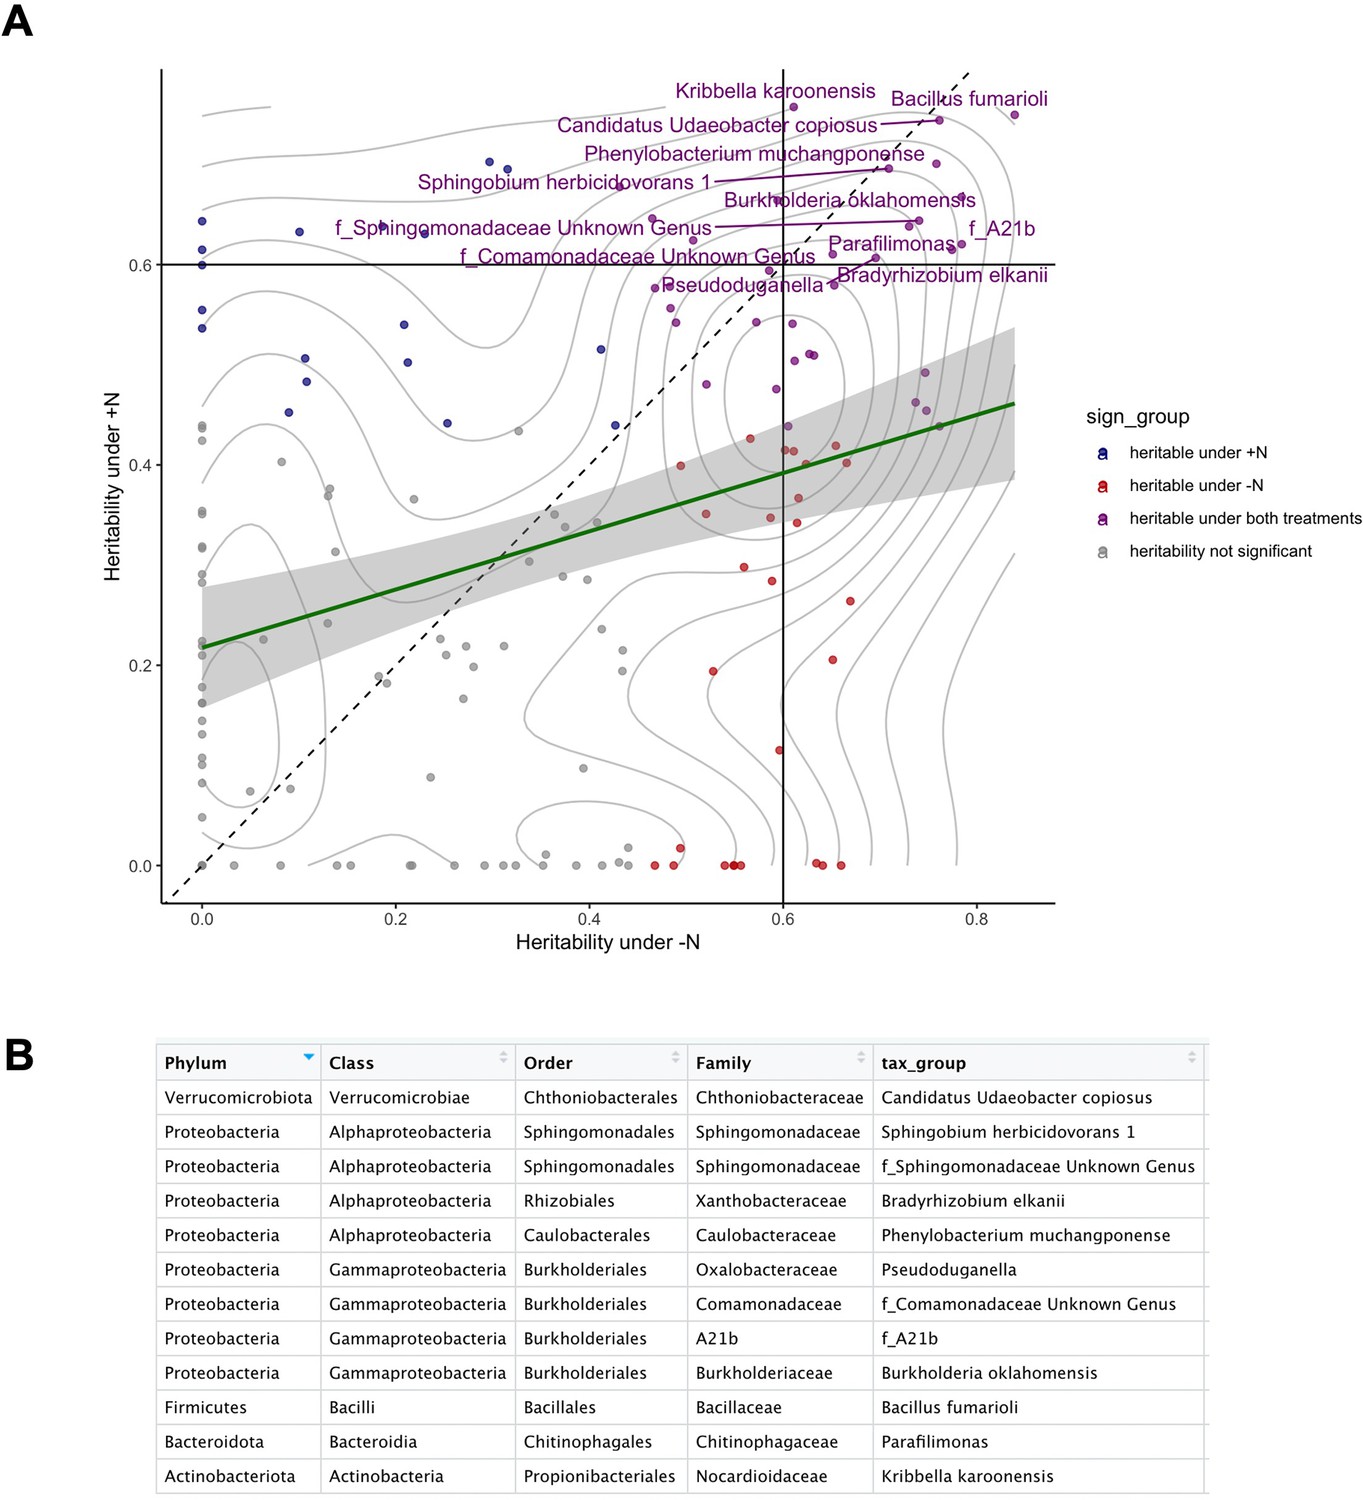
Annotations of heritable microbial groups.
(A) The 12 most heritable microbial groups with heritability >0.6 (drawn lines) under both N conditions were annotated by name. (B) Taxonomy of the 12 most heritable groups.
Figure 2 with 1 supplement

Population parameters estimated from genome-wide SNPs for plant and rhizobiome traits.
Selection coefficients (S value) of rhizobiome (A) and plant (B) traits calculated for both N treatments using genome-wide independent SNPs. A negative S value indicates negative (purifying) selection, and a positive S value indicates positive (directional) selection. Traits are shown that show significant selection under one or both N treatments. (C) Number of SNPs showing non-zero effects for both plant and rhizobiome traits. (D) Examples of positive (Bacillus fumarioli) and purifying selection (f_Comamonadaceae Unknown Genus) showing minor allele effect vs. allele 1 frequency with data skew to the right and to the left, respectively.
Figure 2—figure supplement 1
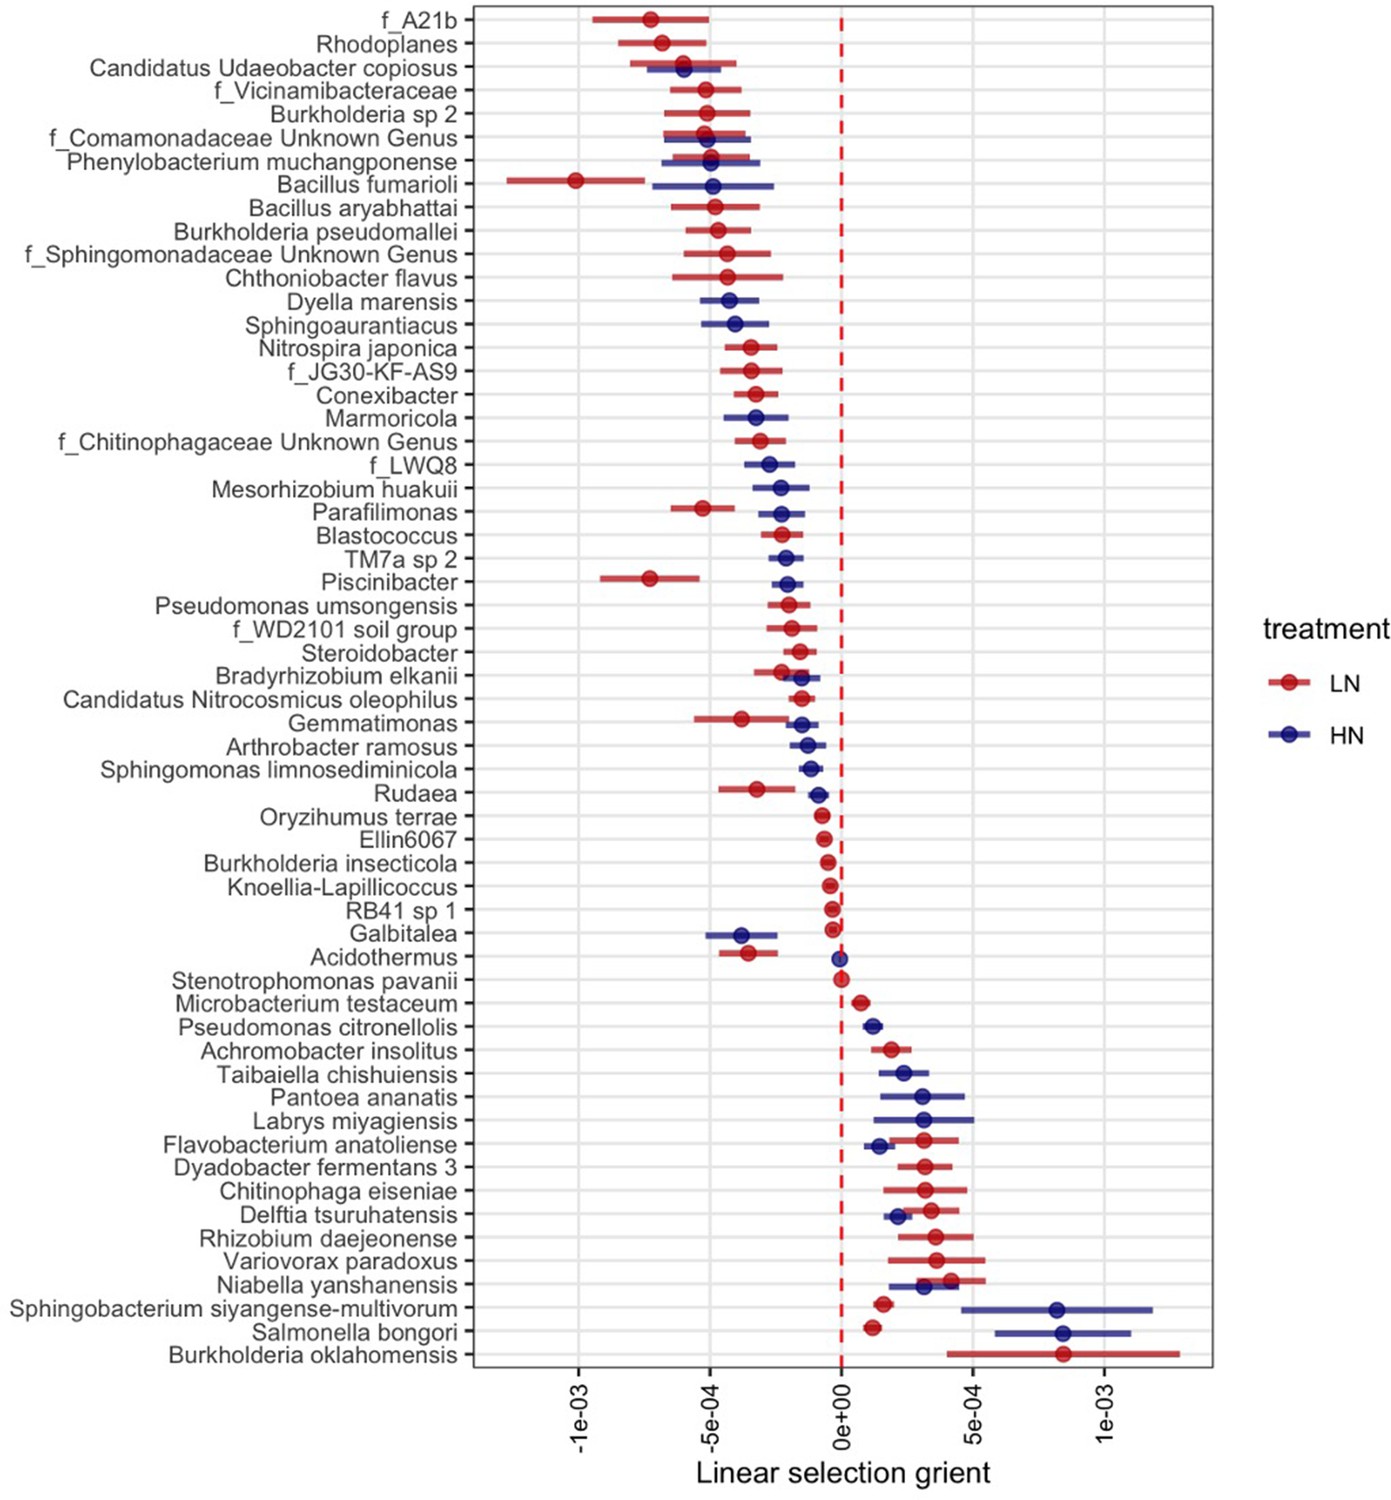
Rhizobiome traits exhibit significant linear selection differentials (bootstrapping p-value <0.05) under +N and -N treatments.
Figure 3
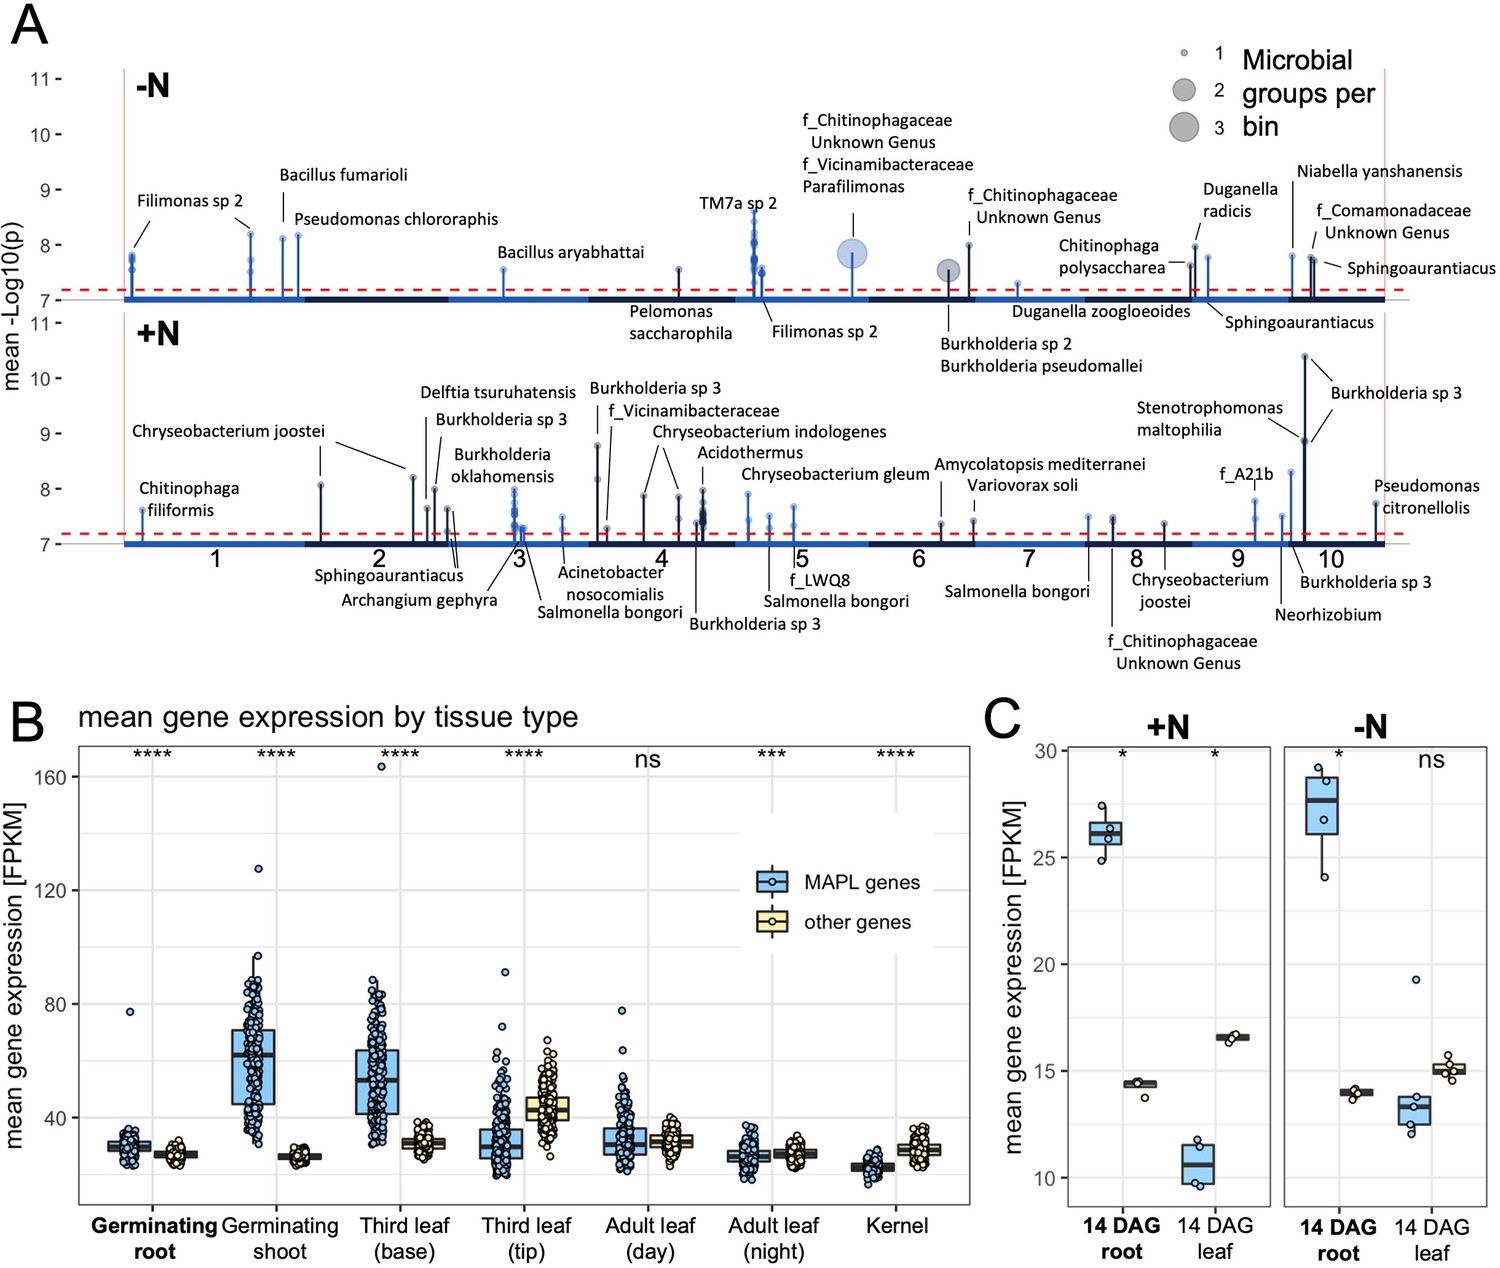
Microbe associated plant loci (MAPLs) contain genes expressed in roots.
(A) GWAS of 150 rhizobiome traits reveals microbe-associated plant loci across the maize genome. Dashed line indicates the -log10(p)=7.2 significance level for GWAS signals. Circles on top of peaks at each MAPL indicate the number of rhizobiome traits associated with each locus. Each MAPL is annotated with the associated rhizobiome trait(s) that showed significant GWAS signals. (B) Mean gene expression of 73 MAPL genes and 29,771 other genes in seven tissue types, measured in 298 genotypes of the maize diversity panel (Kremling et al., 2018). (C) Mean gene expression of 97 MAPL genes and 44,049 other genes in two tissue types, measured in the present study in four maize genotypes under +N and -N treatments.
Figure 4 with 2 supplements
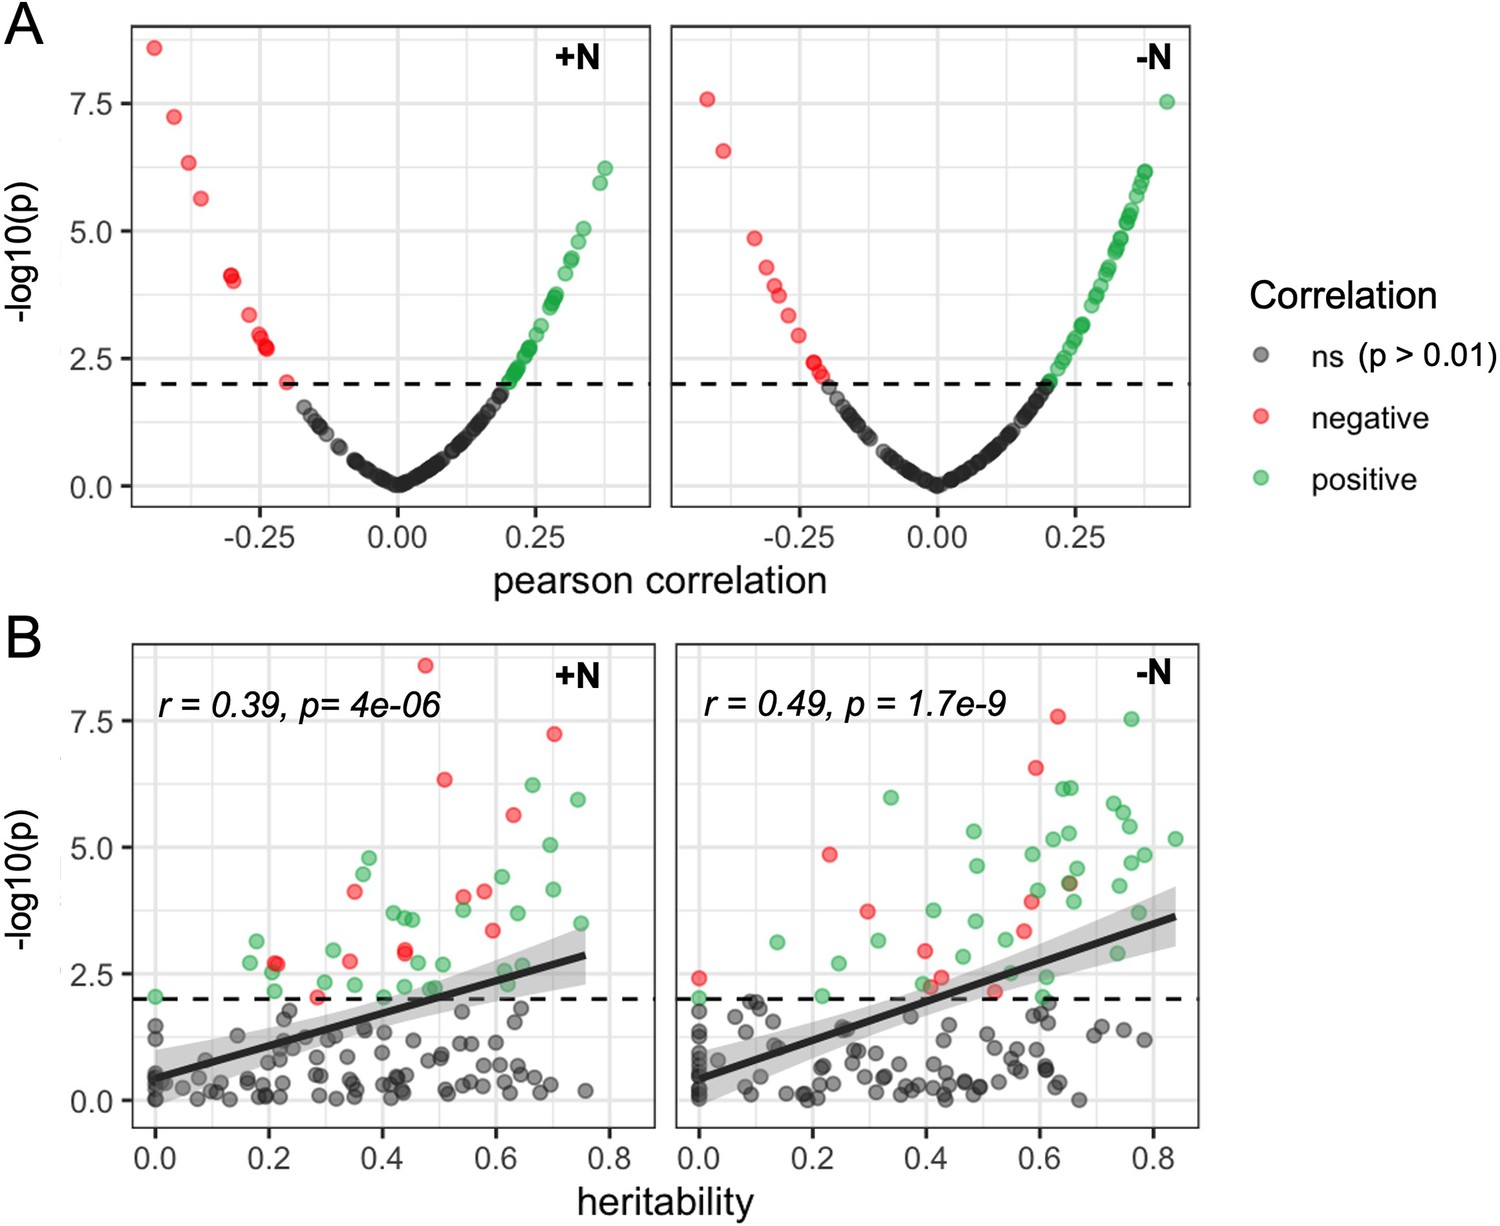
Heritable microbial groups tend to be correlated with whole plant canopy coverage.
(A) Distribution of statistical significance and correlation values for the relationship between canopy coverage (CC) and each of 150 microbial groups under either +N or -N conditions. Dashed line indicates significance level (p=0.01). (B) Relationship between the estimated heritability of individual rhizobiome traits and correlation of the same individual rhizobiome traits with variation in CC. Dashed line indicates significance level (p=0.01).
Figure 4—figure supplement 1
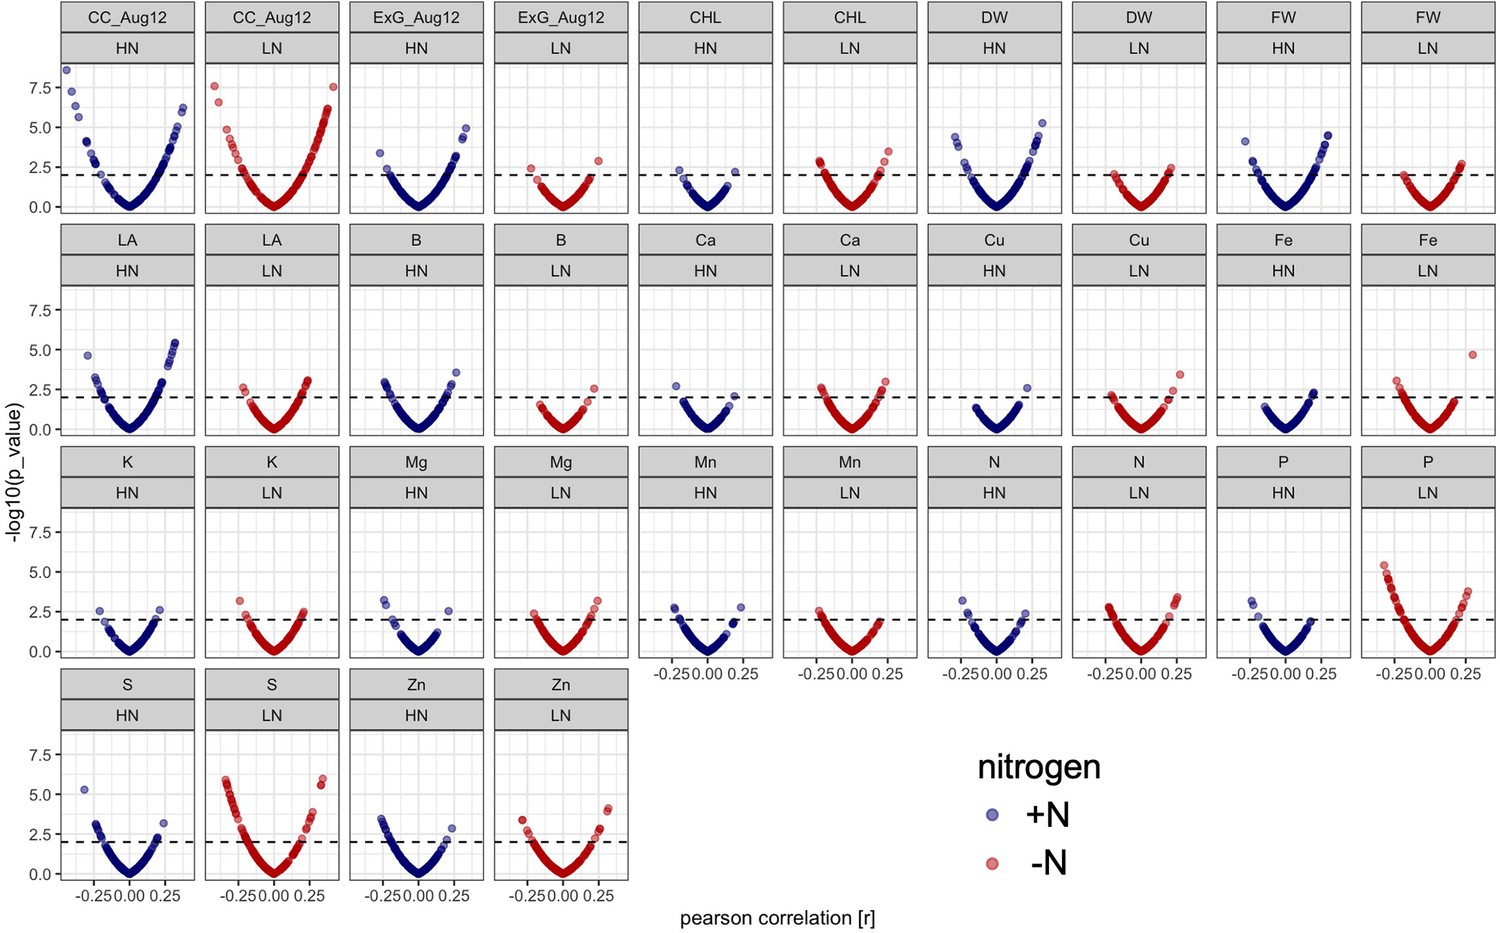
Correlation of microbe abundance with 17 agronomic and micronutrient traits under +N (blue) and -N (red) conditions.
Each dot represents one of 150 rhizobiome traits. X axis shows correlation with agronomic trait (r value), y axis shows significance, dashed line shows p=0.01 level of significance. CC_Aug12, EXG_Aug12: canopy coverage and excess green index measured on Aug. 12, 2019; CHL: chlorophyll content, DW: dry weight, FW: fresh weight, LA: leaf area.
Figure 4—figure supplement 2
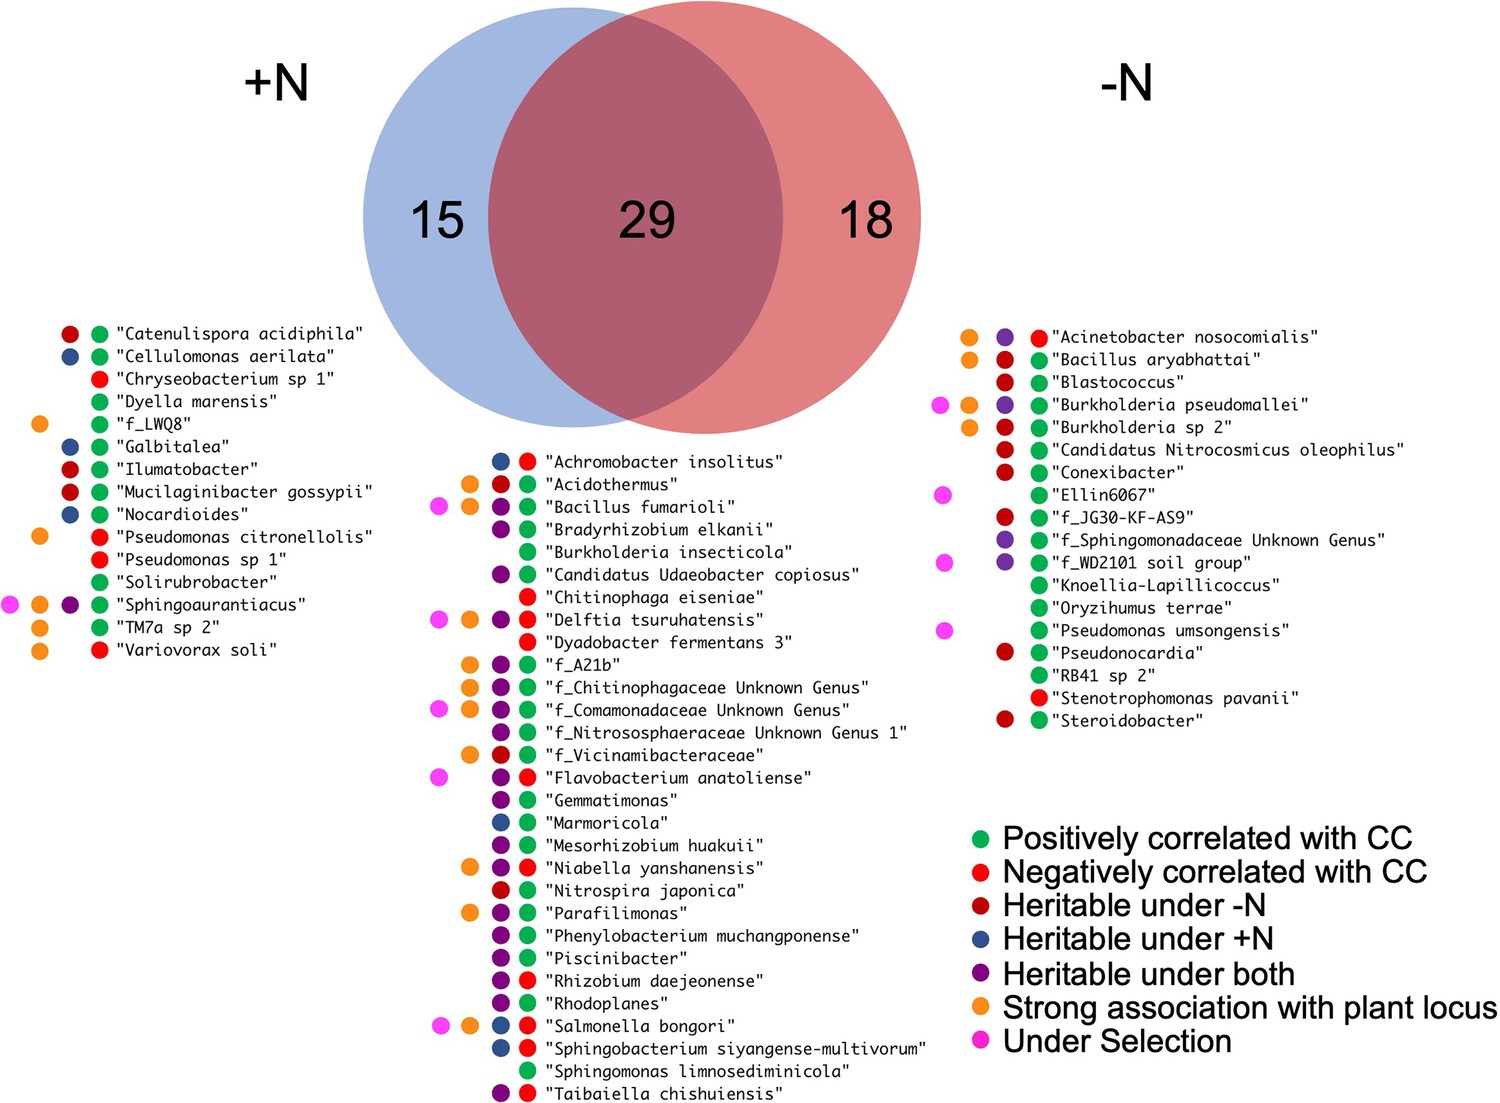
Microbial traits that correlate with canopy coverage.
Venn diagram shows a total 62 microbial traits that correlate with canopy coverage either under +N, -N or both treatments. For the 62 listed rhizobiome traits, colored dots summarize various statistics that indicate association with the host plant genetics and performance.
Figure 5 with 1 supplement
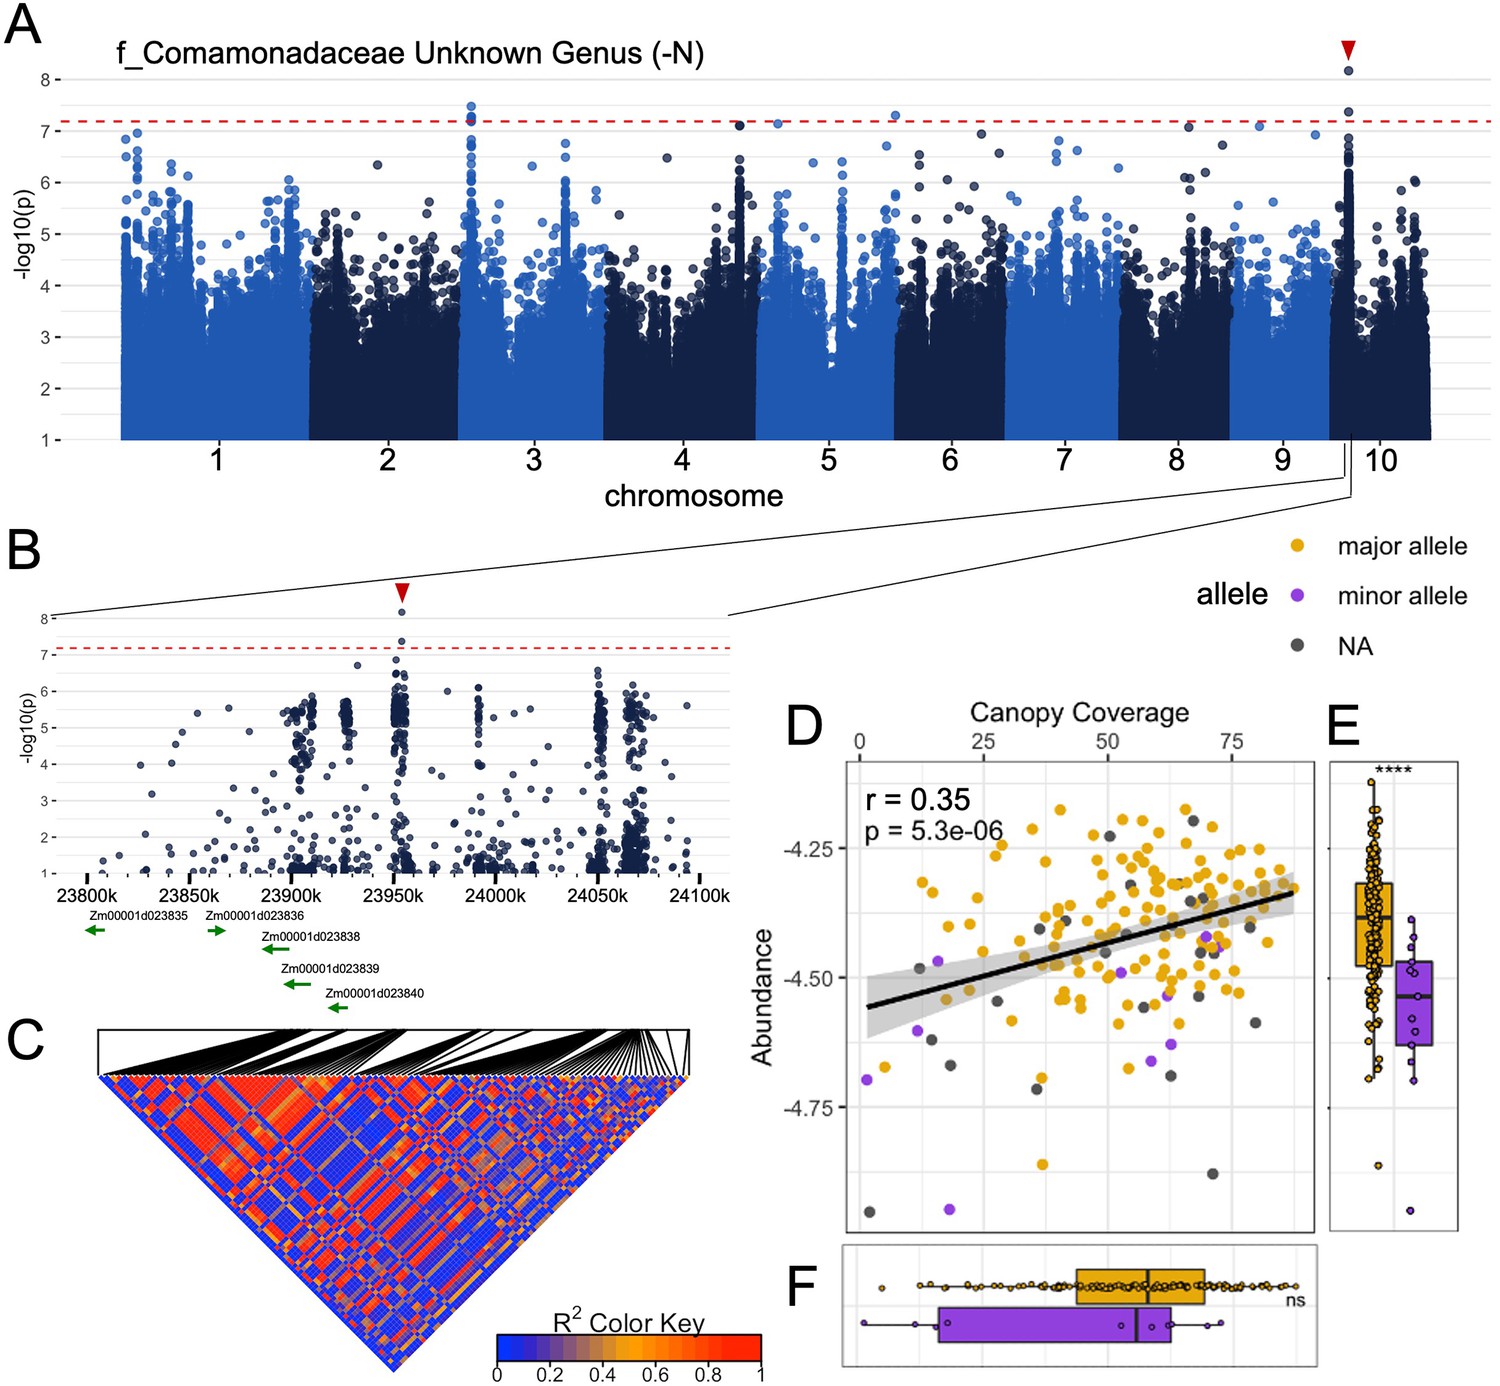
Abundance of heritable, adaptively selected microbes depends on allelic differences at MAPLs.
(A) Results of a genome wide association study conducted using values for the rhizobiome trait (f_Comamonadaceae Unknown Genus) observed for ~230 maize lines grown under nitrogen deficient conditions. Alternating colors differentiate the 10 chromosomes of maize. Dashed line indicates a statistical significance cutoff of -log10(p)=7.2. (B) Zoomed in visualization of the region containing the peak observed on chromosome 10. (C) Linkage disequilibrium among SNP markers genotyped within this region, calculated using genotype data from 271 lines (D) Correlation plot of microbe abundance vs. canopy coverage (CC). Each point represents a maize genotype. Differences in microbe abundance (E) and CC (F) are marked between genotypes carrying the major allele (gold) vs the minor allele (purple) at the target SNP (red arrow in panel A and B).
Figure 5—figure supplement 1
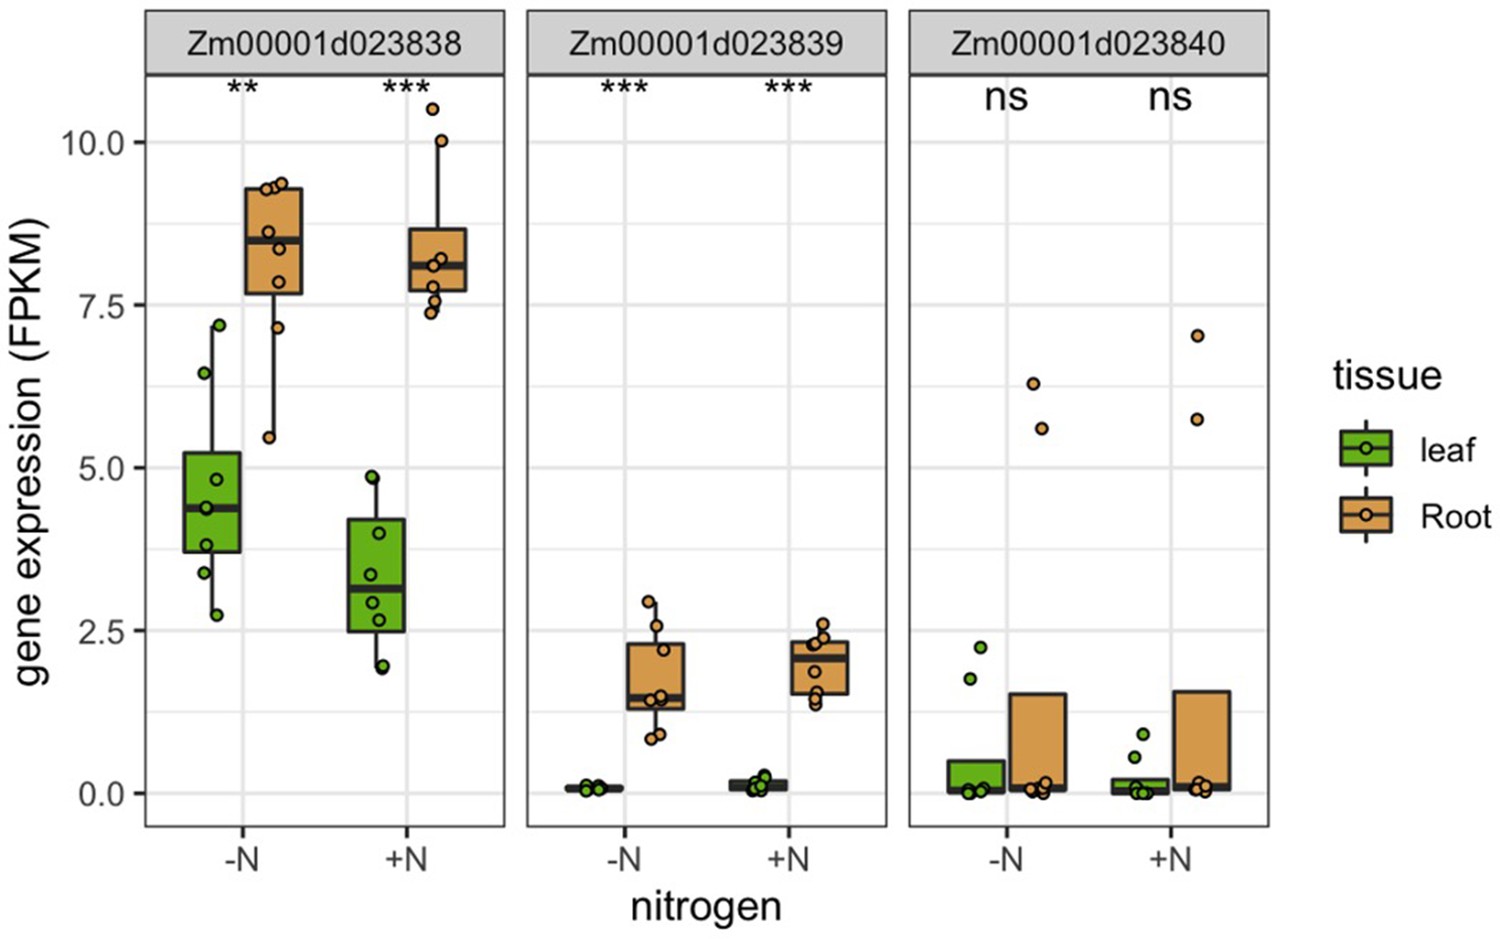
Genes at MAPL are preferentially expressed in roots.
Appendix 1—figure 1
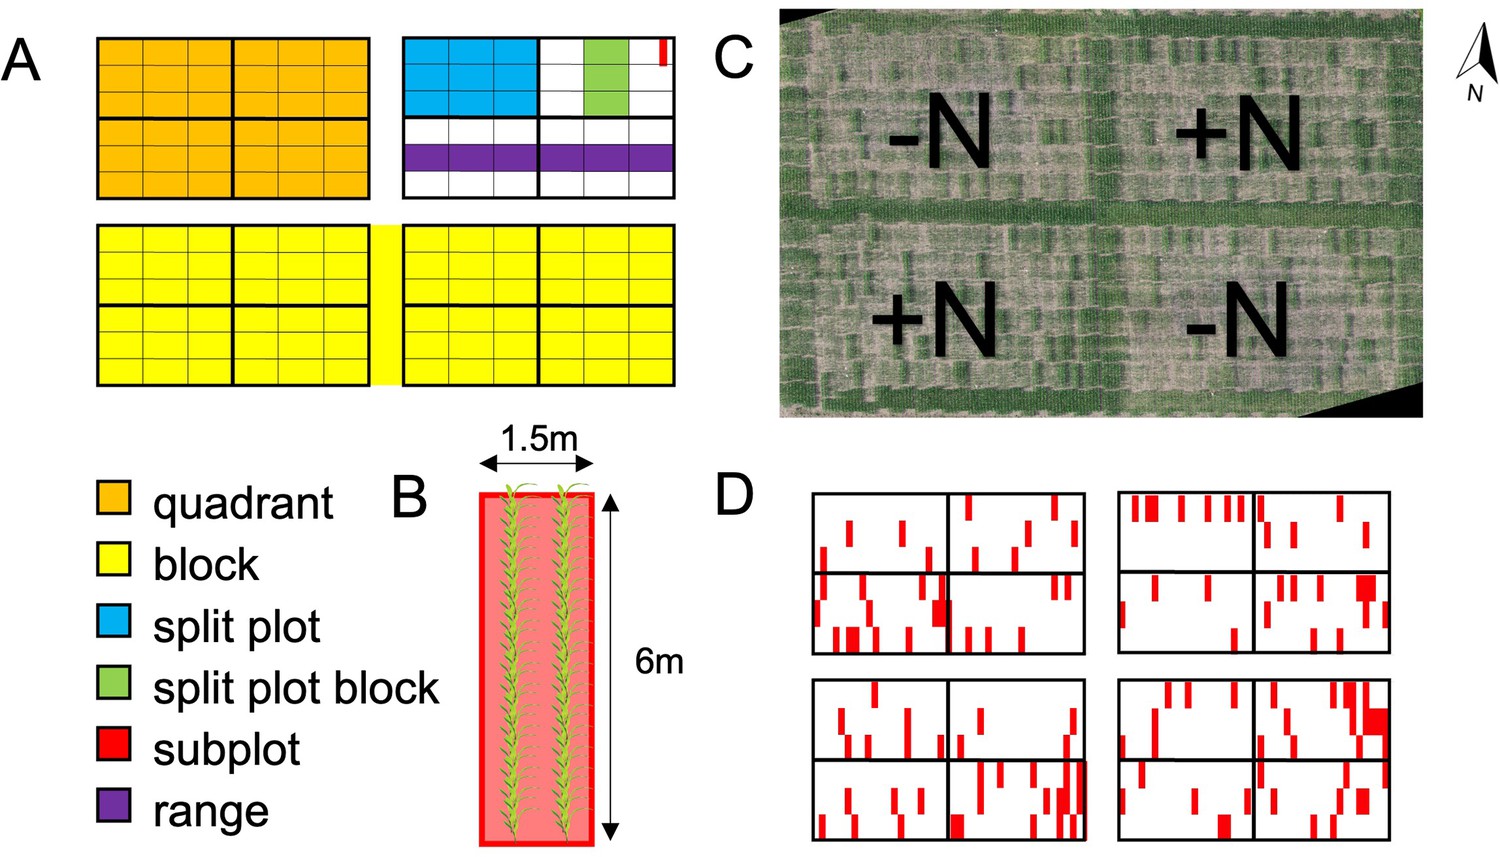
Field experimental design.
(A) Up to 230 maize genotypes were represented in each of 4 quadrants in 2 replicate blocks. Quadrants were planted in 6 ranges and divided into 4 split plots. Each split plot was divided into 3 split plot blocks, and each split plot block was divided into 21 subplots for a total of 252 subplots per quadrant. (B) Each 1.5 m (5 ft) x 6 m (20 ft) subplot (experimental unit) consisted of two rows of 36 maize plants of the same genotype, with a spacing of 75 cm (30 in) between rows and 15 cm (6 in) between plants. (C) Photomosaic of the 2019 field at flowering time. N fertilizer was applied to the NE and SW quadrants before planting. (D) 128 subplots across the field (marked in red) were planted with a check genotype (B73xMo17) in order to be able to quantify and control for spatial variation.
Appendix 1—figure 2 with 1 supplement
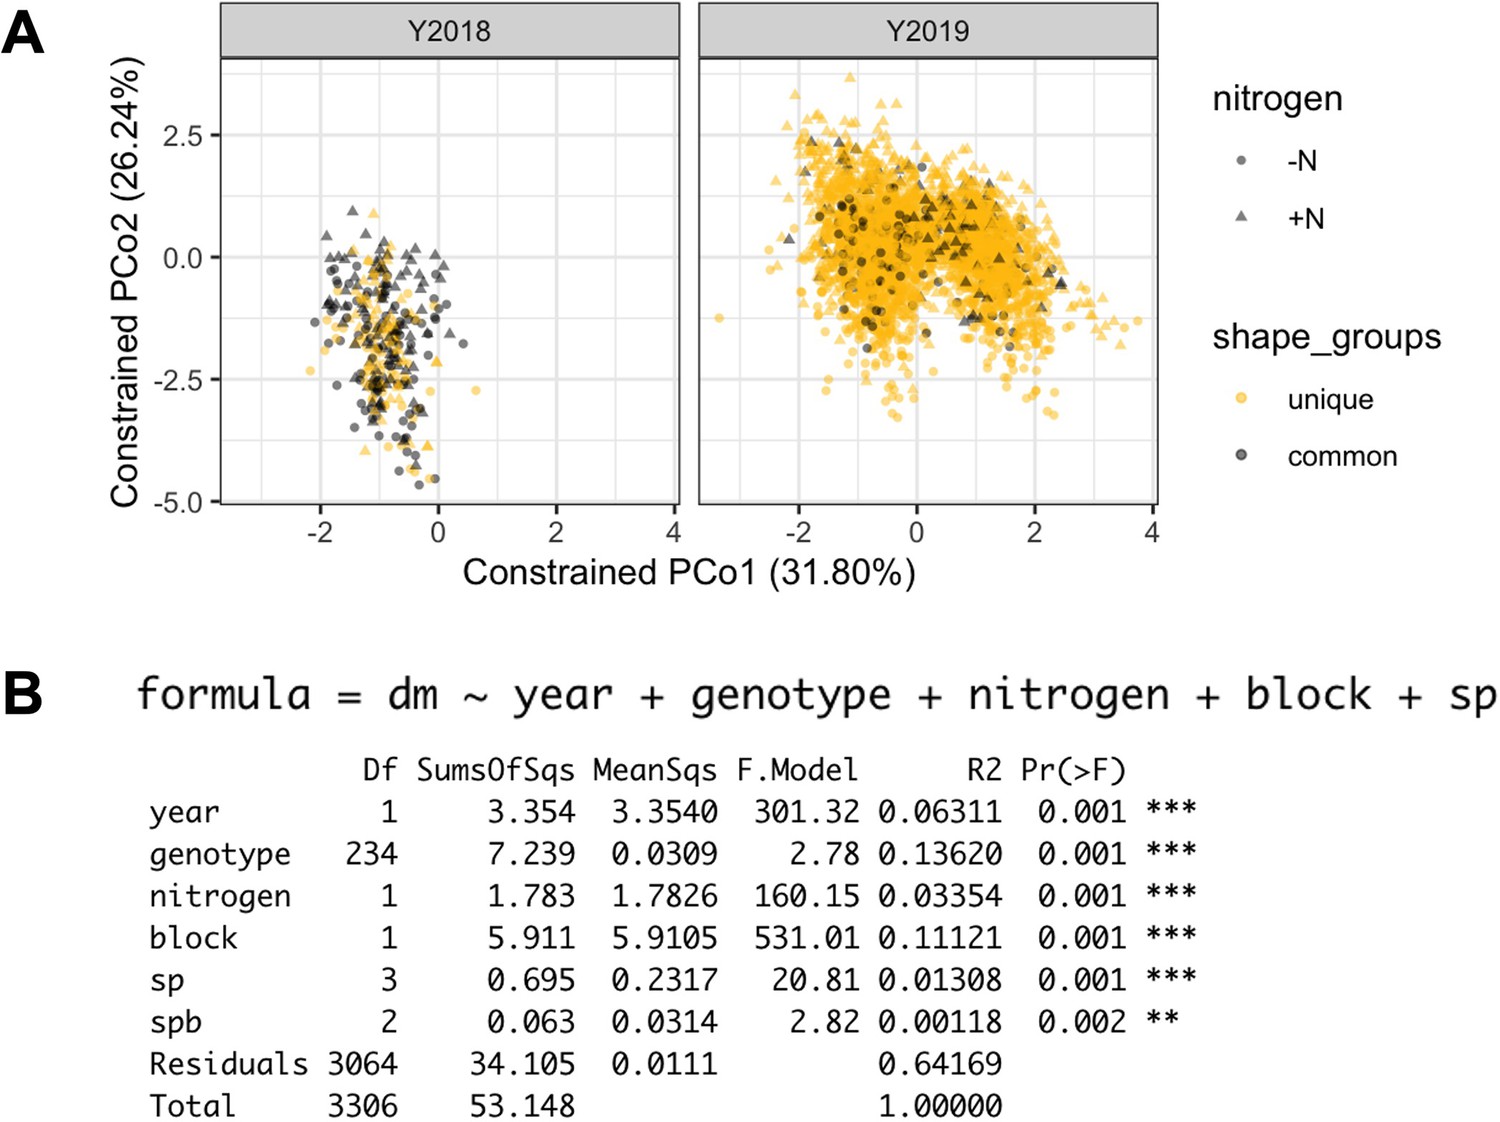
PERMANOVA results.
It was calculated from the log(relative abundance) of 4,632 ASVs. Each dot represents a sample. Genotypes common to 2018 and 2019 panel are marked in grey.
Appendix 1—figure 2—figure supplement 1
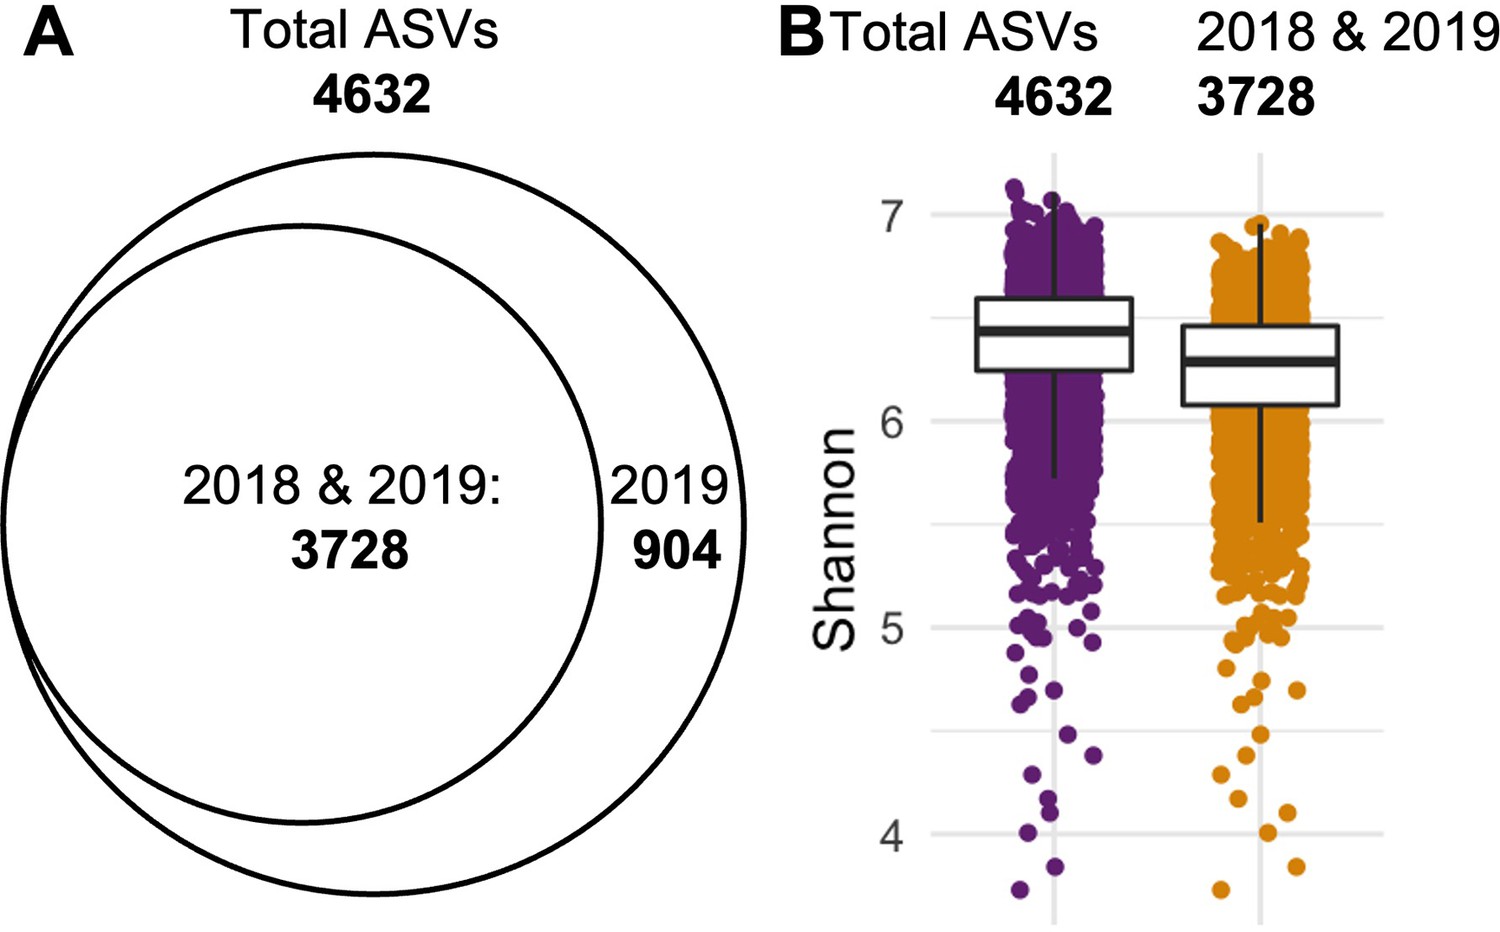
Retaining ASVs observed in both years reduces dataset complexity with minimal loss of diversity.
(A) Intermediate set of ASVs after prevalence filtering contains 4,632 ASVs, of which 904 were exclusively found in 2019. (B) Comparison of the Shannon diversity between the total set (4632 ASVs, purple) and the shared set (3728 ASVs, gold) reveals a 2.29% loss in diversity: Median(Shannon3728)/Median(Shannon4632) = 0.9771.
Appendix 1—figure 3
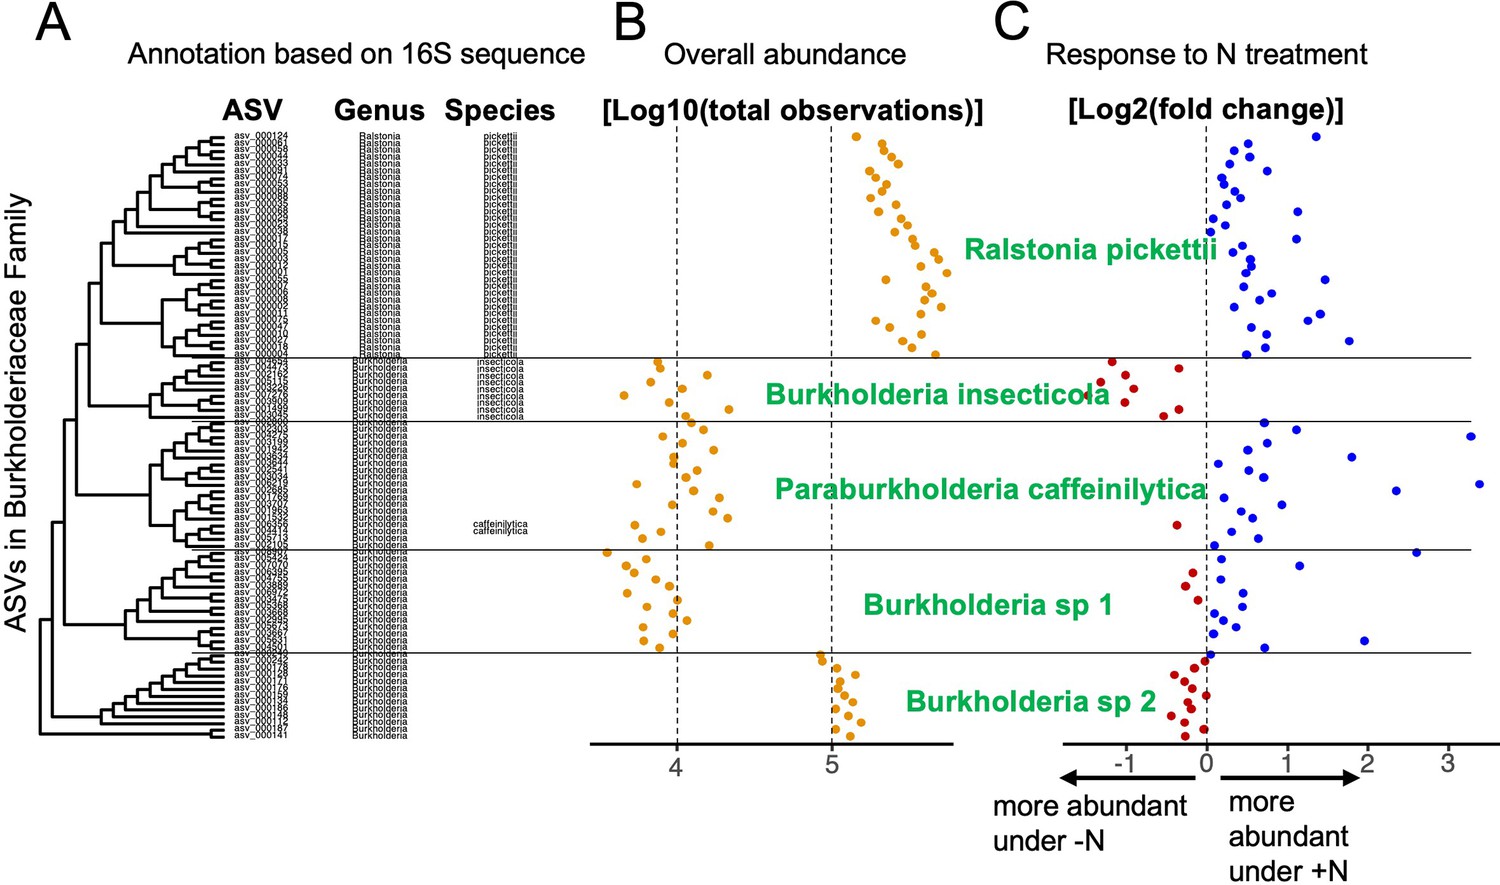
Microbial groups are derived from taxonomic data and experimental data.
An example is given using a subset of the ASVs in the Burkholderiaceae family. (A) Phylogenetic clustering of ASVs based on 16S V4 alignment. ASVs are annotated at the genus and species level using the SILVA database. Note that for some ASVs, annotation at the species level is missing, although the phylogenetic tree suggests divergent groups at the species level. Overall abundance in the dataset (B) of each ASV and differential abundance in response to the N treatment (C) were used in tandem with sequence-based clustering to group ASVs with similar features into microbial groups at sub-genus resolution (labeled in green). In this example, the genus Ralstonia constitutes a monophyletic cluster of ASVs which were all successfully assigned to the species R. pickettii (A). This uniform group is also reflected in relatively uniform abundance (B) and positive response to N treatment (C). On the other hand, most ASVs in the Burkholderia genus could not be annotated at the species level, even though the phylogeny suggests at least 4 distinct groups below the genus level. The first group, Burkholderia insecticola was identified at the species level without fail and once again, this is reflected in uniform abundances as well as a consistently negative response to N treatment. Within the next cluster two ASVs are assigned to Paraburkholderia caffeinilytica, and we assigned all other ASVs in the same cluster to the same species because they showed consistent abundance and response to treatment. In the remaining two clusters, no ASVs could be annotated at the species level, hence we assigned a number to the unassigned species (Burkholderia sp 1 and sp 2). Experimental data confirms that the two clusters should be treated as separate microbial groups because Burkholderia sp 2 is roughly 10 times as abundant as Burkholderia sp 1 and we observe opposite responses to N treatment.
Author response image 1
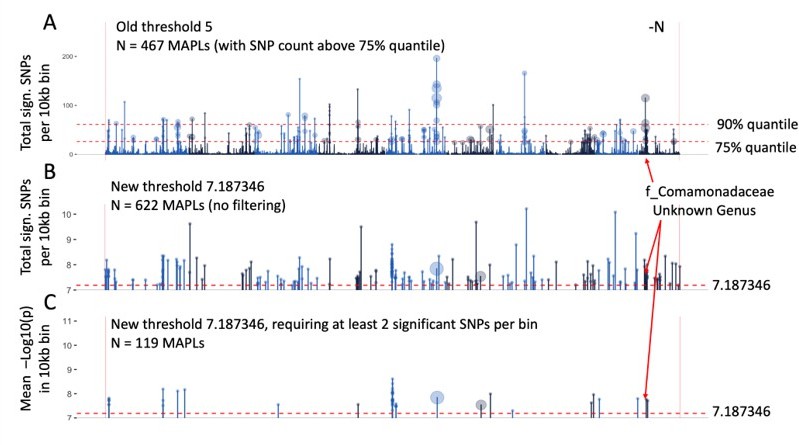
Identification of microbe-associated plant loci (MAPLs), comparison of the previous approach (A) and more stringent approach with reduced false discovery rate (B, C).
Data is only plotted for the -N treatment, counts of MAPLs are for both N treatments.
Tables
Author response table 1
| Significance threshold | Total Significant SNPs across all 150 microbial groups (+N) | Total Significant SNPs across all 150 microbial groups (-N) |
|---|---|---|
| 5 (previous) | 46,830 | 43,252 |
| 7.2 (new) | 624 | 465 |
Additional files
-
Supplementary file 1
Feature table (3,306 samples by 3,626 ASVs) from which our results were generated, alongside the sample metadata collected in this study.
- https://cdn.elifesciences.org/articles/75790/elife-75790-supp1-v2.csv
-
Supplementary file 2
Taxonomically annotated list of 3,626 16 S sequences that comprise the core maize microbiome used for this analysis and may serve as a reference to identify the same maize-associated ASVs in future experiments.
- https://cdn.elifesciences.org/articles/75790/elife-75790-supp2-v2.csv
-
Supplementary file 3
List of the 150 microbial groups defined in this study alongside relevant summary statistics, such as abundance, heritability, selection coefficients, and correlations with plant traits under both N treatments.
- https://cdn.elifesciences.org/articles/75790/elife-75790-supp3-v2.csv
-
Supplementary file 4
List of 229 Buckler-Goodman maize genotypes with the corresponding measurements of all 17 plant and 150 rhizobiome traits analyzed here under both N treatments.
Sample-level data is published for aerial imaging (Rodene et al., 2022).
- https://cdn.elifesciences.org/articles/75790/elife-75790-supp4-v2.csv
-
Supplementary file 5
List of 622 plant loci (10 kb genomic regions) that exhibit significant association with one or more microbial groups, including the IDs of nearby (+/-10 kb) genes.
- https://cdn.elifesciences.org/articles/75790/elife-75790-supp5-v2.csv
-
Supplementary file 6
Plots of phylogeny, abundance and response to N treatment for all microbial families present in this dataset, with clustering of ASVs into the microbial groups used here.
- https://cdn.elifesciences.org/articles/75790/elife-75790-supp6-v2.pdf
-
Transparent reporting form
- https://cdn.elifesciences.org/articles/75790/elife-75790-transrepform1-v2.docx
Download links
A two-part list of links to download the article, or parts of the article, in various formats.
Downloads (link to download the article as PDF)
Open citations (links to open the citations from this article in various online reference manager services)
Cite this article (links to download the citations from this article in formats compatible with various reference manager tools)
Association analyses of host genetics, root-colonizing microbes, and plant phenotypes under different nitrogen conditions in maize
eLife 11:e75790.
https://doi.org/10.7554/eLife.75790


