Exploring the expression patterns of palmitoylating and de-palmitoylating enzymes in the mouse brain using the curated RNA-seq database BrainPalmSeq
- Department of Cellular and Physiological Sciences, Life Sciences Institute and Djavad Mowafaghian Centre for Brain Health, University of British Columbia, Canada
- Life Sciences Institute Bioinformatics Facility, University of British Columbia, Canada
Figures
Figure 1 with 2 supplements
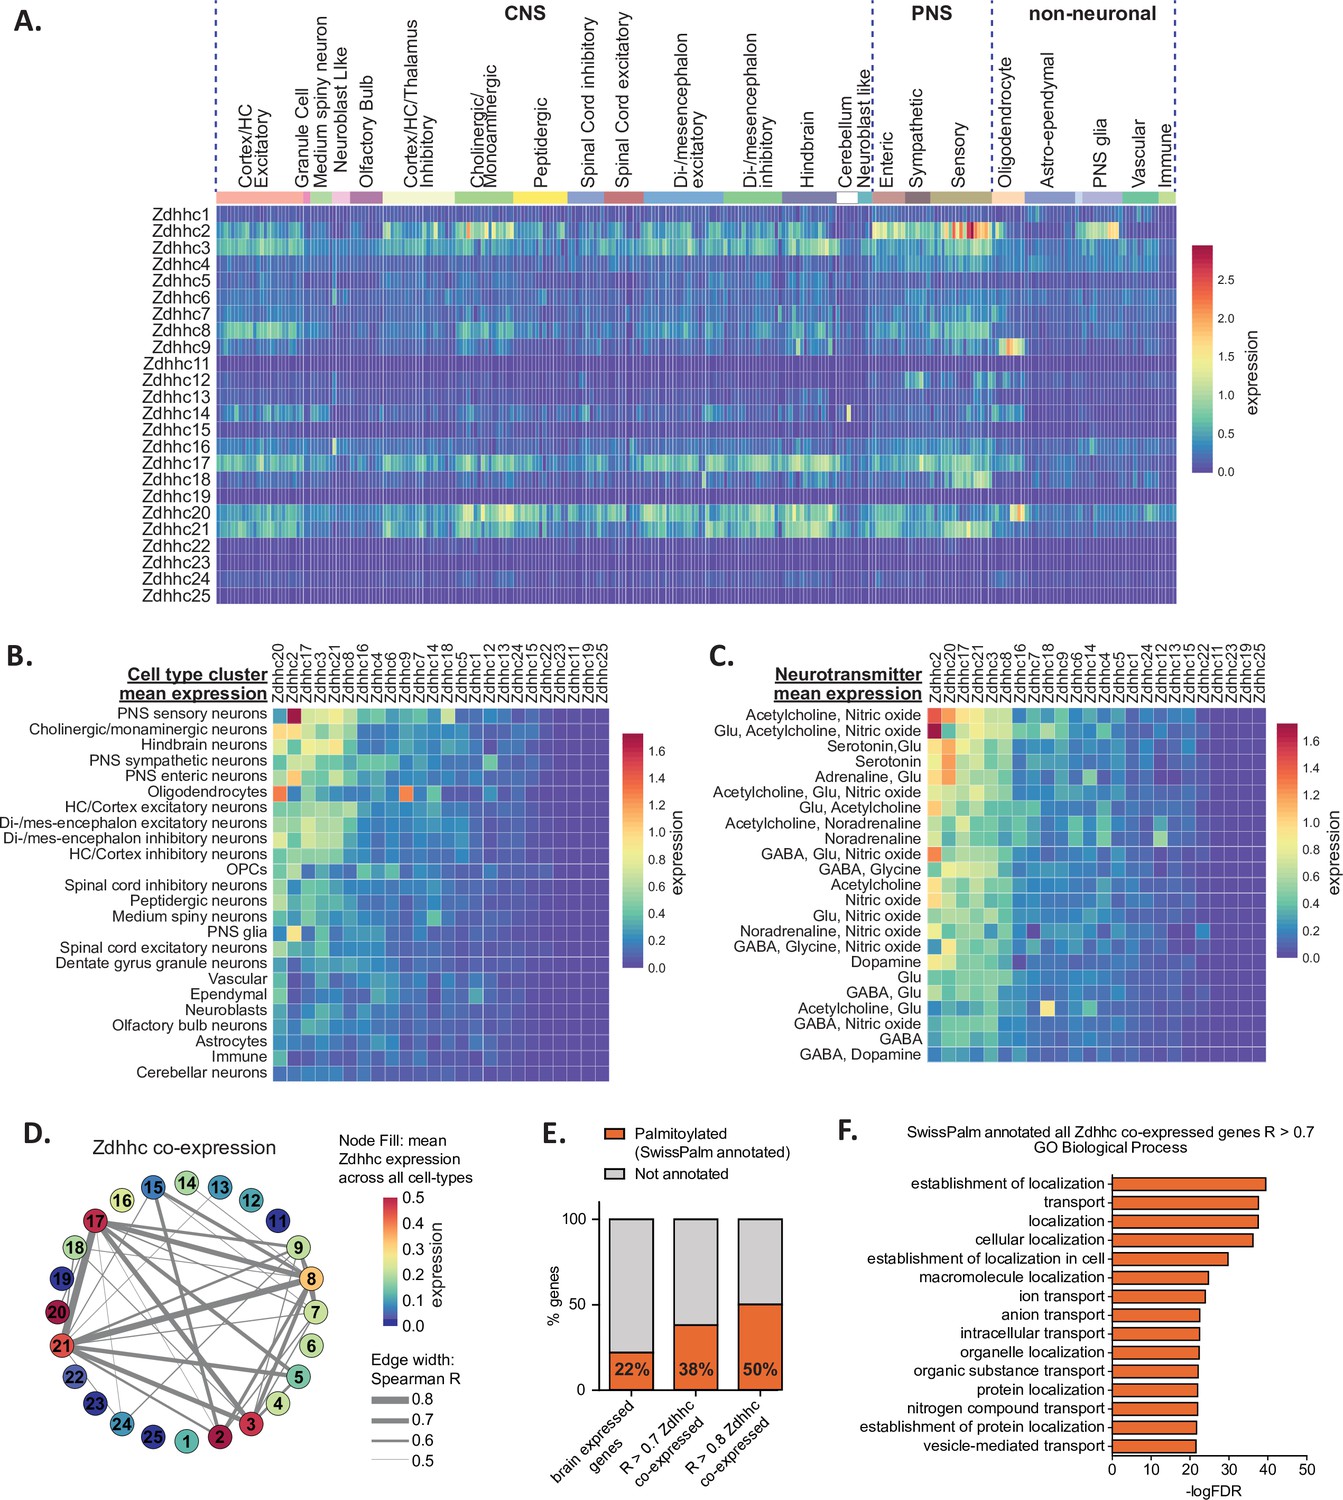
Heterogeneous ZDHHC expression in the mouse nervous system.
(A) Heatmap showing expression for the 24 ZDHHC genes, extracted from scRNAseq study of mouse CNS and PNS (Zeisel et al., 2018). Each column represents one of the 265 metacells classified in the study. Metacells are organized along x-axis according to hierarchical clustering designations generated by Zeisel et al. Full metadata for this study available on BrainPalmSeq. (B) Heatmap showing mean ZDHHC expression per hierarchical cluster, with columns and rows sorted by descending mean ZDHHC expression per row/column. (C) Heatmap showing mean ZDHHC expression per neurotransmitter cluster for all PNS and CNS neurons. Columns and rows are sorted as in B. (D) Correlation network showing ZDHHC co-expression across all metacells in ‘MouseBrain’ (Spearman R>0.5). Numbers in nodes correspond to ZDHHC number. Node color represents mean expression across all metacells. Edge thickness represents strength of correlation. (E) Graph showing proportion of genes from ‘MouseBrain’ dataset that are co-expressed with one or more ZDHHC and also substrates for S-palmitoylation (SwissPalm annotated). ‘Brain expressed’ n=15,389 protein coding genes expressed in the postnatal mouse brain, curated from the MGI RNAseq studies database. ‘R>0.7 ZDHHC co-expressed’ n=914 genes co-expressed with one or more ZDHHC (Spearman R>0.7). ‘R>0.8 ZDHHC co-expressed’ n=167 genes co-expressed with one or more ZDHHC (Spearman R>0.8). Brain expressed vs. R>0.7: p<0.001; R>0.7 vs R>0.8: p<0.01; Fisher’s exact test. (F) Graph of GO biological process analysis. Gene IDs from the ‘MouseBrain’ dataset (Zeisel et al., 2018) that showed correlated expression with one or more ZDHHC (R>0.7) and were also Uniprot reviewed and SwissPalm annotated were used as input. Units for all heatmaps in figure: mean log2(counts per 10,000+1).
-
Figure 1—source data 1
ZDHHC expression in the mouse nervous system from ‘MouseBrain’ dataset (related to Figure 1A).
- https://cdn.elifesciences.org/articles/75804/elife-75804-fig1-data1-v2.xlsx
-
Figure 1—source data 2
ZDHHC cell type averages from ‘MouseBrain’ dataset (related to Figure 1B).
- https://cdn.elifesciences.org/articles/75804/elife-75804-fig1-data2-v2.xlsx
-
Figure 1—source data 3
ZDHHC neurotransmitter averages from ‘MouseBrain’ dataset (related to Figure 1C).
- https://cdn.elifesciences.org/articles/75804/elife-75804-fig1-data3-v2.xlsx
-
Figure 1—source data 4
Spearman correlations 'MouseBrain' dataset (related to Figure 1D).
- https://cdn.elifesciences.org/articles/75804/elife-75804-fig1-data4-v2.xlsx
-
Figure 1—source data 5
Spearman correlations of S-palmitoylation associated genes vs all other genes in 'MouseBrain' dataset (R>0.7) (related to Figure 1E).
- https://cdn.elifesciences.org/articles/75804/elife-75804-fig1-data5-v2.xlsx
-
Figure 1—source data 6
Panther analysis of palmitoylation substrates (SwissPalm annotated) co-expressed with any Zdhhc (R>0.7) (related to Figure 1F).
- https://cdn.elifesciences.org/articles/75804/elife-75804-fig1-data6-v2.xlsx
Figure 1—figure supplement 1
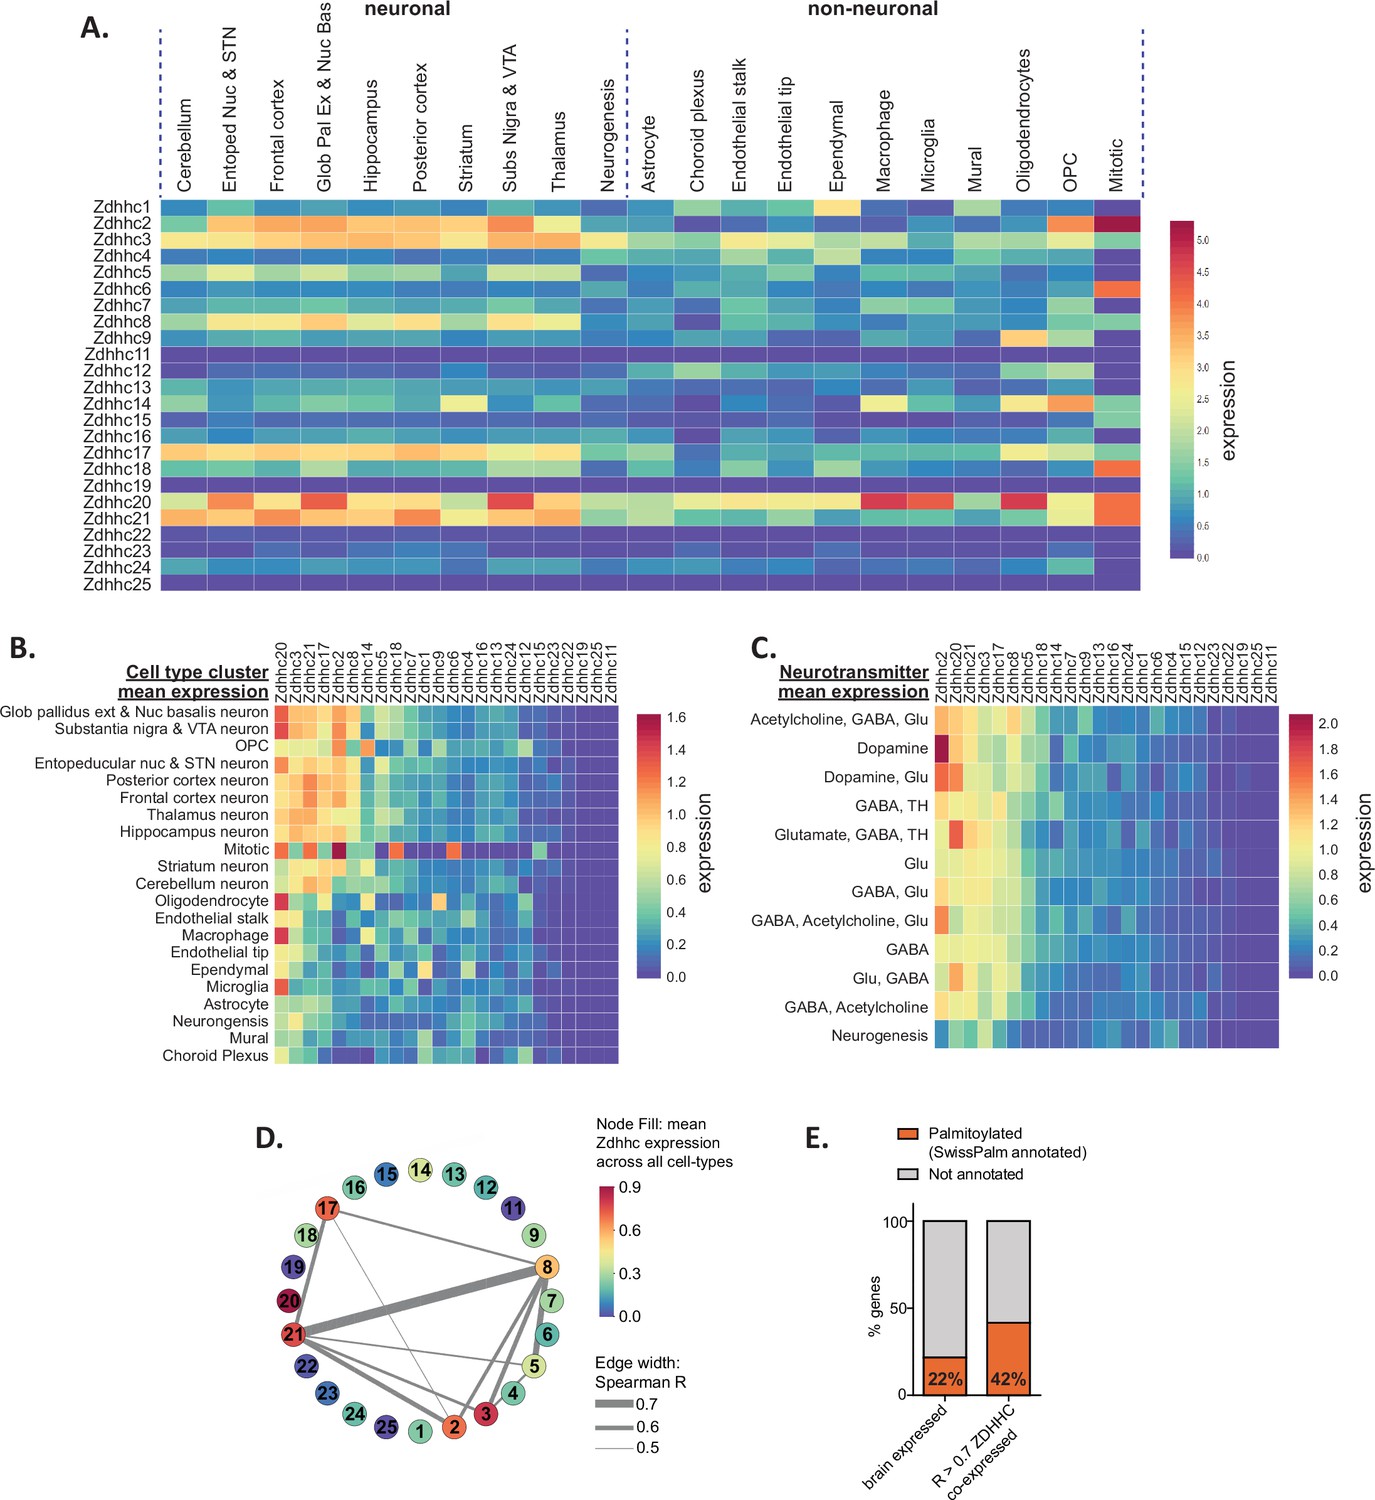
Heterogeneous ZDHHC expression in the mouse brain.
(A) Heatmap showing expression for the 24 ZDHHC genes, extracted from ‘DropViz’ scRNAseq study of mouse brain (Saunders et al., 2018). Each column represents metacell averages. Metacells are organized along x-axis according to brain region (neuronal) or class (non-neuronal). Full metadata for this study available on BrainPalmSeq. (B) Heatmap showing mean Zdhhc expression per brain region/class, with columns and rows sorted by descending mean Zdhhc expression per row/column. (C) Heatmap showing mean Zdhhc expression per neurotransmitter cluster for neurons from all brain regions. Columns and rows are sorted as in B. (D) Correlation network showing ZDHHC co-expression across all metacells in ‘DropViz’ (Spearman R>0.5). Numbers in nodes correspond to ZDHHC number. Node color represents mean expression across all metacells. Edge thickness represents strength of correlation. (E) Graph showing proportion of genes from ‘DropViz’ dataset that are co-expressed with one or more ZDHHC and also substrates for S-palmitoylation (SwissPalm annotated). ‘Brain expressed’=15,389 protein coding genes expressed in the postnatal mouse brain, curated from the MGI RNAseq studies database. ‘R>0.7 ZDHHC co-expressed’=676 genes co-expressed with one or more ZDHHC (Spearman R>0.7). Units for all heatmaps in figure: mean log2(counts per 10,000+1).
-
Figure 1—figure supplement 1—source data 1
Mean cell type ZDHHC expression in the mouse brain system from ‘DropViz’ dataset (related to Figure 1—figure supplement 1A).
- https://cdn.elifesciences.org/articles/75804/elife-75804-fig1-figsupp1-data1-v2.xlsx
-
Figure 1—figure supplement 1—source data 2
DropViz Zdhhc expression averaged by neurotransmitter (related to Figure 1—figure supplement 1C).
- https://cdn.elifesciences.org/articles/75804/elife-75804-fig1-figsupp1-data2-v2.xlsx
-
Figure 1—figure supplement 1—source data 3
Spearman correlation between Zdhhc genes across 565 cell types in ‘DropViz’ dataset (related to Figure 1—figure supplement 1D).
- https://cdn.elifesciences.org/articles/75804/elife-75804-fig1-figsupp1-data3-v2.xlsx
-
Figure 1—figure supplement 1—source data 4
Spearman correlations of S-palmitoylation associated genes vs all other genes in 'DropViz' dataset (R>0.7) (related to Figure 1—figure supplement 1E).
- https://cdn.elifesciences.org/articles/75804/elife-75804-fig1-figsupp1-data4-v2.xlsx
Figure 1—figure supplement 2
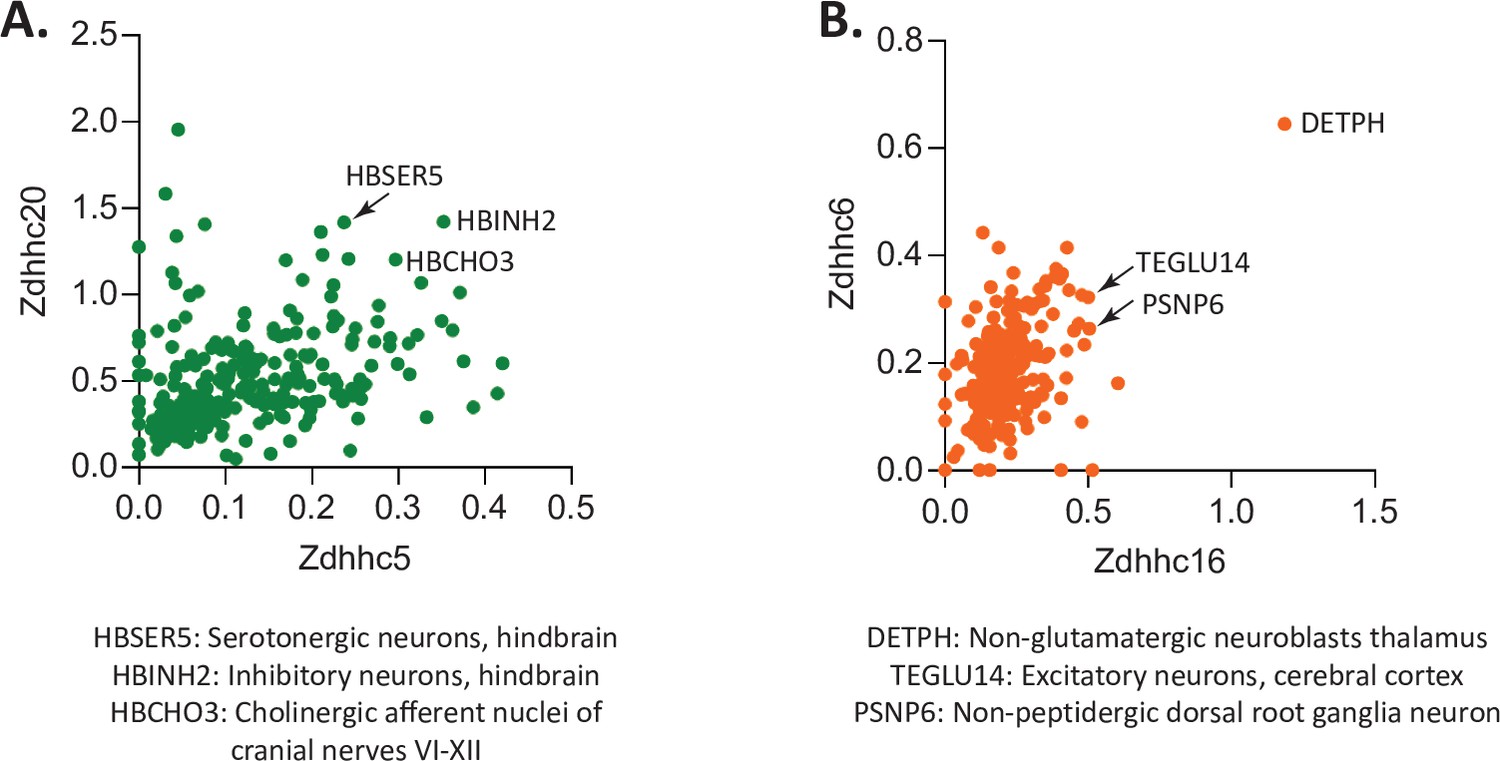
Correlation of Zdhhc enzymes that are known to be involved in palmitoylation cascades.
(A) Plot of Zdhhc5 vs Zdhhc20 expression across 265 identified cell types from ‘MouseBrain’ dataset. Expression units: mean log2(counts per 10,000+1). Arrows/labels indicate ‘MouseBrain’ cell types that have high expression of both genes. Legend below indicates annotation of these cell types. (B) As (A), but for Zdhhc6 vs Zdhhc16.
Figure 2 with 1 supplement

Diversity in ZDHHC expression and S-palmitoylation substrate expression in the hippocampus.
(A) Heatmap of excitatory neuron ZDHHC expression from dorsal hippocampus (original pooled cell RNAseq data from Cembrowski et al., 2016) projected onto diagrams of dorsal hippocampus. (B) Hierarchical clustering of ZDHHC expression data in A. (C) Heatmap showing top 6 ranked expressing ZDHHCs in dorsal CA1 in descending order. (D) Pie chart showing proportion genes with enriched expression in dorsal CA1 (dCA1) that are also substrates for palmitoylation (SwissPalm annotated). (E) KEGG analysis of the dCA1 enriched/SwissPalm annotated genes. (F) SynGO analysis of the dCA1 enriched/SwissPalm annotated genes. (G–J) As in (C)-(F) but for the dorsal dentate gyrus (dDG). Heatmap legend in (A) applies to all heatmaps (logFPKM +1).
-
Figure 2—source data 1
Neuronal expression of Zdhhc genes in dorsal hippocampus from ‘HippoSeq’ dataset (related to Figure 2A, B, C and G).
- https://cdn.elifesciences.org/articles/75804/elife-75804-fig2-data1-v2.xlsx
-
Figure 2—source data 2
Dorsal CA1 (dCA1) enriched projected palmitoylome (related to Figure 2D, E and F).
- https://cdn.elifesciences.org/articles/75804/elife-75804-fig2-data2-v2.xlsx
-
Figure 2—source data 3
KEGG Analysis of regionally enriched neuron expressed palmitoylation substrates (related to Figure 2E and I).
- https://cdn.elifesciences.org/articles/75804/elife-75804-fig2-data3-v2.xlsx
-
Figure 2—source data 4
SynGO Analysis of regionally enriched neuron expressed palmitoylation substrates (related to Figure 2F and J).
- https://cdn.elifesciences.org/articles/75804/elife-75804-fig2-data4-v2.xlsx
-
Figure 2—source data 5
Dorsal Dentate Gyrus (dDG) enriched projected palmitoylome (related to Figure 2D, E and F).
- https://cdn.elifesciences.org/articles/75804/elife-75804-fig2-data5-v2.xlsx
Figure 2—figure supplement 1
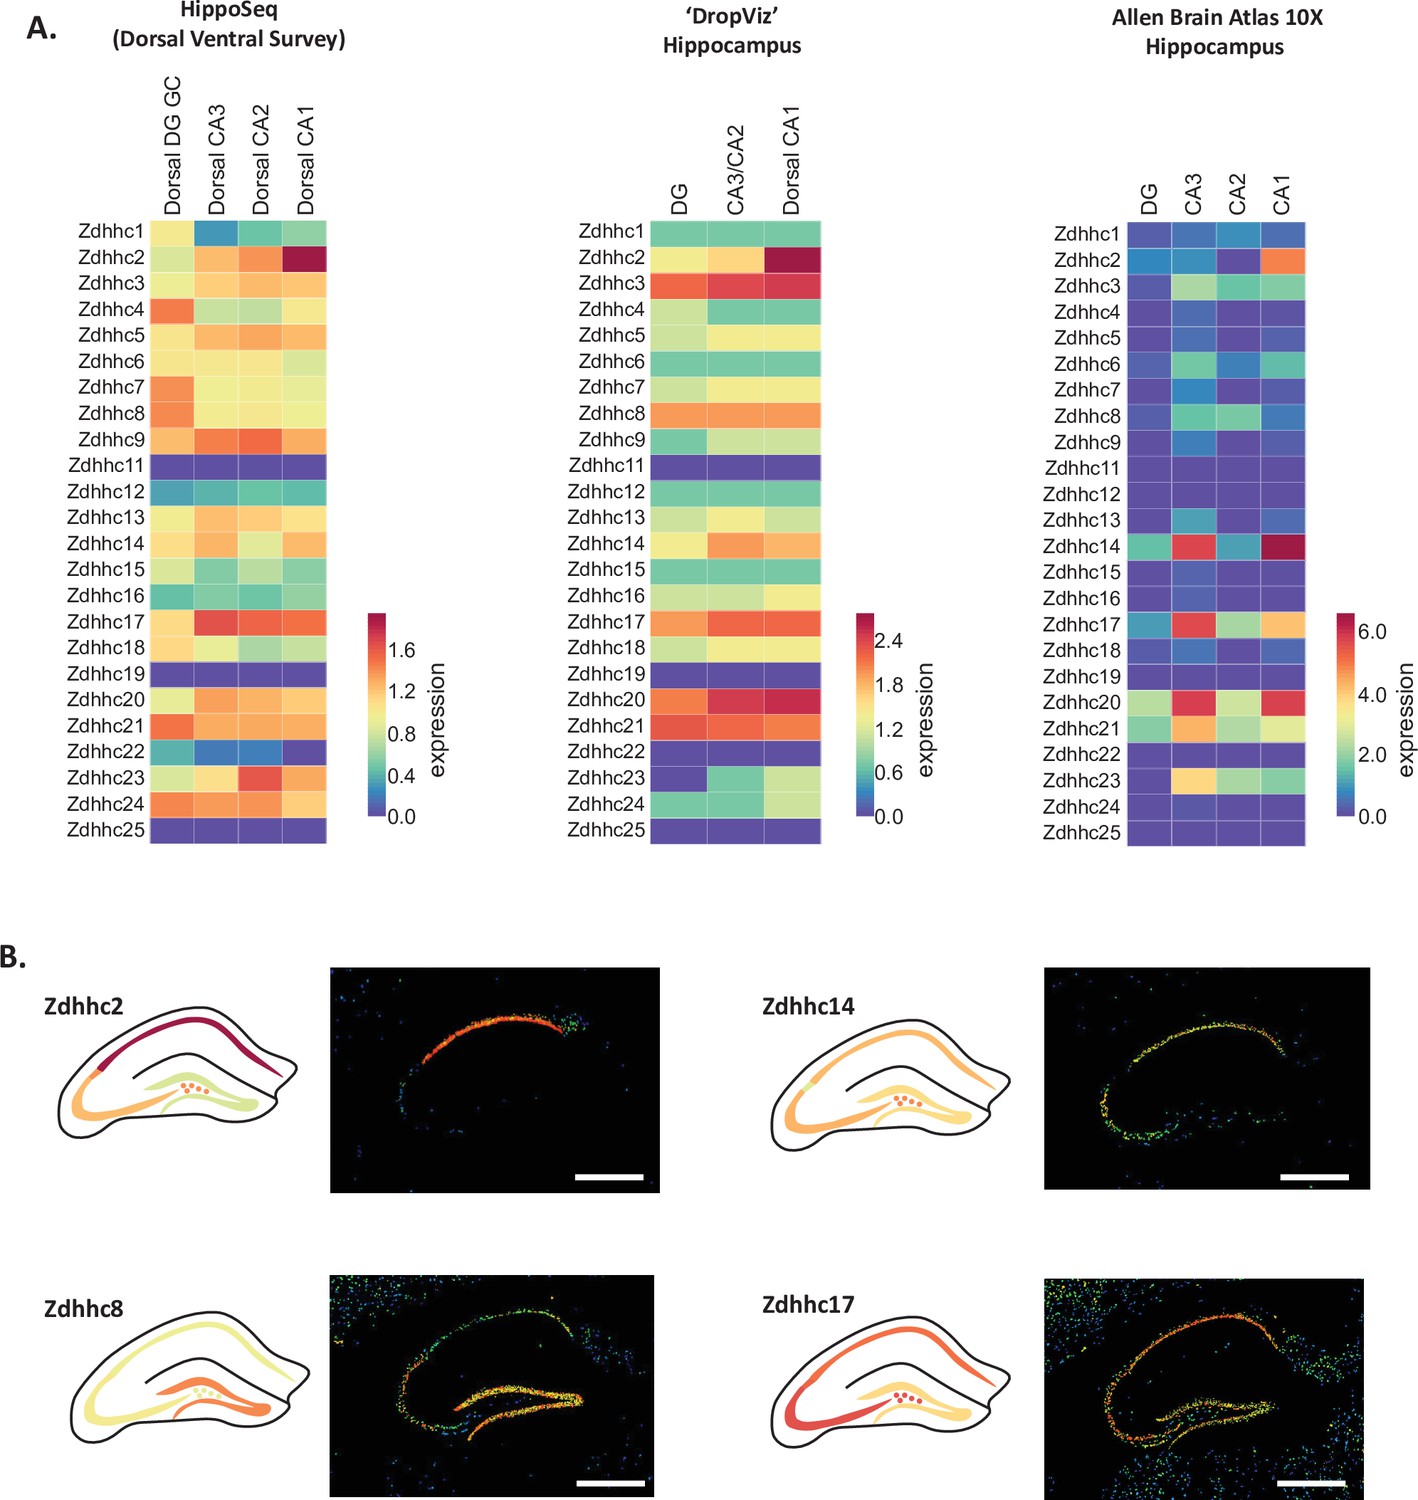
Heterogeneous ZDHHC expression in excitatory neurons of the hippocampus.
(A) Heatmaps showing ZDHHC expression data from BrainPalmSeq for excitatory neurons of indicated subregions of the hippocampus. Original data are from ‘Hipposeq’ (Cembrowski et al., 2016; units: FPKM), ‘DropViz’ (Saunders et al., 2018; units: mean log2(counts per 10,000+1)) and Allen Mouse Brain 10 X atlas (Yao et al., 2021; units: Trimmed Mean (25–75%) Log2(CPM +1)). (B) Expression maps from Figure 2A with in-situ hybridization images from Allen Brain ISH. White scale bar = 500 μm.
-
Figure 2—figure supplement 1—source data 1
Expression of Zdhhcs in hippocampal excitatory neurons across RNAseq studies (related to Figure 2—figure supplement 1A).
- https://cdn.elifesciences.org/articles/75804/elife-75804-fig2-figsupp1-data1-v2.xlsx
-
Figure 2—figure supplement 1—source data 2
In situ hybridization images used from Allan Brain Atlas (related to Figure 2—figure supplement 1B).
- https://cdn.elifesciences.org/articles/75804/elife-75804-fig2-figsupp1-data2-v2.xlsx
Figure 3 with 1 supplement

Pyramidal neuron layer specific ZDHHC expression.
(A) Heatmap of excitatory neuron ZDHHC expression from somatosensory cortex (original data scRNAseq data from Zeisel et al., 2015) projected onto diagrams of cortical layers. (B) Hierarchical clustering of ZDHHC expression data in A. Heatmap units in (A, B): mean log2(counts per 10,000+1) (C) Heatmap of scRNAseq data from Allen Brain 10 X genomics (Yao et al., 2021). Data are represented as mean ZDHHC expression per excitatory neuron subtype, with columns and rows sorted by descending mean ZDHHC expression per row/column. (D) As in (C) but for inhibitory neuron subtypes. Heatmap units for (C, D): trimmed mean (25–75%) Log2(CPM +1).
-
Figure 3—source data 1
Zdhhc expression cortical layers from 'Zeisel et al., 2015' (Related to Figure 3A and B).
- https://cdn.elifesciences.org/articles/75804/elife-75804-fig3-data1-v2.xlsx
-
Figure 3—source data 2
Zdhhc expression by excitatory neuron (subtype mean) from Allen Brain 10 X mouse dataset (Related to Figure 3C).
- https://cdn.elifesciences.org/articles/75804/elife-75804-fig3-data2-v2.xlsx
-
Figure 3—source data 3
Zdhhc expression by inhibitory neuron (subtype mean) from Allen Brain 10 X mouse dataset (Related to Figure 3D).
- https://cdn.elifesciences.org/articles/75804/elife-75804-fig3-data3-v2.xlsx
Figure 3—figure supplement 1
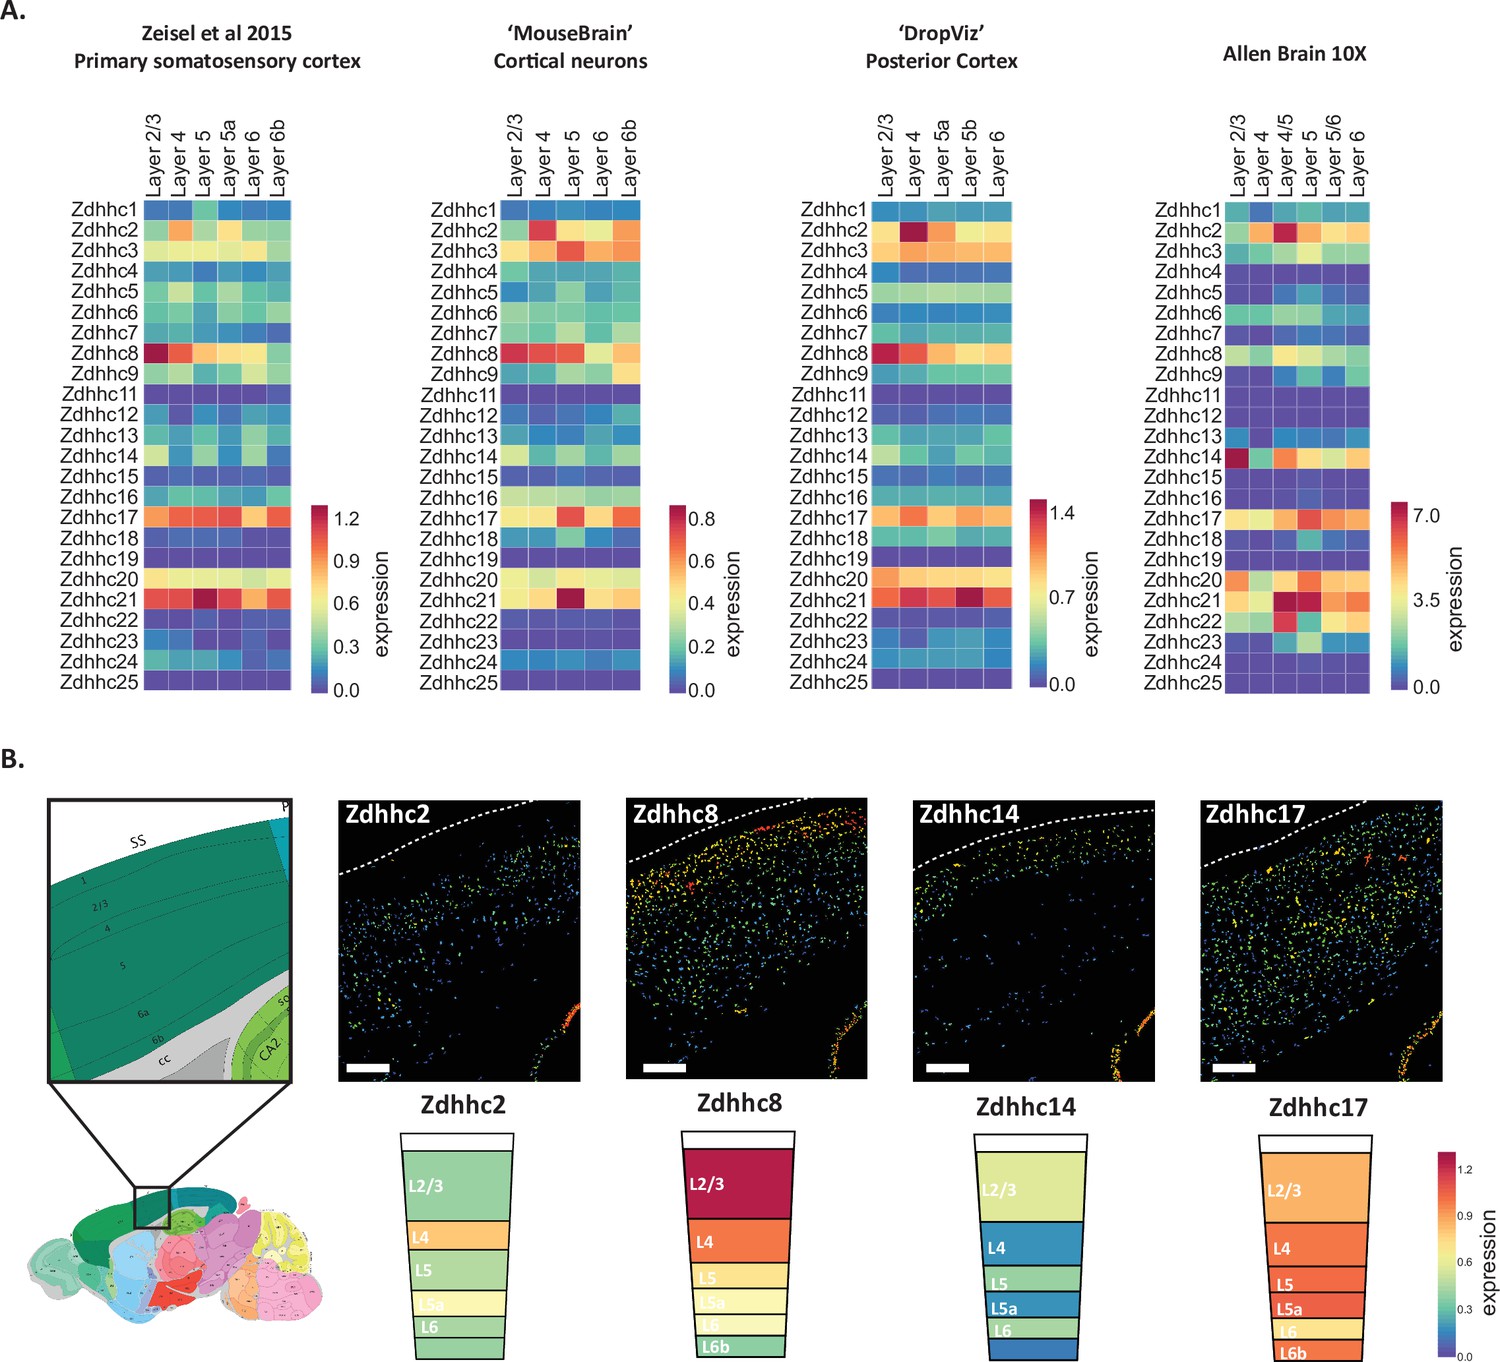
Heterogeneous ZDHHC expression in excitatory neurons of the cortex.
(A) Heatmaps showing ZDHHC expression data from BrainPalmSeq for excitatory neurons of indicated layers of the cortex. Original data are from somatosensory cortex Zeisel et al., 2015; units: mean log2(counts per 10,000+1); ‘MouseBrain’ Zeisel et al., 2018; mean log2(counts per 10,000+1); ‘DropViz’ posterior cortex Saunders et al., 2018; units: mean log2(counts per 10,000+1) and Allen Mouse Brain 10 X atlas intertelencephalic neurons Yao et al., 2021; units: Trimmed Mean (25–75%) Log2(CPM +1). (B) Expression maps from Figure 3A with in-situ hybridization images of somatosensory cortex from Allen Brain ISH. White scale bar = 250 μm.
-
Figure 3—figure supplement 1—source data 1
Expression of Zdhhcs in cortical excitatory neurons across RNAseq studies (related to Figure 3—figure supplement 1A).
- https://cdn.elifesciences.org/articles/75804/elife-75804-fig3-figsupp1-data1-v2.xlsx
-
Figure 3—figure supplement 1—source data 2
In situ hybridization images used from Allan Brain Atlas (related to Figure 3—figure supplement 1B).
- https://cdn.elifesciences.org/articles/75804/elife-75804-fig3-figsupp1-data2-v2.xlsx
Figure 4 with 3 supplements
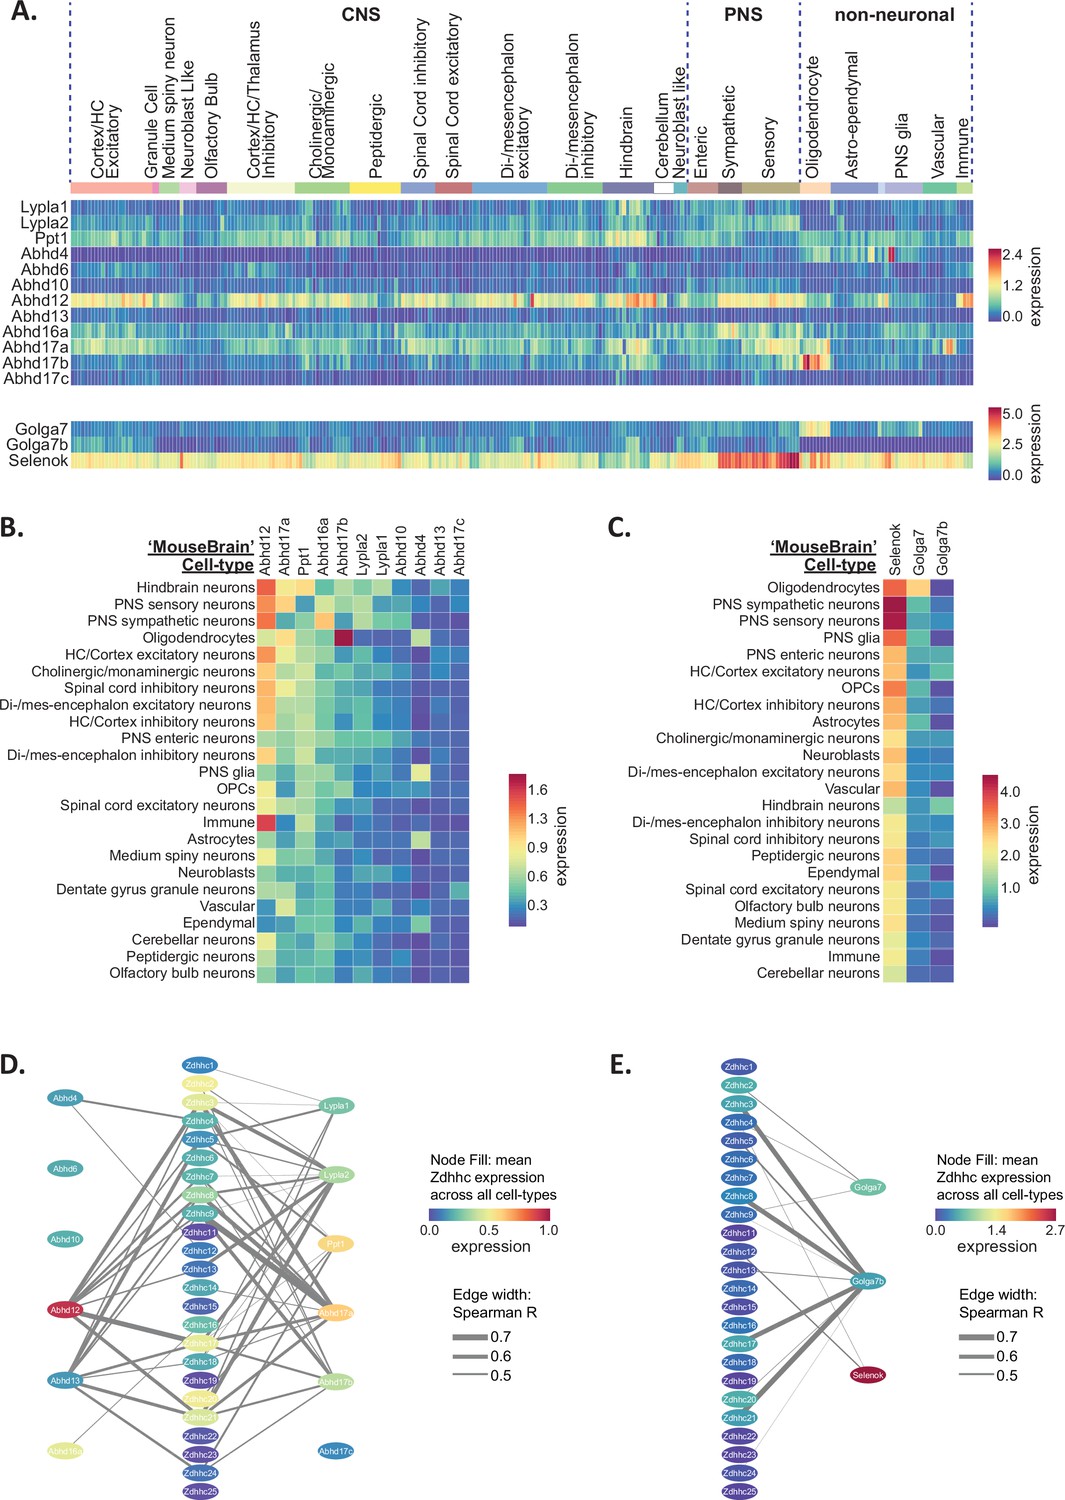
Heterogeneous de-palmitoylating enzyme and ZDHHC accessory protein expression in the mouse nervous system.
(A) Heatmap showing expression of de-palmitoylating enzymes (top) and ZDHHC accessory subunits (bottom), extracted from scRNAseq study of mouse CNS and PNS (Zeisel et al., 2018). Each column represents one of the 265 metacells classified in the study. Metacells are organized according to hierarchical clustering designations generated by Zeisel et al. (B) Heatmap showing mean de-palmitoylating enzyme expression per hierarchical cluster, with columns and rows sorted by descending mean ZDHHC expression per row/column. (C) As B but for ZDHHC accessory proteins. (D) Correlation network showing ZDHHC co-expression with de-palmitoylating enyzmes and accessory proteins across all metacells in ‘MouseBrain’ (Spearman R>0.4). Node color represents mean expression across all metacells. Edge thickness represents strength of correlation.
-
Figure 4—source data 1
Depalmitoylating enzyme and Zdhhc accessory protein expression in the mouse nervous system from ‘MouseBrain’ dataset (related to Figure 4A).
- https://cdn.elifesciences.org/articles/75804/elife-75804-fig4-data1-v2.xlsx
-
Figure 4—source data 2
Depalmitoylating enzyme and Zdhhc accessory protein expression (cell type averages) from ‘MouseBrain’ dataset (related to Figure 4B and C).
- https://cdn.elifesciences.org/articles/75804/elife-75804-fig4-data2-v2.xlsx
-
Figure 4—source data 3
Spearman correlations of all palmitoylation associated genes from ‘MouseBrain’ dataset (related to Figure 4D and E).
- https://cdn.elifesciences.org/articles/75804/elife-75804-fig4-data3-v2.xlsx
Figure 4—figure supplement 1
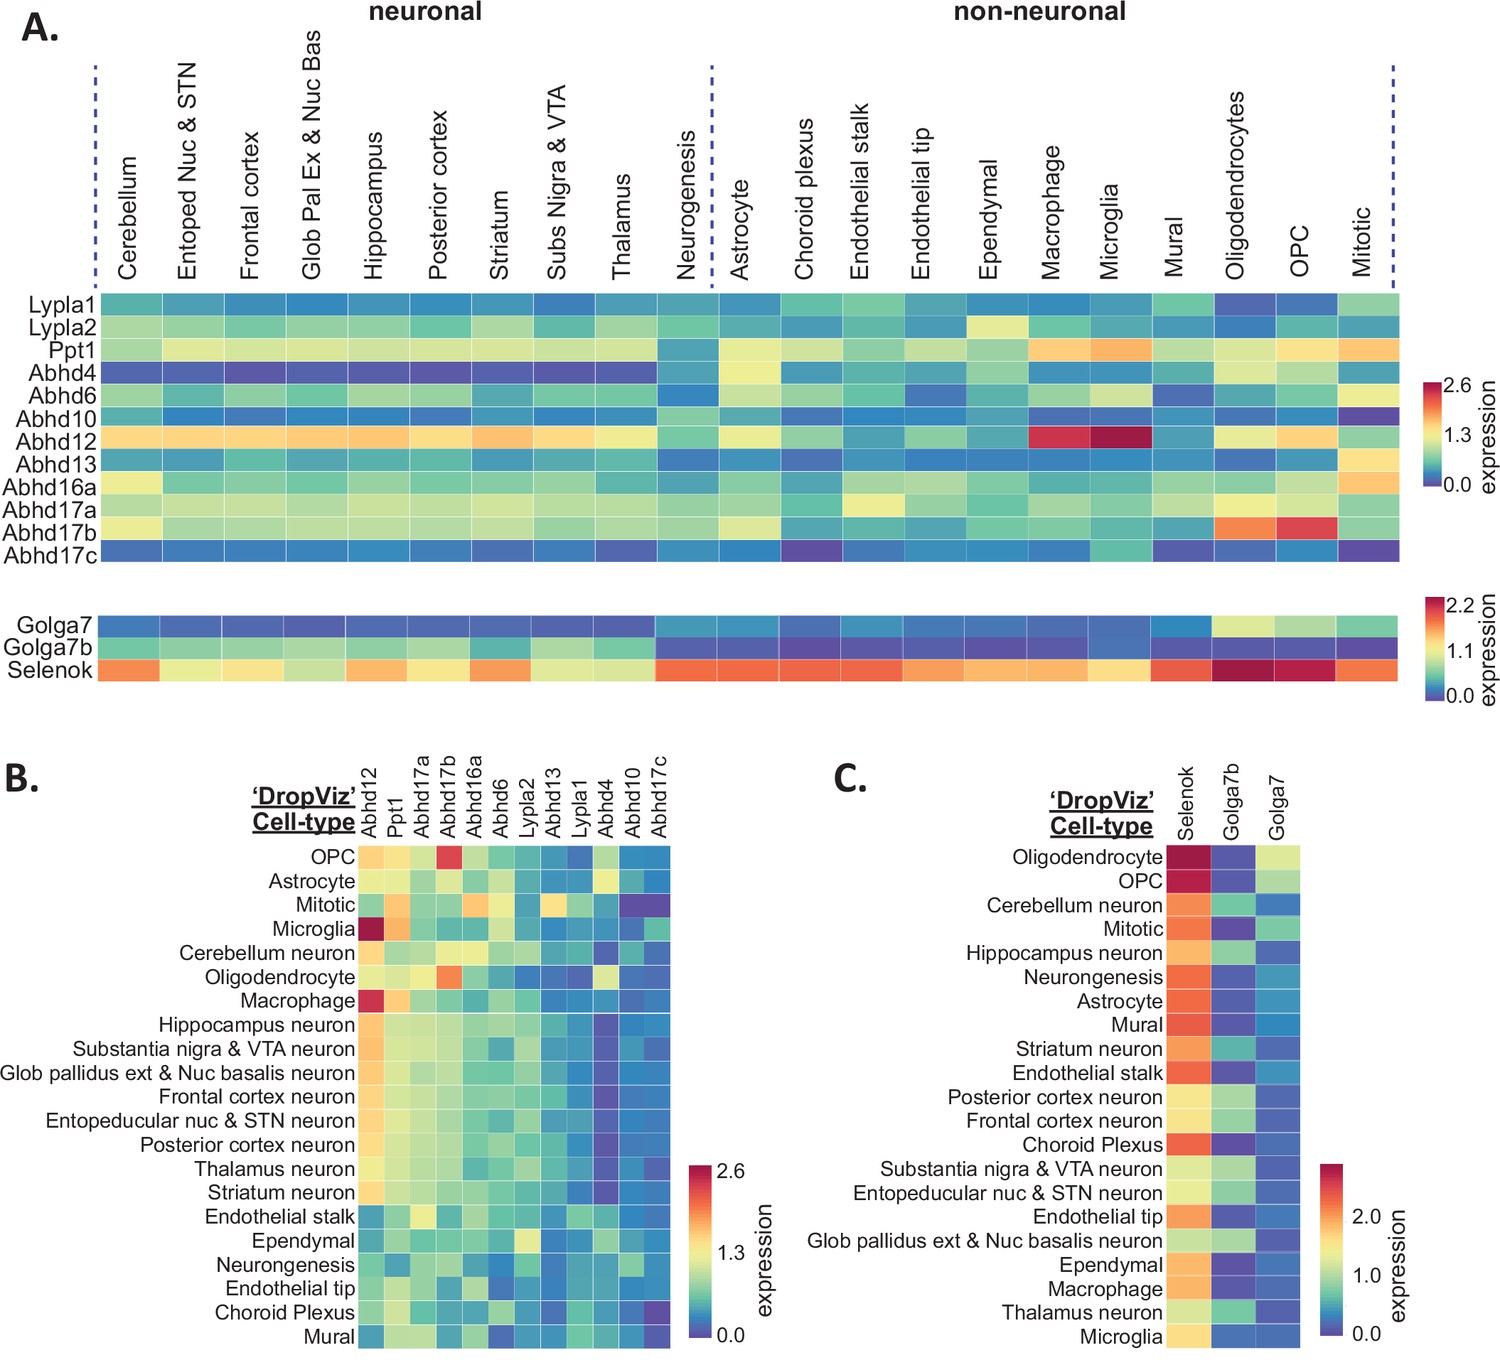
Heterogeneous de-palmitoylating enzyme and accessory protein expression in mouse brain.
(A) Heatmap showing expression for the 6 depalmitoylating enzyme genes and 3 accessory protein genes extracted from ‘DropViz’ scRNAseq study of mouse brain (Saunders et al., 2018). Each column represents metacell averages. Metacells are organized along x-axis according to brain region (neuronal) or class (non-neuronal). Full metadata for this study available on BrainPalmSeq. Expression units: mean log2(counts per 10,000+1). (B) Heatmap showing mean expression of the 6 depalmitoylating enzyme genes per brain region/class, with columns and rows sorted by descending mean gene expression per row/column. (C) Heatmap showing mean expression of the 3 accessory protein genes per brain region/class, with columns and rows sorted by descending mean gene expression per row/column.
-
Figure 4—figure supplement 1—source data 1
De-palmitoylating enzyme and Zdhhc accessory expression (cell type mean) DropViz (related to Figure 4—figure supplement 1).
- https://cdn.elifesciences.org/articles/75804/elife-75804-fig4-figsupp1-data1-v2.xlsx
Figure 4—figure supplement 2
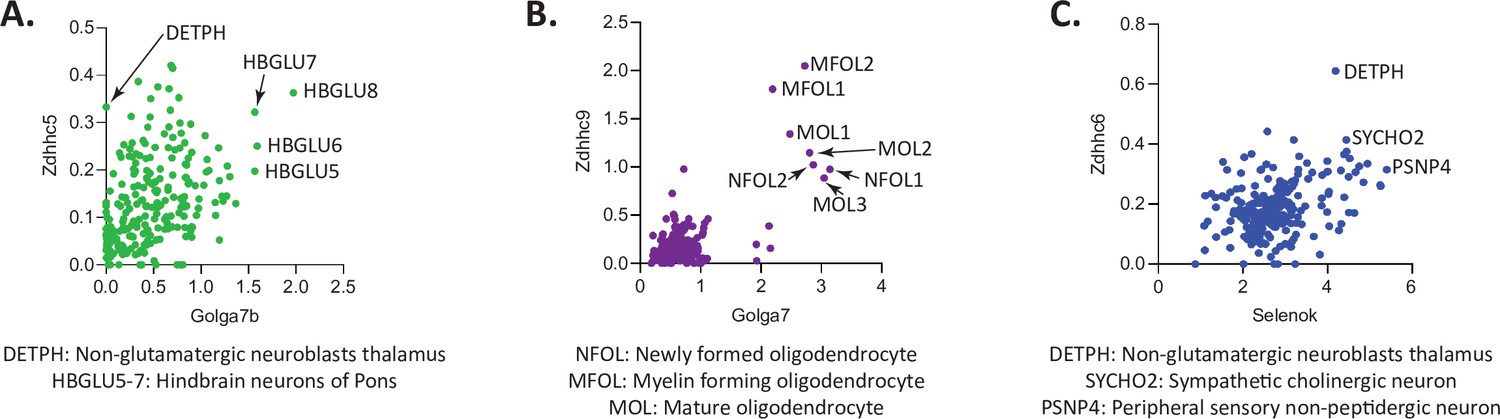
Correlation of Zdhhc enzymes and their known accessory proteins.
(A) Plot of Zdhhc5 vs Golga7b expression across 265 identified cell types from ‘MouseBrain’ dataset. Expression units: mean log2(counts per 10,000+1). Arrows/labels indicate ‘MouseBrain’ cell types that have high expression of both genes. Legend below indicates annotation of these cell types. (B) As (A), but for Zdhhc9 vs Golga7. (C) As (A), but for Zdhhc6 vs Selenok.
Figure 4—figure supplement 3
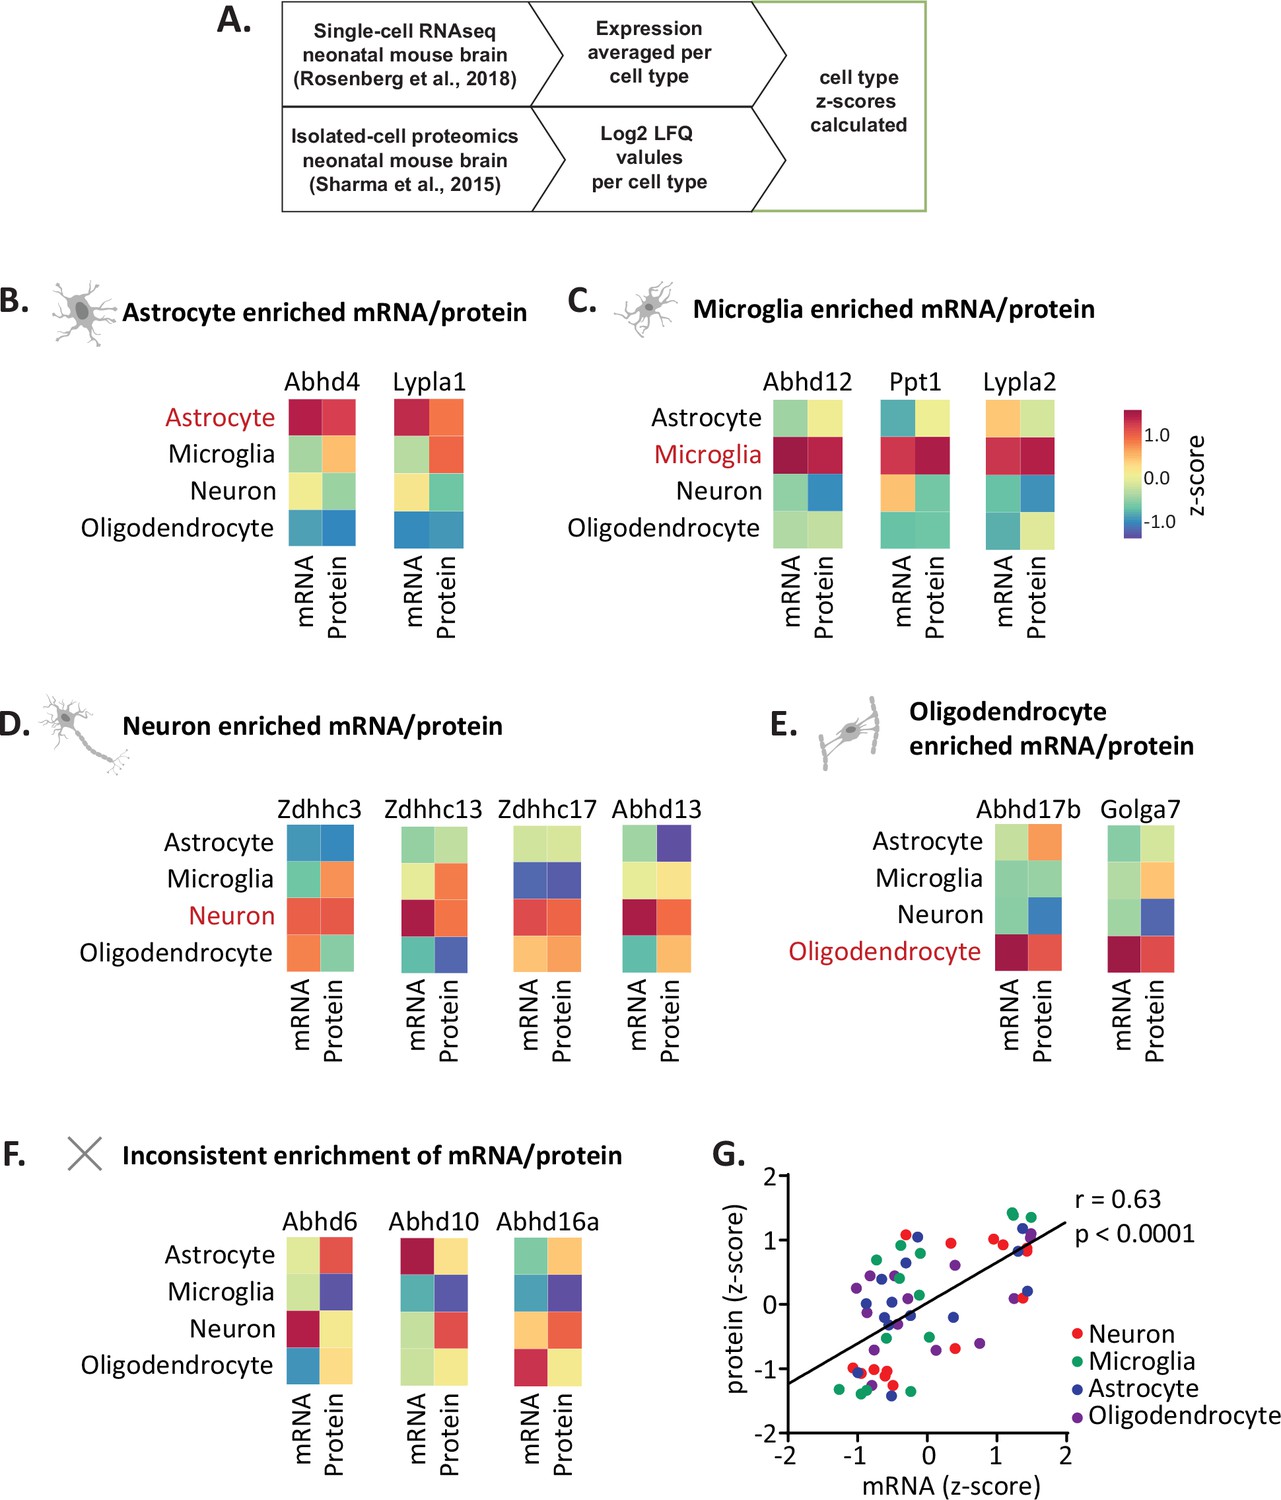
Cell-type enrichment of ZDHHC and depalmitoylating enzyme protein.
(A) Bioinformatic workflow to calculate mRNA and protein z-scores in each major brain cell type. (B) Heatmaps showing genes with mRNA and protein predominantly enriched in astrocytes. (C–F) As (B), but for microglia, neurons, oligodendrocytes and inconsistently enriched cells. (G) Graph showing correlation of protein vs RNA z-scores for all genes in each of the cell types investigated.
-
Figure 4—figure supplement 3—source data 1
Calculation of cell type z-scores from Rosenberg et al., 2018 RNAseq and Sharma et al., 2015 proteomics (related to Figure 4—figure supplement 3).
- https://cdn.elifesciences.org/articles/75804/elife-75804-fig4-figsupp3-data1-v2.xlsx
Figure 5 with 1 supplement
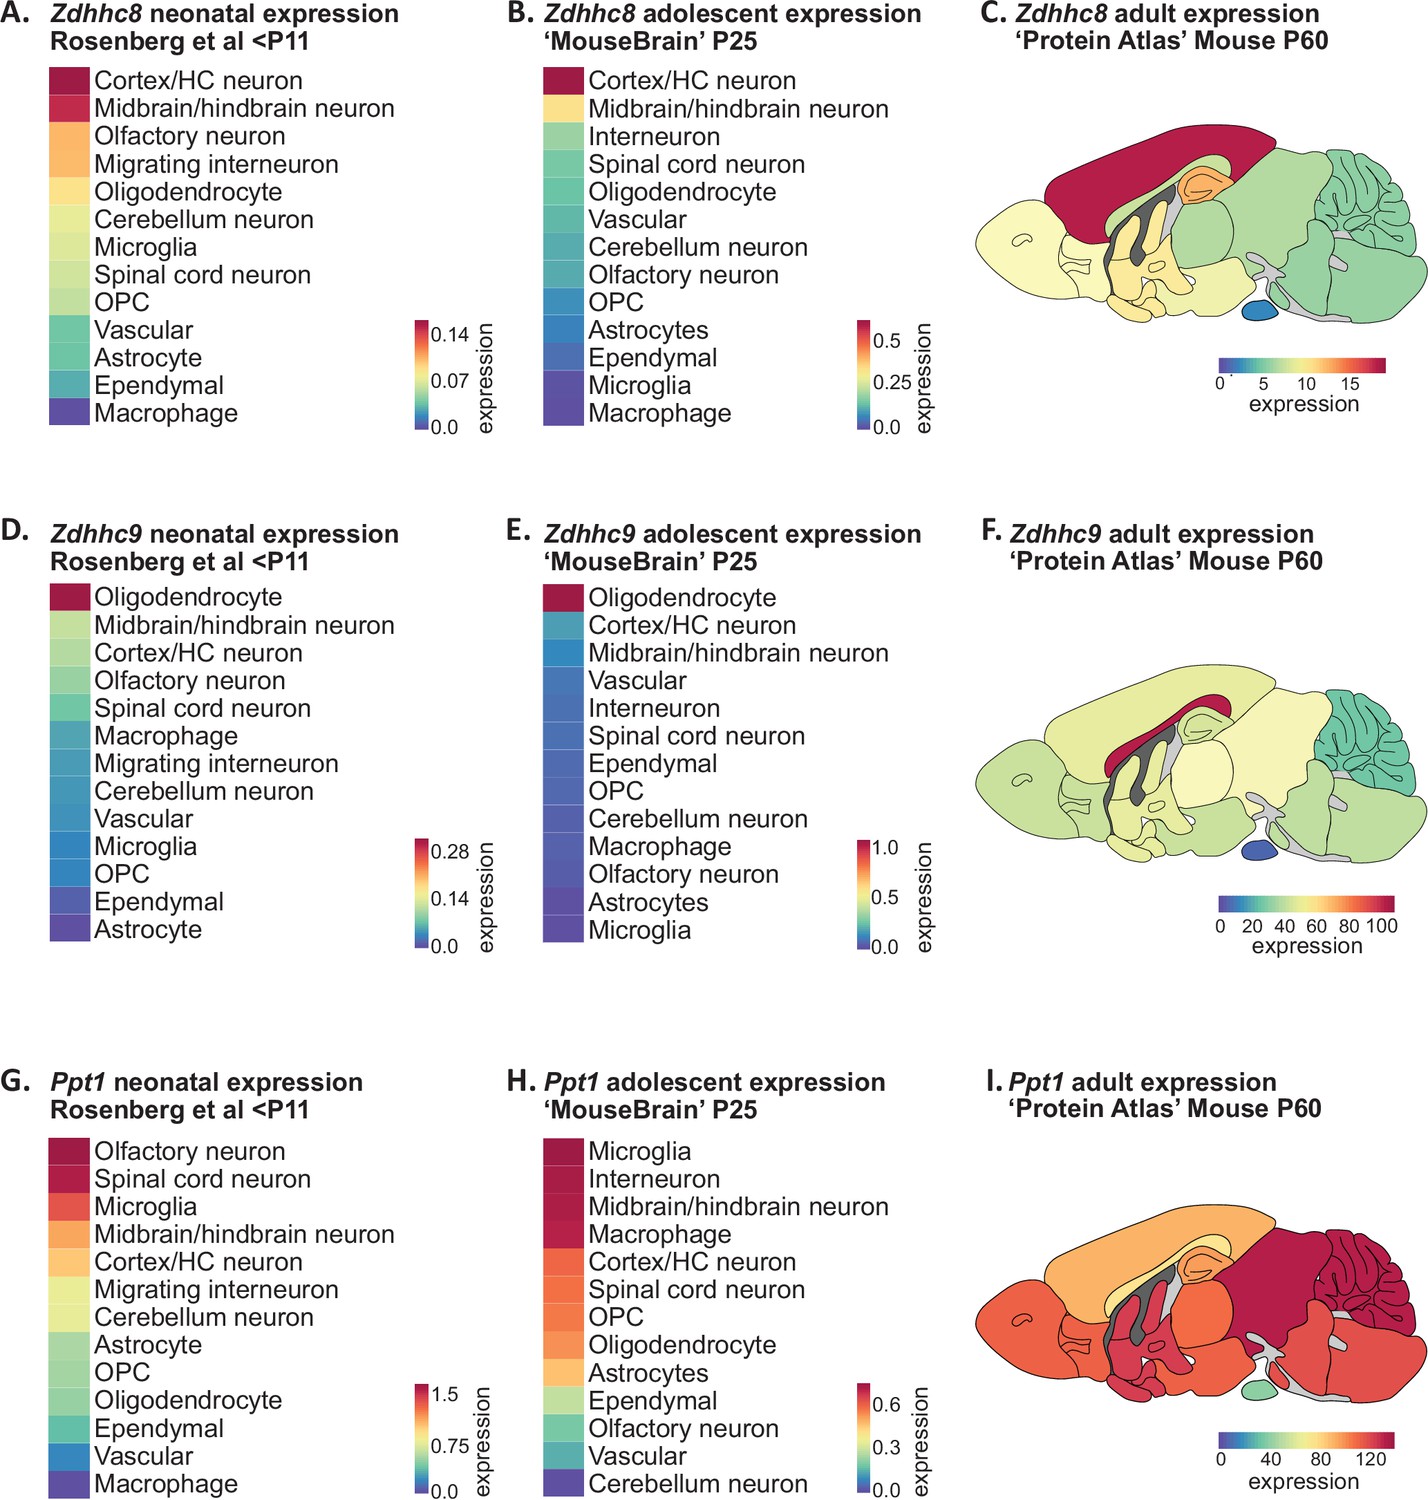
Disease associated palmitoylating enzyme regional and cell-type expression overlays with brain pathology in associated LOF disorders.
(A) Heatmap showing ranked Zdhhc8 expressing neuronal and glial cell types in descending order. Original data from scRNAseq neonatal mouse brain study; Rosenberg et al., 2018. Cell types were averaged as described in Supplementary file 1. Heatmap units: mean log2(counts per 10,000+1). (B) As in A, but original data from scRNAseq adolescent mouse brain study Zeisel et al., 2018. Heatmap units: mean log2(counts per 10,000+1). (C) Heatmap of Zdhhc8 expression from whole brain regional bulk RNAseq data (original data from ‘Protein Atlas’; Sjöstedt et al., 2020) projected onto anatomical map of mouse brain. Heatmap units: pTPM. (D–F) As in (A)-(C) but for Zdhhc9. (G–I) As in (A)-(C) but for Ppt1.
-
Figure 5—source data 1
Disease associated palmitoylating enzyme regional and cell-type expression patterns (related to Figure 5).
- https://cdn.elifesciences.org/articles/75804/elife-75804-fig5-data1-v2.xlsx
Figure 5—figure supplement 1
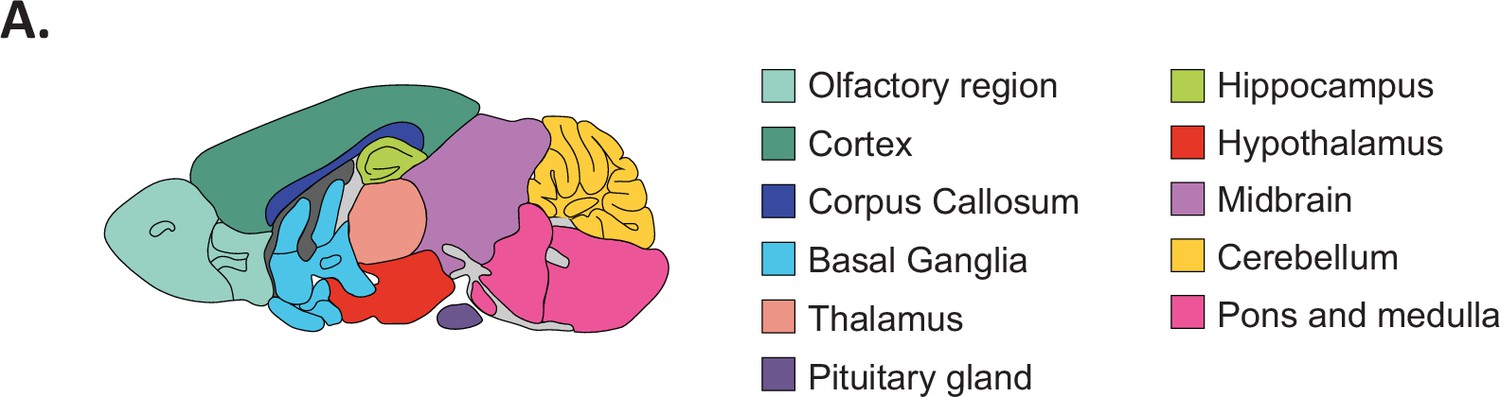
Anatomical sampling for bulk RNAseq study.
(A) Diagram illustrating anatomical brain regions for bulk RNA expression data from Figure 5 (Sjöstedt et al., 2020).
Figure 6 with 2 supplements
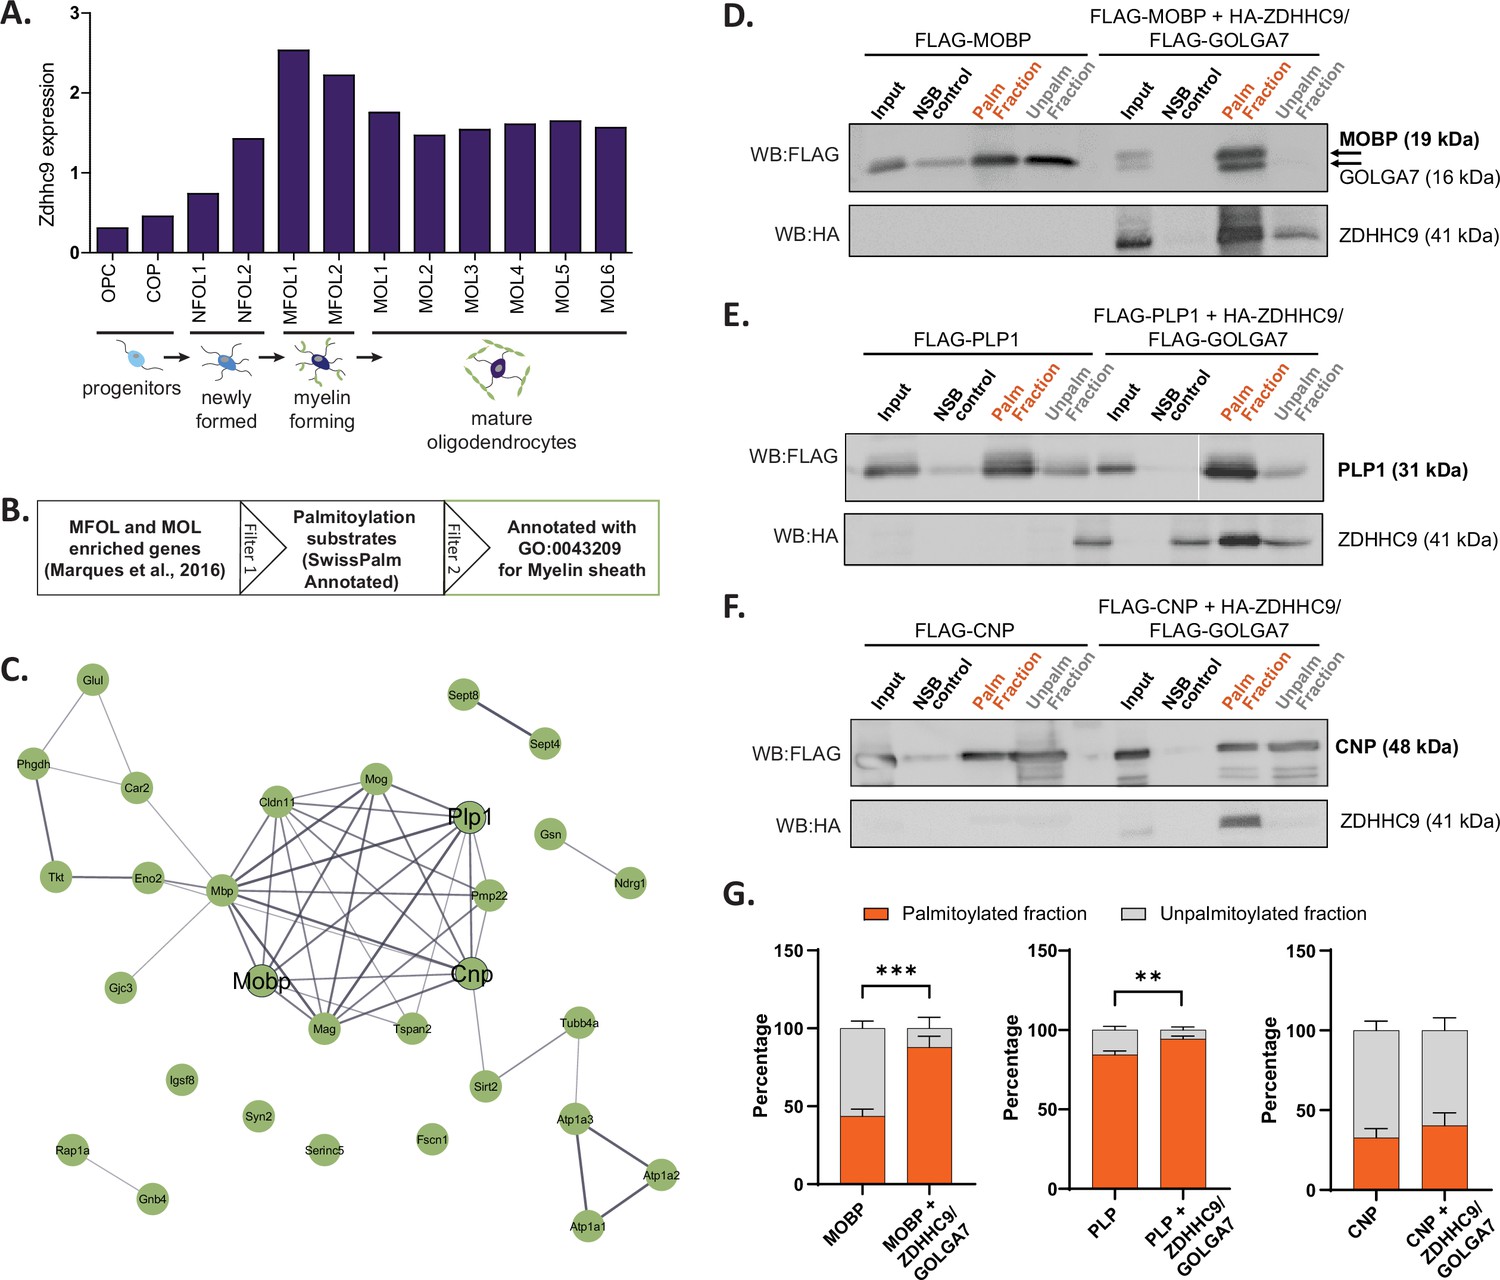
Validation of projected S-palmitoylation substrates of Zdhhc9 derived from cell-type enriched expression.
(A) Graph of expression data for Zdhhc9 extracted from BrainPalmSeq. Original data from oligodendrocyte scRNAseq study by Marques et al. Expression units: mean log2(counts per 10,000+1). (B) Diagram illustrating workflow to generate a list of oligodendrocyte enriched palmitoylation substrates, GO annotated for myelin sheath for experimental validation. (C) STRING diagram of myelin sheath annotated palmitoylation substrates. (D) Western blot following Acyl-RAC palmitoylation assay in HEK293 cells to identify palmitoylated and unpalmitoylated fractions of FLAG-MOBP either without or with co-transfection of FLAG-GOLGA7 and HA-ZDHHC9. Input = unprocessed protein lysate. NSB control = non-specific binding of protein to sepharose resin in control pipeline. Palm fraction = palmitoylated protein. Unpalm fraction = unpalmitoylated protein. (E–F) As in (D) but for FLAG-PLP1 (E) or FLAG-CNP (F). (G) Graphs quantifying the ratio of palmitoylated to unpalmitoylated protein either with or without co-transfections with FLAG-GOLGA7 and HA-ZDHHC9. n=4–6 HEK cell cultures per condition. Statistics shown for palmitoylated fraction. Two-way ANOVA; Šídák’s post hoc; mean ± SEM. MOBP: p=0.0004, 95% CI –0.6594 to –0.2266; PLP1: p=0.0046, 95% CI –0.1660 to –0.03011; CNP: p=0.6981, 95% CI –0.3274–0.1742.
-
Figure 6—source data 1
Zdhhc9 expression in oligodendrocytes, Marques et al., 2016.
- https://cdn.elifesciences.org/articles/75804/elife-75804-fig6-data1-v2.xlsx
-
Figure 6—source data 2
S-palmitoylation substrates enriched in myelinating and mature oligodendrocytes (related to Figure 6B and C).
- https://cdn.elifesciences.org/articles/75804/elife-75804-fig6-data2-v2.xlsx
-
Figure 6—source data 3
Acyl Rac quantification for Zdhhc9 substrate validation (related to Figure 6G).
- https://cdn.elifesciences.org/articles/75804/elife-75804-fig6-data3-v2.xlsx
-
Figure 6—source data 4
Uncropped raw and annotated western blot images for all data quantified in Figure 6G.
- https://cdn.elifesciences.org/articles/75804/elife-75804-fig6-data4-v2.zip
Figure 6—figure supplement 1
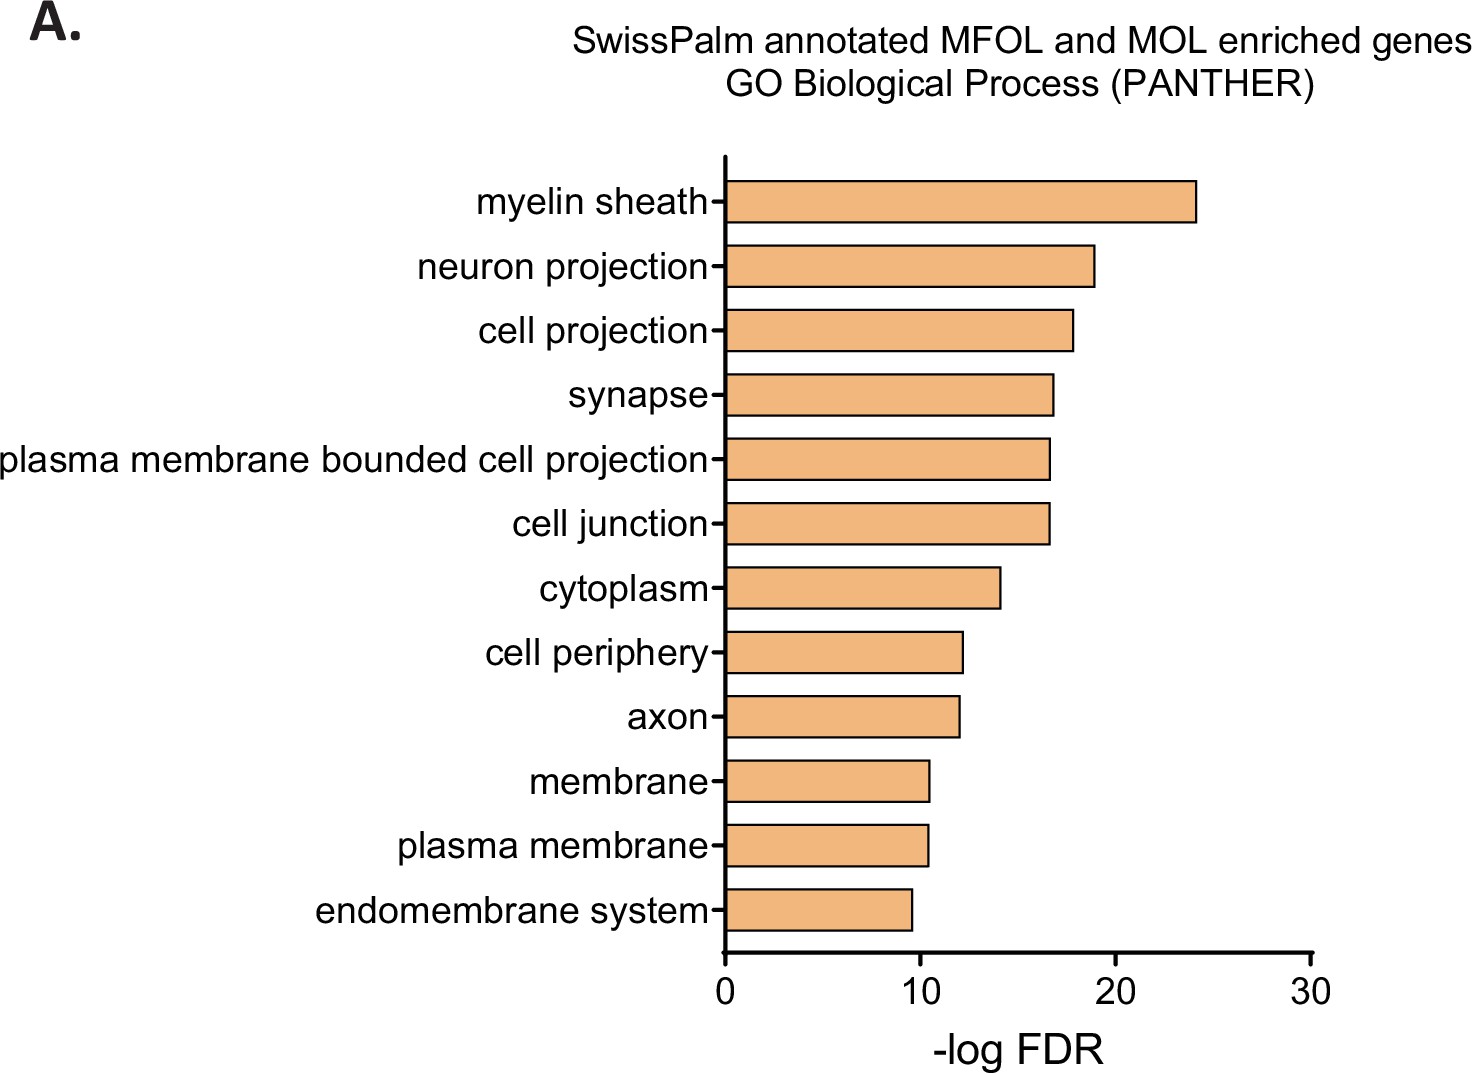
GO cellular component analysis for oligodendrocyte enriched genes.
(A) Graph of GO cellular component analysis. Gene IDs from the full Marques oligodendrocyte dataset (Marques et al., 2016) that were enriched in MFOL and MOL subtypes and were also Uniprot reviewed and SwissPalm annotated were used as input.
Figure 6—figure supplement 2
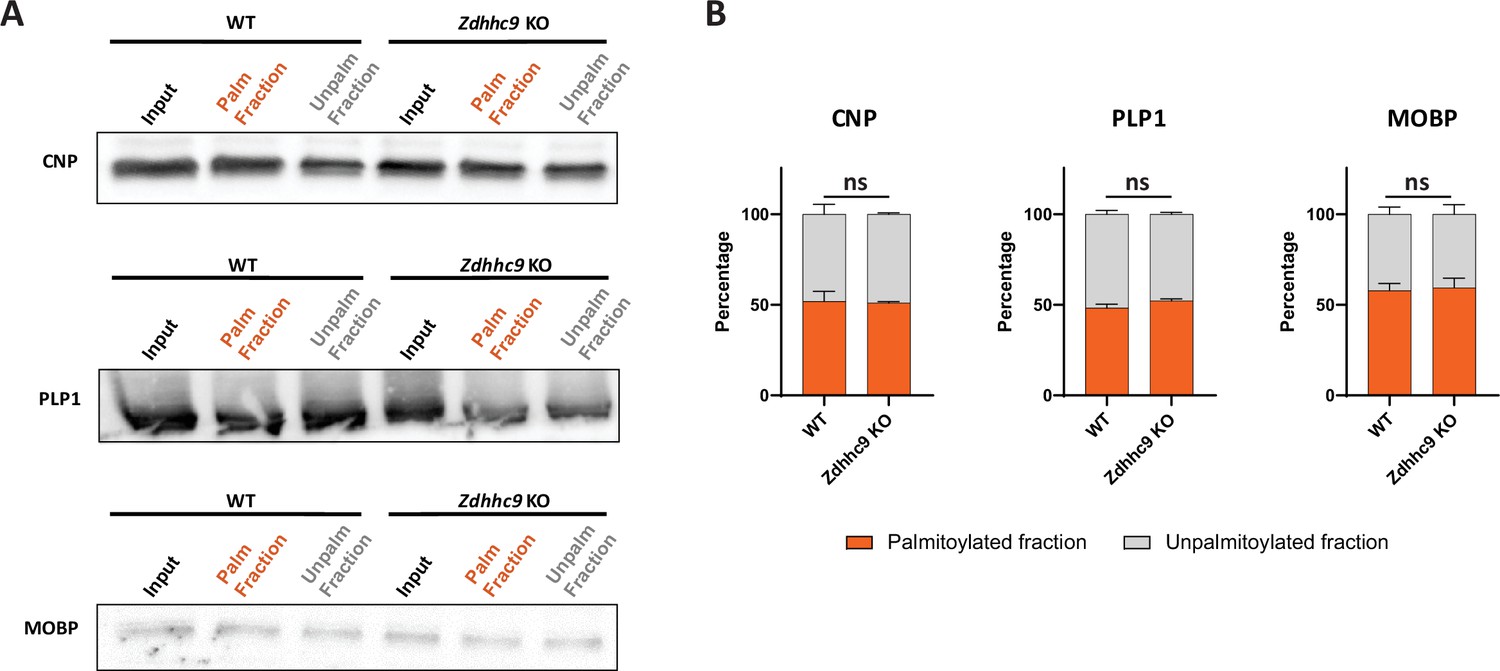
Palmitoylation of myelin proteins in Zdhhc9 KO mice.
(A) Western blot following Acyl-RAC palmitoylation assay in WT or Zdhhc9 KO half-brains to identify palmitoylated and unpalmitoylated fractions of CNP, PLP1 and MOBP. Input = unprocessed protein lysate. Palm fraction = palmitoylated protein. Unpalm fraction.=unpalmitoylated protein. (B) Graphs quantifying the ratio of palmitoylated to unpalmitoylated protein in WT or Zdhhc9 KO mice. n=2–3 animals per condition. Statistics shown for palmitoylated fraction. Two-way ANOVA; Šídák’s post hoc; mean ± SEM. ns = not significant.
-
Figure 6—figure supplement 2—source data 1
Acyl-Rac quantification/western blots of mouse brain lysates from wild-type and Zdhhc9 KO mice (related to Figure 6—figure supplement 2).
- https://cdn.elifesciences.org/articles/75804/elife-75804-fig6-figsupp2-data1-v2.zip
Tables
Table 1
RNAseq published datasets curated to create BrainPalmSeq.
| First Author | Year | PMID | Regions | Age | Website | Technique | Sample | Data Accession |
|---|---|---|---|---|---|---|---|---|
| Zeisel | 2018 | 30096314 | CNS/PNS | Juvenile | http://mousebrain.org/ | 10 X Genomics | Single-cell | SRP135960 |
| Saunders | 2018 | 30096299 | Whole brain | Adult (P60-70) | http://dropviz.org/ | Drop-seq | Single-cell | GSE116470 |
| Sjöstedt | 2020 | 32139519 | Whole brain | Adult | https://www.proteinatlas.org/ | RNA-seq | Bulk tissue | |
| Rosenberg | 2018 | 29545511 | Whole brain | Neonatal | n/a | SPLiT-seq | Single-cell | GSE110823 |
| Cembrowski | 2016 | 27113915 | Hippocampus | Adult | http://hipposeq.janelia.org/ | Genetic labeling; RNA-seq | Cell sorted | GSE74985 |
| Zhang | 2014 | 25186741 | Cortex | Adult | http://web.stanford.edu/group/barres_lab/brain_rnaseq.https | PAN; FACS; RNA-seq | Cell sorted | GSE52564 |
| Zeisel | 2015 | 25700174 | Cortex, hippocampus CA1 | Adult | http://linnarssonlab.org/cortex | Fluidigm C1 | Single-cell | GSE60361 |
| Yao | 2021 | 34004146 | Isocortex/ hippocampus | Adult (P50+) | https://celltypes.brain-map.org/rnaseq/mouse_ctx-hip_10x | 10 X Genomics | Single-cell | GSE185862 |
| Kozareva | 2020 | 24259518 | Cerebellum | Adult | https://singlecell.broadinstitute.org/single_cell/study/SCP795 | snSeq; 10 x Chromium V3 | Single-cell | GSE165371 |
| Phillips | 2019 | 31527803 | Thalamic excitatory neurons | Adult | https://thalamoseq.janelia.org/ | NextSeq 550 | Single-cell/bulk tissue | GSE133911; GSE133912 |
| Chen | 2017 | 28355573 | Hypothalamus | Adult | n/a | Drop-seq | Single-cell | GSE87544 |
| Gocke | 2016 | 27425622 | Striatum | Adult | n/a | Smart-seq2 | Single-cell | GSE82187 |
| O'Leary | 2020 | 32869744 | Amygdala excitatory neurons | Adult | https://scrnaseq.janelia.org/amygdala | scRNAseq | Single-cell | GSE148866 |
| Marques | 2016 | 27284195 | Oligodendrocytes whole brain | Juvenile; adult | http://linnarssonlab.org/oligodendrocytes/ | Fluidigm C1 | Single-cell | GSE75330 |
| Batiuk | 2020 | 32139688 | Astrocytes in cortex/ hippocampus | Adult (P56+) | https://holt-sc.glialab.org/sc/ | Smart-seq2 | Single-cell | GSE114000 |
| Li | 2019 | 30606613 | Microglia in brain | Embryonic, juvenile, adult | https://www.brainrnaseq.org/ | Smart-seq2 | Single-cell | GSE123025 |
Key resources table
| Reagent type (species) or resource | Designation | Source or reference | Identifiers | Additional information |
|---|---|---|---|---|
| Recombinant DNA reagent | FLAG-GOLGA7 | Gift from Maurine Linder Washington University School of Medicine | ||
| Recombinant DNA reagent | HA-ZDHHC9 | Shimell et al., 2019 | ||
| Recombinant DNA reagent | FLAG-MOBP | Origene, Maryland, USA | CAT#: RC223946 | |
| Recombinant DNA reagent | FLAG-PLP1 | Origene, Maryland, USA | CAT#: RC218616 | |
| Recombinant DNA reagent | FLAG-CNP | Origene, Maryland, USA | CAT#: RC207038 | |
| Cell line (Homo-sapiens) | HEK293T | ATCC | CAT # CRL-1573 | |
| Antibody | Anti-HA, (rabbit monoclonal) | Cell Signaling Technology | CAT#: 3,724 | Dilution 1:1000 |
| Antibody | Anti-FLAG (mouse monoclonal) | Origene | CAT#: TA50011-100 | Dilution 1:1000 |
| Antibody | Anti-MOBP (Rabbit polyclonal) | Invitrogen | CAT# PA5-100618 | Dilution 1:1000 |
| Antibody | Anti-PLP1 (Rabbit polyclonal) | Abcam | CAT# ab28486 | Dilution 1:1000 |
| Antibody | Anti-CNP (Mouse monoclonal) | Abcam | CAT# ab6319 | Dilution 1:1000 |
| Commercial assay or kit | CAPTUREome S-palmitoylated protein kit | Badrilla, UK | CAT# K010-311 |
Additional files
-
Transparent reporting form
- https://cdn.elifesciences.org/articles/75804/elife-75804-transrepform1-v2.pdf
-
Supplementary file 1
Comparable category assignments for cell types identified in Rosenberg et al., 2018; Zeisel et al., 2018.
Related to Figure 5.
- https://cdn.elifesciences.org/articles/75804/elife-75804-supp1-v2.xlsx
Download links
A two-part list of links to download the article, or parts of the article, in various formats.
Downloads (link to download the article as PDF)
Open citations (links to open the citations from this article in various online reference manager services)
Cite this article (links to download the citations from this article in formats compatible with various reference manager tools)
Exploring the expression patterns of palmitoylating and de-palmitoylating enzymes in the mouse brain using the curated RNA-seq database BrainPalmSeq
eLife 11:e75804.
https://doi.org/10.7554/eLife.75804


