Iron status influences mitochondrial disease progression in Complex I-deficient mice
- Department of Laboratory Medicine & Pathology, University of Washington, United States
Figures
Figure 1 with 2 supplements
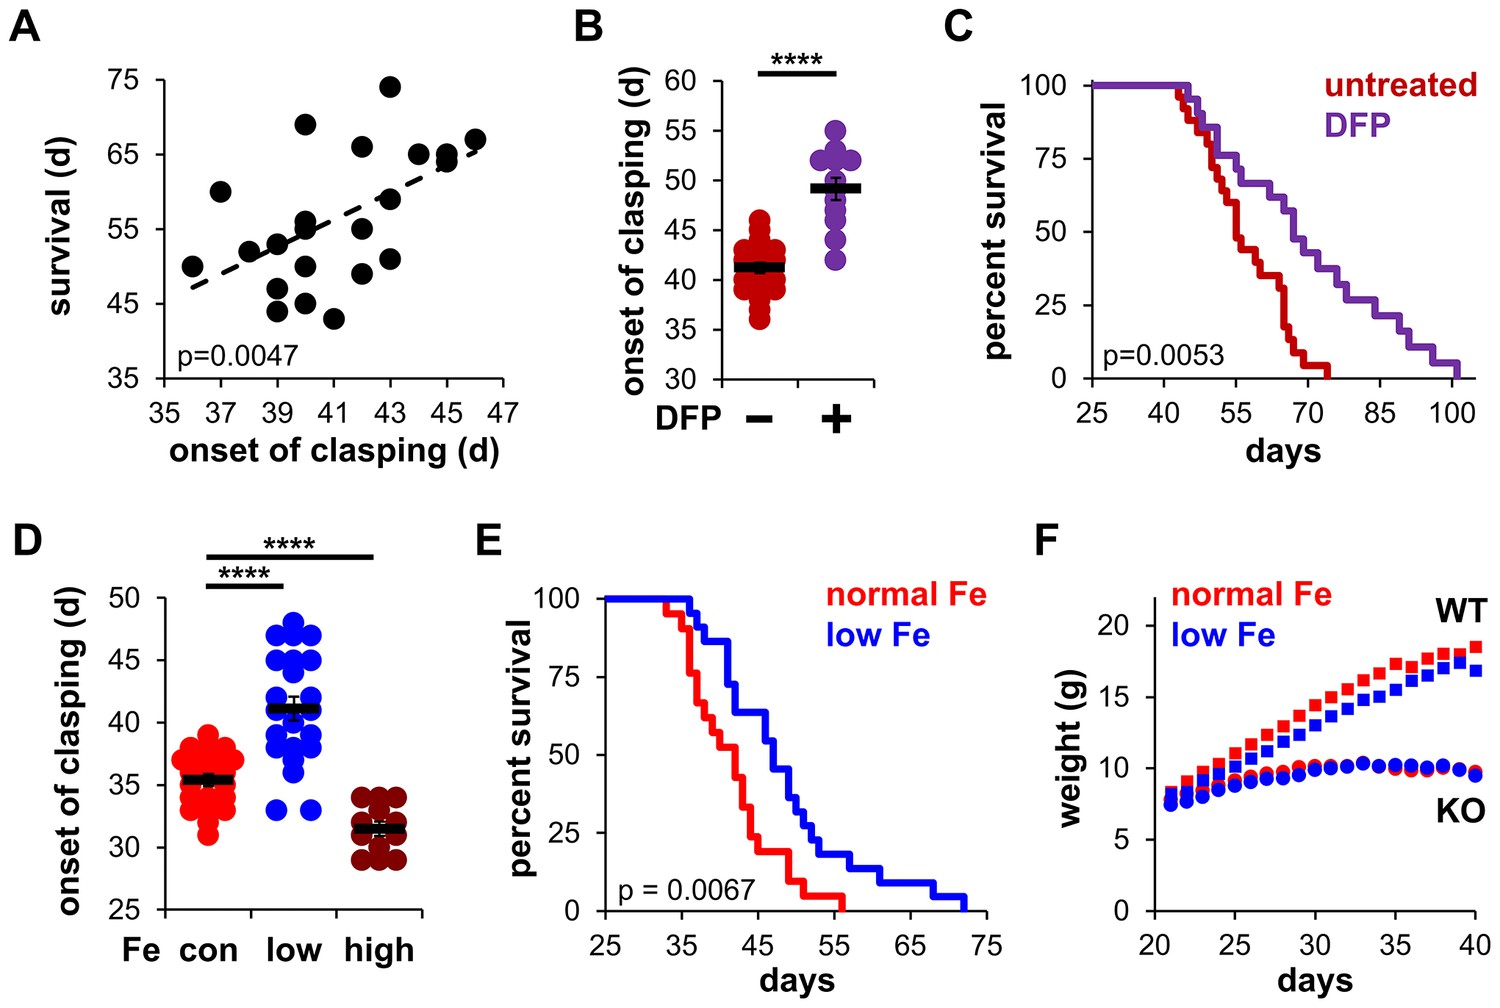
Iron restriction delays mitochondrial disease in mice.
(A) Correlation between the onset of clasping and survival. Each point represents data from a single mouse. p=0.0047, Pearson’s test. (B) Age at which Ndufs4−/− mice exhibited the clasping phenotype on chow diet. Mice were treated with either vehicle or deferiprone (DFP) in the water (2 mg/mL) from weaning. (C) Survival curves of Ndufs4−/− mice fed a chow diet and treated with deferiprone in the water (2 mg/mL) from weaning. (D) Onset of clasping in Ndufs4−/− mice on AIN-93G synthetic diet containing normal (40 ppm, con) or low (8 ppm) iron starting from weaning. Mice on control diet (40 ppm, Fe) were also treated with iron-dextran (100 mg/kg every 3 days via i.p. injection, high) from weaning. (E) Survival curves of mice on normal (40 ppm) or low (8 ppm) AIN-93G synthetic diet. (F) Weight gain in wild-type (WT, square markers) or Ndufs4−/− mice (KO, circle markers) on AIN-93G synthetic diet containing normal (40 ppm, red) or low (8 ppm, blue) concentrations of iron. p Value was calculated by log-rank for lifespan analyses. ****p<0.0001, t test with Bonferroni Correction.
Figure 1—figure supplement 1
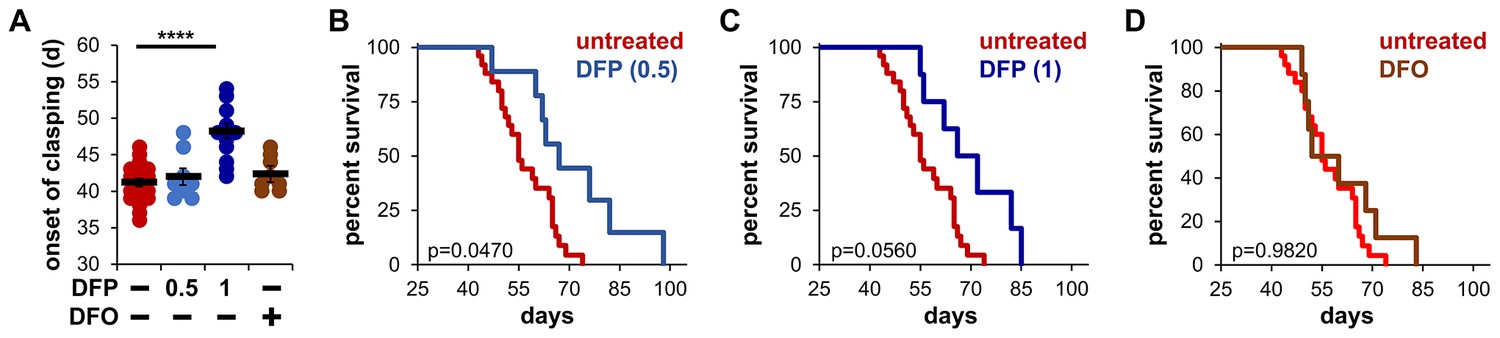
Brain-permeable iron chelators are effective in delaying mitochondrial disease.
(A) Age at which Ndufs4−/− mice exhibited the clasping phenotype on chow diet. Mice were treated with either vehicle, deferiprone (DFP) in the water (0.5 or 1 mg/mL), or deferoxamine (DFO) via daily i.p. injection (125 mg/kg) from weaning. (B) Survival curves of Ndufs4−/− mice fed a chow diet and treated with deferiprone in the water (0.5 mg/mL) from weaning. (C) Survival curves of Ndufs4−/− mice fed a chow diet and treated with deferiprone in the water (1 mg/mL) from weaning. (D) Survival curves of Ndufs4−/− mice fed a chow diet and treated with deferoxamine via daily i.p. injection (125 mg/kg) from weaning. p Value was calculated by log-rank for lifespan analyses. ****p<0.0001, t test.
Figure 1—figure supplement 2
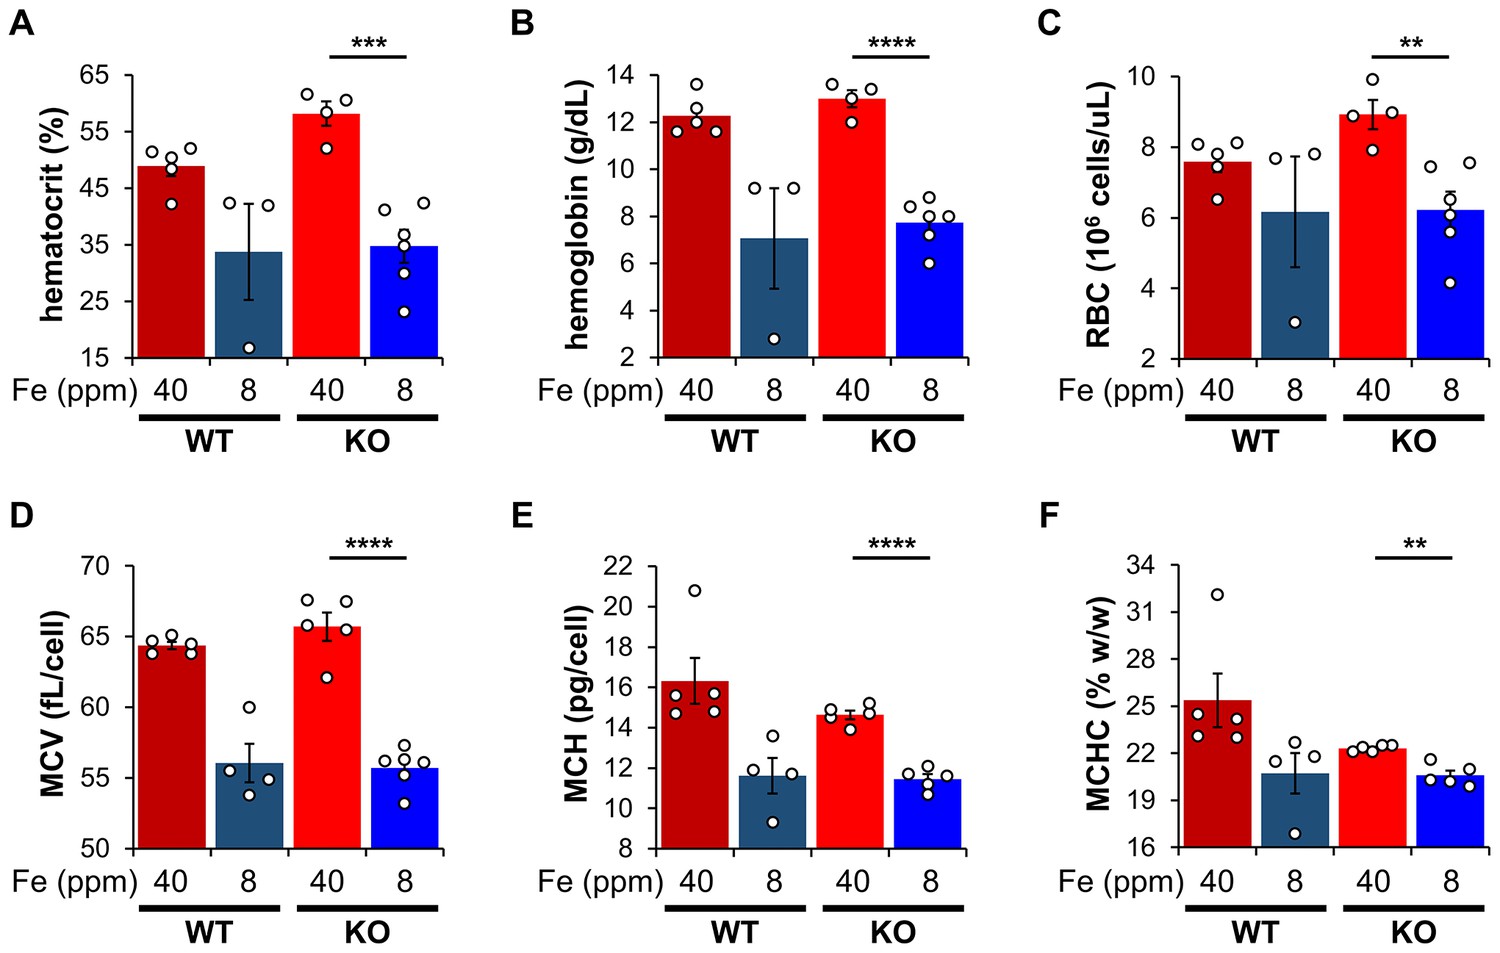
Iron restriction induces iron-deficiency anemia.
Complete blood count in PND30 WT or Ndufs4−/− mice on normal (40 ppm) or low (8 ppm) AIN-93G synthetic diet to quantify (A) hematocrit, (B) hemoglobin, (C) red blood cell count which were used to calculate (D) mean corpuscular volume, (E) mean corpuscular hemoglobin, and (F) mean corpuscular hemoglobin concentration.
N=3–6 mice. **p<0.01, ***p<0.001, ****p<0.0001, t test. WT, wild-type.
Figure 2 with 2 supplements

Total iron quantification in tissues.
Quantification of total iron by ICP-MS from WT and Ndufs4−/− mice at PND35 fed control (40 ppm) or low (8 ppm) AIN-93G in (A) liver, (B) whole brain, (C) kidney, (D) heart, (E) quadricep, (F) spleen, and (G) duodenum. N=3–5 mice. *p<0.05, **p<0.01, ***p<0.001, ANOVA with post hoc Tukey. ICP-MS, inductively coupled plasma mass spectrometry; WT, wild-type.
Figure 2—figure supplement 1
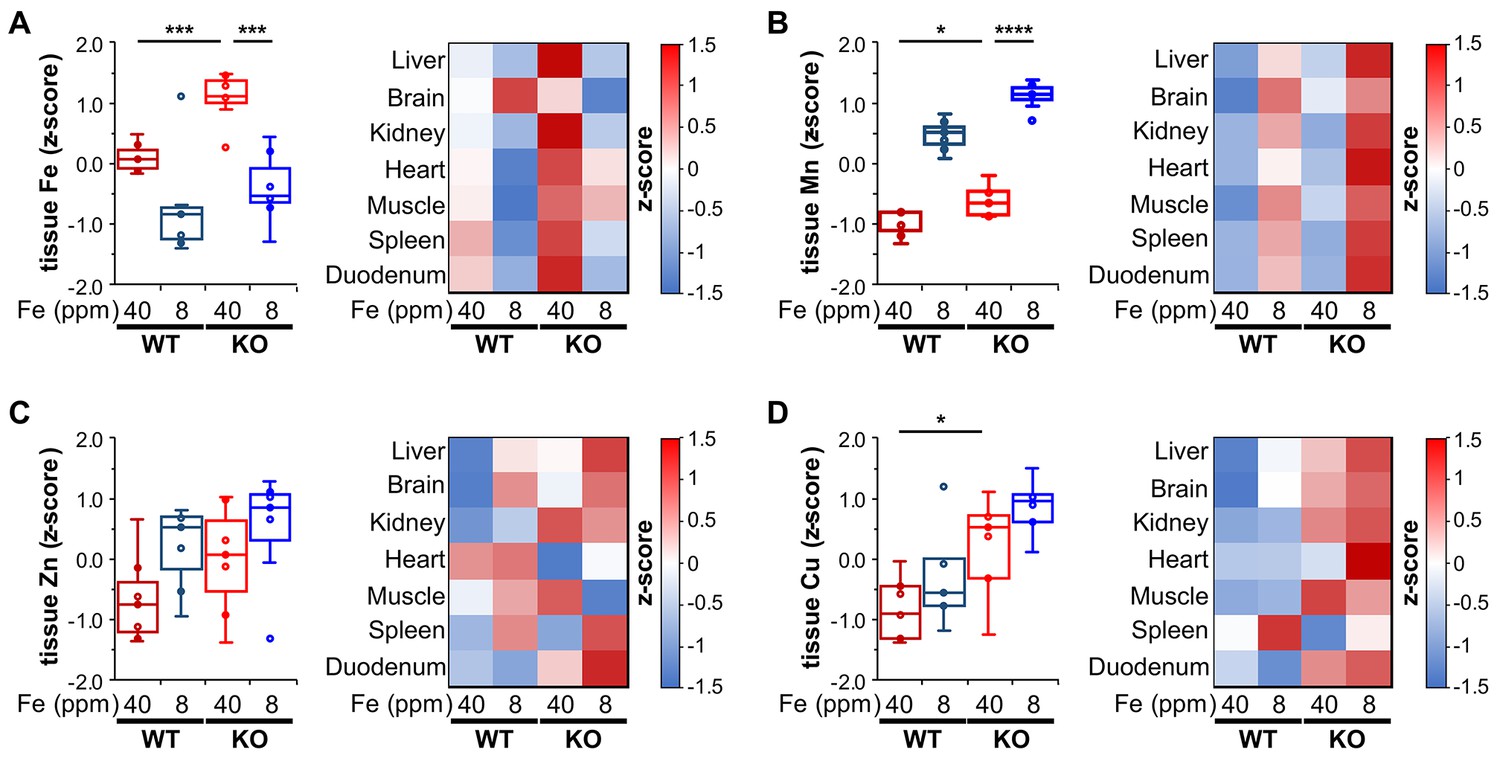
Analysis of biologically-relevant transition metals.
(A) Left, Box, and whisker plot of combined z-score-normalized ICP-MS values of tissue iron, (B) manganese, (C) zinc, and (D) copper in WT and Ndufs4−/− mice on control (40 ppm) or low (8 ppm) AIN-93 diet (each point represents z-score value for an individual tissue). (A–D) Right, heat map of individualized z-scores by tissue. N=3–5 mice. *p<0.05, ***p<0.001, ****p<0.0001, t test with Bonferroni correction. ICP-MS, inductively coupled plasma mass spectrometry; WT, wild-type.
Figure 2—figure supplement 2
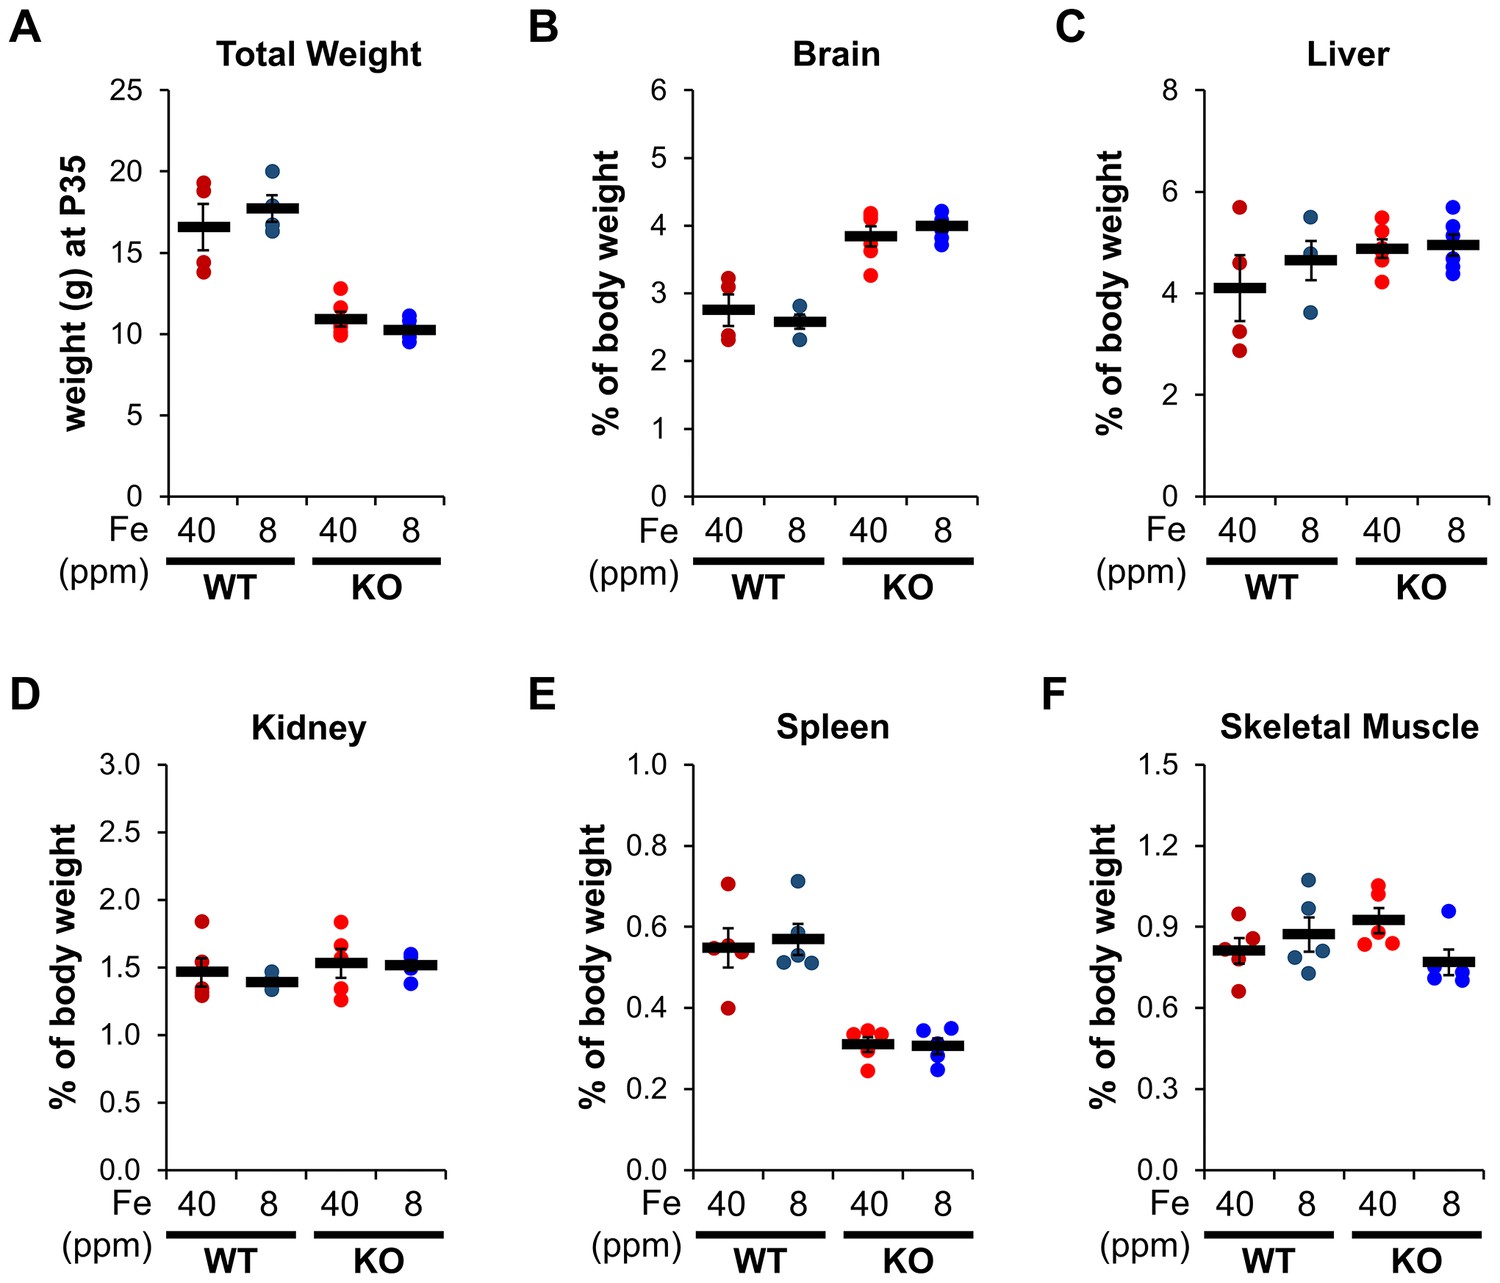
Iron restriction has no effect on organ size.
(A) Weight at time of tissue collection (PND35) of WT or Ndufs4−/− mice on a normal (40 ppm) or low (8 ppm) AIN-93G synthetic diet. (B) Percent of tissue weight from mice in (A) relative to total body weight at time of collection (PND35) in brain, (C) liver, (D) kidney, (E) spleen, and (F) quadricep.
Figure 3

Iron restriction reduces iron-dependent oxidative damage and neuroinflammation.
(A) Quantification of non-heme iron by ferrozine assay and (B) MDA-TBA adduct in livers from WT and Ndufs4−/− mice at PND35 that were fed control (40 ppm) or low (8 ppm) AIN-93G synthetic diet. (C) Correlation between days since Ndufs4−/− mice began displaying the clasping phenotype with detected liver MDA levels from (B). p=0.0152, Pearson’s test. (D) Representative western blot images and (E) densitometry (relative to total protein) of the astrogliosis marker GFAP from brain sections that normally exhibit brain lesions (olfactory bulb, cerebellum) and that do not (cortex) from PND35 WT and Ndufs4−/− mice fed a control (40 ppm) or low (8 ppm) AIN-93G synthetic diet. Each lane represents protein extract from a single mouse. N=3–6 mice. *p<0.05, **p<0.01, ANOVA with post hoc Tukey. MDA-TBA, malondialdehyde thiobarbituric acid; WT, wild-type.
-
Figure 3—source data 1
Raw unedited immunoblots for Figure 3D brain regions.
- https://cdn.elifesciences.org/articles/75825/elife-75825-fig3-data1-v2.zip
Figure 4 with 2 supplements
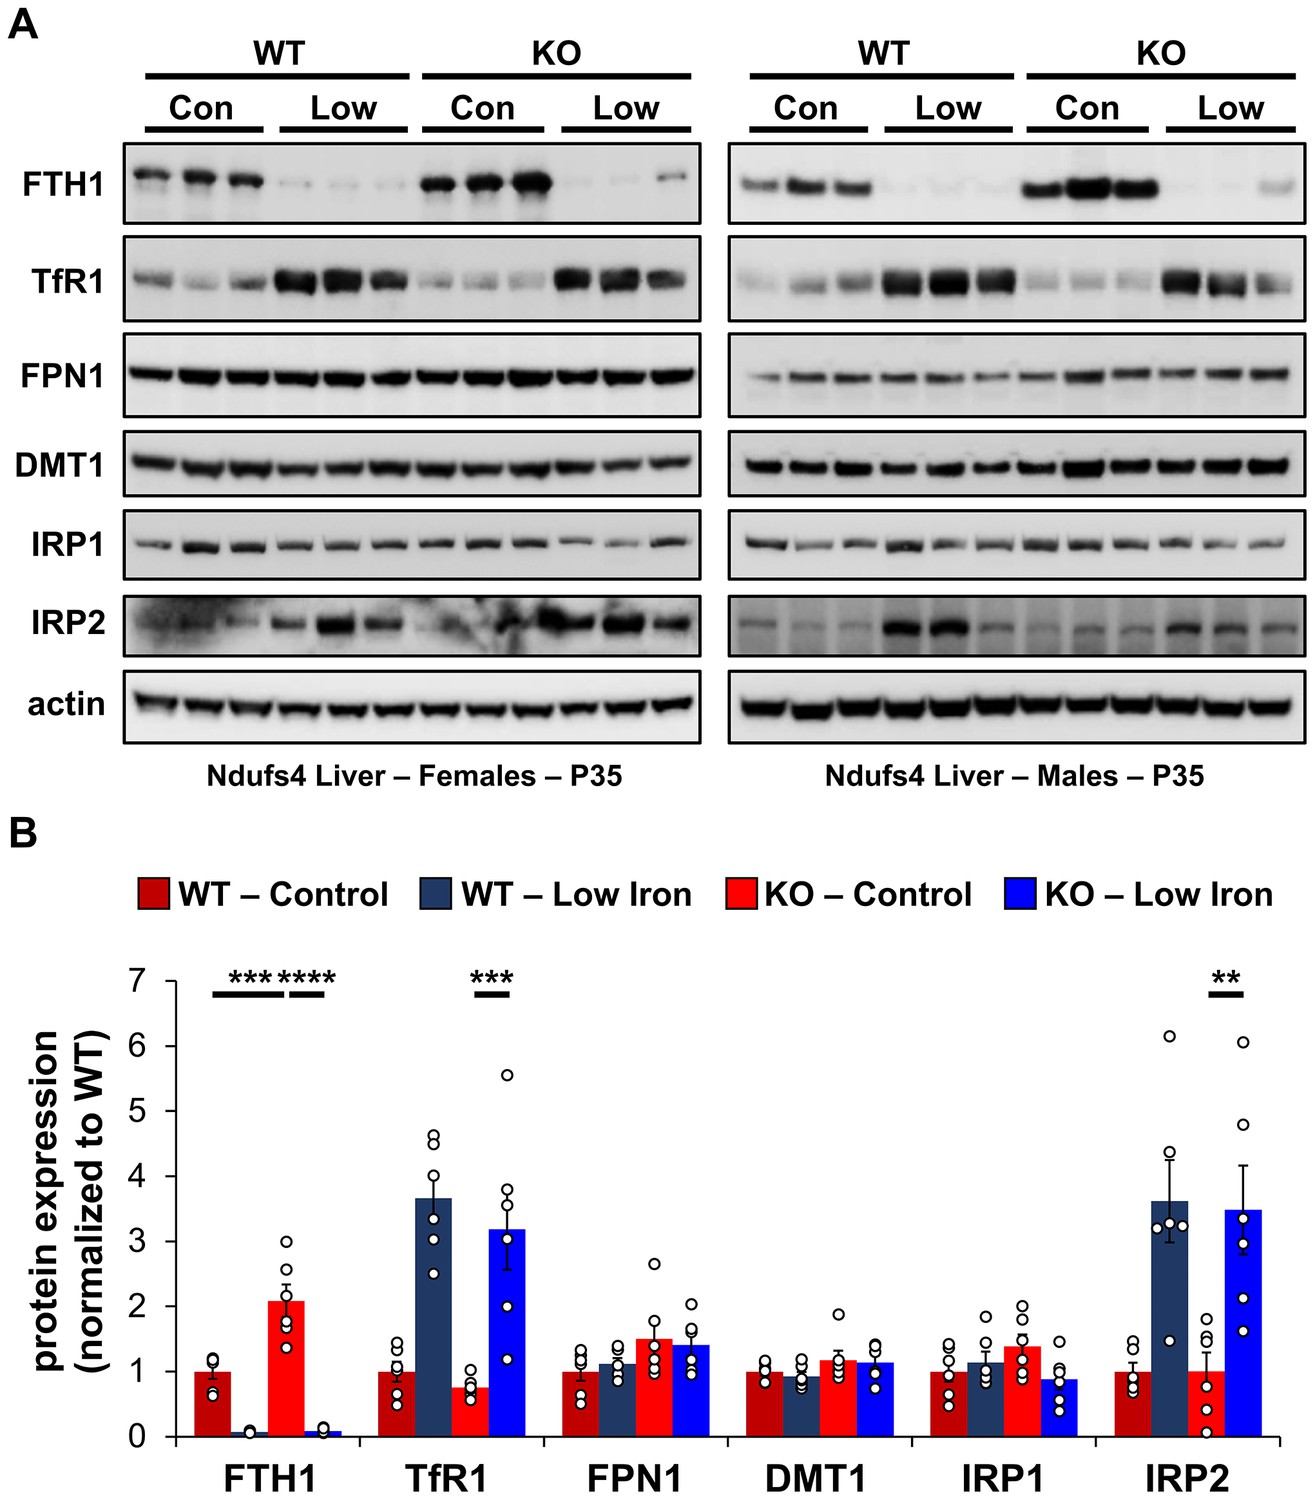
Changes in iron-dependent proteins suggest increased labile iron.
(A) Representative western blot images and (B) densitometry (relative to actin) of proteins involved in regulation of iron transport, storage, or metabolism in livers from PND35 WT and Ndufs4−/− mice fed a control (40 ppm) or low (8 ppm) iron AIN-93G synthetic diet from weaning. Each lane represents protein extract from a single mouse. **p<0.01, ***p<0.001, ****p<0.0001, ANOVA with post hoc Tukey.
-
Figure 4—source data 1
Raw unedited immunoblots for Figure 4A liver.
- https://cdn.elifesciences.org/articles/75825/elife-75825-fig4-data1-v2.zip
Figure 4—figure supplement 1
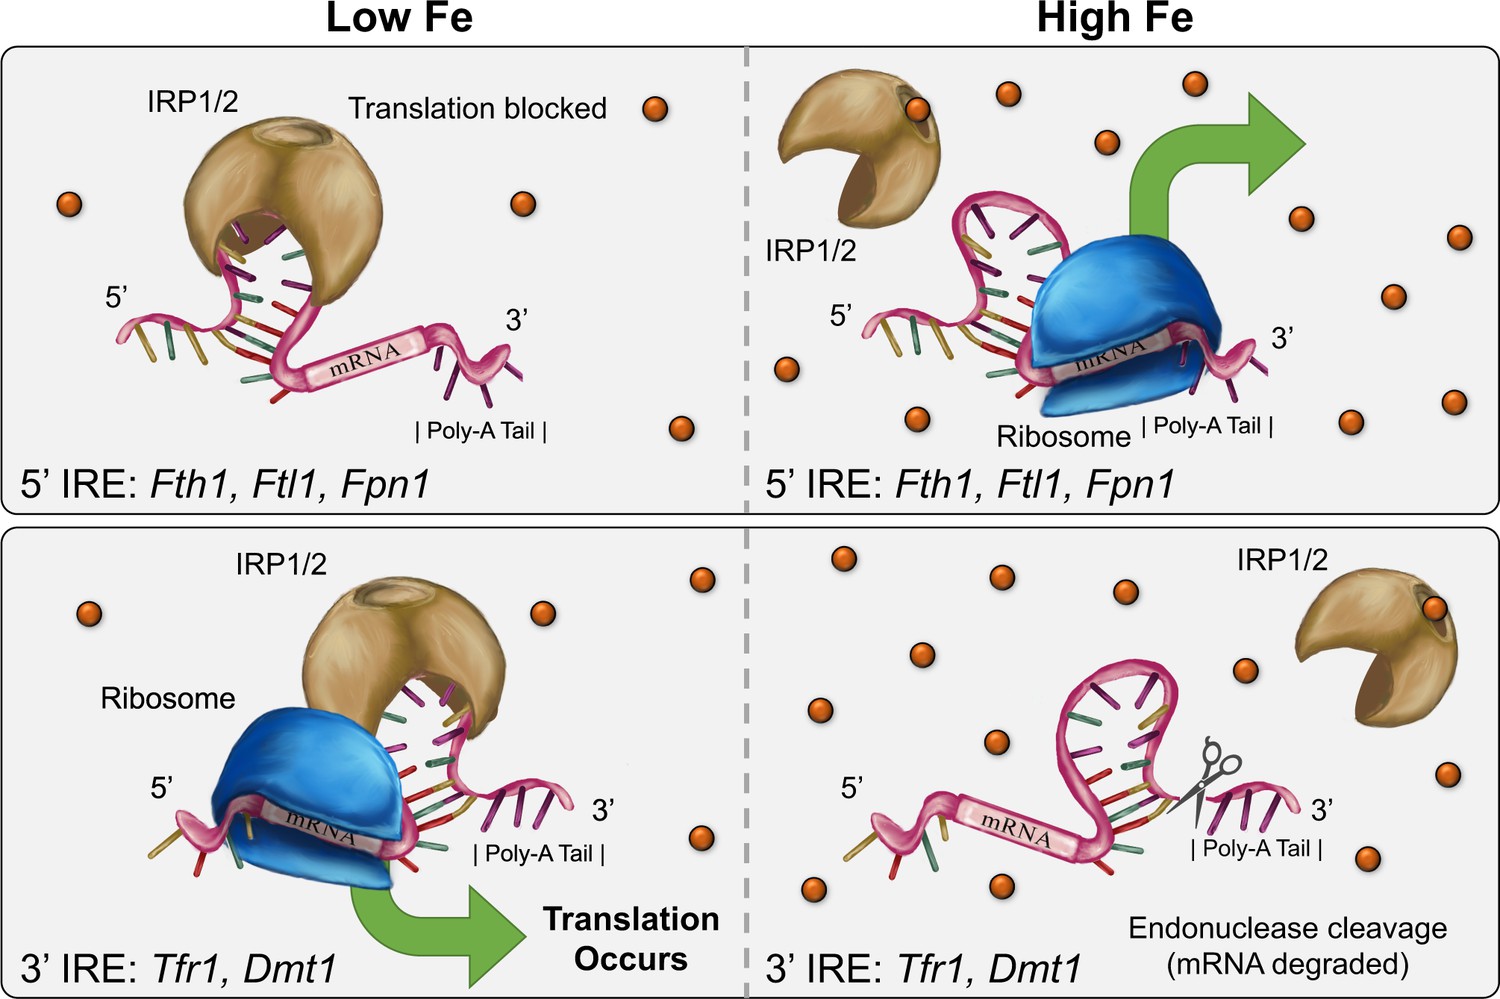
Simplified schematic of IRE-dependent translational regulation of proteins involved in iron transport, storage, or metabolism.
Translation is blocked for 5′-IREs (e.g., Fth1, Ftl1, and Fpn1) when iron regulatory proteins (IRPs) are bound to the IRE in low iron conditions (top left). Protein expression increases due to mRNA stabilization when IRPs are bound to 3′-IREs (e.g., Tfr1 and Dmt1) in low iron conditions (bottom left). Exposure to high iron allows for translation in genes containing 5′-IREs (top right) and leads to decreased protein expression for 3′-IREs due to endonuclease-mediated mRNA degradation (bottom right). IRE, iron-responsive element.
Figure 4—figure supplement 2
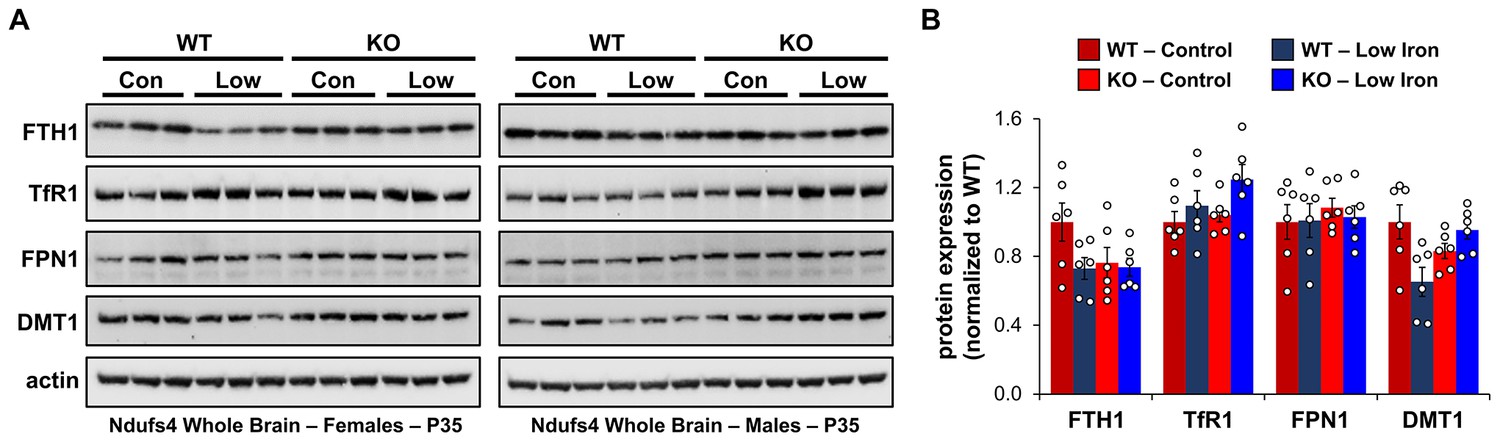
Immunoblot of iron-dependent proteins in whole brain extracts.
(A) Representative western blot images and (B) densitometry (relative to actin) of proteins involved in regulation of iron transport, storage, or metabolism in whole brains from PND35 WT and Ndufs4−/− mice fed a control (40 ppm) or low (8 ppm) iron AIN-93G synthetic diet from weaning. Each lane represents protein extract from a single mouse. There were no statistically significant differences (aka p<0.05) between WT-Control versus KO-Control, or KO-Control versus KO-Low Iron mice groups. WT, wild-type.
-
Figure 4—figure supplement 2—source data 1
Raw unedited immunoblot images for Figure 4—figure supplement 2A brain.
- https://cdn.elifesciences.org/articles/75825/elife-75825-fig4-figsupp2-data1-v2.zip
Figure 5
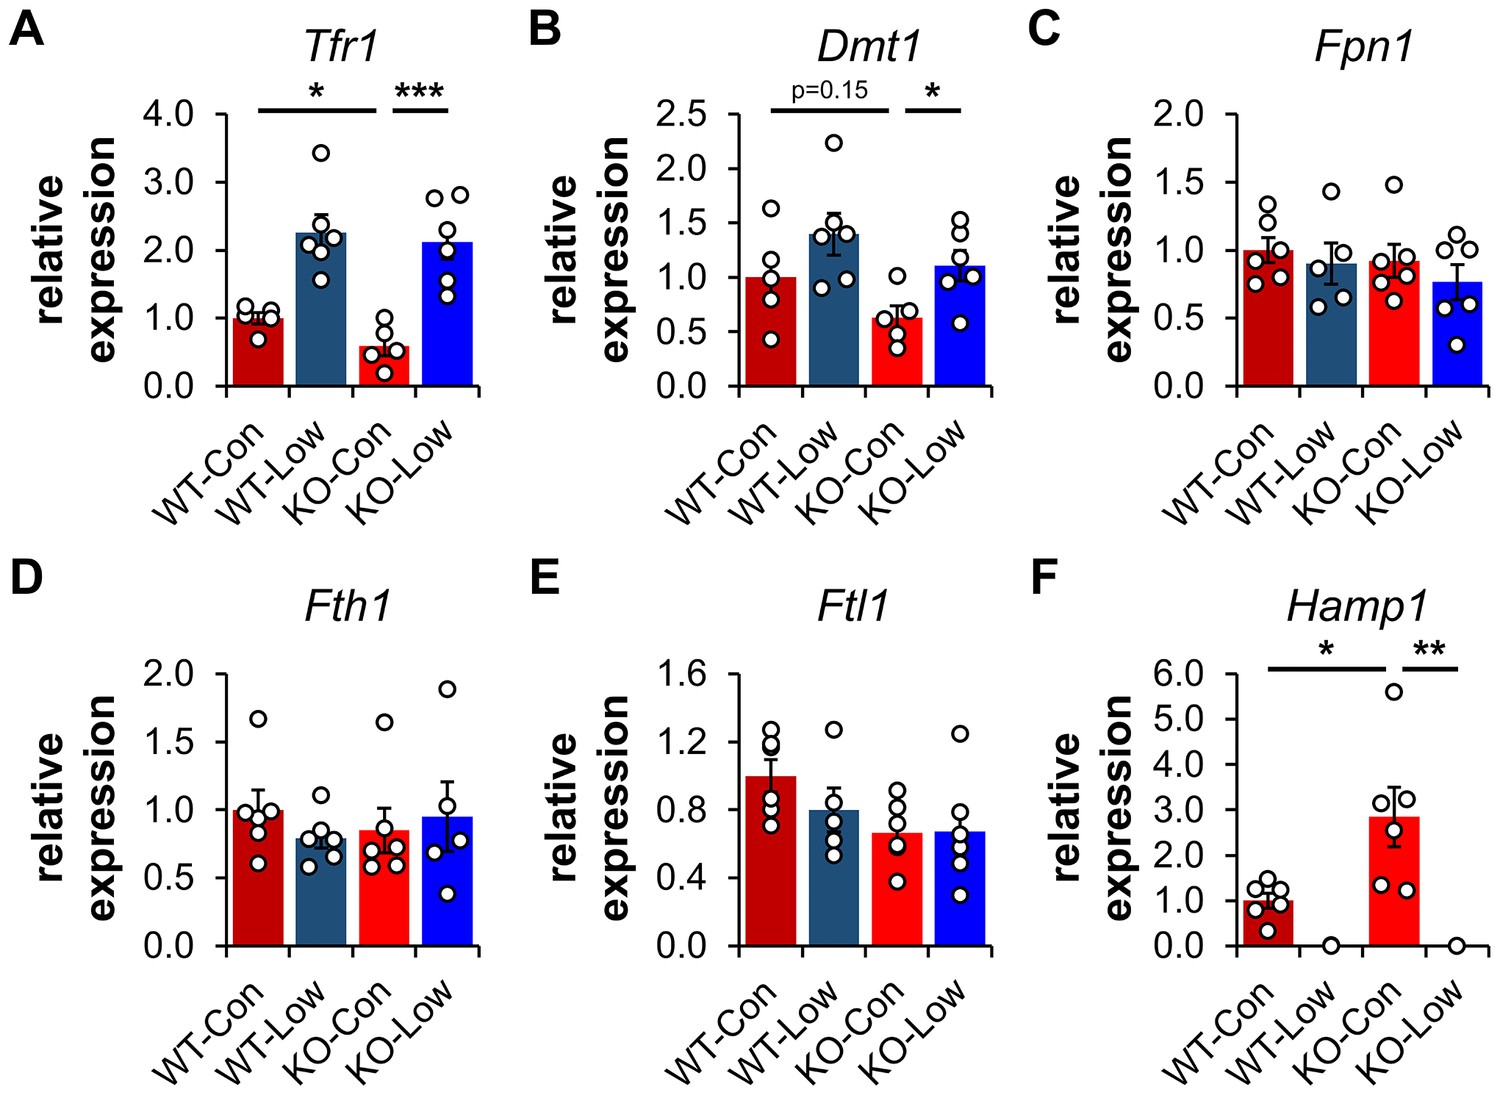
Expression profiling of IRE-containing genes by qPCR.
(A) Quantification of relative mRNA expression of Tfr1, (B) Dmt1, (C) Fpn1, (D) Fth1 (ferritin heavy chain 1), (E) Ftl1 (ferritin light chain 1), and (F) Hamp (hepcidin) in livers from PND35 WT and Ndufs4−/− (KO) mice fed a control (40 ppm) and low (8 ppm) iron AIN-93G synthetic diet from weaning. *p<0.05, **p<0.01, ***p<0.001, t test with Bonferroni correction.
Tables
Table 1
ICP-MS quantification of biologically relevant metals in WT and Ndufs4−/− tissues at PND35 fed a normal (40 ppm) and low (8 ppm) iron AIN-93G synthetic diet.
Metals were measured as µg metal relative to total dry weight of tissue. N=3–5 mice, - p<0.10, *p<0.05, **p<0.01, ***p<0.001, ****p<0.0001, ANOVA with post hoc Tukey.
| Ndufs4+/+ Mice | Ndufs4−/− Mice | p Value | |||||
|---|---|---|---|---|---|---|---|
| Metal (µg/g) | AIN-93G normal iron | AIN-93G low iron | AIN-93G normal iron | AIN-93G low iron | WT-Con versus KO-Con | KO-Con versus KO-Low | |
| Liver | Fe | 122.9±18.9 | 48.0±3.5 | 352.5±55.5 | 62.5±3.6 | ** | *** |
| Mn | 2.20±0.33 | 5.68±0.63 | 3.70±0.44 | 8.62±0.51 | **** | ||
| Zn | 47.5±5.07 | 62.0±5.8 | 60.9±5.0 | 71.2±4.0 | |||
| Cu | 9.6±0.64 | 12.7±0.9 | 13.9±1.5 | 15.6±1.2 | - | ||
| Brain | Fe | 39.3±0.78 | 40.6±2.5 | 39.6±1.8 | 37.8±1.9 | ||
| Mn | 1.46±0.04 | 1.94±0.05 | 1.71±0.09 | 1.91±0.09 | |||
| Zn | 37.7±0.53 | 48.3±1.6 | 44.1±1.8 | 49.1±3.1 | |||
| Cu | 10.3±0.52 | 11.4±0.5 | 11.8±0.4 | 12.1±0.7 | |||
| Kidney | Fe | 101.9±6.4 | 77.1±12.4 | 161.5±15.4 | 85.8±3.5 | * | ** |
| Mn | 4.54±0.44 | 5.53±0.31 | 4.48±0.20 | 6.01±0.51 | * | ||
| Zn | 55.8±1.8 | 56.6±2.6 | 58.9±4.8 | 58.4±5.7 | |||
| Cu | 15.1±0.3 | 15.3±0.9 | 17.5±0.7 | 18.0±0.9 | - | ||
| Heart | Fe | 226.8±6.9 | 182.7±9.5 | 259.2±26.9 | 230.7±24.0 | ||
| Mn | 2.51±0.09 | 3.00±0.05 | 2.59±0.19 | 3.72±0.35 | ** | ||
| Zn | 46.6±3.0 | 47.7±1.5 | 31.5±3.0 | 41.3±5.3 | * | ||
| Cu | 30.5±1.2 | 30.5±0.1 | 31.7±2.9 | 40.4±2.8 | * | ||
| Skeletal Muscle | Fe | 31.2±1.4 | 23.3±2.1 | 35.4±3.9 | 33.0±5.3 | ||
| Mn | 0.53±0.05 | 0.83±0.08 | 0.65±0.08 | 0.88±0.10 | |||
| Zn | 20.7±0.7 | 21.8±1.4 | 22.5±2.8 | 18.8±1.8 | |||
| Cu | 3.80±0.24 | 3.85±0.22 | 4.60±0.56 | 4.40±0.44 | |||
| Spleen | Fe | 710.4±59.1 | 316.9±22.3 | 860.5±265.6 | 507.1±43.7 | ||
| Mn | 0.94±0.09 | 1.28±0.08 | 0.92±0.40 | 1.45±0.23 | |||
| Zn | 110.5±7.5 | 123.1±10.4 | 109.0±38.7 | 126.0±6.8 | |||
| Cu | 5.13±0.55 | 6.43±0.43 | 3.84±1.26 | 5.29±0.57 | |||
| Duodenum | Fe | 150.1±34.2 | 40.0±8.6 | 243.0±66.3 | 51.7±6.2 | * | |
| Mn | 6.78±1.2 | 12.88±2.63 | 6.76±1.28 | 17.1±1.7 | ** | ||
| Zn | 89.2±2.2 | 84.9±12.7 | 101.4±9.6 | 114.1±9.3 | |||
| Cu | 9.4±0.3 | 8.4±1.3 | 10.8±0.9 | 11.2±0.8 | |||
Key resources table
| Reagent type (species) or resource | Designation | Source or reference | Identifiers | Additional information |
|---|---|---|---|---|
| Strain, strain background (Mus musculus) | Ndufs4tm1.1Rpa C57Bl/6NCrl | Palmiter Laboratory Kruse et al., 2008 | ||
| Other | PicoLab Mouse Diet 20 | LabDiet | Cat. 5058 | Facility Chow, Mouse Diet Studies |
| Other | AIN-93G Growth Purified Diet | LabDiet | Cat. 57W5 | Normal Iron (40 ppm), Mouse Diet Studies |
| Other | AIN-93G Growth Purified Diet | LabDiet | Cat. 5SSU | Low Iron (8 ppm), Mouse Diet Studies |
| Chemical compound, drug | Deferiprone (3-hydroxy-1,2-dimethyl-4(1H)-pyridone) | Sigma-Aldrich | Cat. 379409 | CAS 30652-11-0 |
| Chemical compound, drug | Ferric hydroxide dextran complex | Sigma-Aldrich | Cat. D8517 | CAS 9004-66-4 |
| Chemical compound, drug | Trace metal grade concentrated HNO3 | Thermo Fisher Scientific | Cat. A509P500 | CAS 7697-37-2 |
| Chemical compound, drug | Low trace metals 30% H2O2 solution | Thermo Fisher Scientific | Cat. NC1199178 | |
| Chemical compound, drug | Ultra Trace Elemental Analysis Grade H2O | Thermo Fisher Scientific | Cat. W9-500 | |
| Chemical compound, drug | Ferrozine iron reagent, hydrate, 98% pure | Thermo Fisher Scientific | Cat. AC410570010 | CAS 1266615-85-3 |
| Chemical compound, drug | Trichloroacetic acid, 99% | Thermo Fisher Scientific | Cat. AAA1115636 | CAS 76-03-9 |
| Chemical compound, drug | Thioglycolic acid | Thermo Fisher Scientific | Cat. AAB2039122 | CAS 68-11-1 |
| Chemical compound, drug | HALT Protease and Phosphatase Inhibitor Cocktail (100X) | Thermo Fisher Scientific | Cat. 78444 | |
| Other | Bovine Serum Albumin, Heat Shock Treated | Thermo Fisher Scientific | BP1600-100 | Western Blot Assays |
| Chemical compound, drug | RIPA Lysis Buffer | Thermo Fisher Scientific | Cat. 89901 | |
| Chemical compound, drug | RestorePlus Stripping Buffer | Thermo Fisher Scientific | Cat. 46430 | |
| Commercial assay or kit | TBARS Assay Kit | Cayman Chemical | Cat. 10009055 | |
| Commercial assay or kit | SuperSignal West Pico PLUS Chemiluminescent Substrate | Thermo Fisher Scientific | Cat. 34578 | |
| Commercial assay or kit | SuperSignal West Femto Maximum Sensitivity Substrate | Thermo Fisher Scientific | Cat. 34095 | |
| Commercial assay or kit | Pierce BCA Protein Assay Kit | Thermo Fisher Scientific | Cat. 23225 | |
| Commercial assay or kit | PureLink RNA Mini Kit | Thermo Fisher Scientific | Cat. 12183025 | |
| Commercial assay or kit | iTaq Universal SYBR Green One-Step Kit | Bio-Rad | Cat. 1725151 | |
| Commercial assay or kit | Phire Tissue Direct PCR Master Mix | Thermo Fisher Scientific | Cat. F170L | Genotyping |
| Commercial assay or kit | No-Stain Protein Labeling Reagent | Thermo Fisher Scientific | Cat. A44717 | |
| Antibody | Anti-FTH1 (rabbit polyclonal) | Cell Signaling Technology | Cat. cs-3998 | 1:5000 |
| Antibody | Anti-TFR1 (rabbit monoclonal) | Abcam | Cat. ab214039 | 1:3000 |
| Antibody | Anti-FPN1 (rabbit polyclonal) | Thermo Fisher Scientific | Cat. PA5-77470 | 1:3000 |
| Antibody | Anti-DMT1 (mouse monoclonal) | Santa Cruz Biotechnology | Cat. sc-166884 | 1:3000 |
| Antibody | Anti-IRP1 (rabbit monoclonal) | Cell Signaling Technology | Cat. cs-20272 | 1:1000 |
| Antibody | Anti-IRP2 (rabbit monoclonal) | Cell Signaling Technology | Cat. cs-37135 | 1:1000 in 1% BSA |
| Antibody | Anti-GFAP (rabbit monoclonal) | Cell Signaling Technology | Cat. cs-12389 | 1:5000 |
| Antibody | Anti-Actin HRP conjugate (rabbit monoclonal) | Cell Signaling Technology | Cat. cs-5125 | 1:5000 |
| Antibody | Anti-rabbit IgG (H+L) secondary antibody, HRP (donkey polyclonal) | Thermo Fisher Scientific | Cat. 31458 | 1:20,000 |
| Other | m-IgGκ binding protein HRP conjugate | Santa Cruz Biotechnology | Cat. sc-516102 | 1:2000, Western Blot Assays |
| Sequence-based reagent, primer | Forward: TCAAGCCAGATCAGCATTCTC Reverse: AGCCAGTTTCATCTCCACATG | Integrated DNA Technologies | Tfr1 | |
| Sequence-based reagent, primer | Forward: TCCTCATCACCATCGCAGACACTT Reverse: TCCAAACGTGAGGGCCATGATAGT | Integrated DNA Technologies | Dmt1A/B+IRE Dmt1A/B-IRE | |
| Sequence-based reagent, primer | Forward: TGGATGGGTCCTTACTGTCTGCTAC Reverse: TGCTAATCTGCTCCTGTTTTCTCC | Integrated DNA Technologies | Fpn1 | |
| Sequence-based reagent, primer | Forward: CTCATGAGGAGAGGGAGCAT Reverse: GTGCACACTCCATTGCATTC | Integrated DNA Technologies | Fth1 | |
| Sequence-based reagent, primer | Forward: GTCCCGTGGATCTGTGTCT Reverse: AGGAGCTAACCGCGAAGAGA | Integrated DNA Technologies | Ftl1 | |
| Sequence-based reagent, primer | Forward: AAGCAGGGCAGACATTGCGAT Reverse: CAGGATGTGGCTCTAGGCTATGT | Integrated DNA Technologies | Hamp | |
| Sequence-based reagent, primer | Forward: GTGTGAACGGATTTGGCCGTATTGGGCG Reverse: TCGCTCCTGGAAGATGGTGATGGGC | Integrated DNA Technologies | Gapdh | |
| Sequence-based reagent, primer | Forward: GCTGAGAGGGAAATCGTGCGTG Reverse: CCAGGGAGGAAGAGGATGCGG | Integrated DNA Technologies | Actb | |
| Other | Blood collection tube | Thermo Fisher Scientific | Cat. 02-669-33 | Lavendar Cap, CBC Assay |
| Other | Metal-Free Centrifuge Tube, 15 mL | VWR | Cat. 89049-172 | ICP-MS Assay |
Additional files
Download links
A two-part list of links to download the article, or parts of the article, in various formats.
Downloads (link to download the article as PDF)
Open citations (links to open the citations from this article in various online reference manager services)
Cite this article (links to download the citations from this article in formats compatible with various reference manager tools)
Iron status influences mitochondrial disease progression in Complex I-deficient mice
eLife 12:e75825.
https://doi.org/10.7554/eLife.75825


