Adaptation of Drosophila larva foraging in response to changes in food resources
- Computation in Neural Circuits Group, Max Planck Institute for Brain Research, Germany
- School of Life Sciences, Technical University of Munich, Germany
- Department of Zoology, University of Cambridge, United Kingdom
- Brighton and Sussex Medical School,, University of Sussex, United Kingdom
Figures
Figure 1 with 1 supplement
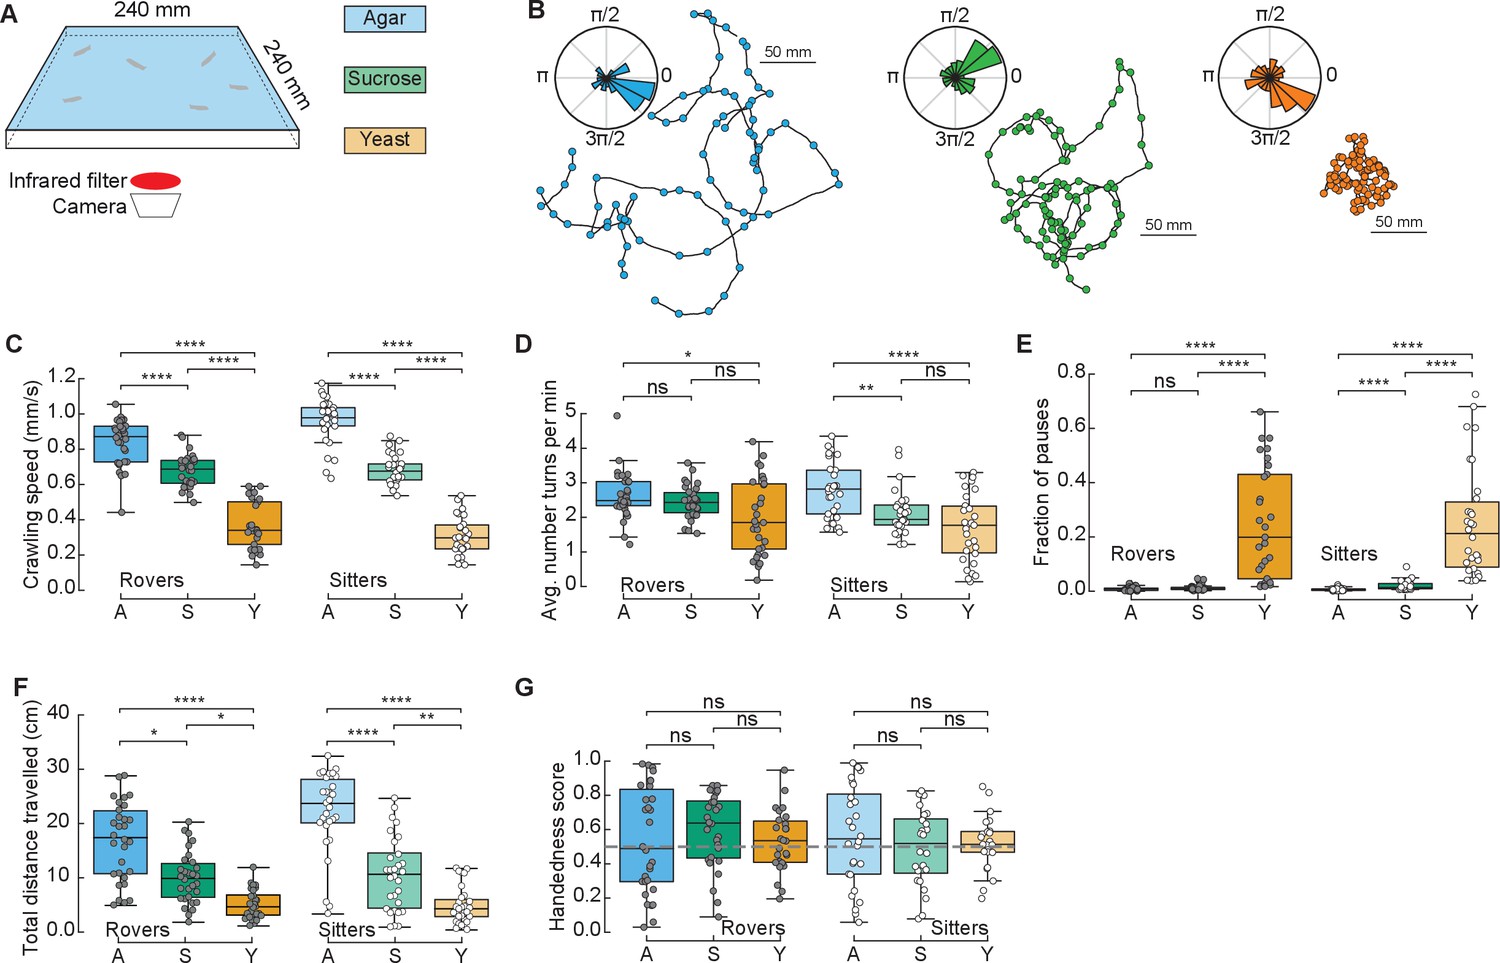
Drosophila larva exploratory behavior in homogeneous substrates.
(A) Experimental setup: 10 larvae of the same phenotype (rover or sitter) were placed on the top of an agar-coated arena and recorded for 50 min, experiments were repeated three times with independent samples. Three types of substrates were used: agar-only (blue), sucrose (green), and yeast (orange). (B) Sample trajectories of rover larvae in the different substrates (top: agar, bottom left: sucrose, bottom right: yeast) with turning points identified by the RDP algorithm. Corresponding turning angle distributions are shown as an inset. (C) Average crawling speeds of rovers (N = 30, 30, 29) and sitters (N = 29, 30, 30) in the different substrates: agar (A, blue), sucrose (S, green), and yeast (Y, orange). The speed was calculated during bouts of crawls. Horizontal line indicates median, the box is drawn between the 25th and 75th percentiles, whiskers extend above and below the box to the most extreme data points within 1.5 times the interquartile range, points (gray for rovers, white for sitters) indicate all data points. (D) Average number of turns per minute registered in each trajectory. (E) Fraction of time in which larvae did not move (pauses). (F) Total distance traveled in 50 min. (G) Handedness score. The horizontal dashed line corresponds to a score of 0.5, that is, an equal number of counter-clockwise (CCW) and clockwise (CW) turns. Mann–Whitney–Wilcoxon test with Bonferroni correction was performed since the data were not normally distributed. ns: 0.05 < p < 1, *0.01 < p < 0.05, **0.001 < p < 0.01, ****p < 0.0001. The number of larvae tested is detailed in Table 1. Statistical power and Cohen’s size effect of non-significant comparisons are included in Table 4.
Figure 1—figure supplement 1
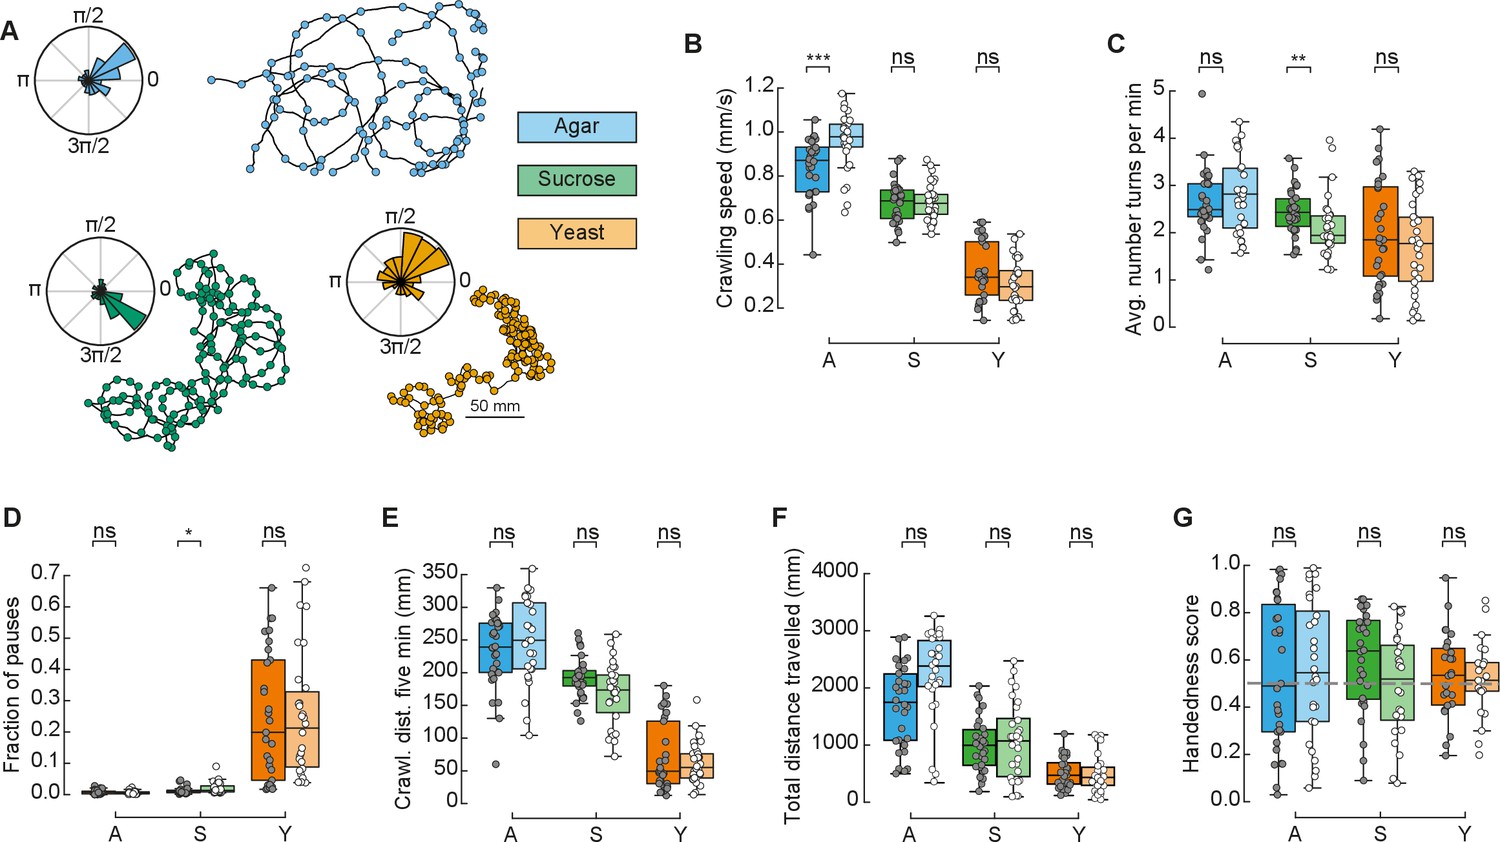
Comparison between rover and sitter behavior in different substrates.
(A) Sample trajectories of sitter larvae in different substrates with the respective turning angle distributions in the inset. Top (blue): agar, bottom left (green): sucrose, bottom right (orange): yeast. (B) Crawling speeds in the agar (A, blue), sucrose (S, green), and yeast substrate (Y, orange). Darker colors are used to label rover’s data, lighter colors label sitter’s data. Horizontal line indicates median, the box is drawn between the 25th and 75th percentiles, whiskers extend above and below the box to the most extreme data points within a distance equal to 1.5 times the interquartile range and points indicate all data points. (C) Average number of turns executed by the larvae per minute. (D) Fraction of time in which larvae did not move (pauses). (E) Crawled distance in the first 5 min of the recording. (F) Crawled distance for the entire recording (50 min). (G) Handedness score. Mann–Whitney–Wilcoxon paired test (samples not normally distributed). The number of larvae tested is detailed in Table 1. ns: 0.05 < p < 1, *0.01 < p < 0.05, **0.001 < p < 0.01, ***0.0001 < p < 0.001.
Figure 2 with 1 supplement
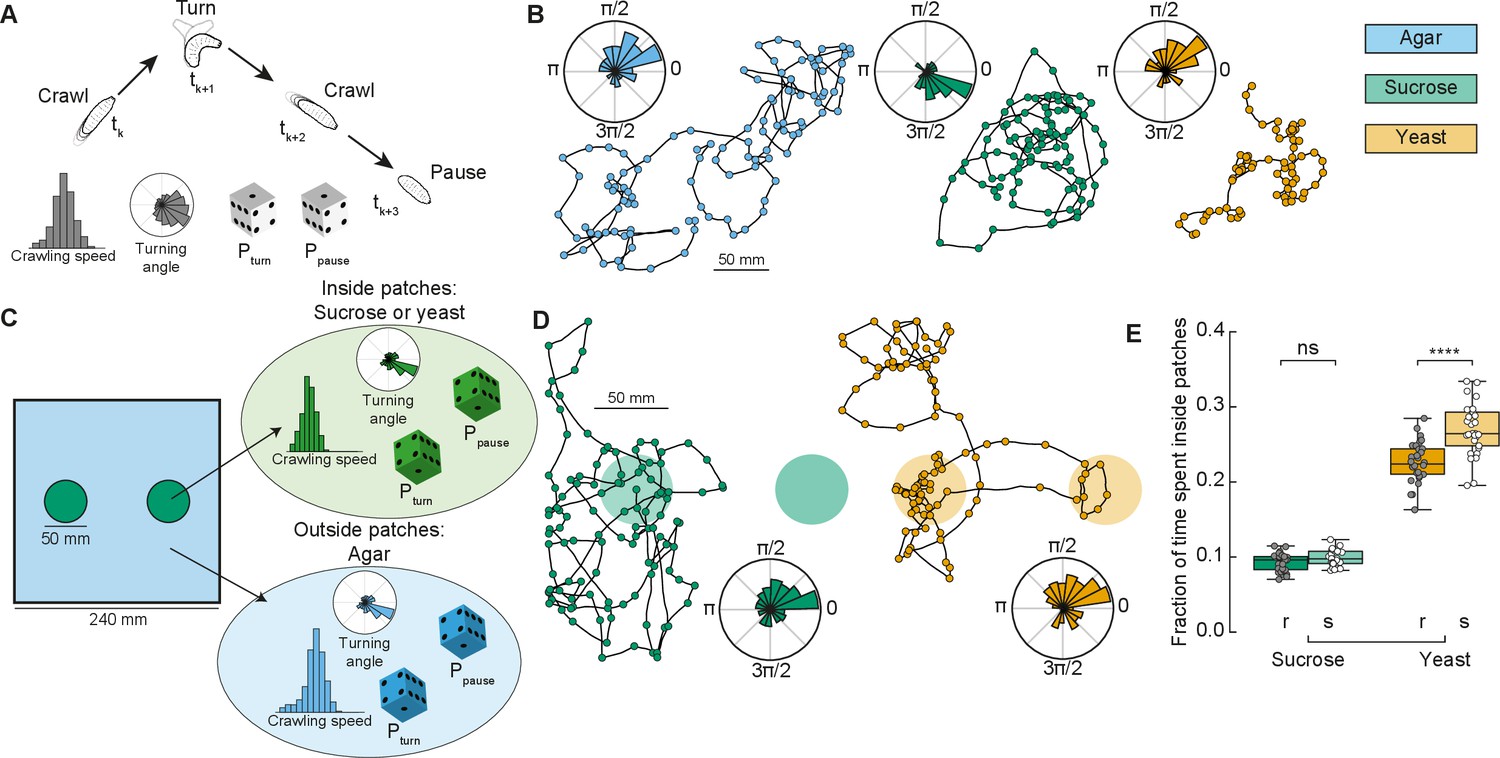
Model of larva crawling in different substrates.
(A) Simulated larva crawls at time steps tk and tk+2, turns at tk+1, and makes a pause at tk+3. Crawling speed and turning angle are sampled from normal and von Mises probability distributions, respectively. At each time step, there is a constant probability to turn Pturn or to pause Ppause. (B) Sample model trajectories and turning angle distributions of sitter larvae simulated in different homogeneous substrates: agar (left), sucrose (middle), and yeast (right). (C) Simulations with patchy environments: food (sucrose or yeast) is distributed inside two circular regions, with agar in the remaining substrate. Crawling speeds, turning and pause probabilities are sampled from different distributions when the simulated larva is inside (green) or outside (blue) the patch. (D) Sample model trajectories and turning angle distributions of sitter larvae in simulated patchy substrates: sucrose (left) and yeast (right) patches. (E) Average fraction of time each simulated larva (rover (r), sitter (s), N = 30) spent inside patches (sucrose and yeast) in the simulations. Horizontal line indicates median, the box is drawn between the 25th and 75th percentiles, whiskers extend above and below the box to the most extreme data points that are within a distance to the box equal to 1.5 times the interquartile range and points indicate all data points. Mann–Whitney–Wilcoxon paired test two-sided. ns: 0.05 < p < 1, ****p < 0.0001.
Figure 2—figure supplement 1
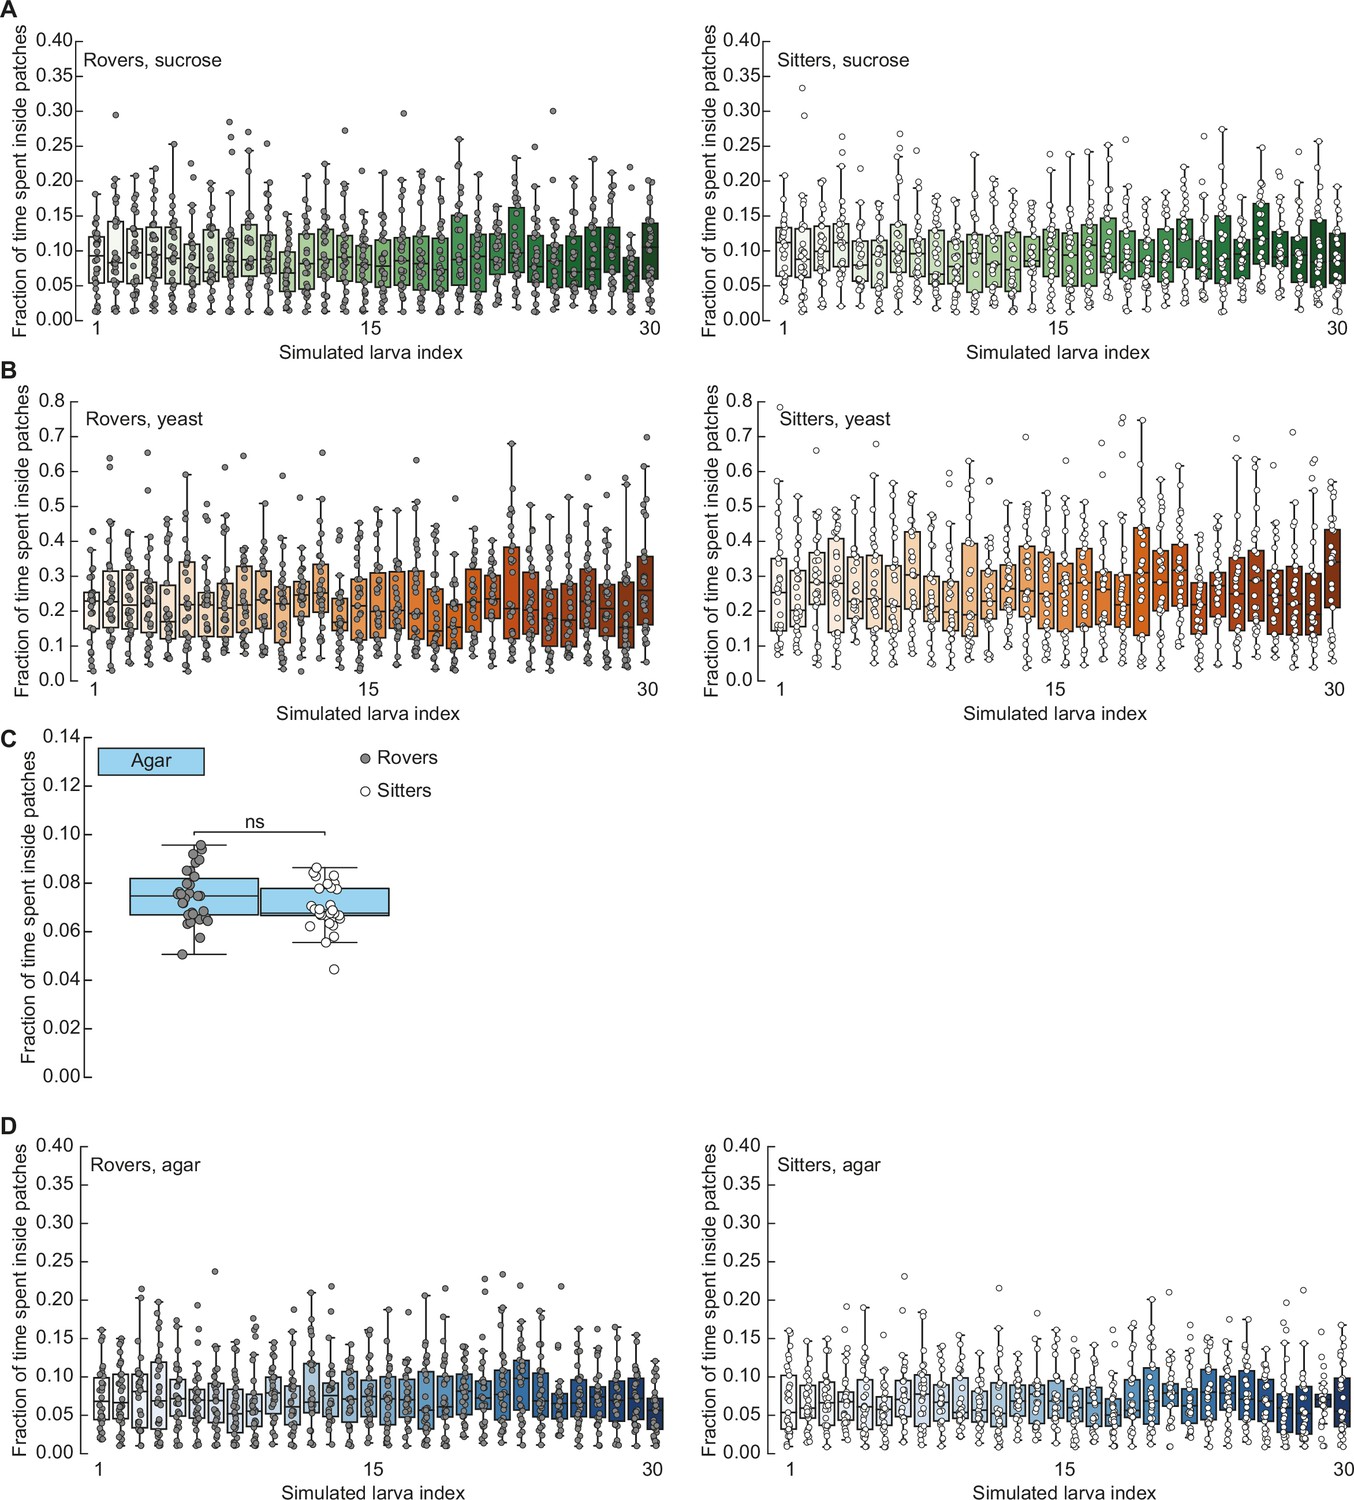
Fraction of time spent inside patches.
(A) Each simulated rover (left) and sitter (right) larva (bars with different color shades, N = 30) has a fixed turning angle distribution with parameters corresponding to one rover/sitter from the agar experiments. N = 30 simulation runs of each larva were performed in the same homogenous environment with sucrose. Horizontal line indicates median, the box is drawn between the 25th and 75th percentiles, whiskers extend above and below the box to the most extreme data points that are within a distance to the box equal to 1.5 times the interquartile range and points indicate all data points. (B) Same as (A) but for yeast patches. (C) Average fraction of time spent inside patches of rovers and sitters in agar patches, where the same parameters are used for inside and outside the patches. (D) Same as (A) for agar patches. Mann–Whitney–Wilcoxon paired test (samples not normally distributed). ns: 0.05 < p < 1, *0.01 < p < 0.05, **0.001 < p < 0.01, ***0.0001 < p < 0.001.
Figure 3 with 2 supplements
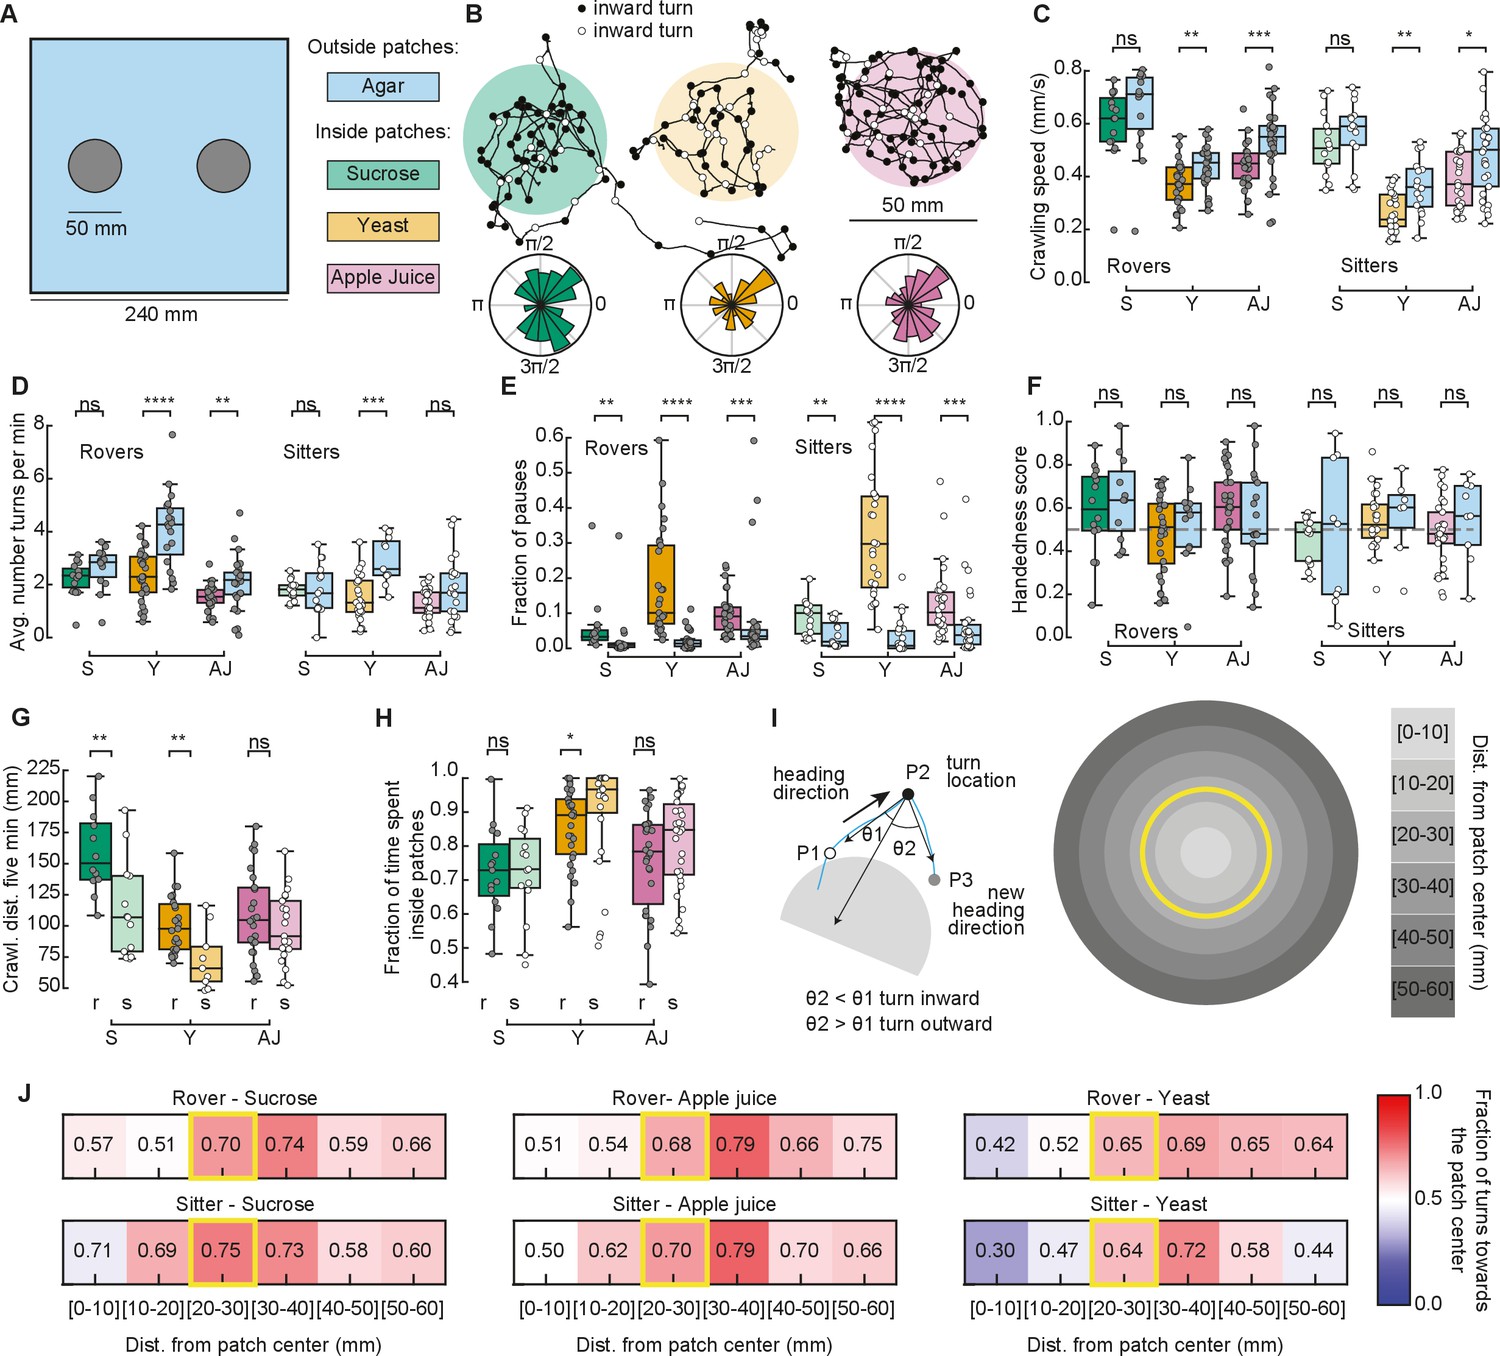
Larval exploratory behavior in patchy substrates.
(A) Experimental setup: Five larvae of the same phenotype were placed on top of each food patch (two patches, total: 10 larvae per experiment). Three types of food patches were tested: sucrose (green), yeast (orange), and apple juice solution (magenta). Agar was uniformly spread in the arena outside the food patches. (B) Sample trajectories of sitter larvae in the three patch substrates with inward (outward) turns marked in black (white) circles. Distribution of turning directions is shown on the bottom of each trajectory. (C) Larval crawling speeds of rovers and sitters measured inside (colored bars) and outside (blue bars) food patches: sucrose (S, green), yeast (Y, orange), and apple juice (AJ, magenta). Horizontal line indicates median, the box is drawn between the 25th and 75th percentiles, whiskers extend above and below the box to the most extreme data points that are within a distance to the box equal to 1.5 times the interquartile range and points indicate all data points. (D) Average number of turns executed per minute. (E) Fraction of time in which larvae did not move (pauses). (F) Handedness score. (G) Total distance crawled by rover (r; darker colors) and sitter (s; lighter colors) larvae in the first 5 min of the recording. (H) Fraction of time spent inside patches of rovers (r) and sitters (s). (I) Left: Identification of turning angle as inwards (, black) or outwards (, white). Right: Circular regions with fixed distances relative to the patch center. The yellow line represents the patch border. (J) Relative fraction of inward turns calculated as a function of the distance from the patch center. The distance bin that includes the patch radius is highlighted in yellow. Left: Sucrose, middle: apple juice, right: yeast patches. Top: Rovers, bottom: sitters. Mann–Whitney–Wilcoxon test two-sided was performed since the data are not normally distributed. ns: 0.05 < p < 1, *0.01 < p < 0.05, **0.001 < p < 0.01, ***0.0001 < p < 0.001, ****p < 0.0001. The total number of larvae tested is detailed in Table 1. Statistical power and Cohen’s size effect of non-significant comparisons are included in Table 4.
Figure 3—figure supplement 1
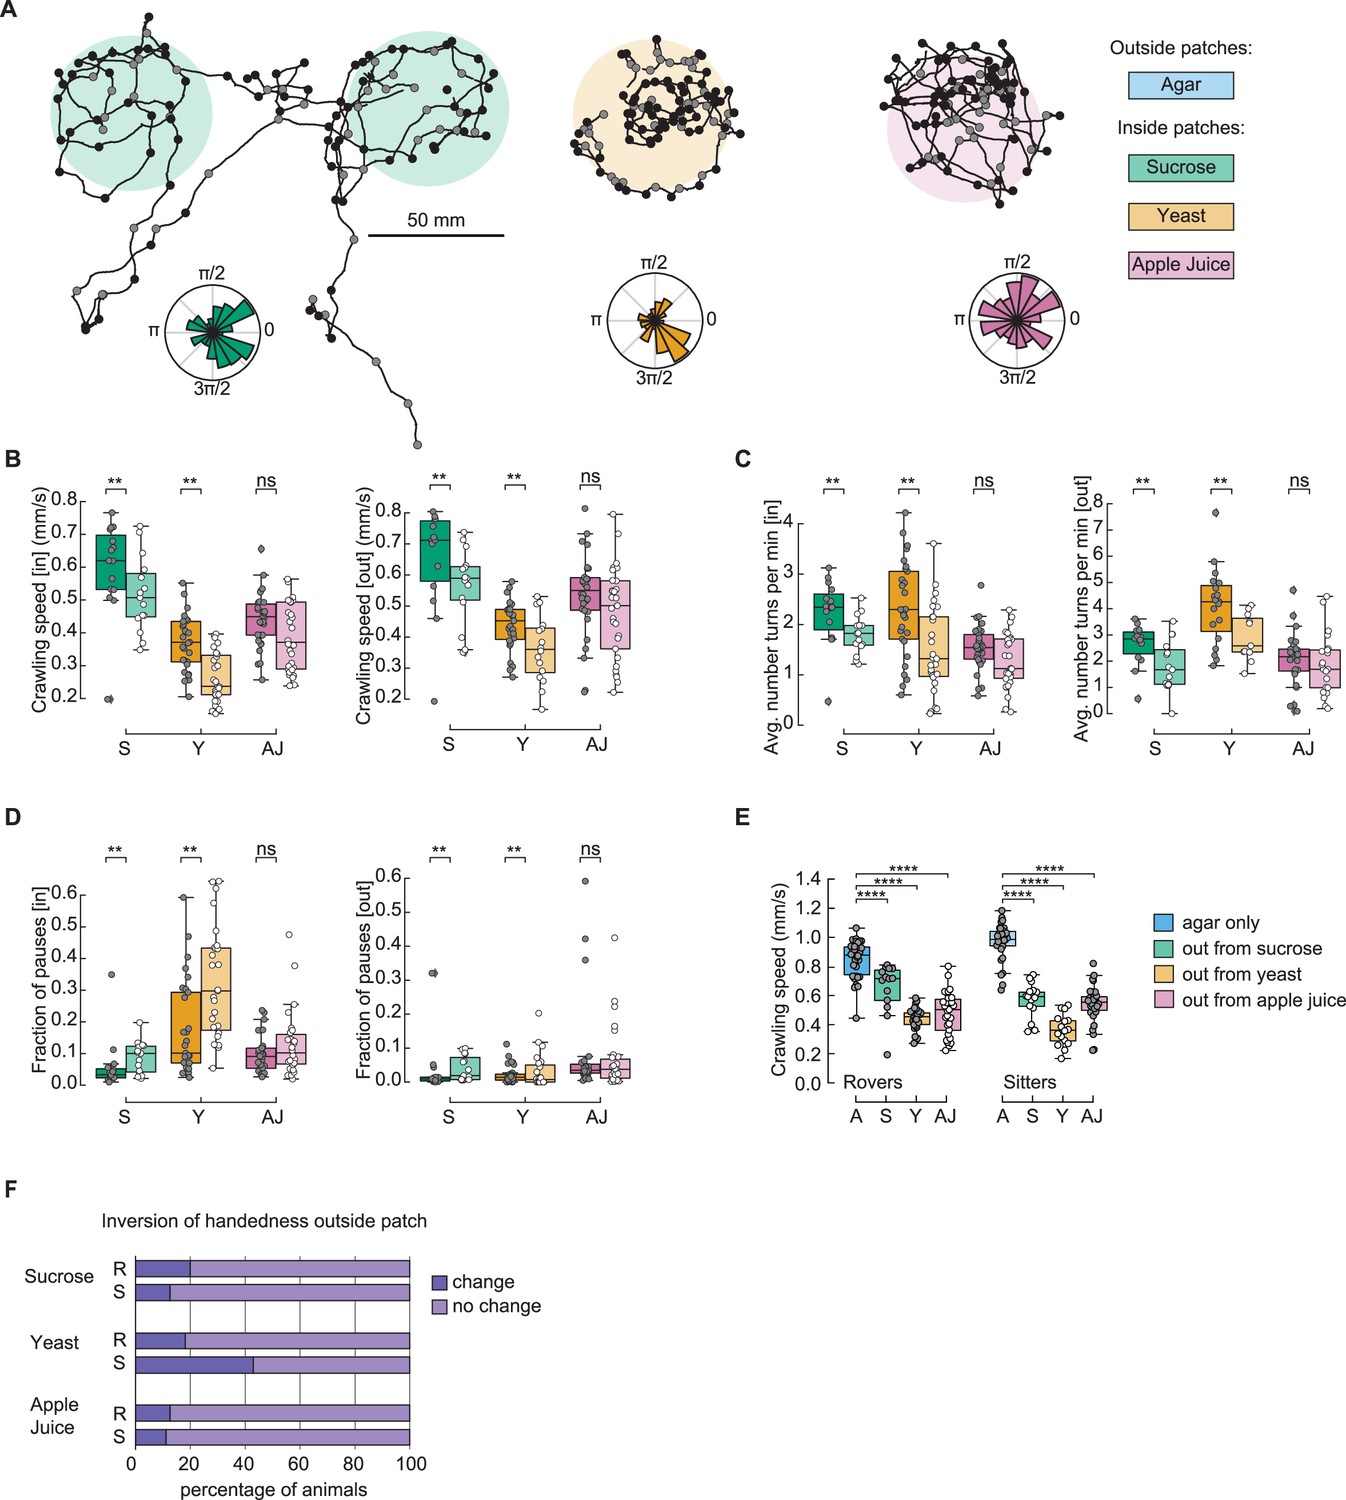
Comparison between rover and sitter behavior in two patch substrates.
(A) Sample trajectories of rover larvae in patchy substrates where certain individuals visited both the two patches (sucrose, green), while others remained in the same patch for the entire duration of the experiment (yeast, orange and apple juice, magenta). Inward (outward) turns are marked in black (gray) circles. The distribution of turning directions is shown on the bottom of each trajectory. (B) Left: Crawling speed inside patches: sucrose (S, green), yeast (Y, orange), and apple juice (AJ, magenta). Data from rover (sitter) larvae shown in darker (lighter) colors. Right: Crawling speed outside patches. Horizontal line indicates median, the box is drawn between the 25th and 75th percentiles, whiskers extend above and below the box to the most extreme data points that are within a distance to the box equal to 1.5 times the interquartile range and points indicate all data points. (C) Average number of turns per minute inside (left) and outside (right) patches. (D) Fraction of pauses inside (left) and outside (right) patches. (E) Crawling speed outside patches compared to agar-only. (F) Percentage of rover (R), sitter (S) larvae that switched handedness from left to right (or right to left) once they crossed the border of the patches. Mann–Whitney–Wilcoxon paired test (samples not normally distributed). ns: 0.05 < p < 1, **0.001 < p < 0.01, , ****p < 0.0001. The number of larvae tested is detailed in Table 1.
Figure 3—figure supplement 2
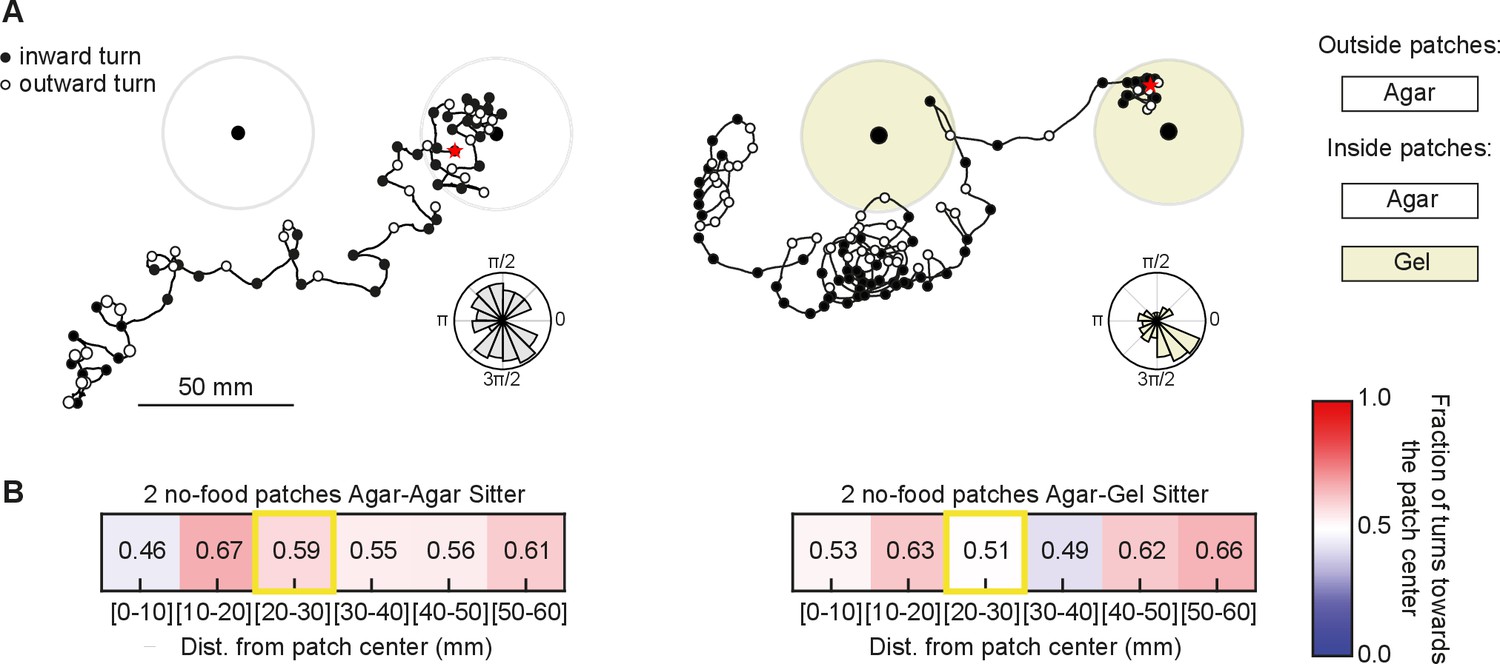
Larval exploratory behavior in no-food patchy substrates.
(A) Sample trajectories of sitter larvae in agar–agar patches or agar–gel patches. Note that the larvae do not change their behavior at the patch boundary. Distribution of turning directions is shown on the bottom of each trajectory. (B) Relative fraction of inward turns calculated as a function of the distance from the patch center. The distance bin that includes the patch radius is highlighted in yellow.
Figure 4 with 1 supplement

Exploratory behavior of anosmic larvae in patchy environments.
(A) Sample trajectories of anosmic larvae in the three patch substrates with inward (outward) turns marked in red (gray) circles. Distribution of turning directions is shown on the bottom of each trajectory. (B) Crawling speeds of anosmic larvae measured inside (colorful bars) and outside (blue bars) food patches: sucrose (S, green), yeast (Y, orange), and apple juice (AJ, magenta). Horizontal line indicates median, the box is drawn between the 25th and 75th percentiles, whiskers extend above and below the box to the most extreme data points that are within a distance to the box equal to 1.5 times the interquartile range and points indicate all data points. (C) Average number of turns per minute inside and outside patches. (D) Fraction of pauses inside and outside patches. (E) Handedness score of anosmic larvae inside and outside patches. (F) Fraction of time spent inside patches for different types of food. (G) Relative fraction of inward turns calculated as a function of the distance from the patch center, top: sucrose, middle: yeast, bottom: apple juice. The distance bin that includes the patch radius is highlighted in yellow. Mann–Whitney–Wilcoxon test two-sided was performed since the data are not normally distributed. ns: 0.05 < p < 1, **0.001 < p < 0.01, ***0.0001 < p < 0.001, ****p < 0.00001. The number of larvae tested is detailed in Table 1. Statistical power and Cohen’s size effect of non-significant comparisons are included in Table 4.
Figure 4—figure supplement 1
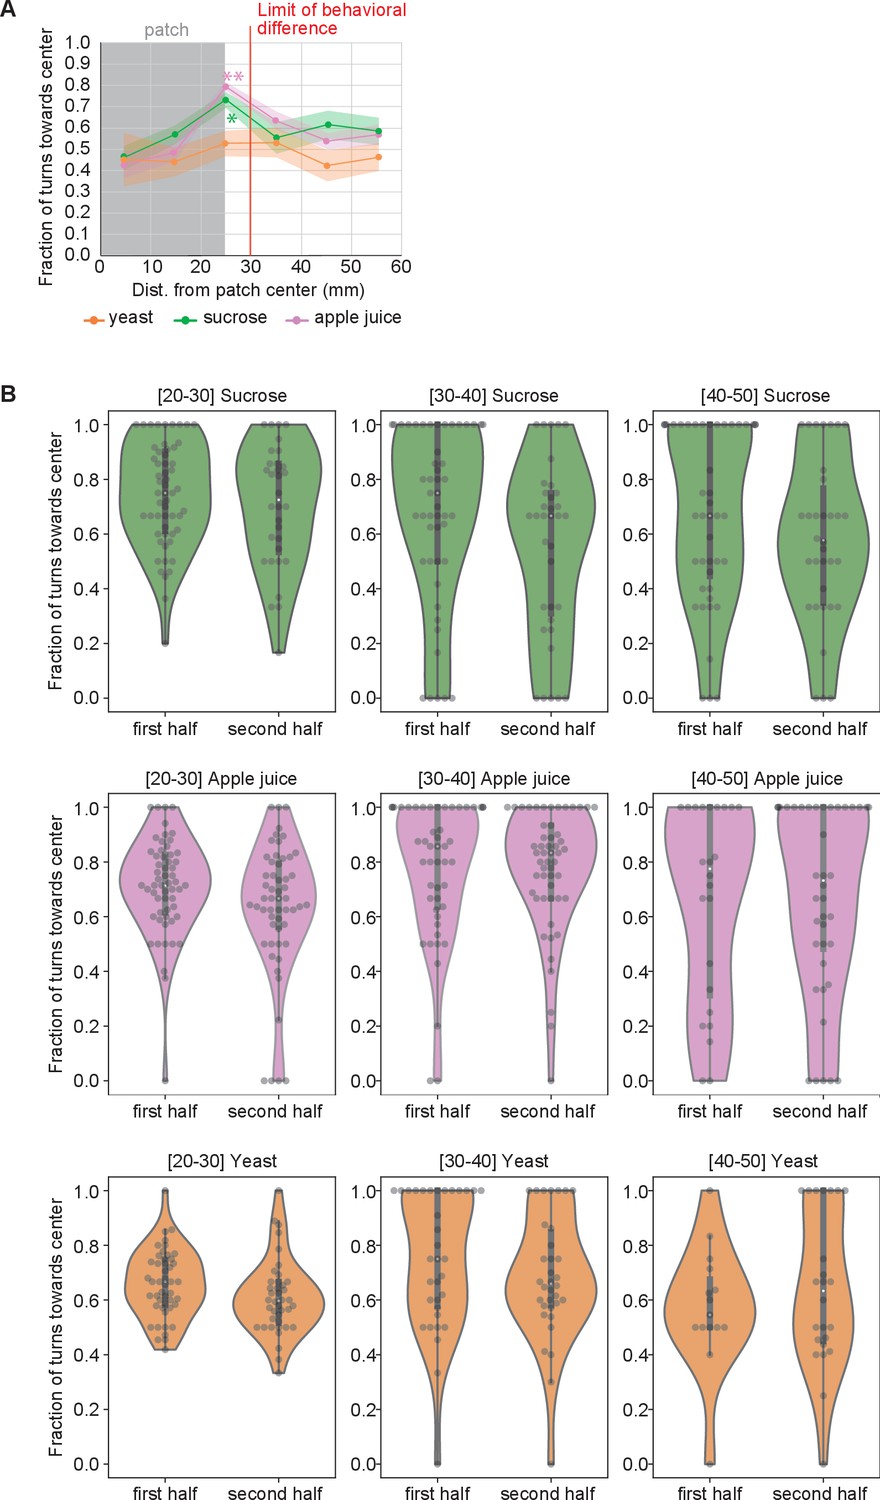
Analysis of diffusion of nutrients on behavior.
(A) Average turns toward the center (± standard error of the mean, SEM) as a function of the distance away from the patch center. A two-way analysis of variance (ANOVA) for repeated measures was done. A significant effect of food (F(2, 76) = 5.168; p = 0.008) and distance (F(4.439, 282.3) = 5.741; p = 0.0001) was found, but non-significant interaction effect (p = 0.5). Tukey’s multiple comparisons test was performed. *p = 0.02; **p = 0.001. (B) Comparison of the fraction of turns toward center in the first half of the experiment vs. the second half. Each dot represents the inward turn ratio for either a rover or a sitter larva, at distance from patch center in the 20–30, 30–40, or 40–50 mm interval, respectively. A Mann–Whitney U-test on each distribution pair did not detect significant differences (p > 0.05), except for the 20–30 yeast condition (p = 0.042).
Figure 5 with 2 supplements
Interplay between food quality and patches distribution.
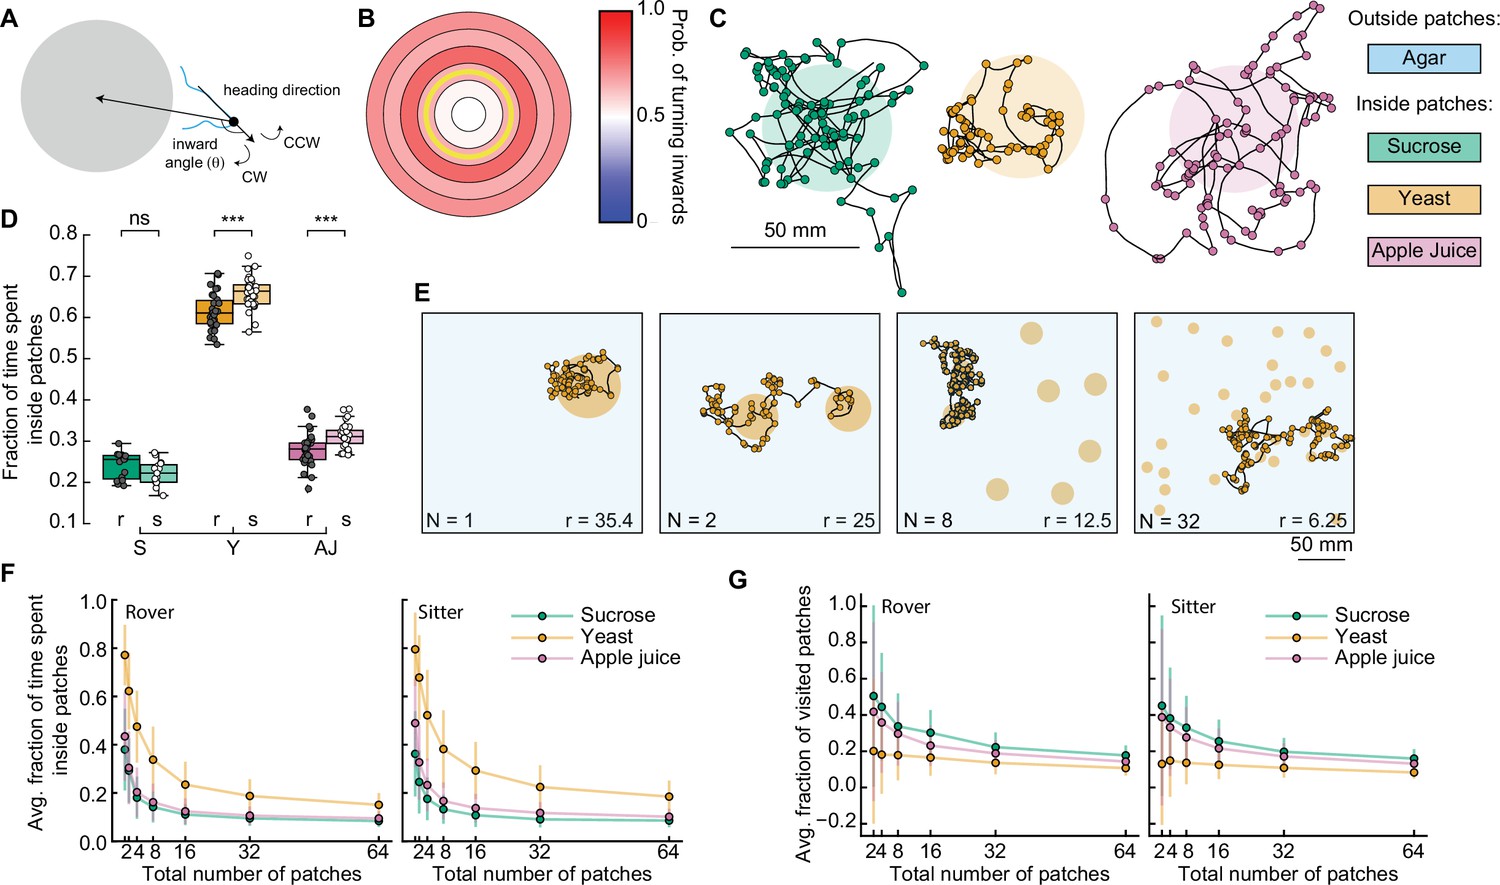
(A) Schematic showing inward turn (clockwise, CW) being selected by the simulated larva. By selecting inward turns, the trajectory approaches the patch center. (B) Spatial-dependent probability of turning toward the patch center. Each region is a concentric circle with a fixed probability of drawing inward turns (see Figure 3I, right). The yellow line shows the patch border. (C) Sample simulated trajectories for a sitter larva with biased inward turns: sucrose patch (green), yeast patch (orange), and apple juice patch (magenta). (D) Fraction of time spent inside patches of rovers (r; darker colors) and sitters (s; lighter colors) in the different substrates: sucrose (S, green), yeast (Y, orange), and apple juice (AJ, magenta). Each point is 30 simulation runs of one larva (total: 30 larvae simulated per substrate). Horizontal line indicates median, the box is drawn between the 25th and 75th percentiles, whiskers extend above and below the box to the most extreme data points that are within a distance to the box equal to 1.5 times the interquartile range and points indicate all data points. (E) Sample trajectories of sitter larvae in environments with varying number of randomly located patches, with a fixed total area of yeast substrate being distributed (Np = 1, 2, 8, 32 from left to right). (F) Average fraction of time spent inside patches of distinct substrates (S: sucrose, green; Y: yeast, orange, and A: apple juice, magenta) for rovers (left) and sitters (right) as a function of the number of patches. Each point is the average of 30 larvae (30 simulation runs each). Bars show the standard deviation. (G) Same as (F) but for the average fraction of visited patches. Mann–Whitney–Wilcoxon paired test was performed since the data are not normally distributed. ns: 0.05 < p < 1, ***0.0001 < p < 0.001.
Figure 5—figure supplement 1
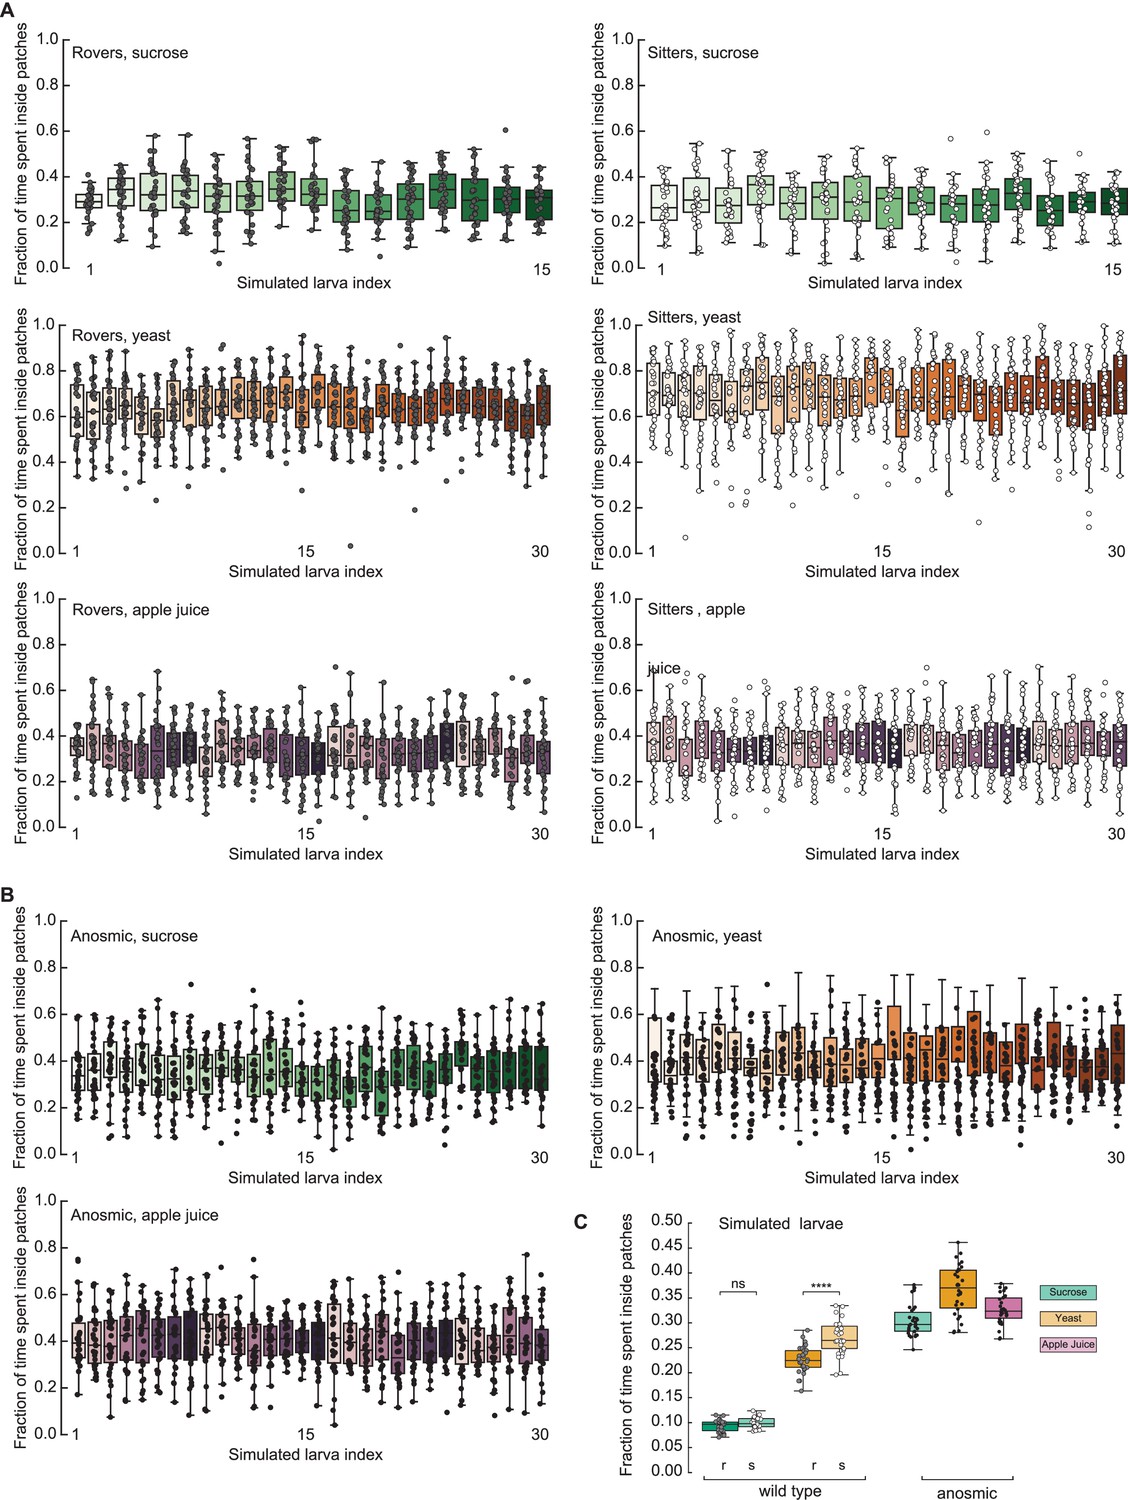
Fraction of time spent inside patches with the model that includes turn bias.
(A) Each rover/sitter larva (bars, N = 15 for sucrose, N = 30 for yeast and apple juice) has a fixed turning angle distribution with parameters corresponding to one rover/sitter from the agar experiments. Simulation runs were performed in the same environment with sucrose (green), yeast (orange), and apple juice (purple) patches. (B) Each anosmic larva (bars, N = 30 for sucrose, yeast and apple juice) has a fixed turning angle distribution with parameters corresponding to one anosmic larva from the agar experiments. N = 30 simulation runs were performed in the same environment with sucrose (green), yeast (orange), and apple juice (purple) patches. Horizontal line indicates median, the box is drawn between the 25th and 75th percentiles, whiskers extend above and below the box to the most extreme data points that are within a distance to the box equal to 1.5 times the interquartile range and points indicate all data points. (C) Average fraction of time spent inside patches comparing rovers (r) an sitters (s) with anosmic larvae in sucrose (S, green), yeast (Y, orange), and apple juice (AJ, magenta) patches. Mann–Whitney–Wilcoxon test two-sided. ns: 0.05 < p < 1, , **** p < 0.0001.
Figure 5—figure supplement 2
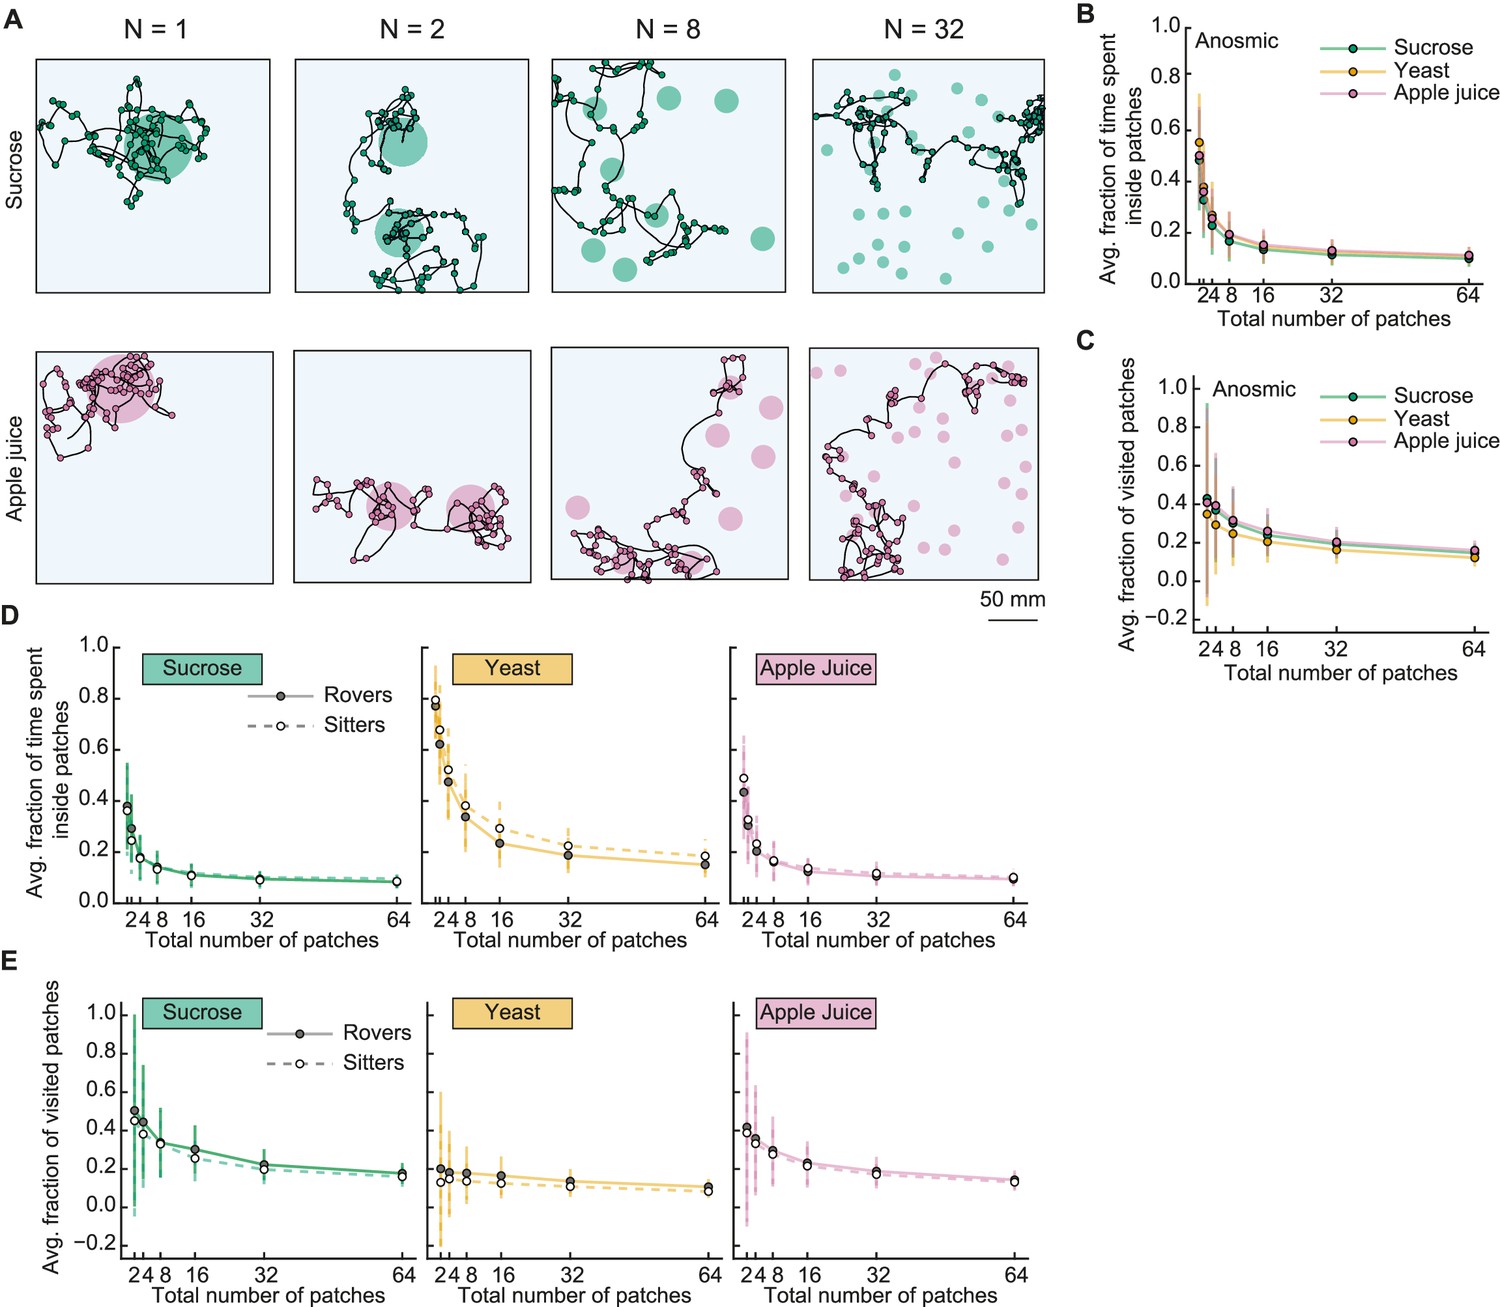
Simulations with varying number of patches.
(A) Sample trajectories of sitter larvae in sucrose (top) and apple juice (bottom) patchy arenas with varying number of patches (Np = 1, 2, 8, 32 from left to right). (B) Average fraction of time spent inside patches of distinct substrates (S: sucrose, green; Y: yeast, orange, and A: apple juice, magenta) for anosmic larvae as a function of the number of patches. Each point is the average of 30 larvae (30 simulation runs each). Bars show the standard deviation. (C) Same as (B) but for the average fraction of visited patches. (D) Average fraction of time spent inside patches of distinct substrates (from left to right: sucrose, yeast, apple juice) for rovers (solid line, filled circles) and sitters (dashed line, open circles) as a function of the number of patches. Each point is the average of 30 larvae (30 simulation runs each). Bars show the standard deviation. (E) Same as (D) but for the average fraction of visited patches.
Figure 6
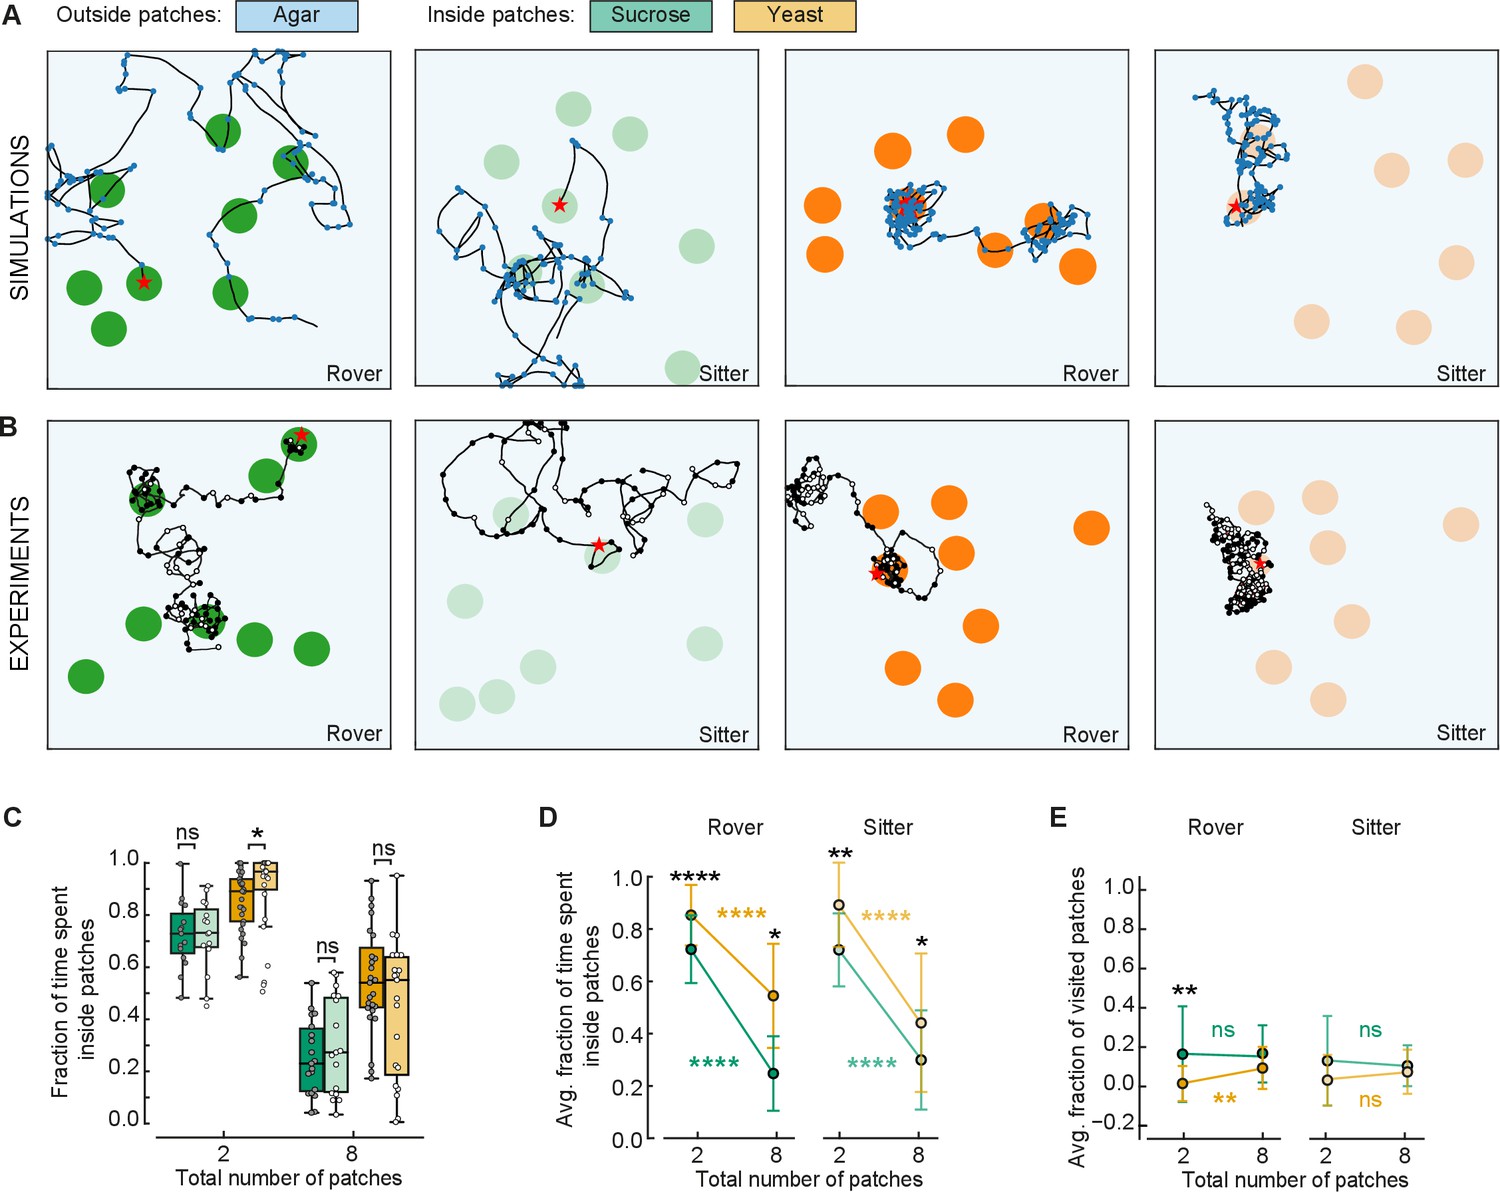
Behavioral response to changes in food quality and fragmentation.
(A) Sample simulated trajectories for sitter and rover larvae exploring in eight patches: sucrose patch (green) and yeast patch (orange). (B) Sample experimental trajectories of rover and sitter larvae in an arena with eight patches of food. Three random distributions (exp1; exp2; exp3) were used for each type of food: sucrose patches (green) and yeast patches (orange). (C) Fraction of time spent inside patches of rovers (darker colors) and sitters (lighter colors) on sucrose (green) and yeast (orange). Horizontal line indicates median, the box is drawn between the 25th and 75th percentiles, whiskers extend above and below the box to the most extreme data points that are within a distance to the box equal to 1.5 times the interquartile range and points indicate all data points. (D) Average fraction of time spent inside patches of distinct substrates (sucrose, green; yeast, orange) for rovers and sitters as a function of the number of patches. Data represent mean ± standard deviation. (E) Same as (D) but for the average fraction of visited patches. analysis of variance (ANOVA) test was performed for (C) and (D) (normally distributed) and Mann–Whitney–Wilcoxon paired for (E) (non-normally distributed). ns: 0.05 < p < 1, *0.01 < p < 0.05, **0.001 < p < 0.01, ****0.00001 < p < 0.0001. The number of larvae tested is detailed in Table 1. Statistical power and Cohen’s size effect of non-significant comparisons are included in Table 4.
Videos
Video 1
Video of a larva pausing.
A sitter larva was allowed to feed on a fine layer of yeast supplemented with 0.1% Bromophenol blue sodium salt (B5525, Sigma). During pauses the larvae are immobile and only the movement of their gut content can be seen.
Tables
Table 1
Number of larvae per recording.
| Substrate | Number of trials | Average number of larvae per trial | Total larvae |
|---|---|---|---|
| Agar homogeneous | 3 rovers 3 sitters | 10 rovers 10 sitters | 30 rovers 29 sitters |
| Sucrose homogeneous | 3 rovers 3 sitters | 10 rovers 10 sitters | 30 rovers 30 sitters |
| Yeast homogeneous | 3 rovers 3 sitters | 10 rovers 10 sitters | 29 rovers 30 sitters |
| Agar 2 patches | 3 sitters | 9 sitters | 28 sitters |
| Gel 2 patches | 3 sitters | 11 sitters | 33 sitters |
| Sucrose 2 patches | 2 rovers 2 sitters 3 anosmic | 8 rovers 8 sitters 10 anosmic | 15 rovers 15 sitters 28 anosmic |
| Sucrose 8 patches | 3 rovers 3 sitters | 8 rovers 8 sitters | 24 rovers 19 sitters |
| Yeast 2 patches | 3 rovers 3 sitters 3 anosmic | 10 rovers 10 sitters 10 anosmic | 30 rovers 27 sitters 21 anosmic |
| Yeast 8 patches | 3 rovers 3 sitters | 8 rovers 8 sitters | 25 rovers 21 sitters |
| Apple juice 2 patches | 3 rovers 3 sitters 3 anosmic | 10 rovers 10 sitters 10 anosmic | 30 rovers 30 sitters 29 anosmic |
Table 2
Parameters of model in homogeneous and patchy substrates obtained in homogeneous substrate experiments.
| Substrate | Larva | Mean v (mm/s) | Std v (mm/s) | Pturn/s | Ppause/s |
|---|---|---|---|---|---|
| Agar | Rover | 0.84 | 0.13 | 0.044 | 0.0083 |
| Agar | Sitter | 0.96 | 0.13 | 0.046 | 0.0063 |
| Sucrose | Rover | 0.68 | 0.092 | 0.041 | 0.012 |
| Sucrose | Sitter | 0.68 | 0.085 | 0.035 | 0.021 |
| Yeast | Rover | 0.37 | 0.13 | 0.033 | 0.25 |
| Yeast | Sitter | 0.31 | 0.11 | 0.028 | 0.25 |
Table 3
Parameters of corrected model in patchy substrates obtained in patchy substrate experiments.
| Patchy substrate | Larva | Mean v inside (outside) (mm/s) | Std v inside (outside) (mm/s) | Pturn/s inside (outside) | Ppause/s inside (outside) |
|---|---|---|---|---|---|
| Agar + sucrose | Rover | 0.60 (0.65) | 0.27 (0.25) | 0.037 (0.044) | 0.039 (0.0014) |
| Agar + sucrose | Sitter | 0.52 (0.57) | 0.28 (0.26) | 0.030 (0.030) | 0.088 (0.040) |
| Agar + yeast | Rover | 0.37 (0.44) | 0.19 (0.20) | 0.039 (0.068) | 0.17 (0.023) |
| Agar + yeast | Sitter | 0.26 (0.36) | 0.14 (0.17) | 0.025 (0.048) | 0.32 (0.053) |
| Agar + apple juice | Rover | 0.44 (0.53) | 0.24 (0.26) | 0.026 (0.017) | 0.096 (0.076) |
| Agar + apple juice | Sitter | 0.39 (0.48) | 0.21 (0.22) | 0.021 (0.031) | 0.13 (0.065) |
Table 4
Statistical power and Cohen’s effect size of non-significant comparisons.
| Figure 1 | ||||
|---|---|---|---|---|
| D – Avg. number of turns per min | Power (1 − β) | Cohen’s size effect (d) | ||
| Rover | Agar | Sucrose | 0.24 | 0.34 |
| Rover | Sucrose | Yeast | 0.48 | 0.52 |
| Sitter | Sucrose | Yeast | 0.47 | 0.51 |
| G – Handedness | ||||
| Rover | Agar | Sucrose | 0.13 | −0.22 |
| Rover | Agar | Yeast | 0.05 | 0.01 |
| Rover | Sucrose | Yeast | 0.19 | 0.31 |
| Sitter | Agar | Sucrose | 0.14 | 0.25 |
| Sitter | Agar | Yeast | 0.08 | 0.16 |
| Sitter | Sucrose | Yeast | 0.08 | −0.15 |
| Figure 3 | ||||
| C – Crawling speed | Power (1 − β) | Cohen’s size effect (d) | ||
| Sucrose | ||||
| Rover | In | Out | 0.14 | −0.34 |
| Sitter | In | Out | 0.20 | −0.44 |
| D – Avg. number of turns per min | ||||
| Sucrose | ||||
| Rover | In | Out | 0.29 | −0.56 |
| Sitter | In | Out | 0.05 | −0.02 |
| F – Handedness | ||||
| Rover | ||||
| Sucrose | In | Out | 0.11 | −0.30 |
| Yeast | In | Out | 0.10 | −0.24 |
| Apple juice | In | Out | 0.15 | 0.31 |
| Sitter | ||||
| Sucrose | In | Out | 0.06 | −0.15 |
| Yeast | In | Out | 0.06 | −0.14 |
| Apple juice | In | Out | 0.16 | −0.39 |
| G – Crawl dist. 5 min | ||||
| Apple juice | Rover | Sitter | 0.20 | 0.34 |
| H – Fraction of time spent inside patch | ||||
| Sucrose | Rover | Sitter | 0.08 | 0.20 |
| Apple juice | Rover | Sitter | 0.32 | −0.40 |
| Figure S3 | ||||
| Apple juice Crawling speed | Power (1 − β) | Cohen’s size effect (d) | ||
| In | Rover | Sitter | 0.61 | 0.60 |
| Out | Rover | Sitter | 0.32 | 0.40 |
| Avg. number of turns per min | ||||
| In | Rover | Sitter | 0.53 | 0.55 |
| Out | Rover | Sitter | 0.09 | 0.18 |
| Fraction of pauses | ||||
| In | Rover | Sitter | 0.32 | −0.40 |
| Out | Rover | Sitter | 0.07 | 0.10 |
| Figure 4 | ||||
| Anosmic B – Crawling speed | Power (1 − β) | Cohen’s size effect (d) | ||
| Sucrose | In | Out | 0.51 | −0.56 |
| Yeast | In | Out | 0.23 | −0.39 |
| C – Avg. number of turns per min | ||||
| Sucrose | In | Out | 0.10 | −0.19 |
| Yeast | In | Out | 0.32 | −0.50 |
| E – Handedness | ||||
| Sucrose | In | Out | 0.10 | 0.24 |
| Yeast | In | Out | 0.07 | −0.16 |
| Apple juice | In | Out | 0.45 | 0.58 |
| F – Fraction of time spent inside patch | ||||
| Sucrose | Yeast | 0.26 | 0.40 | |
| Sucrose | Apple juice | 0.44 | −0.50 | |
| Figure 6 | ||||
| C – Fraction of time spent inside patch – eight patches | Power (1 − β) | Cohen’s size effect (d) | ||
| Sucrose | Rover | Sitter | 0.14 | −0.31 |
| Yeast | Rover | Sitter | 0.31 | 0.45 |
| E – Fraction of visited patches | ||||
| Rover | ||||
| Sucrose | 2 patches | 8 patches | 0.05 | 0 |
| Sitter | ||||
| Sucrose | 2 patches | 8 patches | 0.07 | 0.15 |
| Yeast | 2 patches | 8 patches | 0.56 | −0.62 |
Additional files
-
Transparent reporting form
- https://cdn.elifesciences.org/articles/75826/elife-75826-transrepform1-v2.pdf
-
Source data 1
- https://cdn.elifesciences.org/articles/75826/elife-75826-data1-v2.xlsx
-
Source data 2
All data individual larvae for Figure 6.
- https://cdn.elifesciences.org/articles/75826/elife-75826-data2-v2.xlsx
Download links
A two-part list of links to download the article, or parts of the article, in various formats.
Downloads (link to download the article as PDF)
Open citations (links to open the citations from this article in various online reference manager services)
Cite this article (links to download the citations from this article in formats compatible with various reference manager tools)
Adaptation of Drosophila larva foraging in response to changes in food resources
eLife 11:e75826.
https://doi.org/10.7554/eLife.75826


