The m6A reader YTHDF2 is a negative regulator for dendrite development and maintenance of retinal ganglion cells
- School of Life Sciences, Department of Biology, Shenzhen Key Laboratory of Gene Regulation and Systems Biology, Brain Research Center, Southern University of Science and Technology, China
- SUSTech-HIT Joint Graduate Program, Southern University of Science and Technology, China
- Shenzhen Institutes of Advanced Technology, Chinese Academy of Sciences, China
- State Key Laboratory of Ophthalmology, Zhongshan Ophthalmic Center, Sun Yat-sen University, China
- Department of Neurosurgery, Jinshan Hospital, Institute for Translational Brain Research, State Key Laboratory of Medical Neurobiology, MOE Frontiers Center for Brain Science, Fudan University, China
- Co-Innovation Center of Neuroregeneration, Nantong University, China
Figures
Figure 1 with 1 supplement
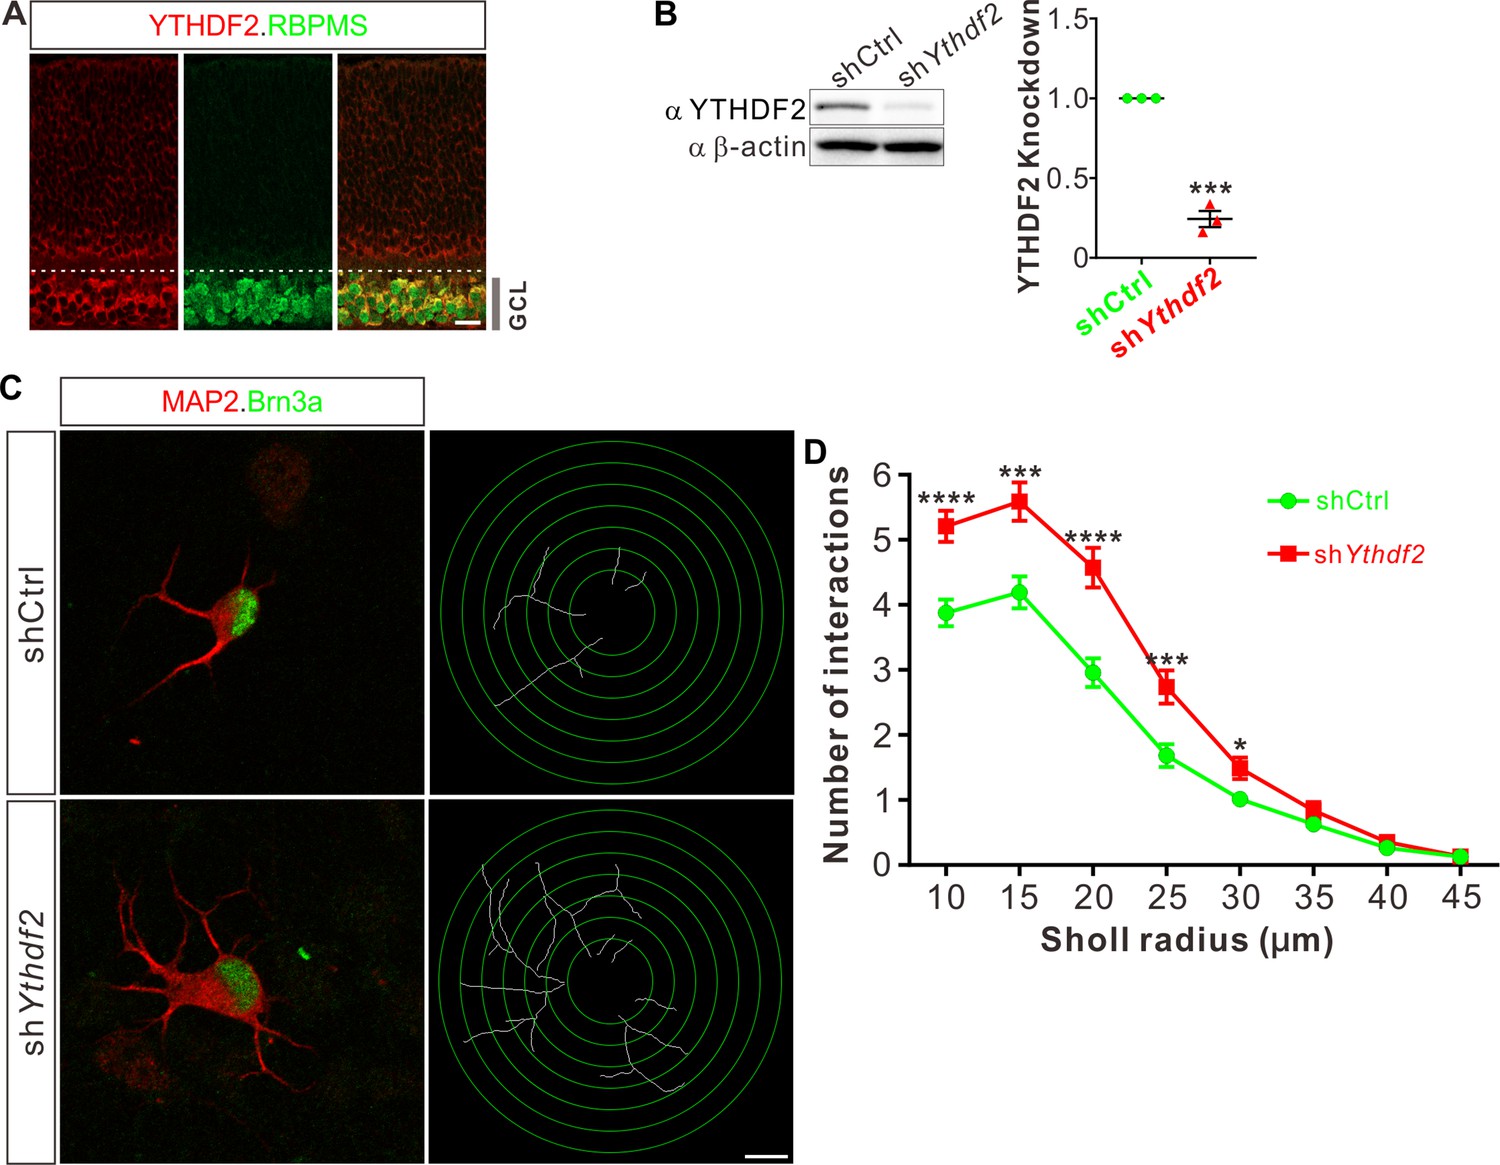
Knockdown (KD) of YTHDF2 leads to a robust increase of retinal ganglion cell (RGC) dendrite branching.
(A) Representative confocal images showing high expression of YTHDF2 in RGCs (marked by RBPMS) in P0 retina. Note that all RGCs marked by the pan-RGC marker RBPMS express YTHDF2 while all YTHDF2-expressing cells are RBPMS+ RGCs. GCL, ganglion cell layer. Scale bars: 20 μm. (B) Western blotting (WB) confirming efficient KD of YTHDF2 in cultured RGCs using shYthdf2. Data of WB quantification are mean ± SEM and are represented as dot plots: ***p = 0.00012 (n = 3 replicates); by unpaired Student’s t test. (C) Examination of RGC dendrite development after YTHDF2 KD. As shown, significantly increased branching of dendrites marked by MAP2 immunofluorescence was observed in cultured RGCs marked by Brn3a. Dendrite traces were drawn for the corresponding RGCs. Scale bar: 10 μm. (D) Quantification of dendrite branching (C) using Sholl analysis. As shown, numbers of interactions are significantly greater in shYthdf2 groups (n = 68 RGCs) than shCtrl groups (n = 72 RGCs) in Sholl radii between 10 and 30 μm. Data are mean ± SEM. ****p = 4.32E-05 (10 μm), ***p = 0.00038 (15 μm), ****p = 2.85E-05 (20 μm), ***p = 0.00084 (25 μm), *p = 0.020 (30 μm), by unpaired Student’s t test.
-
Figure 1—source data 1
Source data for Figure 1B.
(A) Western blotting (WB) of anti-YTHDF2 after knockdown (KD) of YTHDF2. (B) WB of anti-β-actin after KD of YTHDF2.
- https://cdn.elifesciences.org/articles/75827/elife-75827-fig1-data1-v3.zip
-
Figure 1—source data 2
Source data for Figure 1B.
Original file of the full raw unedited blot of anti-YTHDF2 after knockdown (KD) of YTHDF2.
- https://cdn.elifesciences.org/articles/75827/elife-75827-fig1-data2-v3.zip
-
Figure 1—source data 3
Source data for Figure 1B.
Original file of the full raw unedited blot of anti-β-actin after knockdown (KD) of YTHDF2.
- https://cdn.elifesciences.org/articles/75827/elife-75827-fig1-data3-v3.zip
Figure 1—figure supplement 1
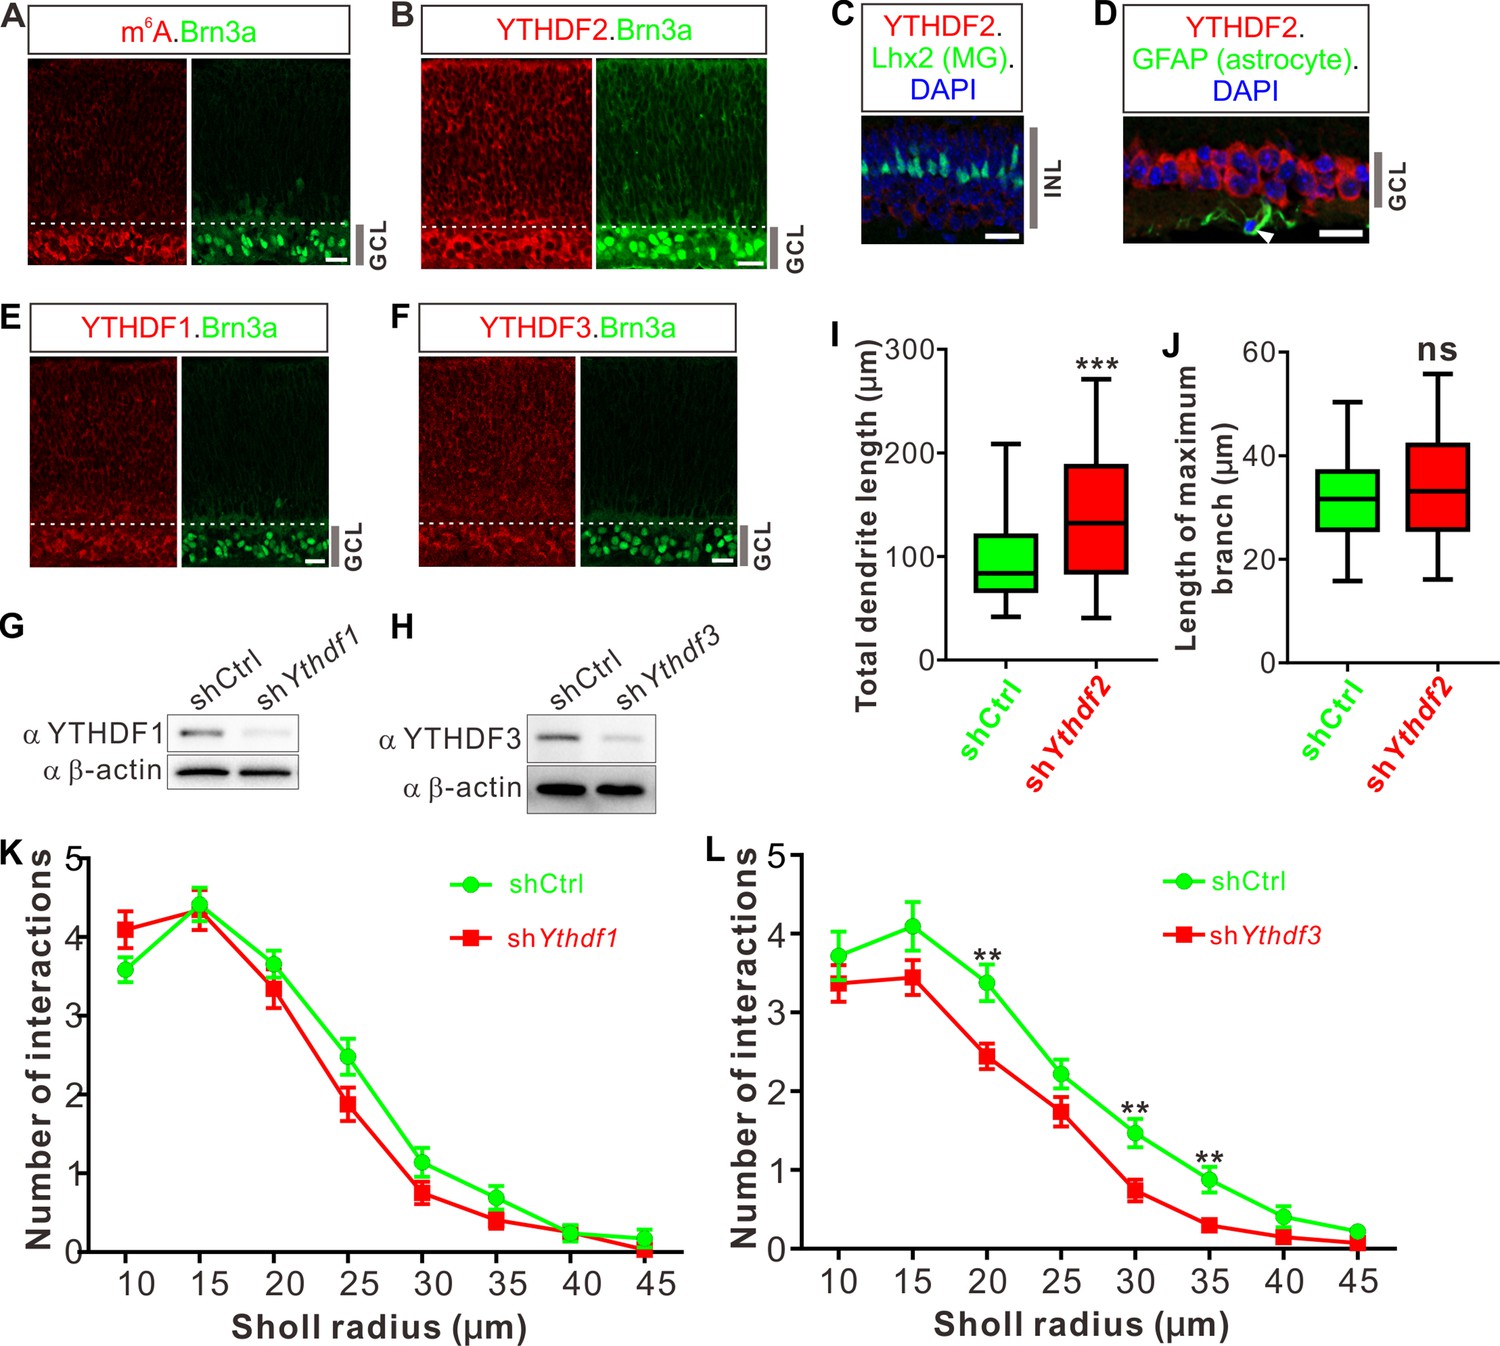
Retinal ganglion cells (RGCs) have high level of N6-methyladenosine (m6A) modification and strong expression of YTHDFs.
(A–F) Representative confocal images showing high levels of m6A modification (A), strong expressions of YTHDF2 (B), YTHDF1 (E), and YTHDF3 (F) in RGCs (marked by Brn3a) in P0 retina, and no expression of YTHDF2 in Müller glia (marked by Lhx2, C) and astrocytes (marked by GFAP, D) in P20 retina. Scale bars: 20 μm. (G, H) Western blotting (WB) confirming efficient knockdown (KD) of YTHDF1 and YTHDF3 in cultured RGCs using shYthdf1 and shYthdf3, respectively. (I, J) Quantification of total length (I) and length of maximum branch (J) of RGC dendrites after YTHDF2 KD. Data are represented as box and whisker plots: n = 36 RGCs for shCtrl, n = 32 RGCs for shYthdf2; ***p = 0.00062 for I; p = 0.22 for J; ns, not significant; by unpaired Student’s t test. (K, L) Quantification of dendrite branching using Sholl analysis after YTHDF1 KD (K) and YTHDF3 KD (L). Data are mean ± SEM. In K, n = 29 RGCs for shCtrl, n = 32 RGCs for shYthdf1, all not significant; in L, n = 32 RGCs for shCtrl, n = 27 RGCs for shYthdf3, **p = 0.0028 (20 μm), **p = 0.0028 (30 μm), **p = 0.0052 (35 μm); by unpaired Student’s t test.
-
Figure 1—figure supplement 1—source data 1
Source data for Figure 1—figure supplement 1E,F.
(A) Western blotting (WB) of anti-YTHDF1 after knockdown (KD) of YTHDF1. (B) WB of anti-β-actin after KD of YTHDF1. (C) WB of anti YTHDF3 after KD of YTHDF3. (D) WB of anti-β-actin after KD of YTHDF3.
- https://cdn.elifesciences.org/articles/75827/elife-75827-fig1-figsupp1-data1-v3.zip
-
Figure 1—figure supplement 1—source data 2
Source data for Figure 1—figure supplement 1E.
Original file of the full raw unedited blot of anti-YTHDF1 after knockdown (KD) of YTHDF1.
- https://cdn.elifesciences.org/articles/75827/elife-75827-fig1-figsupp1-data2-v3.zip
-
Figure 1—figure supplement 1—source data 3
Source data for Figure 1—figure supplement 1E.
Original file of the full raw unedited blot of anti-β-actin after knockdown (KD) of YTHDF1.
- https://cdn.elifesciences.org/articles/75827/elife-75827-fig1-figsupp1-data3-v3.zip
-
Figure 1—figure supplement 1—source data 4
Source data for Figure 1—figure supplement 1F.
Original file of the full raw unedited blot of anti-YTHDF3 after knockdown (KD) of YTHDF3.
- https://cdn.elifesciences.org/articles/75827/elife-75827-fig1-figsupp1-data4-v3.zip
-
Figure 1—figure supplement 1—source data 5
Source data for Figure 1—figure supplement 1F.
Original file of the full raw unedited blot of anti-β-actin after knockdown (KD) of YTHDF3.
- https://cdn.elifesciences.org/articles/75827/elife-75827-fig1-figsupp1-data5-v3.zip
Figure 2 with 2 supplements
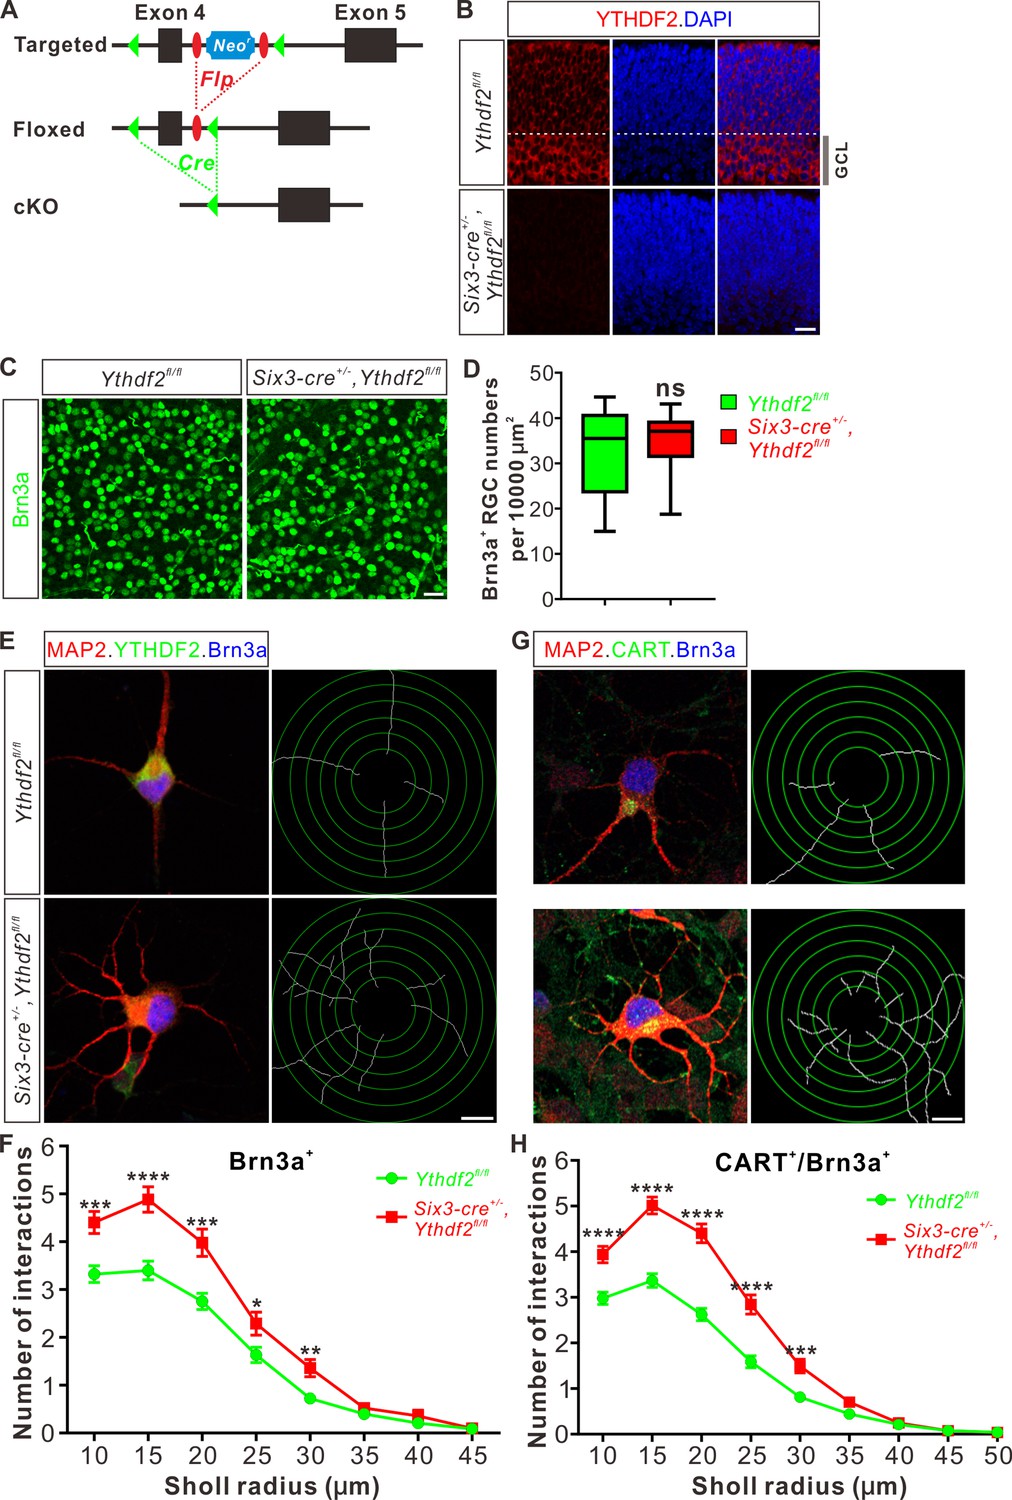
Dendrite branching is dramatically increased in cultured retinal ganglion cells (RGCs) from Ythdf2 conditional knockout (cKO).
(A) Schematic drawings of the genetic deletion strategy for Ythdf2. Exon 4 which contains YTH domain-coding sequence is deleted after Cre-mediated recombination. (B) Depletion of YTHDF2 protein in retina of Six3-cre+/-;Ythdf2fl/fl cKO mice. Anti-YTHDF2 immunostaining of E15.5 retina vertical sections confirmed cKO of YTHDF2 protein, compared with Ythdf2fl/fl littermate controls. Scale bar: 20 μm. (C, D) RGC neurogenesis not affected in the Ythdf2 cKO retina. Wholemount immunostaining using a Brn3a antibody was carried out in P20 retina (C). Numbers of Brn3a+ RGC per 10,000 μm2 of retina were quantified and showed no difference between the Ythdf2 cKO and their littermate controls (D). n = 12 confocal fields for each genotype. Data are represented as box and whisker plots: ns, not significant (p = 0.79); by unpaired Student’s t test. Scale bar: 25 μm. (E) Examination of RGC dendrite development in Ythdf2 cKO RGCs. As shown, knockout of YTHDF2 was confirmed by YTHDF2 IF (green). Significantly increased branching of dendrites marked by MAP2 IF (red) was observed in cultured RGCs from the Ythdf2 cKO retina compared with their littermate controls. Dendrite traces were drawn for the corresponding RGCs. Scale bar: 10 μm. (F) Quantification of RGC dendrite branching (E) using Sholl analysis. Data are mean ± SEM. Numbers of interactions are significantly greater in Six3-cre+/-,Ythdf2fl/fl groups (n = 68 RGCs) than Ythdf2fl/fl groups (n = 42 RGCs) in Sholl radii between 10 and 30 μm: ***p = 0.00030 (10 μm), ****p = 1.19E-05 (15 μm), ***p = 0.00018 (20 μm), *p = 0.021 (25 μm), **p = 0.0022 (30 μm), by unpaired Student’s t test. (G) Examination of CART+ (cocaine- and amphetamine-regulated transcript) RGC dendrite development in Ythdf2 cKO RGCs. Cultured CART+ RGCs from the Ythdf2 cKO retina have significantly increased branching of dendrites marked by MAP2 IF (red) compared with their littermate controls. Dendrite traces were drawn for the corresponding RGCs. Scale bar: 10 μm. (H) Quantification of CART+ RGC dendrite branching (G) using Sholl analysis. Data are mean ± SEM. Numbers of interactions are significantly greater in Six3-cre+/-,Ythdf2fl/fl groups (n = 77 RGCs) than Ythdf2fl/fl groups (n = 90 RGCs) in Sholl radii between 10 and 30 μm: ****p = 3.17E-05 (10 μm), ****p = 6.50E-11 (15 μm), ****p = 5.14E-12 (20 μm), ****p = 5.00E-07 (25 μm), ***p = 0.00020 (30 μm), by unpaired Student’s t test.
Figure 2—figure supplement 1
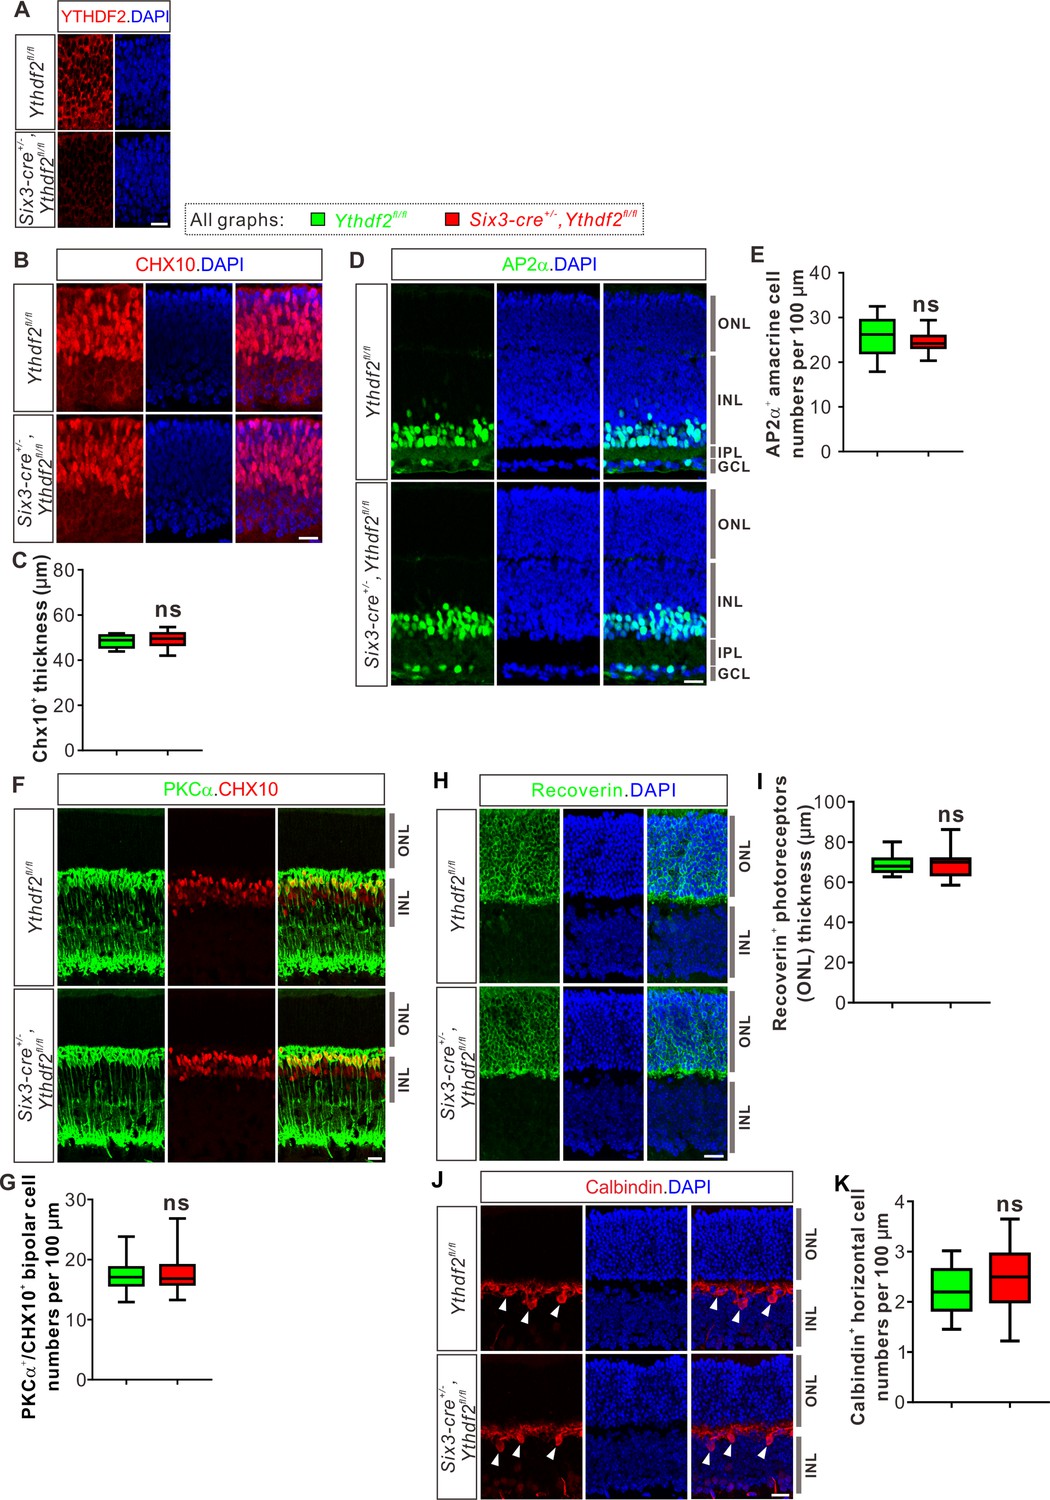
Ythdf2 conditional knockout (cKO) does not change numbers of retinal progenitors, amacrine cells, bipolar cells, photoreceptors, or horizontal cells.
(A) YTHDF2 protein was efficiently knocked out in the retinas of Six3-Cre-mediated Ythdf2 cKO mice at E12.5. (B, C) Retinal progenitors not affected in Ythdf2 cKO retina. CHX10 IF was used to label retinal progenitors at E15.5 (B). Thickness of CHX10+ retinal layer was quantified and showed no difference between the Ythdf2 cKO retina (n = 10 sections) and their littermate controls (n = 19 sections) (C). (D, E) Amacrine cells not affected in the Ythdf2 cKO retina. AP2α IF was used to mark amacrine cells in P6 retina (D). Numbers of AP2α+ amacrine cells per 100 μm of layer width in retina vertical sections were quantified and showed no difference between the Ythdf2 cKO (n = 26 sections) and littermate controls (n = 26 sections) (E). ONL, outer nuclear layer; INL, inner nuclear layer; IPL, inner plexiform layer. (F, G) Bipolar cells not changed in the Ythdf2 cKO retina. PKCα and CHX10 IF were used to label bipolar cells in P15 retina (F). Numbers of PKCα+/CHX10+ bipolar cells per 100 μm of layer width in retina vertical sections were quantified and showed no difference between the Ythdf2 cKO (n = 18 sections) and littermate controls (n = 18 sections) (G). (H, I) Photoreceptors not changed in the Ythdf2 cKO retina. Recoverin IF was used to label photoreceptors in P20 retina (H). Thickness of Recoverin+ photoreceptor layer (e.g. ONL) in the retinal vertical sections was quantified and showed no difference between the Ythdf2 cKO (n = 34 confocal fields) and littermate controls (n = 30 confocal fields) (I). (J, K) Horizontal cells not affected in the Ythdf2 cKO retina. Calbindin IF was used to mark horizontal cells in P20 retina (arrowheads in J). Numbers of Calbindin+ horizontal cells per 100 μm of layer width in retina vertical sections were quantified and showed no difference between the Ythdf2 cKO (n = 17 sections) and littermate controls (n = 17 sections) (K). All quantification data are represented as box and whisker plots: ns, not significant; p = 0.41 for C, p = 0.16 for E, p = 0.82 for G, p = 0.89 for I, p = 0.19 for K; by unpaired Student’s t test. Scale bars: 20 μm.
Figure 2—figure supplement 2
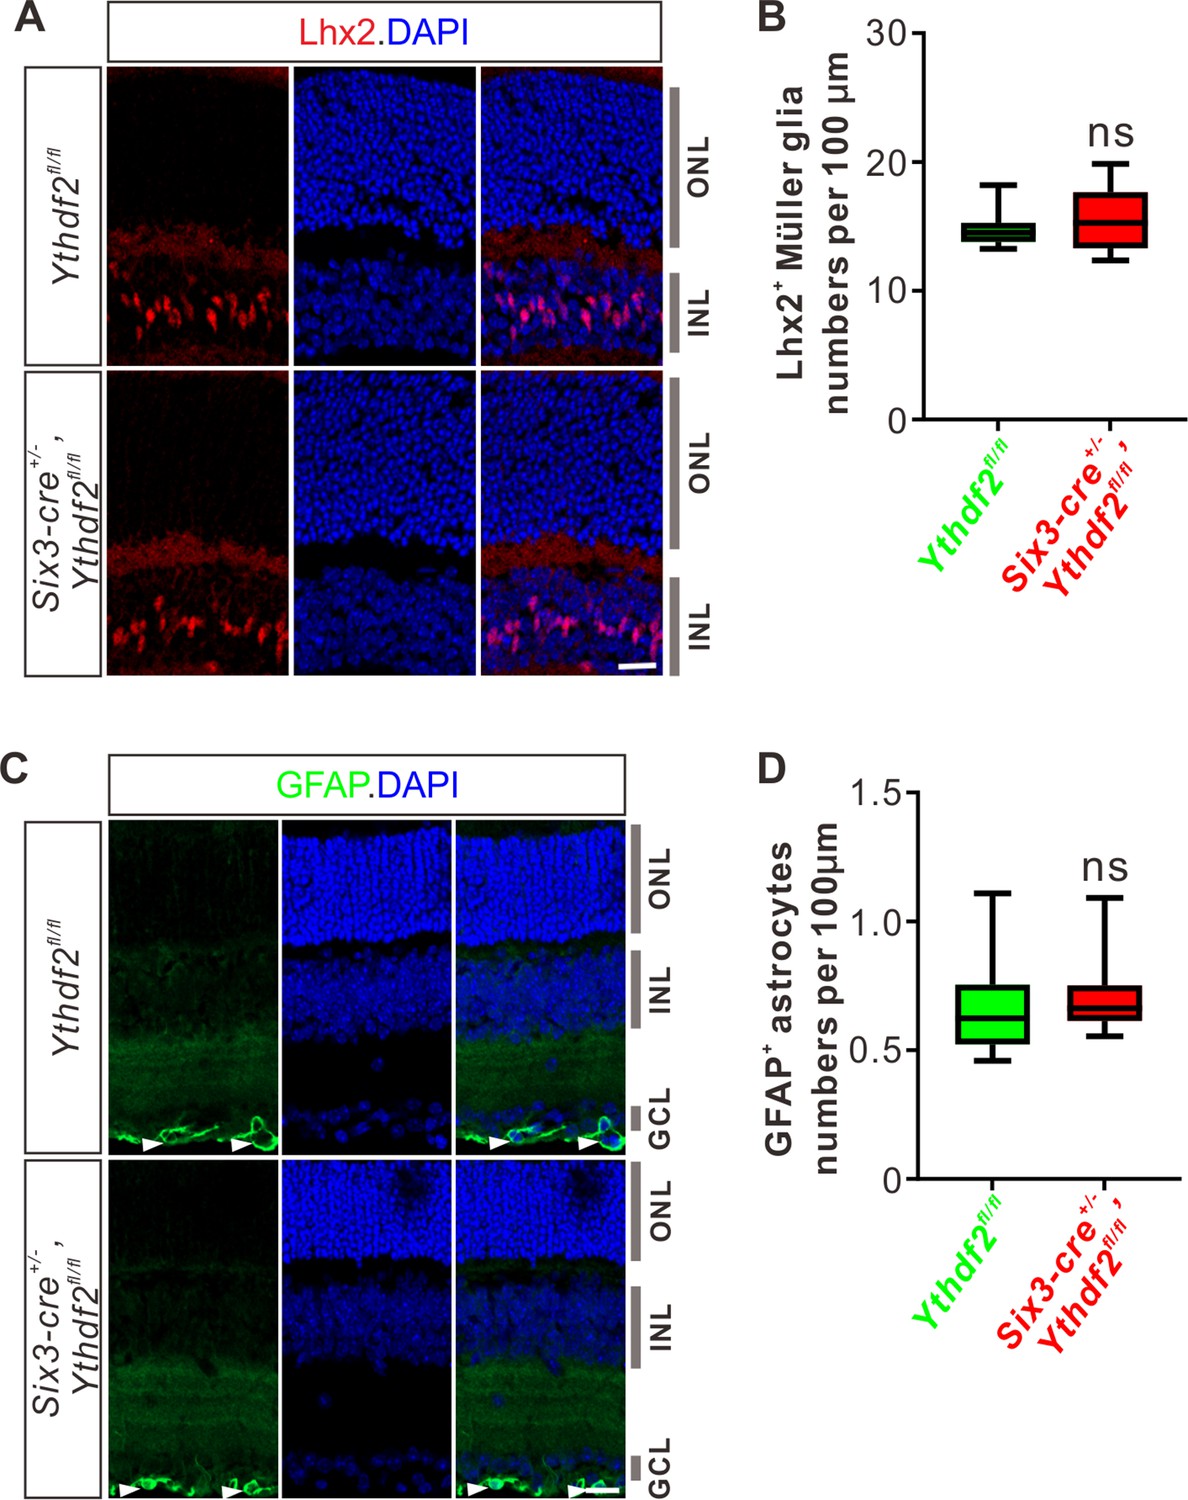
Ythdf2 conditional knockout (cKO) does not change numbers of Müller glia or astrocytes.
(A, B) Müller glia numbers not changed in the Ythdf2 cKO retina. Lhx2 IF was used to label Müller glia in P20 retina (A). Numbers of Lhx2+ Müller glia per 100 μm of layer width in retina vertical sections were quantified and showed no difference between the Ythdf2 cKO (n = 10 sections) and littermate controls (n = 9 sections) (B). Data are represented as box and whisker plots: ns, not significant; p = 0.69; by unpaired Student’s t test. (C, D) Astrocytes not affected in the Ythdf2 cKO retina. GFAP IF was used to label astrocytes in P20 retina (arrowheads in C). Numbers of GFAP+ astrocytes per 100 μm of layer width in retina vertical sections were quantified and showed no difference between the Ythdf2 cKO (n = 14 sections) and littermate controls (n = 13 sections) (D). Data are represented as box and whisker plots: ns, not significant; p = 0.23; by unpaired Student’s t test.
Figure 3 with 1 supplement
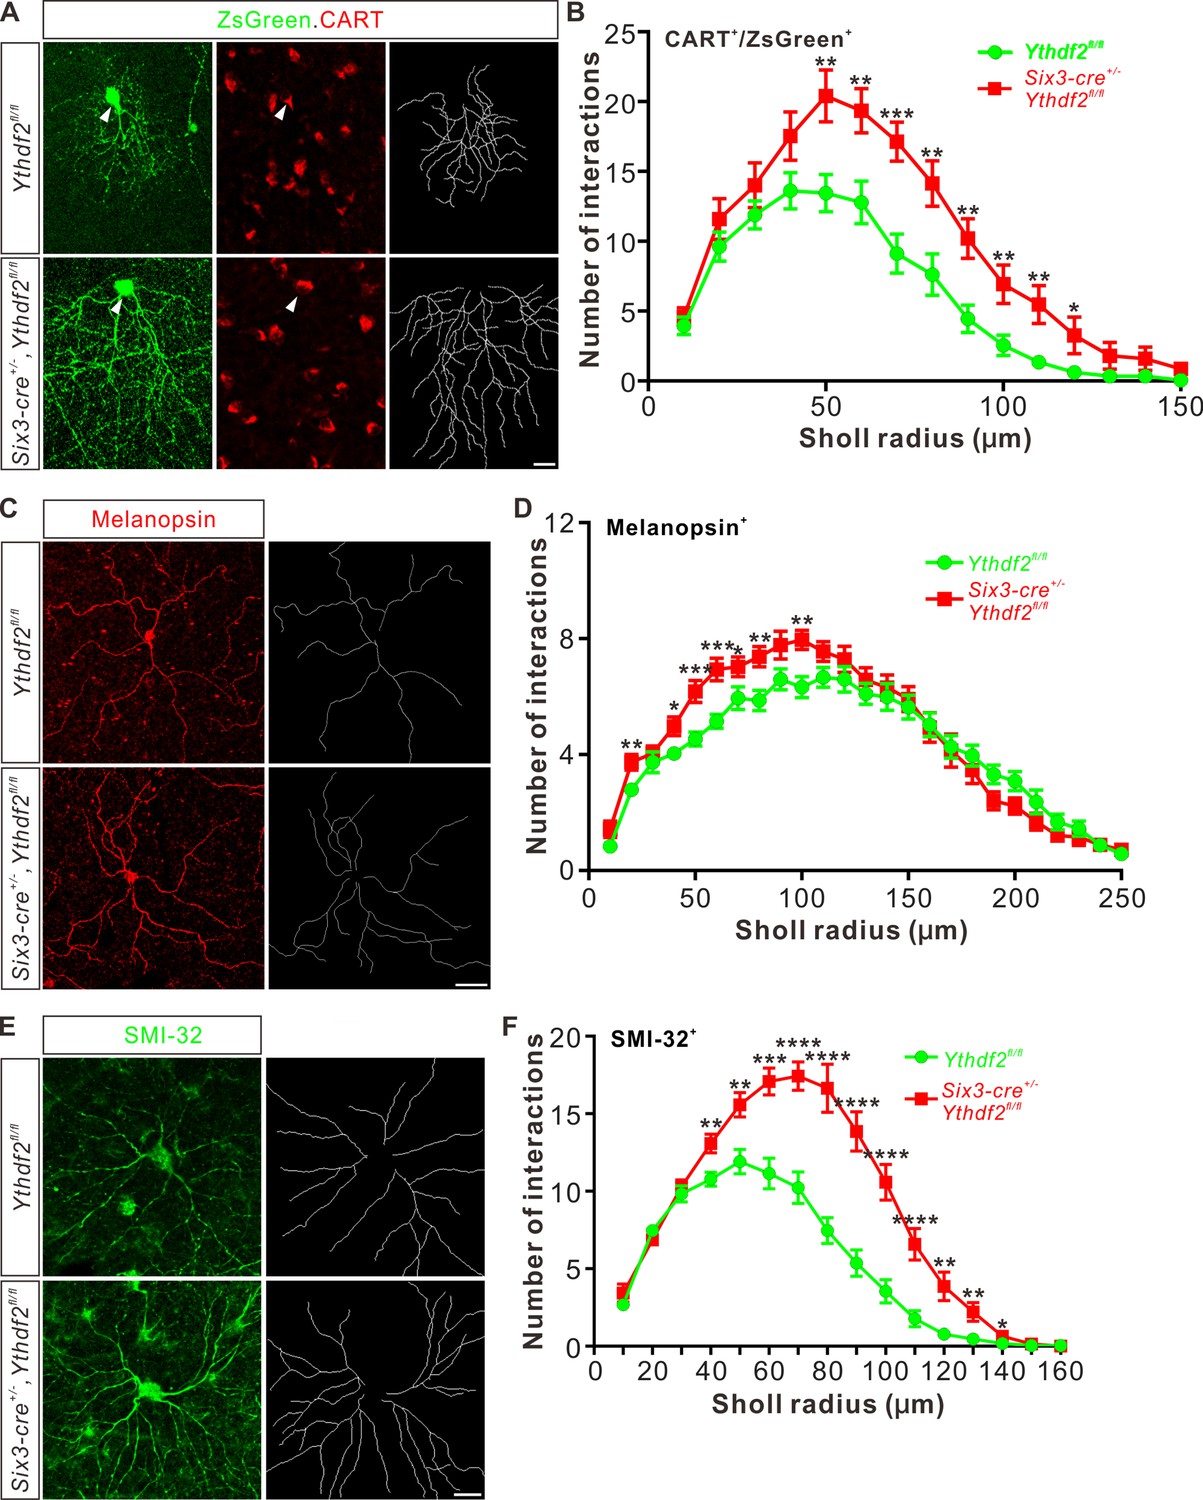
Dendrite branching of specific retinal ganglion cell (RGC) subtypes increases in Ythdf2 conditional knockout (cKO) in vivo.
(A) Co-labeling of ON-OFF directionally selective RGCs (ooDSGCs) by AAV-ZsGreen and CART (cocaine- and amphetamine-regulated transcript) IF in vivo. Intravitreal injection of AAV-expressing ZsGreen reporter was performed at P17 and retinas were collected at P27. The white arrowheads indicate ooDSGCs co-labeled by ZsGreen and CART IF, which show dramatically increased dendrite branching in Ythdf2 cKO compared with control. Dendrite traces were drawn for the corresponding RGCs shown. Scale bar: 20 μm. (B) Quantification of dendrite branching of ZsGreen+/CART+ ooDSGCs (A) using Sholl analysis. Data are mean ± SEM. Numbers of interactions are significantly greater in Six3-cre+/-,Ythdf2fl/fl groups (n = 15 RGCs) than Ythdf2fl/fl groups (n = 18 RGCs) in Sholl radii between 50 and 120 μm: **p = 0.0041 (50 μm), **p = 0.0059 (60 μm), ***p = 0.00036 (70 μm), **p = 0.0058 (80 μm), **p = 0.0018 (90 μm), **p = 0.0064 (100 μm), **p = 0.0045 (110 μm), *p = 0.040 (120 μm), by unpaired Student’s t test. (C) Dendrites of intrinsically photosensitive RGCs (ipRGCs) visualized by wholemount immunostaining of P20 retina using a melanopsin antibody in vivo. Dendrite traces were drawn for the corresponding RGCs shown. Scale bar: 50 μm. (D) Quantification of dendrite branching of melanopsin+ ipRGCs (C) using Sholl analysis. Data are mean ± SEM. Numbers of interactions are significantly greater in Six3-cre+/-,Ythdf2fl/fl groups (n = 18 RGCs) than Ythdf2fl/fl groups (n = 21 RGCs) in Sholl radii between 20 and 100 μm: **p = 0.0083 (20 μm), *p = 0.018 (40 μm), ***p = 0.00068 (50 μm), ***p = 0.00027 (60 μm), *p = 0.048 (70 μm), **p = 0.0048 (80 μm), **p = 0.0023 (100 μm), by unpaired Student’s t test. (E) Dendrites of αRGCs visualized by wholemount immunostaining of P20 retina using an SMI-32 antibody in vivo. Dendrite traces were drawn for the corresponding RGCs shown. Scale bar: 20 μm. (F) Quantification of dendrite branching of SMI-32+αRGCs (E) using Sholl analysis. Data are mean ± SEM. Numbers of interactions are significantly greater in Six3-cre+/-,Ythdf2fl/fl groups (n = 14 RGCs) than Ythdf2fl/fl groups (n = 22 RGCs) in Sholl radii between 40 and 140 μm: **p = 0.0044 (40 μm), **p = 0.0035 (50 μm), ***p = 0.00021 (60 μm), ****p = 2.63E-05 (70 μm), ****p = 2.38E-06 (80 μm), ****p = 1.68E-06 (90 μm), ****p = 6.76E-06 (100 μm), ****p = 5.72E-05 (110 μm), **p = 0.0011 (120 μm), **p = 0.0032 (130 μm), *p = 0.047 (140 μm), by unpaired Student’s t test.
Figure 3—figure supplement 1
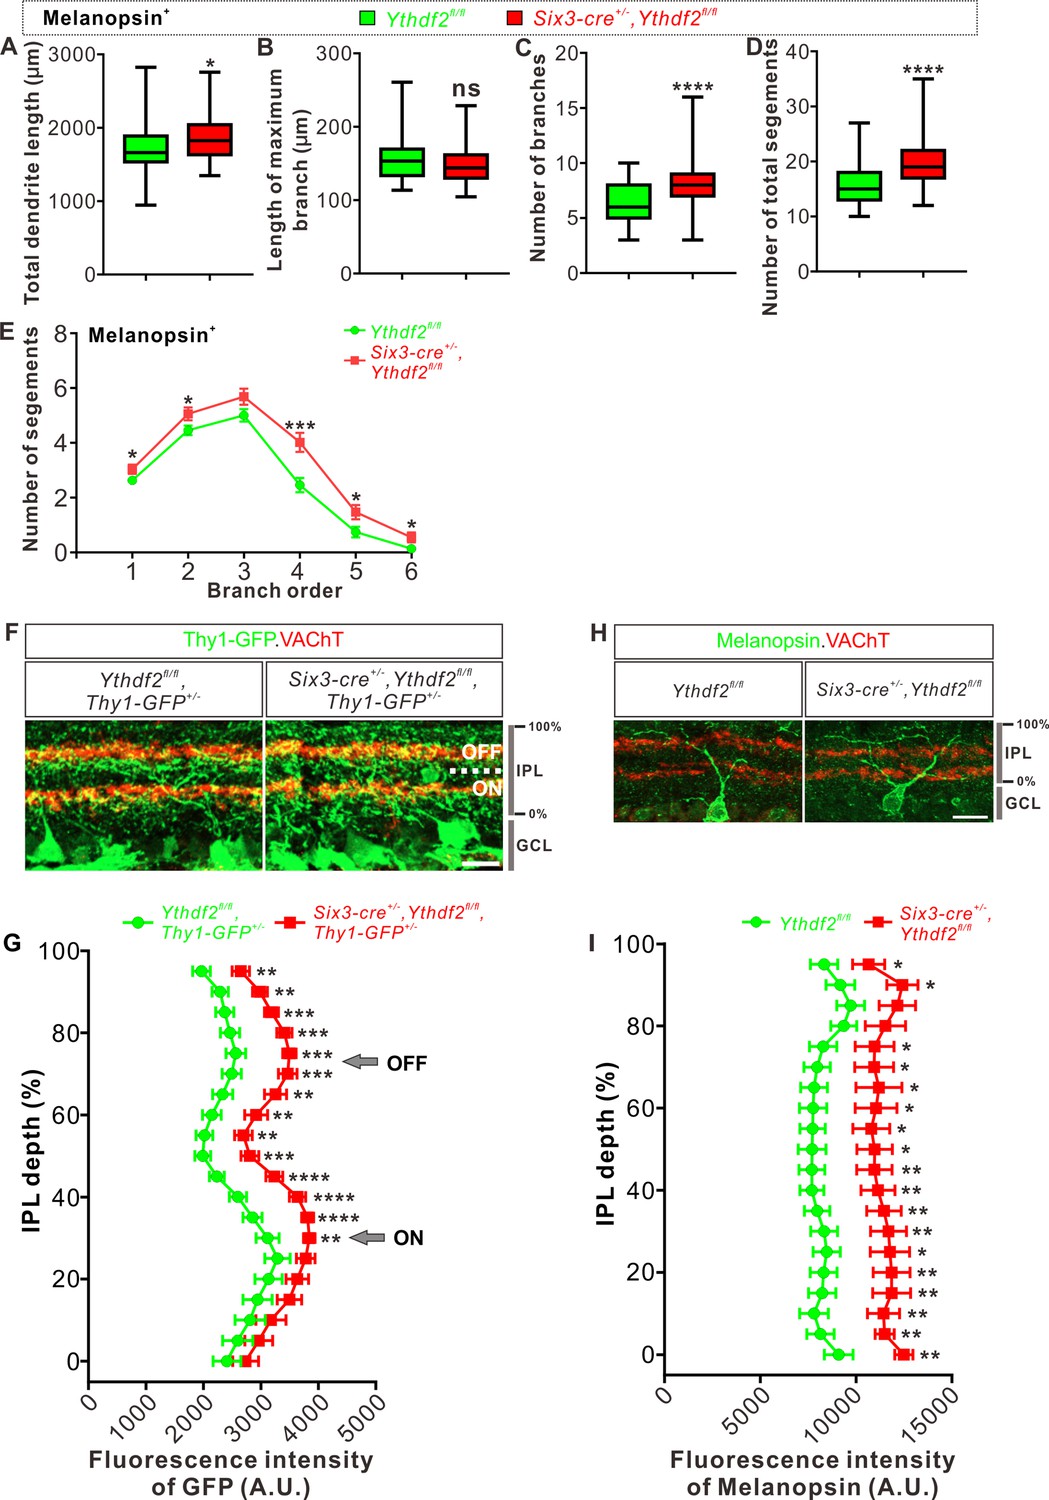
General dendrite density in inner plexiform layer (IPL) is increased without affecting sublaminar targeting.
(A–E) Quantification of total length (A), length of maximum branch (B), branch numbers (C), number of total segments (D), and numbers of segments on each branch order (E) of melanopsin+ intrinsically photosensitive retinal ganglion cells (ipRGCs) dendrites visualized by wholemount immunostaining of P20 retina using a melanopsin antibody in vivo (shown in Figure 3C). Data are represented as box and whisker plots in A–D: n = 58 RGCs for Ythdf2fl/fl, n = 51 RGCs for Six3-cre+/-,Ythdf2fl/fl; *p = 0.040 for A; p = 0.12 for B; ****p = 1.39E-06 for C; *p = 7.89E-08 for D; ns, not significant. Data are mean ± SEM in E *p = 0.038 (branch order 1), *p = 0.039 (branch order 2), ***p = 0.00045 (branch order 4), *p = 0.026 (branch order 5), *p = 0.029 (branch order 6). All by unpaired Student’s t test. (F) Cross-sections of the IPL showing dendritic sublaminar patterning of Thy1-GFP+ RGCs in P20 control and Ythdf2 conditional knockout (cKO) retina. ON and OFF refer to the ON-OFF bipartite divisions of the IPL marked by VAChT. Scale bar: 20 μm. (G) Quantification and distribution of GFP intensities from Thy1-GFP+ RGC dendrites through the depth of IPL shown in (F). GFP IF intensities are increased for the 30–95% depth of IPL in the Ythdf2 cKO retina compared with their littermate controls, but the general patterning is similar between the two genotypes. Data are mean ± SEM (n = 13 sections for each genotype): **p = 0.0039 (95%), **p = 0.0014 (90%), ***p = 0.00049 (85%), ***p = 0.00020 (80%), ***p = 0.00018 (75%), ***p = 0.00036 (70%), **p = 0.0018 (65%), **p = 0.0067 (60%), **p = 0.0040 (55%), ***p = 0.00057 (50%), ****p = 3.48E-05 (45%), ****p = 4.76E-05 (40%), ****p = 6.85E-05 (35%), **p = 0.0034 (30%), by unpaired Student’s t test. Arrows indicate peaks of VAChT signals. (H) Cross-sections of the IPL showing dendritic sublaminar patterning of melanopsin+ ipRGCs in P20 control and Ythdf2 cKO retina. Scale bar: 20 μm. (I) Quantification and distribution of melanopsin IF intensities from melanopsin+ ipRGC dendrites through the depth of IPL shown in (H). Melanopsin IF intensities are increased in the Ythdf2 cKO retina compared with their littermate controls, but the general patterning is similar between the two genotypes. Data are mean ± SEM (n = 11 neurons for control, n = 8 neurons for Ythdf2 cKO): *p = 0.049 (95%), *p = 0.010 (90%), *p = 0.039 (75%), *p = 0.022 (70%), *p = 0.019 (65%), *p = 0.018 (60%), *p = 0.016 (55%), *p = 0.013 (50%), **p = 0.0095 (45%), **p = 0.0044 (40%), **p = 0.0053 (35%), **p = 0.0091 (30%), *p = 0.014 (25%), **p = 0.0074 (20%), **p = 0.0071 (15%), **p = 0.0053 (10%), **p = 0.0025 (5%), **p = 0.0029 (0%), by unpaired Student’s t test.
Figure 4 with 1 supplement
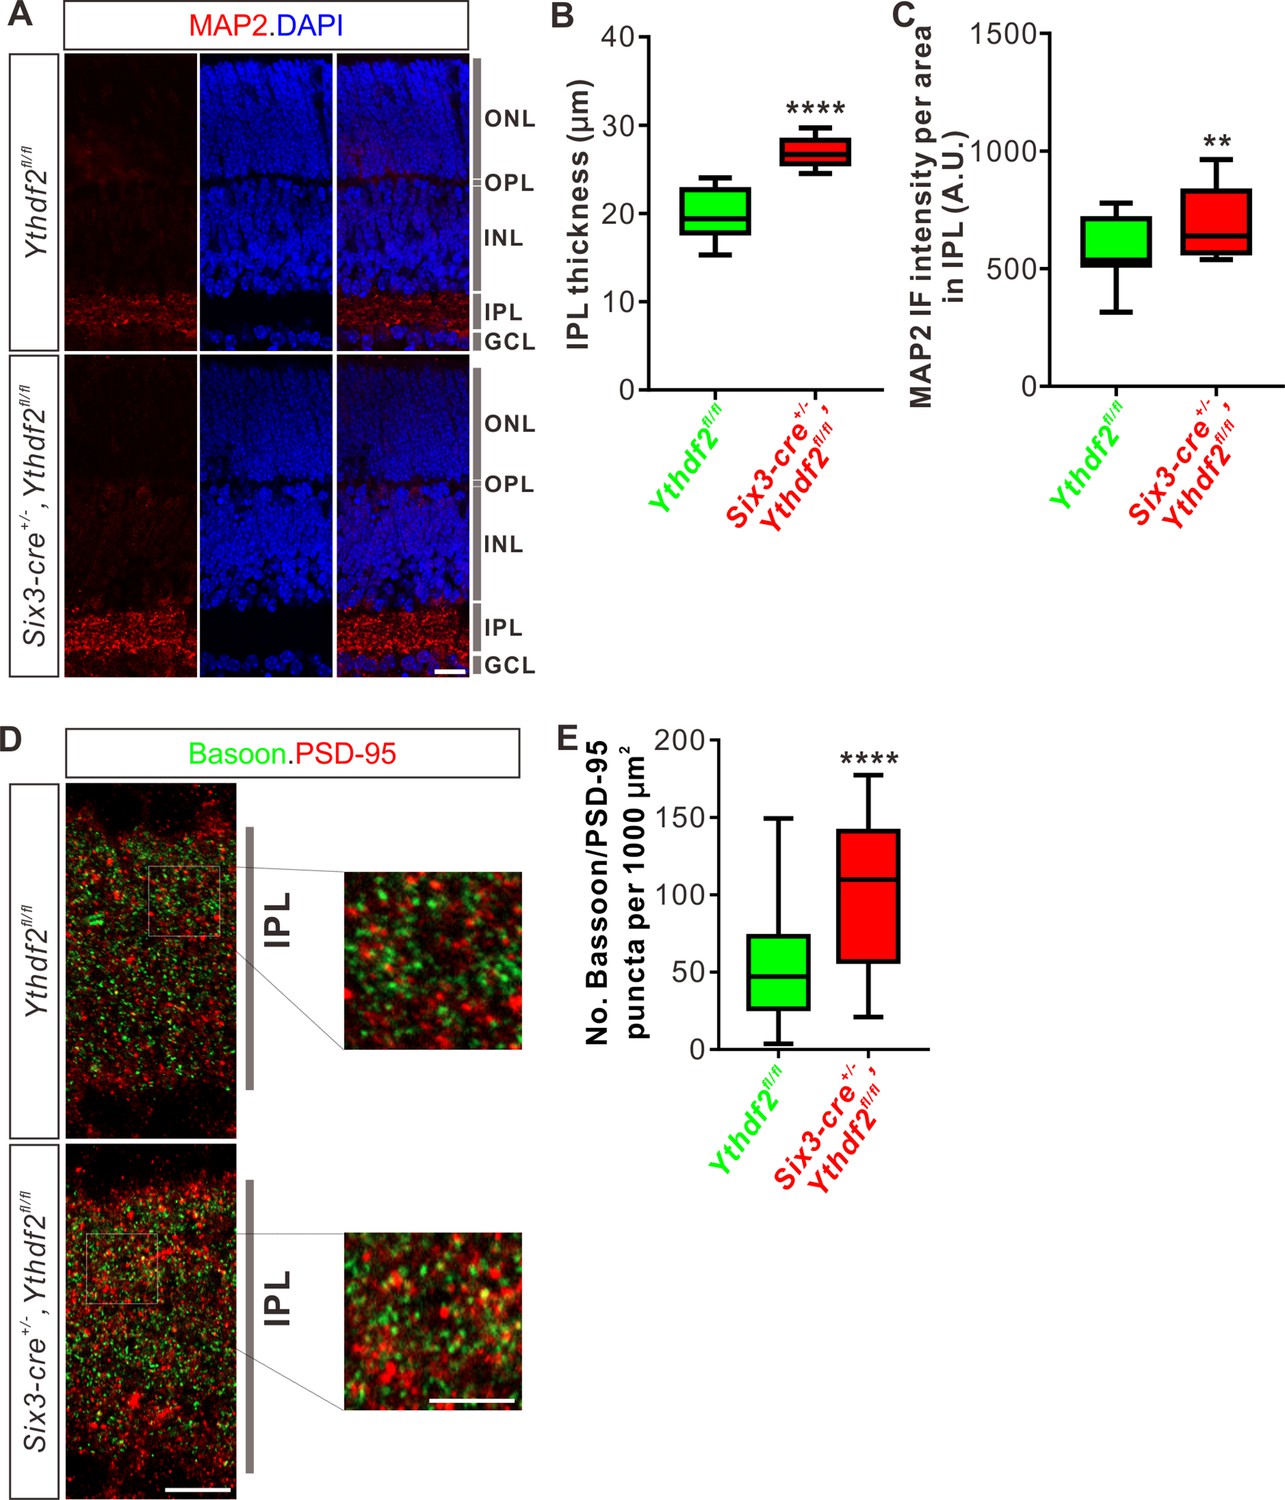
Inner plexiform layer (IPL) of the Ythdf2 conditional knockout (cKO) retina is thicker and has more synapses.
(A) Cross-sections of P6 Six3-cre+/-,Ythdf2fl/fl retina showing increased IPL thickness by MAP2 staining compared with littermate control. ONL, outer nuclear layer; OPL, outer plexiform layer; INL, inner nuclear layer; IPL, inner plexiform layer; GCL, granule cell layer. Scale bar: 20 μm. (B, C) Quantification showing increased IPL thickness and MAP2 IF intensity per area in IPL of the Ythdf2 cKO retina (A). Quantification data are represented as box and whisker plots: ****p = 1.28E-07 for B (n = 12 sections for each genotype), by unpaired Student’s t test; **p = 0.0045 for C (n = 12 sections for each genotype), by paired Student’s t test. (D, E) Representative confocal images showing the excitatory synapses labeled by colocalization of Bassoon (presynaptic) and PSD-95 (postsynaptic) in the IPL of P30 retina (D). There are significantly more synapses in the Ythdf2 cKO IPL compared with control. Quantification data are represented as box and whisker plots (E): n = 47 confocal fields for Ythdf2fl/fl, n = 23 confocal fields for Six3-cre+/-,Ythdf2fl/fl; ****p = 1.63E-05; by unpaired Student’s t test. Scale bars: 10 μm (D) and 5 μm (inset in D).
Figure 4—figure supplement 1
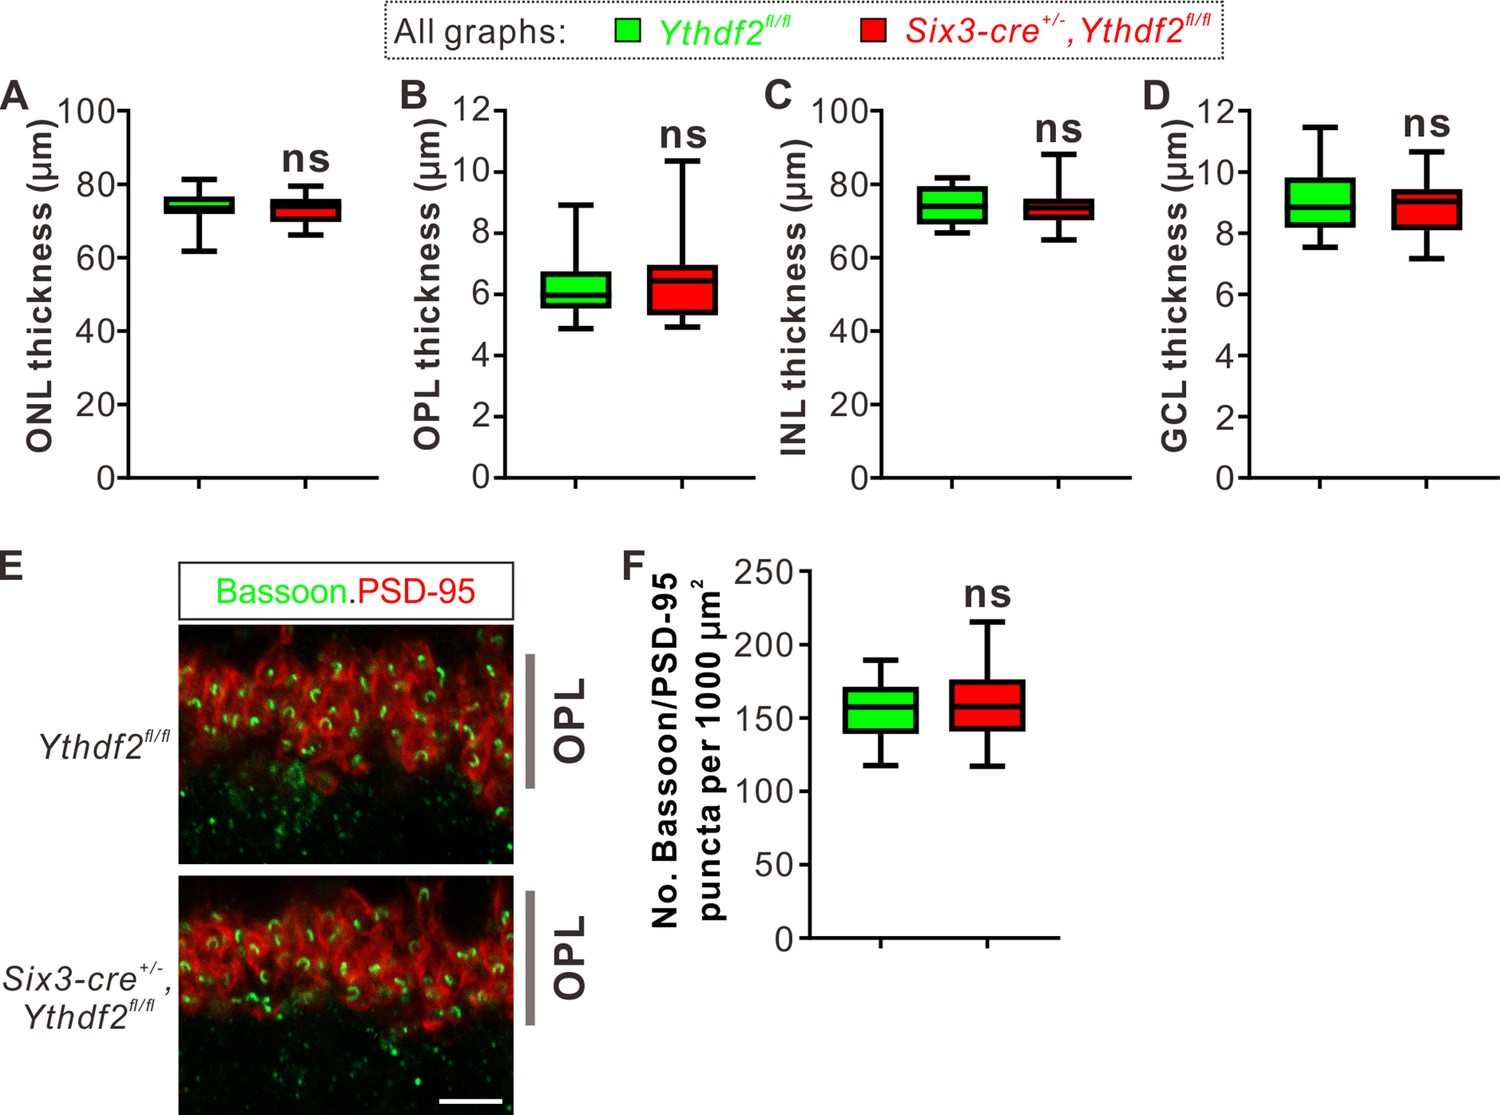
Thickness or synapse numbers in outer plexiform layer (OPL) shows no difference between the Ythdf2 conditional knockout (cKO) and control retinas.
(A–D) Quantification of the thickness of different layers by MAP2/DAPI IF in P6 Ythdf2 cKO and control retinas as shown in Figure 4A. Data are represented as box and whisker plots: n = 14 sections for each genotype; p = 0.60 for ONL in A, p = 0.61 for OPL in B, p = 0.84 for INL in C, p = 0.62 for granule cell layer (GCL) in D; ns, not significant; by unpaired Student’s t test. (E, F) Representative confocal images showing the excitatory ribbon synapses labeled by colocalization of Bassoon (presynaptic) and PSD-95 (postsynaptic) in the OPL of P30 retina (E), which shows no difference between Ythdf2 cKO and control. Quantification data are represented as box and whisker plots (F): n = 39 confocal fields for Ythdf2fl/fl, n = 36 confocal fields for Six3-cre+/-,Ythdf2fl/fl; p = 0.66; ns, not significant; by unpaired Student’s t test. Scale bar: 5 μm.
Figure 5 with 1 supplement
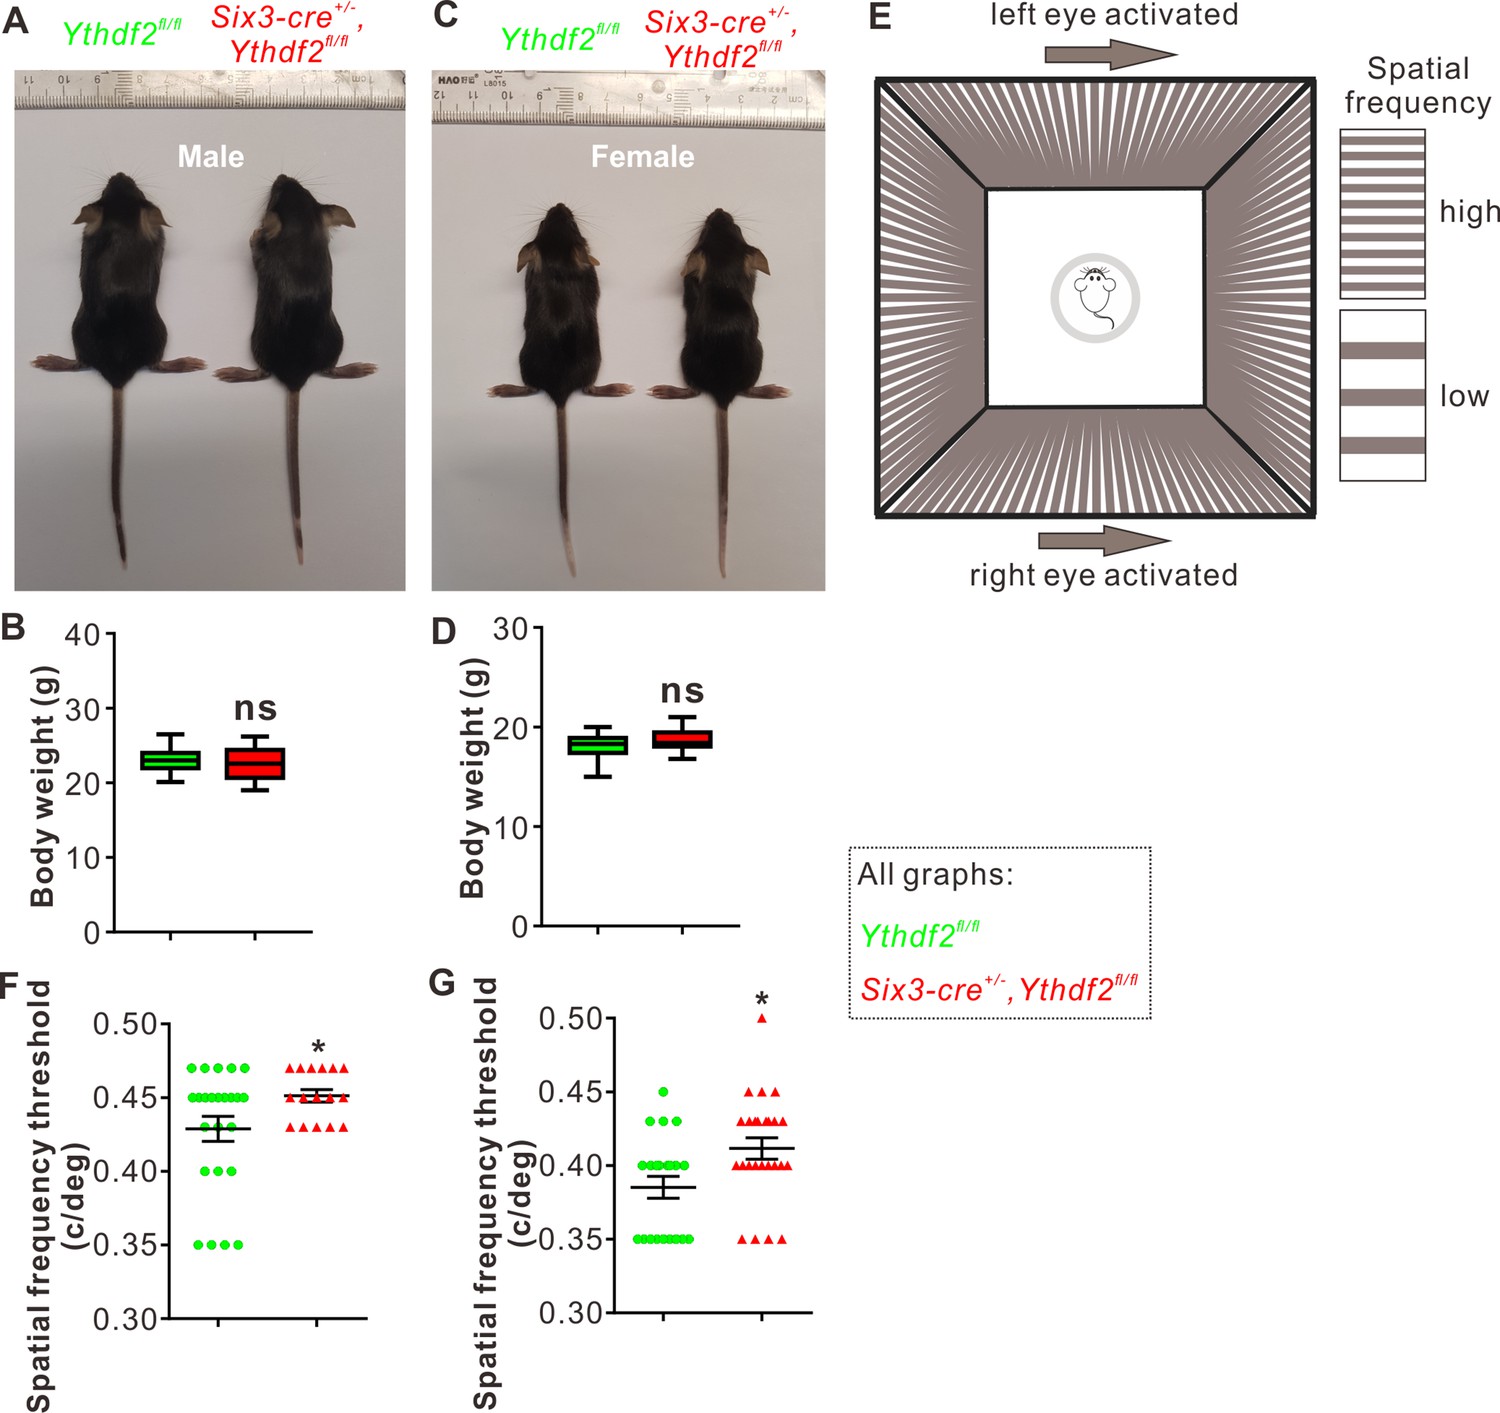
Visual acuity is improved for the Ythdf2 conditional knockout (cKO) mice.
(A–D) Six3-Cre-mediated Ythdf2 cKO showing normal animal development and body weight (male in A, female in C). Quantification data of body weight (B, D) are represented as box and whisker plots: p = 0.41 in B (male, n = 24 for control, n = 18 for cKO); P = 0.08 in D (female, n = 23 for control, n = 25 for cKO); ns, not significant; by unpaired Student’s t test. (E) The setup of optomotor response assay is illustrated by schematic drawing. (F, G) Optomotor response assay demonstrating improved visual acuity in the Ythdf2 cKO mice. Quantification data are mean ± SEM: *p = 0.048 in F (male, n = 24 control, n = 16 cKO); *p = 0.015 in G (female, n = 21 control, n = 25 cKO); by unpaired Student’s t test.
Figure 5—figure supplement 1
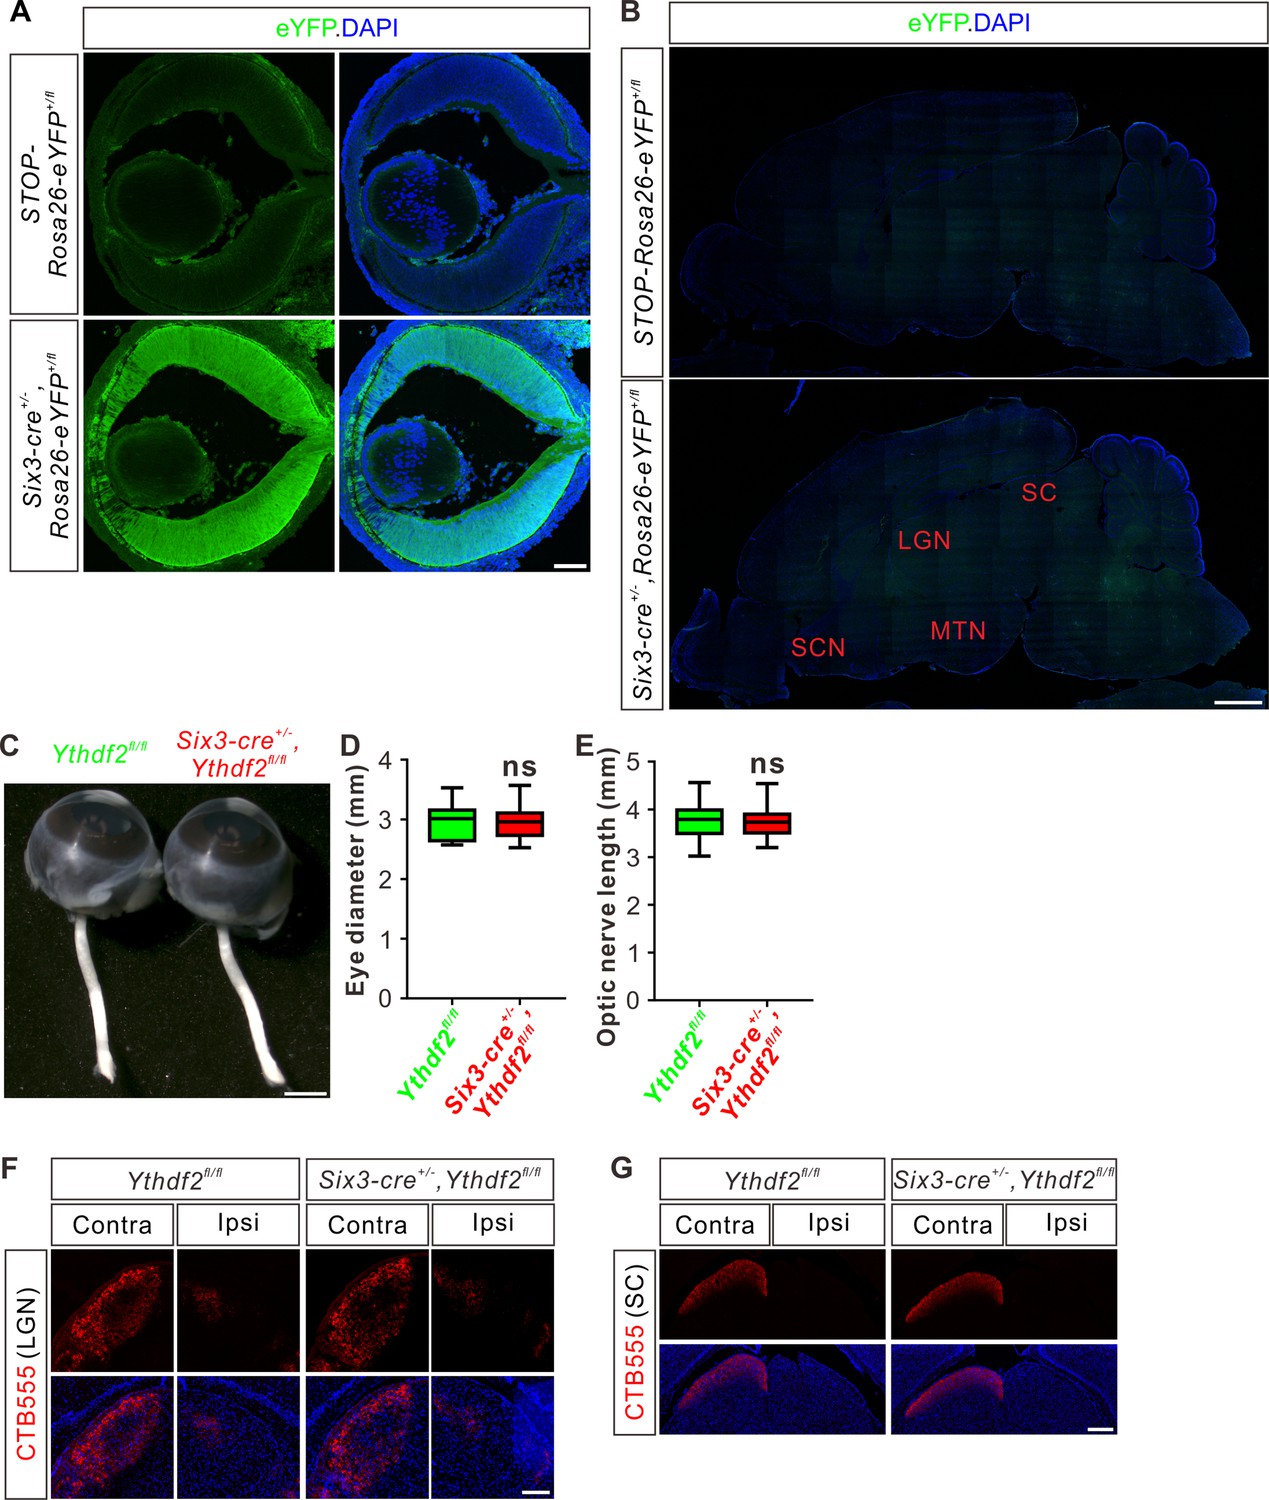
Guidance or central targeting of optic nerves is not affected in Six-Cre-mediated Ythdf2 conditional knockout (cKO).
(A) Cross-sections of E14.5 retina showing strong expression of Six3-Cre using an eYFP reporter. Scale bar: 100 μm. (B) Sagittal sections of P10 brain showing negligible expression of Six3-Cre in the potential retinal ganglion cell (RGC) target regions in the brain. SCN, suprachiasmatic nucleus; LGN, lateral geniculate nucleus; MTN, medial terminal nucleus; SC, superior colliculus. Scale bar: 1 mm. (C–E) Normal eye diameter and optic nerve length. Quantification data (D, E) are represented as box and whisker plots: p = 0.80 (n = 31 for each genotype in D); p = 0.99 (n = 31 for each genotype in E); ns, not significant; by unpaired Student’s t test. Scale bar: 1 mm. (F, G) Representative images of coronal sections through the LGN (F) and SC (G) after unilateral injection of cholera toxin subunit B (CTB)-Alexa Fluor 555 at P37 in Ythdf2 cKO and control mice. Projections to the contralateral (Contra), ipsilateral (Ipsi) LGN and contralateral (Contra) SC are visible, which shows no difference between Ythdf2 cKO and control mice. Scale bars: 100 μm (F) and 200 μm (G).
Figure 6
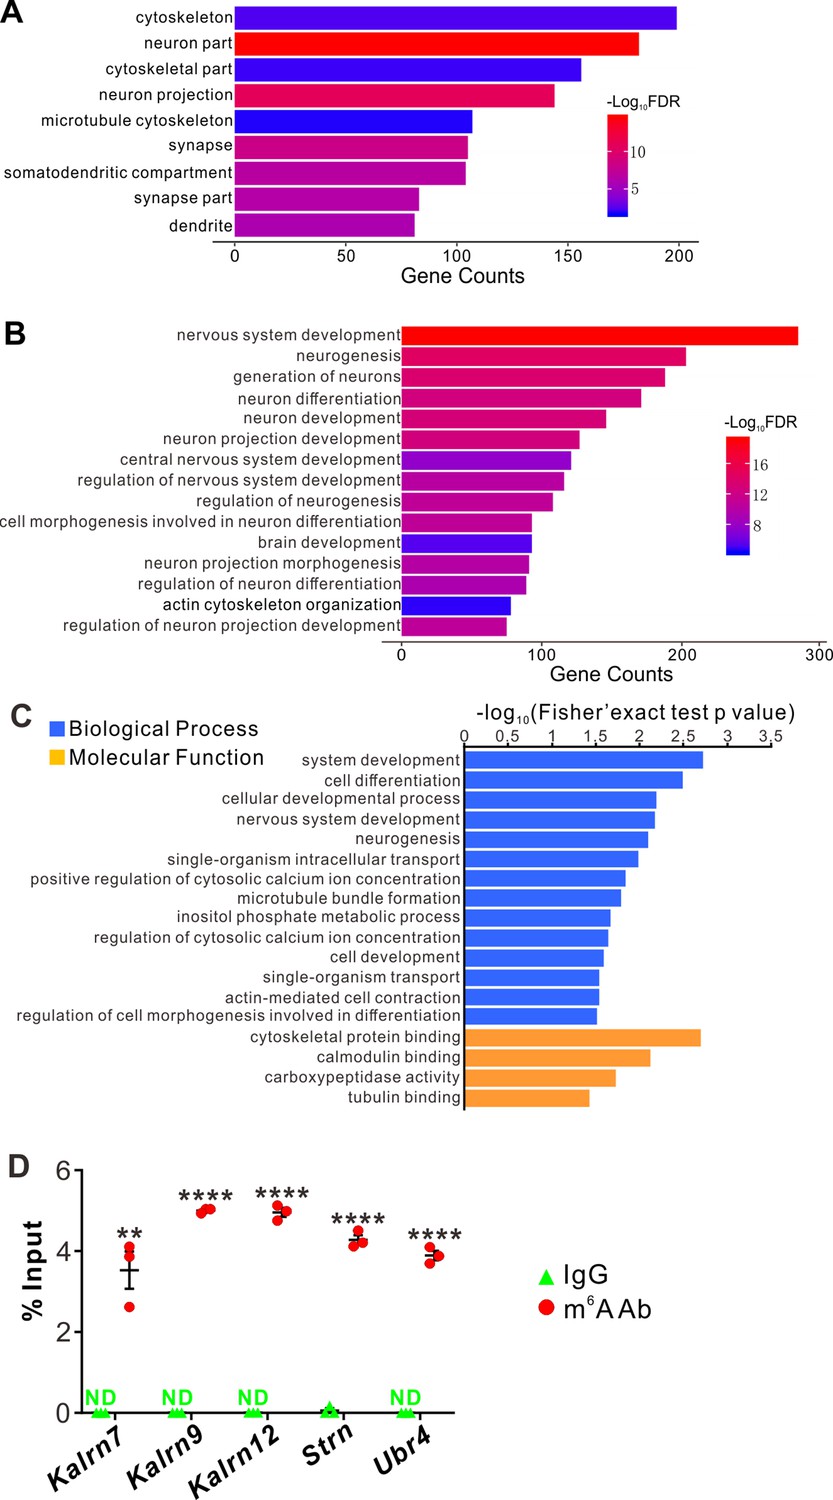
YTHDF2 target mRNAs were identified with transcriptomic and proteomic analysis.
(A, B) Gene Ontology (GO) analysis of YTHDF2 target transcripts identified by anti-YTHDF2 RNA immunoprecipitation (RIP) in the retina followed by RNA sequencing (RIP-Seq). Neural terms were picked out in cellular component (A) and biological process (B). (C) GO analysis of proteins which are upregulated after YTHDF2 knockodwn (KD) by mass spectrometry (MS). (D) Verification of N6-methyladenosine (m6A) modification of YTHDF2 target mRNAs by anti-m6A pulldown followed by RT-qPCR. ND, not detected. Data are mean ± SEM and are represented as dot plots (n = 3 replicates): **p = 0.0016 for Kalrn7; ****p = 1.40E-08 for Kalrn9; ****p = 1.46E-06 for Kalrn12; ****p = 5.46E-06 for Strn; ****p = 4.90E-06 for Ubr4; by unpaired Student’s t test.
Figure 7 with 1 supplement
YTHDF2 target mRNAs mediate YTHDF2-controlled retinal ganglion cell (RGC) dendrite branching.
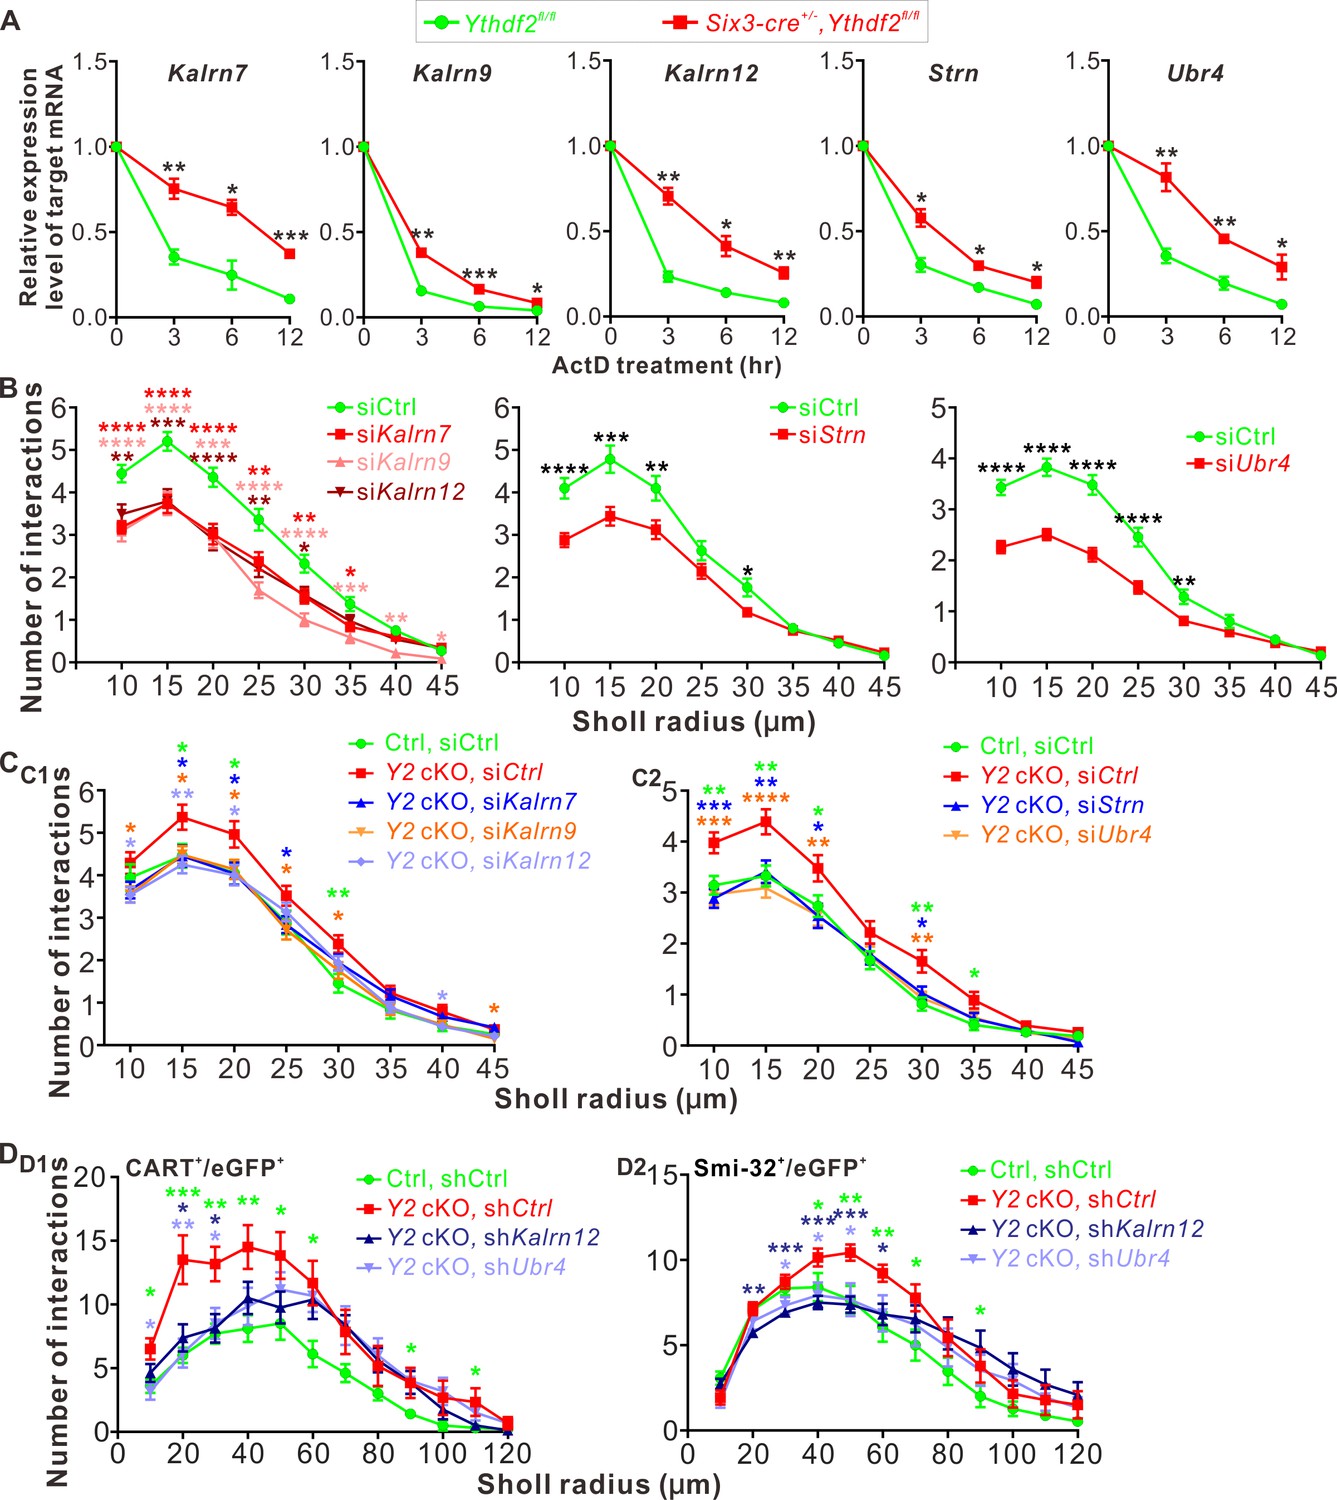
(A) YTHDF2 target mRNAs showing increased stability in the Ythdf2 conditional knockout (cKO) retina. RGCs dissected from E14.5 Ythdf2 cKO and control embryos were cultured, treated with actinomycin D (ActD), and collected at different timepoints. Data are mean ± SEM (n = 3 replicates). For Kalrn7, **p = 0.0057 (3 hr), *p = 0.014 (6 hr), ***p = 0.00039 (12 hr); for Kalrn9, **p = 0.0036 (3 hr), ***p = 0.00090 (6 hr), *p = 0.032 (12 hr); for Kalrn12, **p = 0.0012 (3 hr), *p = 0.010 (6 hr), **p = 0.0069 (12 hr); for Strn, *p = 0.014 (3 hr), *p = 0.012 (6 hr), *p = 0.016 (12 hr); for Ubr4, **p = 0.0077 (3 hr), **p = 0.0059 (6 hr), *p = 0.041 (12 hr); all by unpaired Student’s t test. (B) Knockdown (KD) of the target mRNAs causing decreased dendrite branching of cultured RGCs prepared from wild type (WT) E14.5 retina by Sholl analysis. Brn3a and MAP2 IF were used to mark RGCs and visualize dendrites. Data are mean ± SEM. For Kalrn7 (n = 59 for siCtrl, n = 56 for siKalrn7), ****p = 2.33E-06 (10 μm), ****p = 5.85E-06 (15 μm), ****p = 8.67E-05 (20 μm), **p = 0.0045 (25 μm), **p = 0.0058 (30 μm), *p = 0.010 (35 μm); for Kalrn9 (n = 59 for siCtrl, n = 46 for siKalrn9), ****p = 3.69E-05 (10 μm), ****p = 5.53E-05 (15 μm), ***p = 0.00020 (20 μm), ****p = 3.09E-06 (25 μm), ****p = 4.63E-06 (30 μm), ***p = 0.00059 (35 μm), **p = 0.0010 (40 μm), *p = 0.042 (45 μm); for Kalrn12 (n = 59 for siCtrl, n = 39 for siKalrn12), **p = 0.0031 (10 μm), ***p = 0.00017 (15 μm), ****p = 6.56E-05 (20 μm), **p = 0.0017 (25 μm), *p = 0.017 (30 μm); for Strn (n = 51 for siCtrl, n = 57 for siStrn), ****p = 4.19E-05 (10 μm), ***p = 0.00067 (15 μm), **p = 0.0079 (20 μm), *p = 0.015 (30 μm); for Ubr4 (n = 81 for siCtrl, n = 81 for siUbr4), ****p = 1.26E-08 (10 μm), ****p = 7.61E-10 (15 μm), ****p = 2.35E-08 (20 μm), ****p = 1.39E-05 (25 μm), **p = 0.0061 (30 μm); all by unpaired Student’s t test. (C) Increased dendrite branching of cultured RGCs prepared from E14.5 Ythdf2 cKO (Y2 cKO) retina was rescued by KD of target mRNAs using siRNAs. Data are mean ± SEM. Ctrl, Ythdf2fl/fl; Y2 cKO, Six3-cre+/-,Ythdf2fl/fl. In C1,'Ctrl, siCtrl’ (n = 35 neurons) vs. ‘Y2 cKO, siCtrl’ (n = 52 neurons), *p = 0.038 (15 μm), *p = 0.045 (20 μm), **p = 0.0036 (30 μm); ‘Y2 cKO, siKalrn7’ (n = 55 neurons) vs. ‘Y2 cKO, siCtrl’, *p = 0.020 (15 μm), *p = 0.025 (20 μm), *p = 0.031 (25 μm); ‘Y2 cKO, siKalrn9’ (n = 66 neurons) vs. ‘Y2 cKO, siCtrl’, *p = 0.020 (10 μm), *p = 0.013 (15 μm), *p = 0.031 (20 μm), *p = 0.017 (25 μm), *p = 0.031 (30 μm), *p = 0.031 (45 μm); ‘Y2 cKO, siKalrn12’ (n = 80 neurons) vs. ‘Y2 cKO, siCtrl’, *p = 0.015 (10 μm), **p = 0.0018 (15 μm), *p = 0.015 (20 μm), *p = 0.027 (40 μm). In C2, 'Ctrl, siCtrl’ (n = 50 neurons) vs. ‘Y2 cKO, siCtrl’ (n = 47 neurons), **p = 0.0031 (10 μm), **p = 0.0013 (15 μm), *p = 0.029 (20 μm), **p = 0.0015 (30 μm), *p = 0.014 (35 μm); ‘Y2 cKO, siStrn’ (n = 45 neurons) vs. ‘Y2 cKO, siCtrl’, ***p = 0.00016 (10 μm), **p = 0.0043 (15 μm), *p = 0.010 (20 μm), *p = 0.018 (30 μm); ‘Y2 cKO, siUbr4’ (n = 57 neurons) vs. ‘Y2 cKO, siCtrl’, ***p = 0.00084 (10 μm), ****p = 4.89E-05 (15 μm), **p = 0.0058 (20 μm), **p = 0.0045 (30 μm). All by unpaired Student’s t test. (D) Increased dendrite branching of RGC subtypes in Ythdf2 cKO (Y2 cKO) retina was rescued by KD of target mRNAs through intravitreal injection of AAV shRNAs in vivo. Data are mean ± SEM. Ctrl, Ythdf2fl/fl; Y2 cKO, Six3-cre+/-,Ythdf2fl/fl. In D1 (CART+/eGFP+ ooDSGCs), ‘Ctrl, shCtrl’ (n = 10 neurons) vs. ‘Y2 cKO, shCtrl’ (n = 6 neurons), *p = 0.010 (10 μm), ***p = 0.00049 (20 μm), **p = 0.0021 (30 μm), **p = 0.0047 (40 μm), *p = 0.028 (50 μm), *p = 0.011 (60 μm), *p = 0.030 (90 μm), *p = 0.042 (110 μm); ‘Y2 cKO, shKalrn12’ (n = 8 neurons) vs. ‘Y2 cKO, shCtrl’, *p = 0.012 (20 μm), *p = 0.014 (30 μm); ‘Y2 cKO, shUbr4’ (n = 6 neurons) vs. ‘Y2 cKO, shCtrl’, *p = 0.011 (10 μm), **p = 0.0084 (20 μm), *p = 0.029 (30 μm). In D2 (SMI-32+αRGCs), ‘Ctrl, shCtrl’ (n = 14 neurons) vs. ‘Y2 cKO, shCtrl’ (n = 14 neurons), *p = 0.032 (40 μm), **p = 0.0019 (50 μm), **p = 0.0014 (60 μm), *p = 0.015 (70 μm), *p = 0.044 (90 μm); ‘Y2 cKO, shKalrn12’ (n = 26 neurons) vs. ‘Y2 cKO, shCtrl’, **p = 0.0023 (20 μm), ***p = 0.00076 (30 μm), ***p = 0.00030 (40 μm), ***p = 0.00020 (50 μm), *p = 0.015 (60 μm); ‘Y2 cKO, shUbr4’ (n = 15 neurons) vs. ‘Y2 cKO, shCtrl’, *p = 0.042 (30 μm), *p = 0.024 (40 μm), *p = 0.018 (50 μm). All by unpaired Student’s t test.
Figure 7—figure supplement 1
YTHDF2 target mRNAs were characterized and validated.
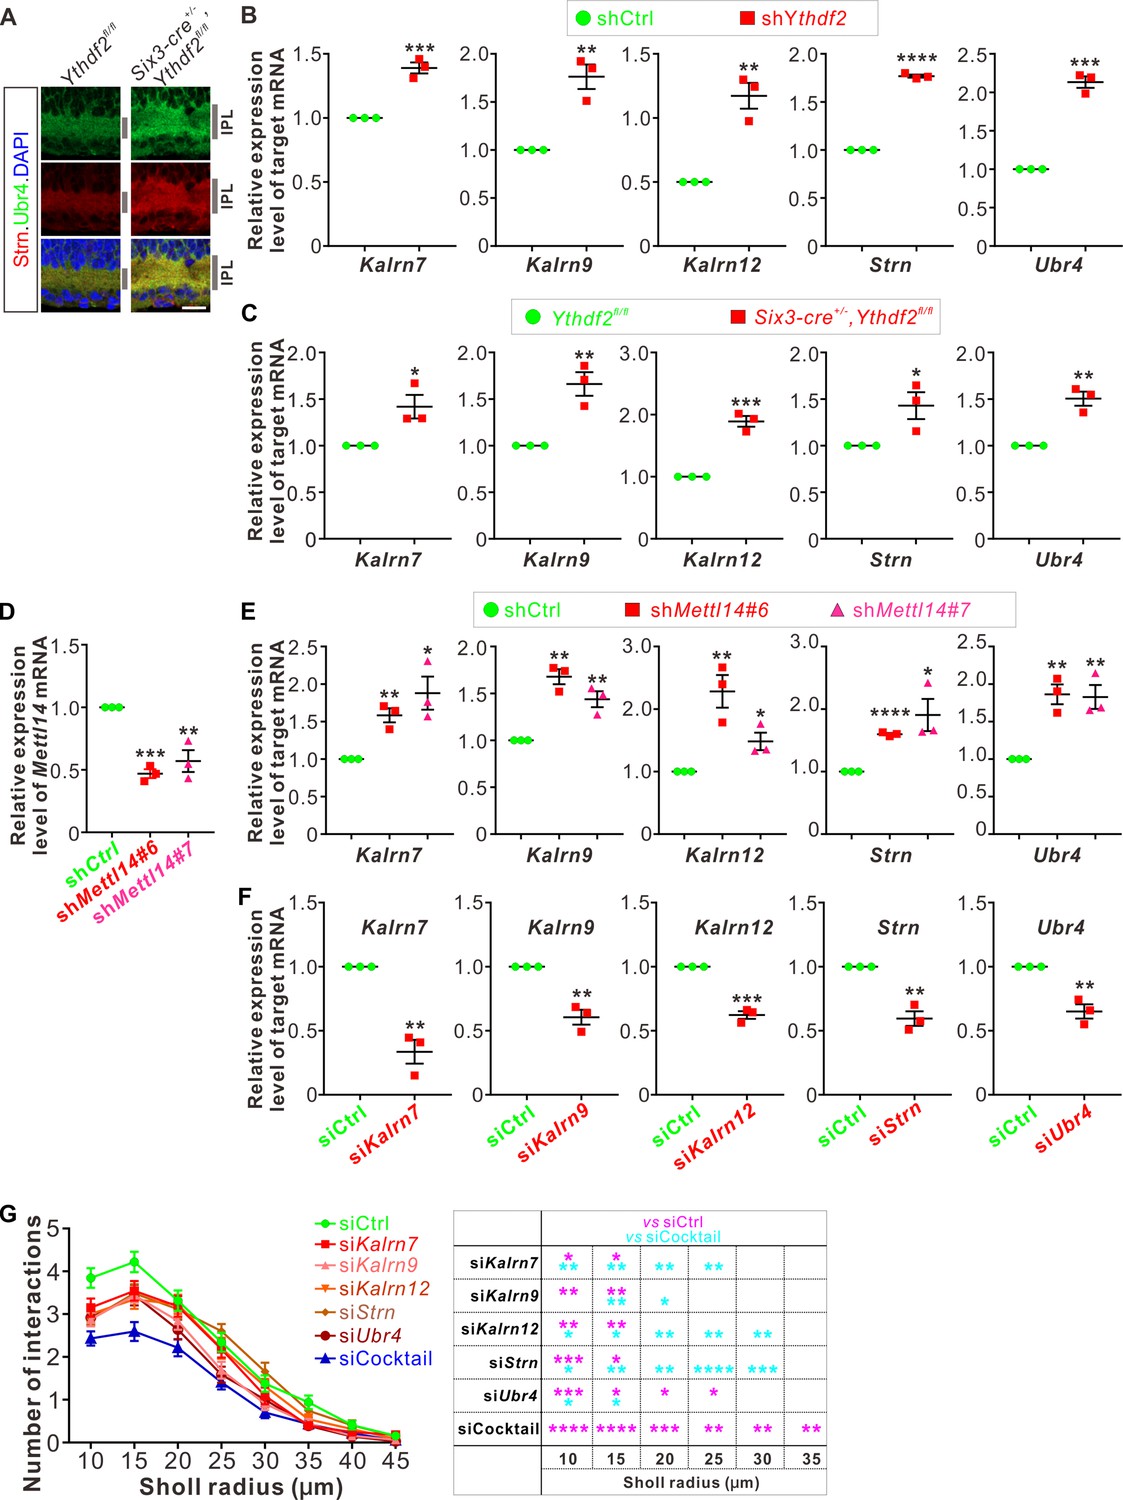
(A) Upregulation of target mRNAs-encoding proteins Strn and Ubr4 in Ythdf2 conditional knockout (cKO) retina in vivo. Enrichment and higher levels of these proteins were detected in the inner plexiform layer (IPL) of P6 Ythdf2 cKO retina compared with control by IF. Scale bar: 20 μm. (B) Upregulation of target mRNA levels after YTHDF2 knockdown (KD). RT-qPCR confirmed upregulation of the candidate target mRNAs after KD of YTHDF2 in cultured retinal ganglion cells (RGCs) using shYthdf2. Data are mean ± SEM and are represented as dot plots (n = 3 replicates): ***p = 0.00084 for Kalrn7; **p = 0.0039 for Kalrn9; **p = 0.0026 for Kalrn12; ****p = 1.11E-06 for Strn; ***p = 0.00011 for Ubr4; by unpaired Student’s t test. (C) Upregulation of target mRNA levels in the Ythdf2 cKO retina were confirmed by RT-qPCR. Data are mean ± SEM and are represented as dot plots (n = 3 replicates): *p = 0.030 for Kalrn7; **p = 0.0064 for Kalrn9; ***p = 0.00049 for Kalrn12; *p = 0.041 for Strn; **p = 0.0027 for Ubr4; by unpaired Student’s t test. (D) Confirmation of METTL14 KD in cultured RGCs using shMettl14 by RT-qPCR. Data are mean ± SEM and are represented as dot plots (n = 3 replicates): ***p = 0.00012 (shMettl14#6 vs. shCtrl); **p = 0.0079 (shMettl14#7 vs. shCtrl); by unpaired Student’s t test. (E) Upregulation of target mRNA levels after METTL14 KD. RT-qPCR confirmed upregulation of the candidate target mRNAs after KD of METTL14 in cultured RGCs using shMettl14. Data are mean ± SEM and are represented as dot plots (n = 3 replicates): for Kalrn7, **p = 0.0034 (shMettl14#6 vs. shCtrl), *p = 0.016 (shMettl14#7 vs. shCtrl); for Kalrn9, **p = 0.0010 (shMettl14#6 vs. shCtrl), **p = 0.0067 (shMettl14#7 vs. shCtrl); for Kalrn12, **p = 0.0079 (shMettl14#6 vs. shCtrl), *p = 0.026 (shMettl14#7 vs. shCtrl); for Strn, ****p = 5.45E-06 (shMettl14#6 vs. shCtrl), *p = 0.025 (shMettl14#7 vs. shCtrl); for Ubr4, **p = 0.0029 (shMettl14#6 vs. shCtrl), **p = 0.0066 (shMettl14#7 vs. shCtrl); by unpaired Student’s t test. (F) Confirmation of KD by siRNAs against target mRNAs. Data are mean ± SEM and are represented as dot plots (n = 3 replicates): **p = 0.0020 for Kalrn7; **p = 0.0025 for Kalrn9; ***p = 0.00020 for Kalrn12; **p = 0.0021 for Strn; **p = 0.0033 for Ubr4; by unpaired Student’s t test. (G) KD of target mRNAs all together using an siRNA cocktail causing further decrease of dendrite branching of cultured RGCs compared with single siRNA against each target mRNA. Data are mean ± SEM: n = 32 RGCs for siCtrl, n = 33 RGCs for siKalrn7, n = 32 RGCs for siKalrn9, n = 35 RGCs for siKalrn12, n = 35 RGCs for siStrn, n = 36 RGCs for siUbr4, n = 36 RGCs for siCocktail. siKalrn7 vs. siCtrl: *p = 0.031 (10 μm), *p = 0.046 (15 μm); siKalrn9 vs. siCtrl: **p = 0.0011 (10 μm), **p = 0.0090 (15 μm); siKalrn12 vs. siCtrl: **p = 0.0061 (10 μm), **p = 0.0086 (15 μm); siStrn vs. siCtrl: ***p = 0.00056 (10 μm), *p = 0.025 (15 μm); siUbr4 vs. siCtrl: **p = 0.0018 (10 μm), *p = 0.026 (15 μm), *p = 0.048 (20 μm), *p = 0.011 (25 μm); siCocktail vs. siCtrl: ****p = 3.44E-06 (10 μm), ****p = 4.07E-06 (15 μm), ***p = 0.00077 (20 μm), **p = 0.0010 (25 μm), **p = 0.0049 (30 μm), **p = 0.0094 (35 μm). siKalrn7 vs. siCocktail: **p = 0.0092 (10 μm), **p = 0.0040 (15 μm), **p = 0.0028 (20 μm), **p = 0.0034 (25 μm); siKalrn9 vs. siCocktail: **p = 0.0042 (15 μm), *p = 0.034 (20 μm); siKalrn12 vs. siCocktail: *p = 0.029 (10 μm), *p = 0.019 (15 μm), **p = 0.0014 (20 μm), **p = 0.0091 (25 μm), **p = 0.0063 (30 μm); siStrn vs. siCocktail: *p = 0.043 (10 μm), **p = 0.0051 (15 μm), **p = 0.0045 (20 μm), ****p = 3.79E-06 (25 μm), ***p = 0.00022 (30 μm); siUbr4 vs. siCocktail: *p = 0.049 (10 μm), *p = 0.011 (15 μm). All by unpaired Student’s t test.
Figure 8 with 1 supplement
Ythdf2 conditional knockout (cKO) retina is more resistant to acute ocular hypertension (AOH).
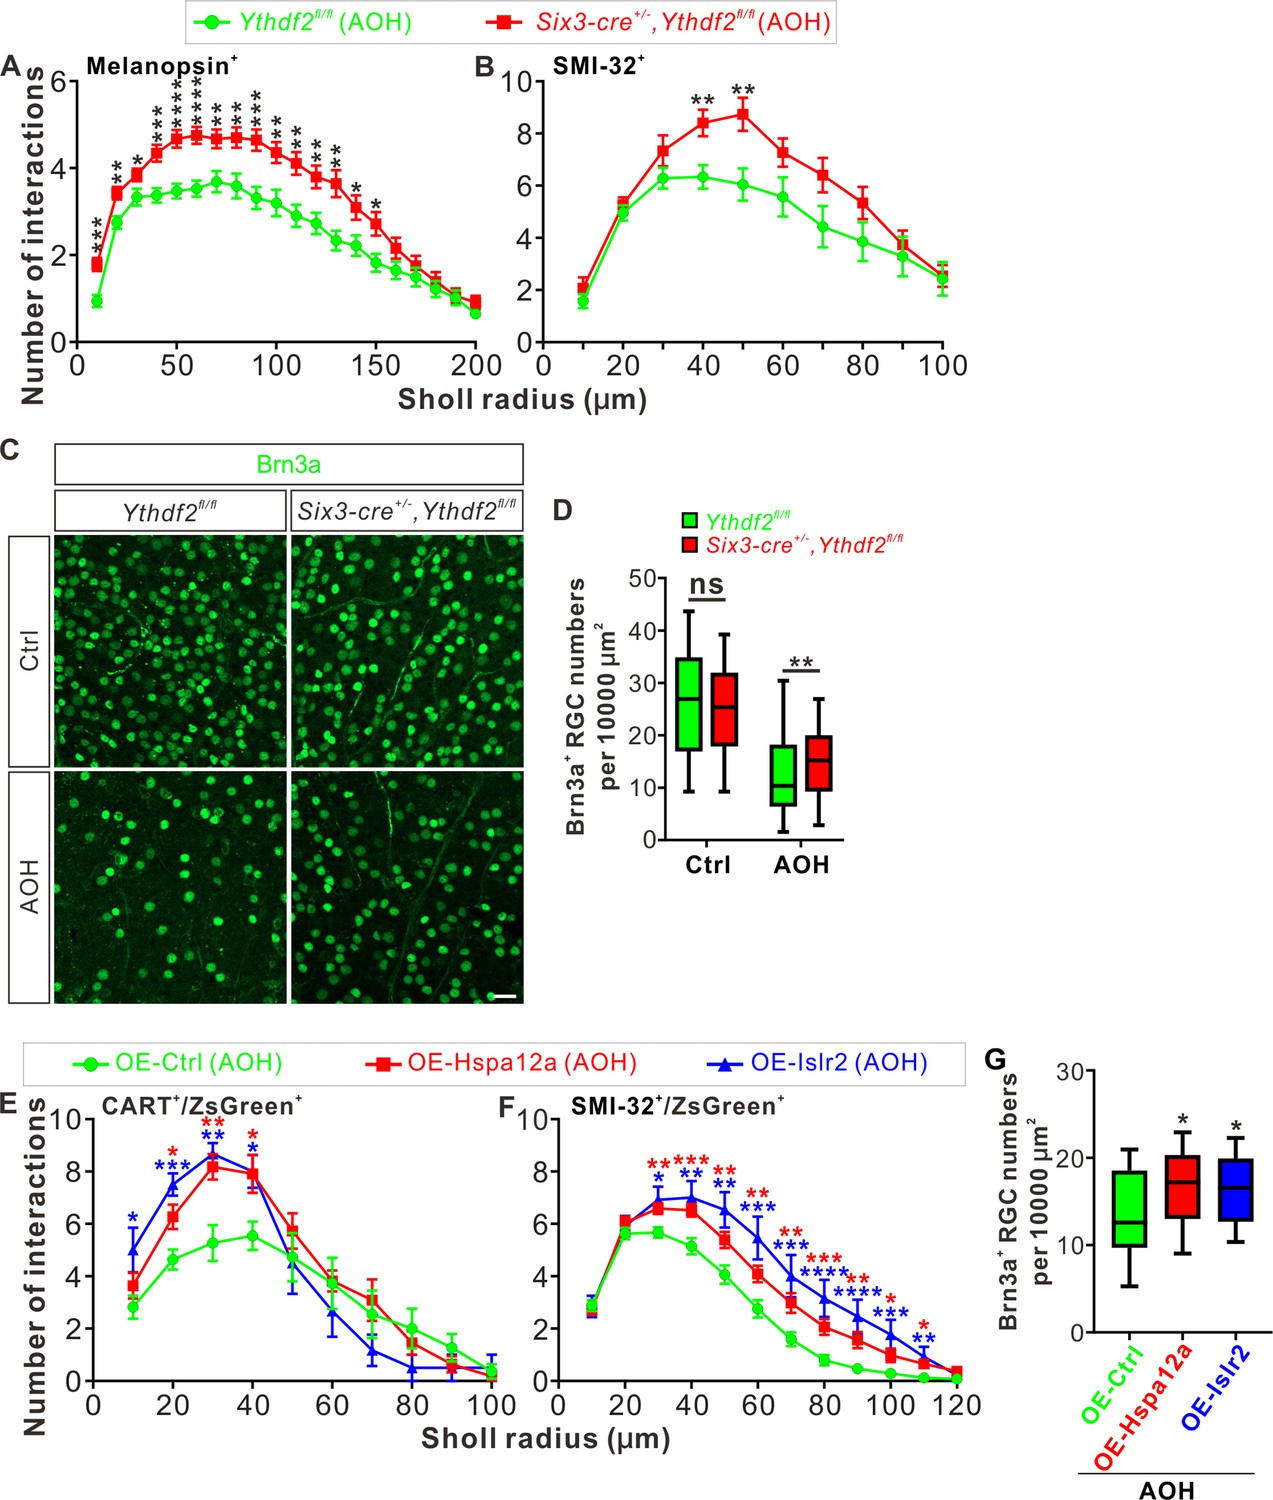
(A, B) Better maintenance of retinal ganglion cell (RGC) dendrite arborization in Ythdf2 cKO retina after AOH operation. AOH was performed using adult mice, and retinas were collected after AOH for wholemount immunostaining of melanopsin and SMI-32 to visualize the dendrite arbors of corresponding RGC subtype, respectively. Dendrite traces were drawn as previously shown and quantification of dendrite branching was done using Sholl analysis. Data are mean ± SEM. Numbers of interactions are significantly greater in Six3-cre+/-,Ythdf2fl/fl retina than Ythdf2fl/fl control retina in both RGC subtypes after AOH: for melanopsin+ intrinsically photosensitive RGCs (ipRGCs) in A, Ythdf2fl/fl/AOH (n = 51 RGCs) vs. cKO/AOH (n = 64 RGCs), ***p = 0.00015 (10 μm), **p = 0.0017 (20 μm), *p = 0.034 (30 μm), ***p = 0.00035 (40 μm), ****p = 3.02E-05 (50 μm), ****p = 2.63E-05 (60 μm), **p = 0.0029 (70 μm), **p = 0.0028 (80 μm), ***p = 0.00035 (90 μm), **p = 0.0032 (100 μm), **p = 0.0014 (110 μm), **p = 0.0043 (120 μm), **p = 0.0014 (130 μm), *p = 0.023 (140 μm), *p = 0.013 (150 μm); for SMI-32+αRGCs in B, Ythdf2fl/fl/AOH (n = 21 neurons) vs. cKO/AOH (n = 15 neurons), **p = 0.0052 (40 μm), **p = 0.0057 (50 μm); all by unpaired Student’s t test. (C, D) Ythdf2 cKO retina showing less severe RGC loss after AOH. AOH was performed using adult mice and retinas were collected after AOH for wholemount immunostaining using a Brn3a antibody (C). Numbers of Brn3a+ RGCs per 10,000 μm2 of retina were quantified for different genotypes and conditions (confocal fields for analysis: n = 117 for Ythdf2fl/fl/Ctrl; n = 98 for Ythdf2fl/fl/AOH; n = 110 for cKO/Ctrl; n = 104 for cKO/AOH). Data are represented as box and whisker plots (D): ns, not significant (p = 0.16; Ythdf2fl/fl/Ctrl vs. cKO/Ctrl); **p = 0.0077 (Ythdf2fl/fl/AOH vs. cKO/AOH); by unpaired Student’s t test. Scale bar: 25 μm. (E, F) Overexpression (OE) of YTHDF2 targets Hspa12a and Islr2 protecting retina from RGC dendrite degeneration in the AOH model. Wild type (WT) mice were intravitreally injected with AAV overexpressing Hspa12a or Islr2 and then operated with AOH. Wholemount immunostaining of CART/ZsGreen and SMI-32/ZsGreen was carried out to visualize the dendrite arbors of corresponding RGC subtype, respectively. Dendrite traces were drawn as previously shown and quantification of dendrite branching was done using Sholl analysis. Data are mean ± SEM. Numbers of interactions are significantly greater in retina with OE of Hspa12a or Islr2 than control retina in both RGC subtypes after AOH. For CART+ ON-OFF directionally selective RGCs (ooDSGCs) in E: OE-Ctrl/AOH (n = 11 RGCs) vs. OE-Hspa12a/AOH (n = 11 RGCs), *p = 0.014 (20 μm), **p = 0.0025 (30 μm), *p = 0.018 (40 μm); OE-Ctrl/AOH vs. OE-Islr2/AOH (n = 6 RGCs), *p = 0.024 (10 μm), ***p = 0.00031 (20 μm), **p = 0.0038 (30 μm), *p = 0.013 (40 μm). For SMI-32+αRGCs in F: OE-Ctrl/AOH (n = 49 neurons) vs. OE-Hspa12a/AOH (n = 46 neurons), **p = 0.0023 (30 μm), ***p = 0.00080 (40 μm), **p = 0.0059 (50 μm), **p = 0.0051 (60 μm), **p = 0.0036 (70 μm), ***p = 0.00070 (80 μm), **p = 0.0015 (90 μm), *p = 0.016 (100 μm), *p = 0.011 (110 μm); OE-Ctrl/AOH vs. OE-Islr2/AOH (n = 13 RGCs), *p = 0.010 (30 μm), **p = 0.0093 (40 μm), **p = 0.0019 (50 μm), ***p = 0.00085 (60 μm), ***p = 0.00067 (70 μm), ****p = 4.25E-05 (80 μm), ****p = 2.54E-05 (90 μm), ***p = 0.00020 (100 μm) , **p = 0.0016 (110 μm). All by unpaired Student’s t test. (G) OE of YTHDF2 targets Hspa12a and Islr2 alleviating RGC loss in the AOH model. WT mice were intravitreally injected with AAV overexpressing Hspa12a or Islr2 and then operated with AOH. Wholemount immunostaining of Brn3a was performed to label RGCs. Numbers of Brn3a+ RGCs per 10,000 μm2 of retina were quantified for different conditions (confocal fields for analysis: n = 19 for OE-Ctrl; n = 26 for OE-Hspa12a; n = 24 for OE-Islr2). Data are represented as box and whisker plots: *p = 0.034 (OE-Hspa12a vs. OE-Ctrl; *p = 0.029 (OE-Islr2 vs. OE-Ctrl); by unpaired Student’s t test.
Figure 8—figure supplement 1
Hspa12a and Islr2 are two target mRNAs of YTHDF2 in adult retina.
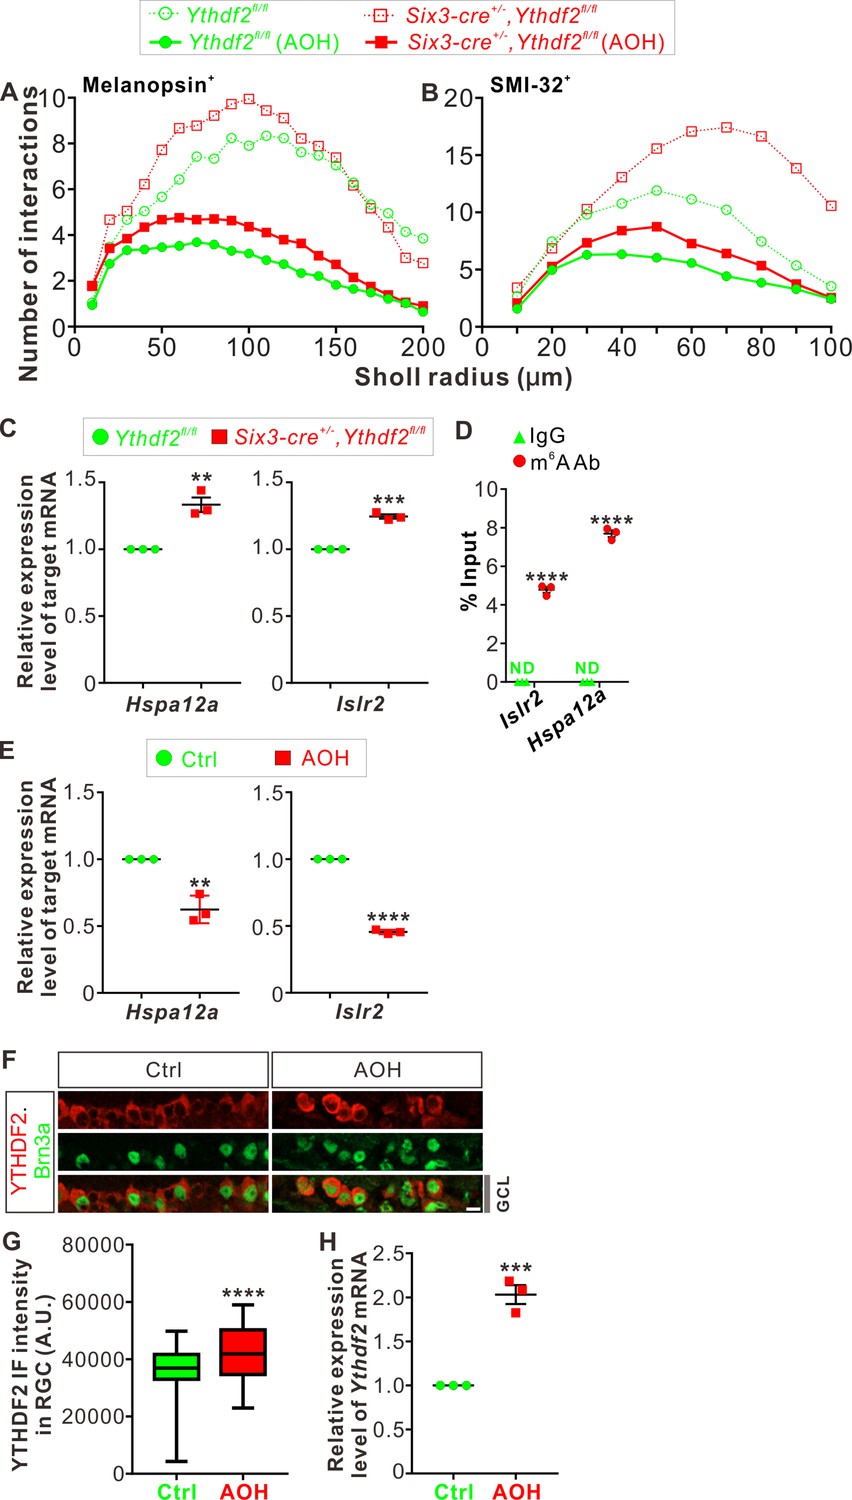
(A, B) The curves from Figures 3D, F, 8A, B were plotted together for easy comparison. The error bars and the asterisks were removed from these graphs for easy reading and these information can still be seen in Figures 3D, F, 8A, B. (C) Upregulation of YTHDF2 target mRNA Hspa12a and Islr2 in adult Ythdf2 conditional knockout (cKO) retina compared with control by RT-qPCR. Data are mean ± SEM and are represented as dot plots (n = 3 replicates): **p = 0.0035 for Hspa12a; ***p = 0.00012 for Islr2; by unpaired Student’s t test. (D) Verification of N6-methyladenosine (m6A) modification of Hspa12a and Islr2 mRNAs by anti-m6A pulldown followed by RT-qPCR. ND, not detected. Data are mean ± SEM and are represented as dot plots (n = 3 replicates): ****p = 7.07E-06 for Islr2; ****p = 1.55E-06 for Hspa12a; by unpaired Student’s t test. (E) Downregulation of Hspa12a and Islr2 mRNA levels in retina 3 days after acute ocular hypertension (AOH). Data are mean ± SEM and are represented as dot plots (n = 3 replicates): **p = 0.0032 for Hspa12a; ****p = 5.41E-07 for Islr2; by unpaired Student’s t test. (F, G) Cross-sections of retina showing increased YTHDF2 expression in Brn3a+ RGCs by IF. AOH was performed using P60 mice, and retinas were collected 1 day after AOH for analysis. Quantification data of YTHDF2 IF were represented as box and whisker plots (G): ****p = 1.13E-06 (n = 110 RGCs for each condition); by unpaired Student’s t test. Scale bar: 10 μm. (H) Upregulation of Ythdf2 mRNA level after AOH. Data are mean ± SEM and are represented as dot plots (n = 3 replicates): ***p = 0.00066; by unpaired Student’s t test.
Author response image 1
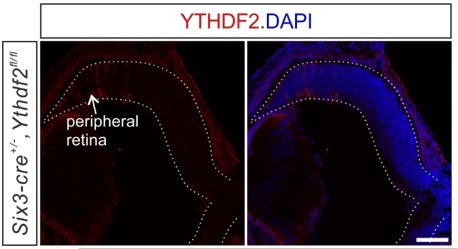
The trace residual expression of YTHDF2 in the peripheral retina of Ythdf2 cKO mice.
The representative confocal images of YTHDF2 IF in E15.5 Ythdf2 cKO retina shows the trace residual expression of YTHDF2 in the peripheral retina of Ythdf2 cKO mice. Scale bar, 100 µm.
Tables
Key resources table
| Reagent type (species) or resource | Designation | Source or reference | Identifiers | Additional information |
|---|---|---|---|---|
| Strain, strain background (mouse) | Mouse: Ythdf2fl/fl | Yu et al., 2021b | N/A | |
| Strain, strain background (mouse) | Mouse: Tg(Six3-cre)69Frty/GcoJ | Jackson Laboratory | Cat#: JAX_019755RRID: IMSR_JAX:019755 | |
| Strain, strain background (mouse) | Mouse: B6.Cg-Tg(Thy1-EGFP)OJrs/GfngJ | Jackson Laboratory | Cat#: JAX_007919RRID: IMSR_JAX:007919 | |
| Strain, strain background (mouse) | Mouse: B6.129 × 1-Gt(ROSA)26Sortm1(EYFP)Cos/J | Jackson Laboratory | Cat#: JAX_006148RRID: IMSR_JAX:006148 | |
| Antibody | Anti-GFP (Chicken polyclonal) | Abcam | Cat#: ab13970, RRID: AB_300798 | IF (1:1000) |
| Antibody | Anti-MAP2 (Chicken polyclonal) | Abcam | Cat#: ab5392, RRID: AB_2138153 | IF (1:10,000) |
| Antibody | Anti-RBPMS (Guinea pig polyclonal) | PhosphoSolutions | Cat#: 1832-RBPMS, RRID: AB_2492226 | IF (1:1000) |
| Antibody | Anti-VAChT (Goat polyclonal) | Millipore | Cat#: ABN100, RRID: AB_2630394 | IF (1:1000) |
| Antibody | Anti-β Actin (Mouse monoclonal) | Abcam | Cat#: ab6276, RRID: AB_2223210 | WB (1:30,000) |
| Antibody | Anti-β Actin (Mouse monoclonal) | ABclonal | Cat#: AC004, RRID: AB_2737399 | WB (1:30,000) |
| Antibody | Anti-AP2α (Mouse monoclonal) | DSHB | Cat#: 3B5, RRID: AB_2313947 | IF (1:1000) |
| Antibody | Anti-Bassoon (Mouse monoclonal) | Enzo Life Sciences | Cat#: ADI-VAM-PS003, RRID: AB_10618753 | IF (1:2500) |
| Antibody | Anti-Brn3a (Mouse monoclonal) | Millipore | Cat#: MAB1585, RRID: AB_94166 | IF (1:300) |
| Antibody | Anti-Calbindin-D-28K (Mouse monoclonal) | Sigma-Aldrich | Cat#: C9848, RRID: AB_476894 | IF (1:200) |
| Antibody | Anti-PKCα (Mouse monoclonal) | Santa Cruz Biotechnology | Cat#: sc-8393, RRID: AB_628142 | IF (1:500) |
| Antibody | Anti-SMI-32 (Mouse monoclonal) | BioLegend | Cat#: 801701, RRID: AB_2564642 | IF (1:200) |
| Antibody | Anti-Strn (Striatin) (Mouse monoclonal) | BD Biosciences | Cat#: 610838, RRID: AB_398157 | IF (1:500) |
| Antibody | Anti-CART (Rabbit polyclonal) | Phoenix Pharmaceuticals | Cat#: H-003–62, RRID: AB_2313614 | IF (1:2000) |
| Antibody | Anti m6A (Rabbit polyclonal) | Synaptic Systems | Cat# 202003, RRID: AB_2279214 | IF (1:200) |
| Antibody | Anti-melanopsin (Rabbit polyclonal) | Thermo Fisher Scientific | Cat#: PA1-780, RRID: AB_2267547 | IF (1:1000) |
| Antibody | Anti-PKCα (Rabbit polyclonal) | Cell Signaling | Cat#: CST-2056 | IF (1:1000) |
| Antibody | Anti-PSD-95 (Mouse monoclonal) | Abcam | Cat#: ab2723, RRID: AB_303248 | IF (1:500) |
| Antibody | Anti-Recoverin (Rabbit polyclonal) | Millipore | Cat#: AB5585, RRID: AB_2253622 | IF (1:1000) |
| Antibody | Anti-YTHDF2 (Rabbit polyclonal) | Proteintech | Cat#: 24744–1-AP, RRID: AB_2687435 | IF (1:1000) |
| Antibody | Anti-YTHDF1 (Rabbit polyclonal) | Proteintech | Cat#: 17479–1-AP, RRID: AB_2217473 | IF (1:1000) |
| Antibody | Anti-YTHDF3 (Rabbit polyclonal) | Abcam | Cat#: ab103328, RRID: AB_10710895 | IF (1:1000) |
| Antibody | Anti-Ubr4 (Rabbit polyclonal) | Abcam | Cat#: ab86738, RRID: AB_1952666 | IF (1:300) |
| Antibody | Anti-Chx10 (Sheep polyclonal) | Exalpha | Cat#: X1179P | IF (1:1000) |
| Antibody | Anti-GFAP (Chicken polyclonal) | Millipore | Cat#: AB5541, RRID: AB_177521 | IF (1:500) |
| Antibody | Anti-Lhx2 (Goat polyclonal) | Santa Cruz Biotechnology | Cat#: sc-19344, RRID: AB_2135660 | IF (1:200) |
| Antibody | Anti-Lhx2 (Rabbit monoclonal) | Abcam | Cat#: ab184337 | IF (1:500) |
| Antibody | Anti-chicken IgY (Alexa 488 donkey) | Jackson Immunoresearch | Cat#: 703-545-155, RRID: AB_2340375 | IF (1:500) |
| Antibody | Anti-G. pig IgG (Alexa 488 donkey) | Jackson Immunoresearch | Cat#: 706-545-148, RRID: AB_2340472 | IF (1:500) |
| Antibody | Anti-mouse IgG (Alexa 488 donkey) | Thermo Fisher Scientific | Cat#: A-21202, RRID: AB_141607 | IF (1:500) |
| Antibody | Anti-rabbit IgG (Alexa 488 donkey) | Thermo Fisher Scientific | Cat#: A-21206, RRID: AB_141708 | IF (1:500) |
| Antibody | Anti-goat IgG (Alexa 555 donkey) | Thermo Fisher Scientific | Cat#: A-21432, RRID: AB_2535853 | IF (1:1000) |
| Antibody | Anti-mouse IgG (Alexa 555 donkey) | Thermo Fisher Scientific | Cat#: A-31570, RRID: AB_2536180 | IF (1:1000) |
| Antibody | Anti-rabbit IgG (Alexa 555 donkey) | Thermo Fisher Scientific | Cat#: A-31572, RRID: AB_162543 | IF (1:1000) |
| Antibody | Anti-sheep IgG (Alexa 555 donkey) | Thermo Fisher Scientific | Cat#: A-21436, RRID: AB_2535857 | IF (1:1000) |
| Antibody | Anti-chicken IgY (Alexa 555 goat) | Thermo Fisher Scientific | Cat#: A-21437, RRID: AB_2535858 | IF (1:1000) |
| Antibody | Anti-mouse IgG (Alexa 647 donkey) | Thermo Fisher Scientific | Cat#: A-31571, RRID: AB_162542 | IF (1:200) |
| Antibody | Anti-mouse IgG (HRP donkey) | Abcam | Cat#: ab97030, RRID: AB_10680919 | WB (1:2500) |
| Antibody | Anti-rabbit IgG (HRP donkey) | Abcam | Cat#: ab16284, RRID: AB_955387 | WB (1:2500) |
| Antibody | Anti-mouse IgG (HRP VHH) | AlpaLife | Cat#: KTSM1321 | WB (1:5000) |
| Antibody | Anti-rabbit IgG (HRP VHH) | AlpaLife | Cat#: KTSM1322 | WB (1:5000) |
| Recombinant DNA reagent | Plasmid: pLKO.1-TRC | Addgene | Addgene plasmid #10878, RRID: Addgene_10878 | |
| Sequence-based reagent | shRNA targeting sequence of negative control | This paper | N/A | GCATCAAGGTG AACTTCAAGA |
| Sequence-based reagent | shRNA targeting sequence of mouse Ythdf2 | Yu et al., 2018 | N/A | GGACGTTCCC AATAGCCAACT |
| Sequence-based reagent | shRNA targeting sequence of mouse Ythdf1 | This paper | N/A | GGACATTGGT ACTTGGGATAA |
| Sequence-based reagent | shRNA targeting sequence of mouse Ythdf3 | This paper | N/A | GGATTTGGCAA TGATACTTTG |
| Sequence-based reagent | shRNA targeting sequence of mouse Mettl14#6 | This paper | N/A | GCTGGACCTGG GATGATATTA |
| Sequence-based reagent | shRNA targeting sequence of mouse Mettl14#7 | This paper | N/A | CCCAGCTTGT ACTTTGCTTTA |
| Sequence-based reagent | shRNA targeting sequence of negative control (AAV) | This paper | N/A | TTCTCCGAAC GTGTCACGTAA |
| Sequence-based reagent | shRNA targeting sequence of mouse Kalrn12 | This paper | N/A | TGATGAGCTGA TGGAAGAA |
| Sequence-based reagent | shRNA targeting sequence of mouse Ubr4 | This paper | N/A | AATGATGAGC AGTCATCTC |
| Sequence-based reagent | siRNA targeting sequence of negative control | Yu et al., 2018 | N/A | UUCUCCGAAC GUGUCACGUTT |
| Sequence-based reagent | siRNA targeting sequence of mouse Kalrn7 | Xie et al., 2007 | N/A | AGUACAAUCCU GGCCAUGUTT |
| Sequence-based reagent | siRNA targeting sequence of mouse Kalrn9 | Yan et al., 2015 | N/A | ACUGGACUGG ACUUCUAUUTT |
| Sequence-based reagent | siRNA targeting sequence of mouse Kalrn12 | Yan et al., 2015 | N/A | CGAUGAGCUG AUGGAAGAATT |
| Sequence-based reagent | siRNA targeting sequence of mouse Strn | Breitman et al., 2008 | N/A | GGUGAAGAUCG AGAUACAATT |
| Sequence-based reagent | siRNA targeting sequence of mouse Ubr4 | Shim et al., 2008 | N/A | AAUGAUGAGC AGUCAUCUATT |
| Sequence-based reagent | qPCR primers of mouse 18s | Wang et al., 2018 | N/A | Fwd: GCTTAATTTGACT CAACACGGGARev: AGCTATCAATCTG TCAATCCTGTC |
| Sequence-based reagent | qPCR primers of mouse Gapdh | Mains et al., 2011 | N/A | Fwd: TTGTCAGCAATG CATCCTGCACCACCRev: CTGAGTGGCAGT GATGGCATGGAC |
| Sequence-based reagent | qPCR primers of mouse Ythdf2 | This paper | N/A | Fwd: GAGCAGAGA CCAAAAGGTCAAGRev: CTGTGGGCTC AAGTAAGGTTC |
| Sequence-based reagent | qPCR primers of mouse Kalrn7 | Mains et al., 2011 | N/A | Fwd: GATACCATATCCAT TGCCTCCAGGACCRev: CCAGGCTGCGC GCTAAACGTAAG |
| Sequence-based reagent | qPCR primers of mouse Kalrn9 | Mains et al., 2011 | N/A | Fwd: GCCCCTCGCC AAAGCCACAGCRev: CCAGTGAGT CCCGTGGTGGGC |
| Sequence-based reagent | qPCR primers of mouse Kalrn12 | Mains et al., 2011 | N/A | Fwd: CAGCAGCCA CGTGCCTGCAGCRev: TCTTGACATTGGG AATGGGCCGCAC |
| Sequence-based reagent | qPCR primers of mouse Strn | This paper | N/A | Fwd: TGAAGCCTG GAATGTGGACCRev: CTATTGGGC CTCTTCACCCC |
| Sequence-based reagent | qPCR primers of mouse Ubr4 | This paper | N/A | Fwd: TGAGTGAGG ACAAGGGCAACRev: GGGTTGGAT CGAACGAAGGT |
| Sequence-based reagent | qPCR primer for mouse Hspa12a | This paper | N/A | Fwd: GGGTTTGCACA GGCTAAGGARev: TCTGATGGACG GTCAGGTCT |
| Sequence-based reagent | qPCR primer for mouse Islr2 | This paper | N/A | Fwd: GAAGCTCCCTTA GACTGTCACCRev: CCCCATCGTGA CTCCTGCTG |
| Sequence-based reagent | PCR primer for mouse Hspa12a CDS | This paper | N/A | Fwd: ATGGCGGACAA GGAAGCTGGRev: GTAATTTAAGAA GTCGATCCCC |
| Sequence-based reagent | PCR primer for mouse Islr2 CDS | This paper | N/A | Fwd: ATGGGGCC CTTTGGAGCRev: GCCCGCTGTC TGCCTGTAG |
| Sequence-based reagent | Mouse genotyping primers for Ythdf2 loxp site 1 | This paper | N/A | GCTTGTAGTTATG TTGTGTACCAC and GCAGCTCTGACT ATTCTAAAACCTCC |
| Sequence-based reagent | Mouse genotyping primers for Ythdf2 loxp site 2 | This paper | N/A | CTCATAACATCC ATAGCCACAGG and CCAAGAGATAG CTTTCCTAATG |
| Sequence-based reagent | Mouse genotyping primers for Six3-cre | Chunqiao Liu’s lab | N/A | CCTTCCTCCCT CTCTATGTG and GAACGAACCT GGTCGAAATC |
| Sequence-based reagent | Mouse genotyping primers for Thy1-GFP | The Jackson Laboratory website | N/A | CGGTGGTGC AGATGAACTT and ACAGACACAC ACCCAGGACA |
| Sequence-based reagent | Mouse genotyping primers for Rosa-YFP mutant site | The Jackson Laboratory website | N/A | AGGGCGAGG AGCTGTTCA and TGAAGTCGAT GCCCTTCAG |
| Sequence-based reagent | Mouse genotyping primers for Rosa-YFP wild type site | The Jackson Laboratory website | N/A | CTGGCTTCT GAGGACCG and CAGGACAAC GCCCACACA |
| Peptide, recombinant protein | Insulin | Sigma | Cat#: I6634 | |
| Peptide, recombinant protein | Recombinant Human/Murine/Rat BDNF | PeproTech | Cat#: 450–02 | |
| Peptide, recombinant protein | Recombinant Human NT-3 | PeproTech | Cat#: 450–03 | |
| Peptide, recombinant protein | Recombinant Murine EGF | PeproTech | Cat#: 315–09 | |
| Peptide, recombinant protein | Recombinant Human FGF-basic | PeproTech | Cat#: 100-18B | |
| Commercial assay or kit | Pierce BCA Protein Assay Kit | Thermo Fisher Scientific | Cat#: 23227 | |
| Commercial assay or kit | GeneSilencer Transfection Reagent | Genlantis | Cat#: T500750 | |
| Commercial assay or kit | Magna MeRIP m6A Kit | Millipore | Cat#: 17–10499 | |
| Commercial assay or kit | EZ-Magna RIP RNA-Binding Protein Immunoprecipitation Kit | Millipore | Cat#: 17–701 | |
| Chemical compound, drug | cpt-cAMP, 8-(4-Chlorophenylthio) Adenosine 3':5'-CY | Sigma | Cat#: C3912 | |
| Chemical compound, drug | N-acetyl-L-cysteine (NAC) | Sigma | Cat#: A8199 | |
| Chemical compound, drug | Forskolin | Sigma | Cat#: F6886 | |
| Chemical compound, drug | Puromycin | Thermo Fisher Scientific | Cat#: A11138-03 | |
| Chemical compound, drug | Puromycin | Sigma | Cat#: P8833 | |
| Chemical compound, drug | Paraformaldehyde | Vetec | Cat#: V900894-100G | |
| Chemical compound, drug | Triton X-100 | Sigma | Cat#: V900502 | |
| Software, algorithm | GraphPad Prism 7.0 | GraphPad | https://www.graphpad.com, RRID: SCR_002798 | |
| Software, algorithm | STAR v2.5 | Dobin et al., 2013 | https://github.com/alexdobin/STAR/ RRID:SCR_004463 | |
| Software, algorithm | HTSeq | Anders et al., 2015 | https://pypi.org/project/HTSeq/ | |
| Software, algorithm | ImageJ (Fiji) | Schindelin et al., 2012 | http://fiji.sc, RRID:SCR_002285 | |
| Software, algorithm | Matlab | Matlab | https://ww2.mathworks.cn | |
| Other | TRIzol Reagent | Life | Cat#: 15596018 | |
| Other | PrimeScript RT Master Mix | Takara | Cat#: RR036B | |
| Other | 2× ChamQ Universal SYBR qPCR Master Mix | Vazyme | Cat#: Q711-02 | |
| Other | DMEM, high glucose | Gibco | Cat#: 11965–092 | |
| Other | Dulbecco’s Modified Eagle’s Medium, 10×, low glucose | Sigma | Cat#: D2429 | |
| Other | DMEM, high glucose | Hyclone | Cat#: SH30022.01 | |
| Other | Fetal Bovine Serum (FBS) | Gibco | Cat#: 10270–106 | |
| Other | Dulbecco’s Phosphate-Buffered Saline, 1× without calcium and magnesium (DPBS) | Corning | Cat#: 21–031-CVR | |
| Other | Poly-D-lysine, Cultrex | Trevigen | Cat#: 3439-100-01 | |
| Other | Laminin (mouse), Culrex | Trevigen | Cat#: 3400-010-01 | |
| Other | DMEM/F-12, GlutaMAX | Gibco | Cat#: 10565–018 | |
| Other | Neurobasal Medium, minus phenol red | Gibco | Cat#: 12348–017 | |
| Other | Penicillin-Streptomycin | Life | Cat#: 15140–122 | |
| Other | B27 serum-free supplement, 50× | Life | Cat#: 17504044 | |
| Other | N-2 Supplement, 100× | Gibco | Cat#: 17502–048 | |
| Other | OCT Compound and Cryomolds, Tissue-Tek | SAKURA | Cat#: 4583 | |
| Other | ChemiBLOCKER | Millipore | Cat#: 2170 | |
| Other | CTB (Cholera Toxin Subunit B) conjugated by Alexa Fluor 555 | Invitrogen | Cat#: C34776 | |
| Other | VECTASHIELD Antifade Mounting Medium with DAPI | Vector Laboratory | Cat#: H-1200 | |
| Other | Mounting Medium, antifading (with DAPI) | Solarbio | Cat#: S2110 | |
| Other | Normal Goat Serum | Novus | Cat#: NBP2-23475 |
Additional files
-
Supplementary file 1
List of YTHDF2 target mRNAs by anti-YTHDF2 RIP-Seq.
- https://cdn.elifesciences.org/articles/75827/elife-75827-supp1-v3.xlsx
-
Supplementary file 2
Proteome of YTHDF2 knockdown vs. control.
- https://cdn.elifesciences.org/articles/75827/elife-75827-supp2-v3.xlsx
-
Supplementary file 3
Overlapping mRNA of Y2-RIP vs. Y2-KD-MS.
- https://cdn.elifesciences.org/articles/75827/elife-75827-supp3-v3.xlsx
-
Transparent reporting form
- https://cdn.elifesciences.org/articles/75827/elife-75827-transrepform1-v3.docx
Download links
A two-part list of links to download the article, or parts of the article, in various formats.
Downloads (link to download the article as PDF)
Open citations (links to open the citations from this article in various online reference manager services)
Cite this article (links to download the citations from this article in formats compatible with various reference manager tools)
The m6A reader YTHDF2 is a negative regulator for dendrite development and maintenance of retinal ganglion cells
eLife 11:e75827.
https://doi.org/10.7554/eLife.75827


