Distinct roles for two Caenorhabditis elegans acid-sensing ion channels in an ultradian clock
- Neurobiology Division, MRC Laboratory of Molecular Biology, United Kingdom
- Department of Pathology and Lab Medicine, University of Rochester Medical Center, United States
- Department of Molecular Biosciences, University of Kansas, United States
- State Key Laboratory of Medical Neurobiology and MOE Frontiers Center for Brain Science, Institutes of Brain Science, Fudan University, China
- Department of Medicine, Nephrology Division, University of Rochester Medical Center, United States
- Department of Biology, KU Leuven, Belgium
Figures
Figure 1 with 4 supplements
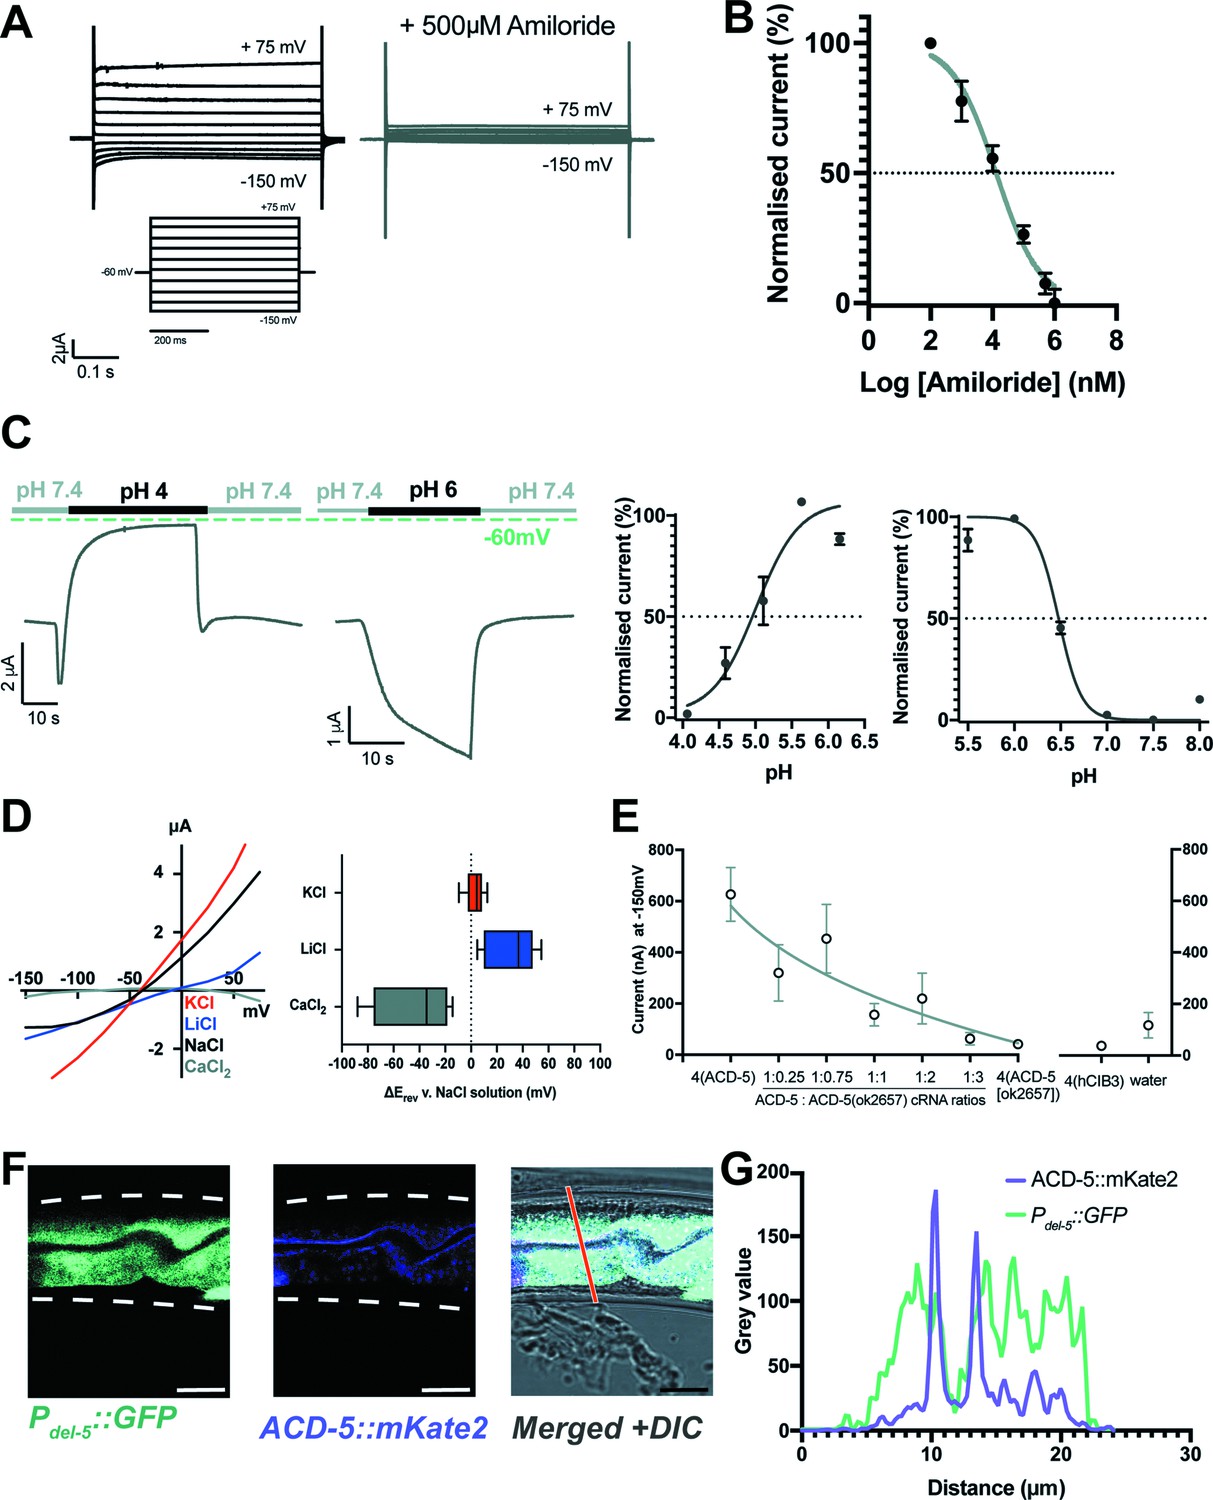
ACD-5 is an amiloride-sensitive, acid-sensing cation channel on the luminal membrane of the intestine.
(A) ACD-5 currents are amiloride-sensitive. Representative ACD-5 transients in Xenopus oocytes in the presence and absence of amiloride and (B) normalised amiloride-dose response curve (I/Imax as percentage) for ACD-5, showing a half-maximal inhibitory concentration (IC50) of 131μM (LogIC50=4.118) (N=8) indicated by the dashed line (curve fitted as described below). Error bars represent mean ± SEM. (C) ACD-5 can form a homomeric acid-sensing ion channel. Left panel: Representative trace of ACD-5-expressing Xenopus oocytes subjected to a down-step to pH 4 or 6. Currents were recorded at a holding potential of –60mV and traces are baseline-subtracted and drift-corrected using the Roboocyte2+ (Multichannels) software. Right panel: pH-dose dependence (I/Imax expressed as percentage). ACD-5-expressing oocytes were perfused with solutions of decreasing pH from pH 6 (left), showing an inhibitory pH50 of 4.90 (N=5); when perfused with increasing pH from pH 6 (right), showing an excitatory pH50 of 6.48 (N=7). Currents were recorded at a holding potential of –60mV, normalised to maximal currents and best fitted with the Hill’s equation (Nonlin fit Log(inhibitor) versus normalised response – variable slope) in GraphPad Prism. Error bars represent mean ± SEM. (D) Current-voltage (IV) curve (left) and change in reversal potential, ΔErev when shifting from a NaCl solution to CaCl2, KCl, or LiCl (right). N=12 oocytes. Presented as median and IQR (Tukey method). (E) ACD-5(ok2657) is a dominant mutation. Expression of varying ratios of ACD-5(ok2657) with a constant concentration of wild-type ACD-5 in Xenopus oocytes. hCIB3 (Calcium and integrin-binding family member 3) was used as a filler to account for amount of cRNA injected. Mean ± SEM. 9<N > 19 for each ratio. (F) ACD-5 is localised at the apical (luminal) intestinal membrane. Localisation of mKate2-C-terminally tagged ACD-5 (ljEx1470 (Pacd-5::acd-5(no stop) cDNA::mKate2)) shows apical membrane localisation (magenta). Cytoplasm of the intestinal cells is shown in cyan (ljEx1349 (Pdel-5::GFP)). (G) Intensity profile taken at the part of the intestine indicated by the red line. Scale bar: 10μm.
Figure 1—figure supplement 1
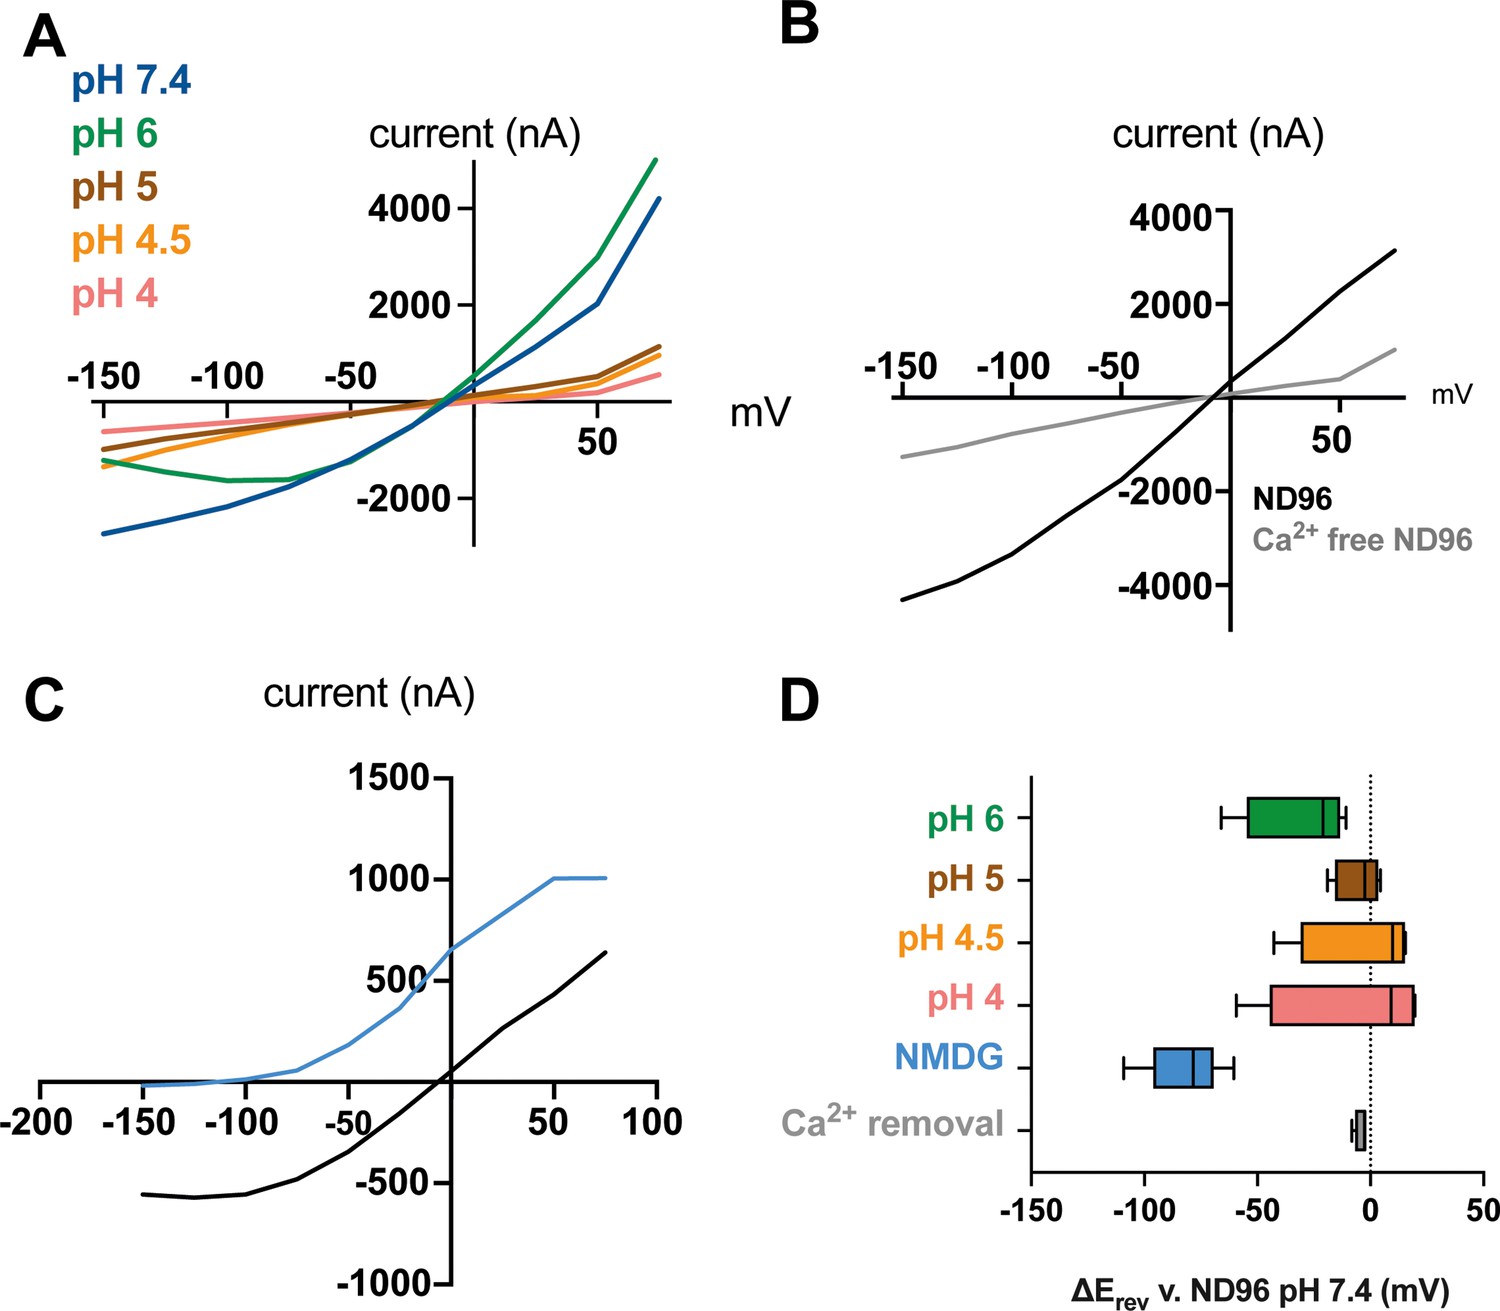
Further characterisation of ACD-5 homomeric channel properties.
(A) Representative current-voltage (I-V) relationships perfusing different pH solution over the oocyte. (B) Representative current-voltage relationships after removal of Ca2+ from the solution. (C) Representative current-voltage relationships in a basal solution (ND96, pH 7.4) and after removal of Na+ from the solution (NMDG, pH 7.4). (D) Summary of reversal potential Erev of data presented in (A–C). Dashed line represents the Erev for the Na+ solution. N (top to bottom)=4, 4, 4, 4, 8, 4. Data are presented as boxplots with median and IQD (interquartile distance, as calculated by the Tukey method).
Figure 1—figure supplement 2
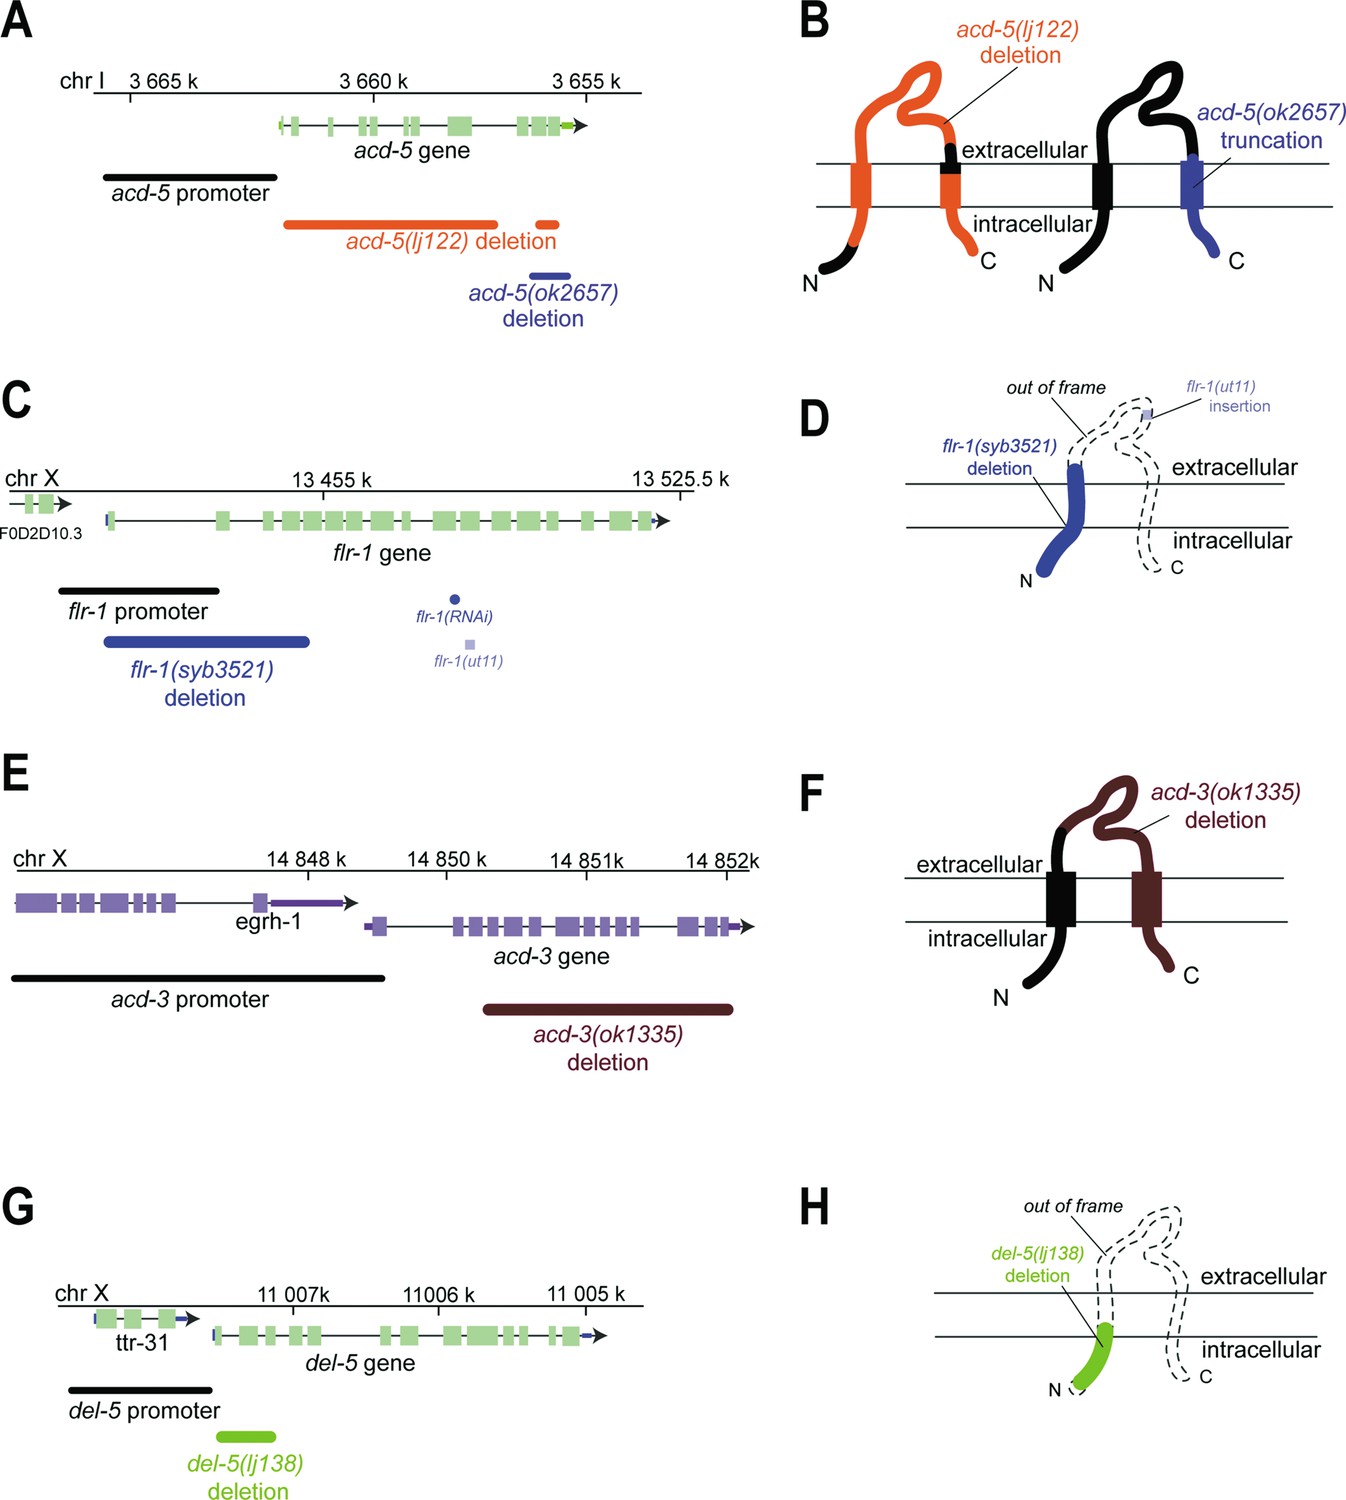
Genomic regions and schematic of predicted protein structures of the intestinal DEG/ENaCs, showing mutations used in this study.
(A, C, E, G) Genomic region for the genes indicated. Boxes indicate exons, lines indicate introns, and chr indicates chromosome. Endogenous promoter region used, mutations and RNAi used in this study are shown. (B, D, F, H) Schematic of predicted protein structure with two transmembrane helices, and cytosolic N- and C-terminus and an extracellular domain, typical of DEG/ENaC subunits. Mutations used in the study are indicated for each gene and protein. Black indicates intact; coloured indicates deleted; dashed line indicates out of frame.
Figure 1—figure supplement 3
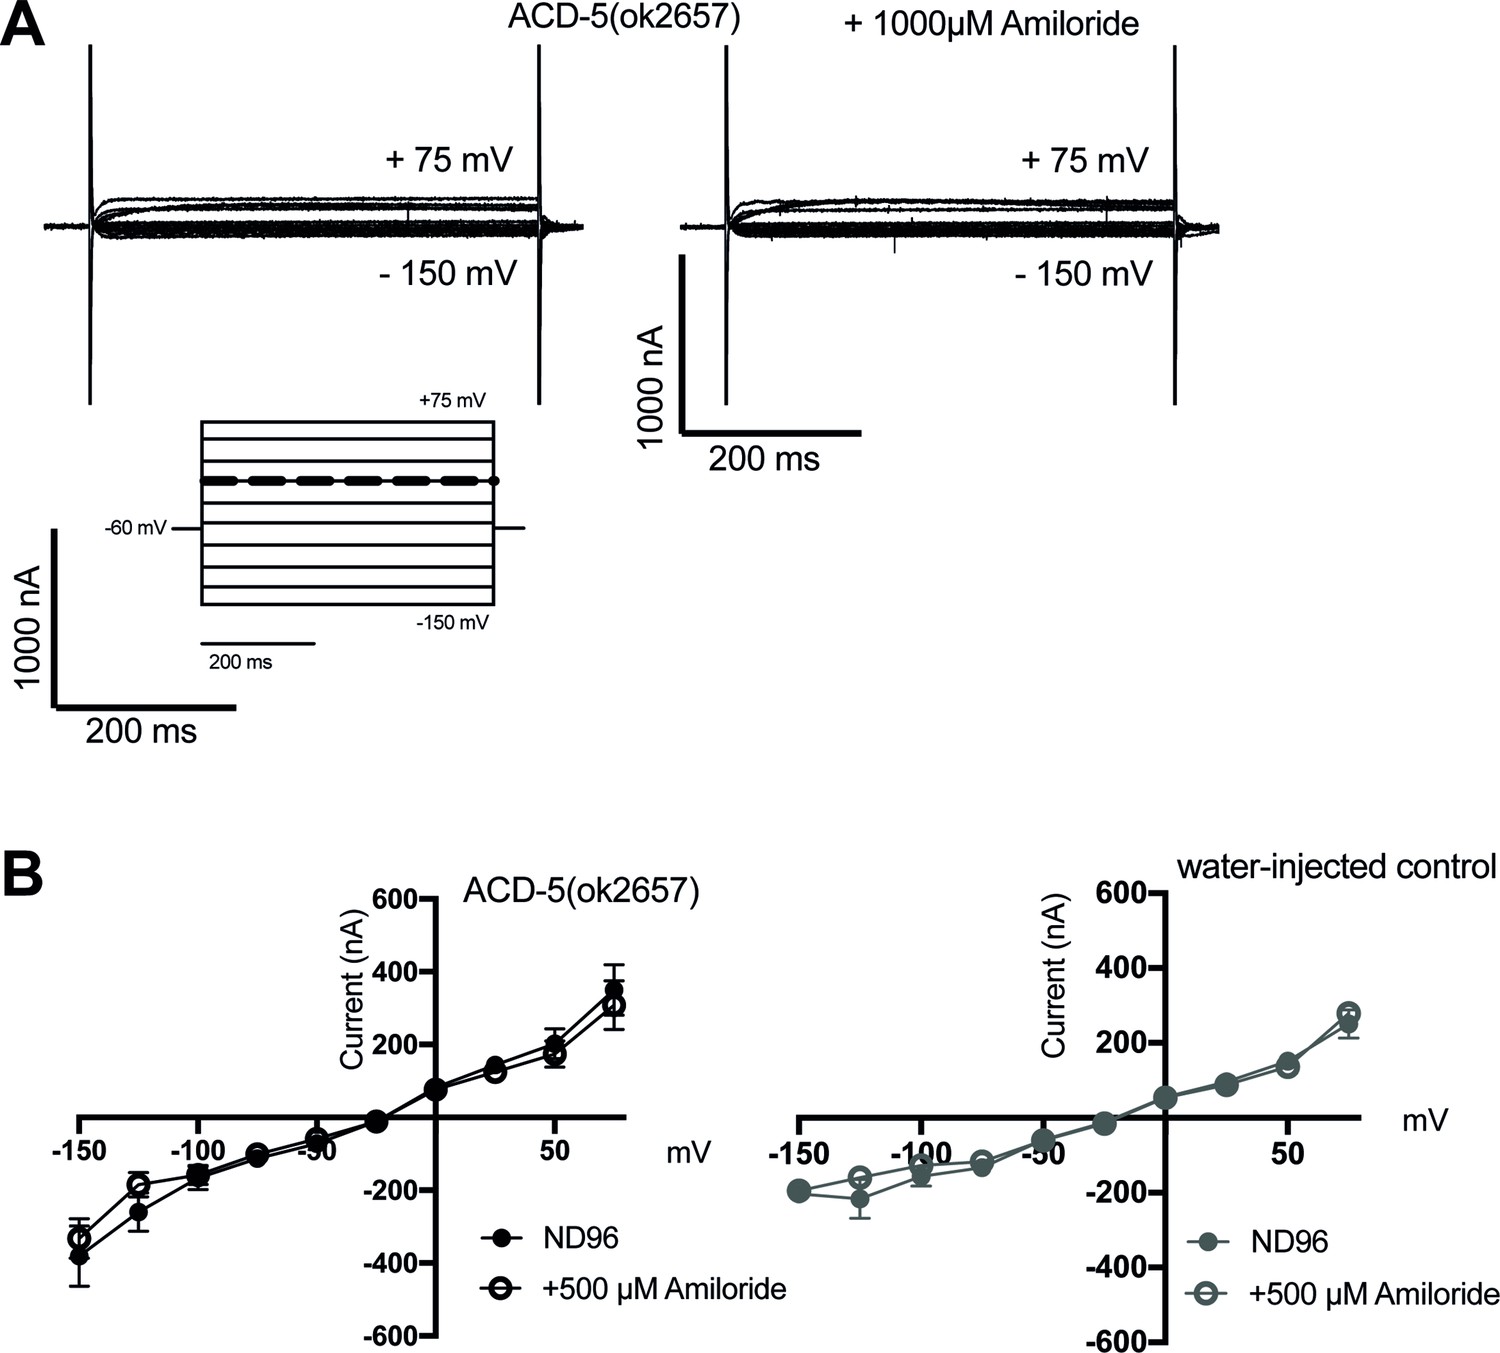
Characterisation of ACD-5 channels carrying the ok2657 mutation in Xenopus oocytes.
(A) Representative transients and (B) current-voltage (I-V) relationships of Xenopus oocytes injected with acd-5(ok2657) cRNA in the presence and absence of amiloride, and a water-injected control. N=10. Error bars represent mean and SEM.
Figure 1—figure supplement 4
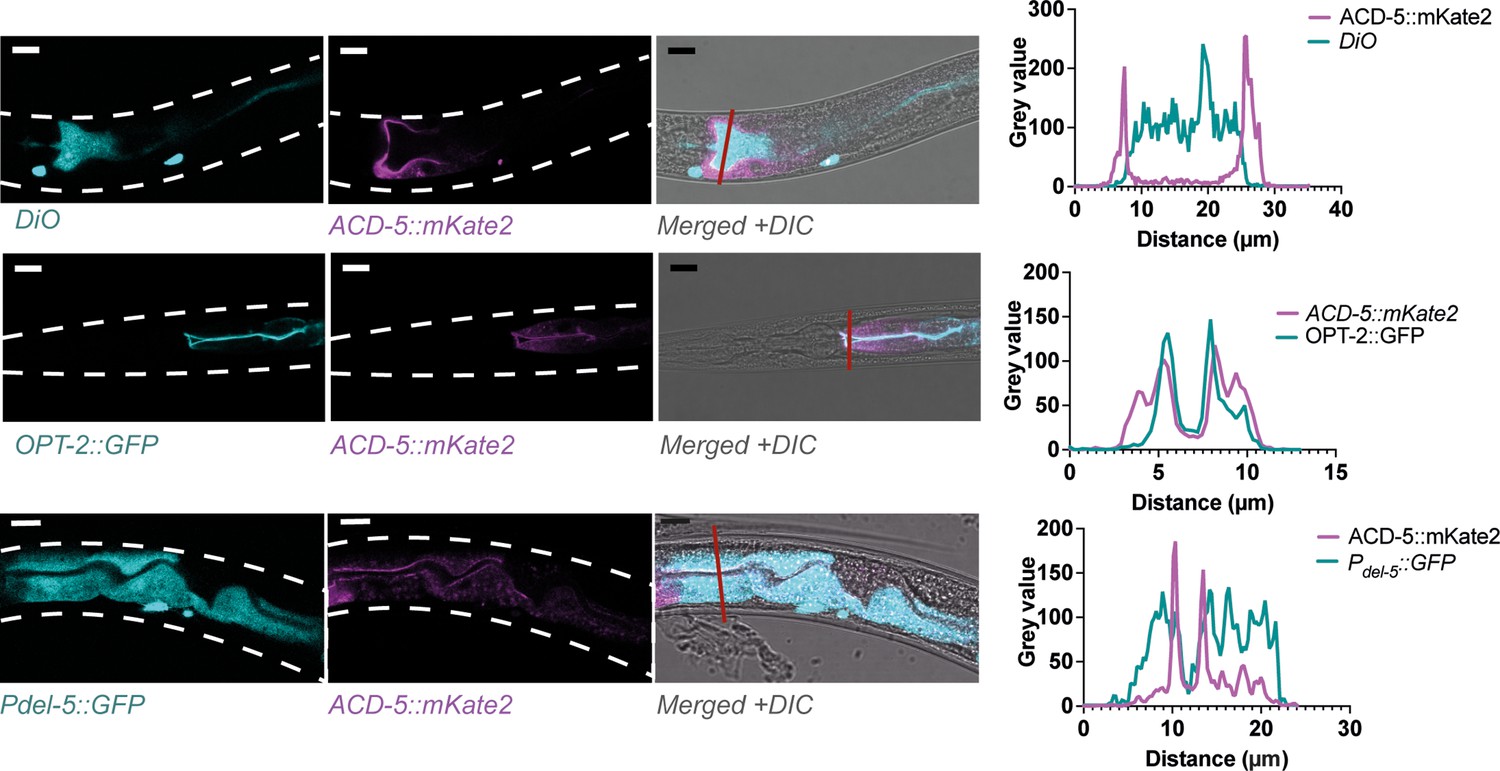
ACD-5 localises to the apical membrane.
Co-localisation of ACD-5::mKate2 (ljEx1470) with luminal DiO fluorescence, an apical membrane marker rnyEx133 [pKN114 (opt-2p:::opt-2(aa1-412)::GFP)] and a cytoplasmic marker ljEx1349 (Pdel-5::GFP) with intensity profiles. Scare bar: 10 μm.
Figure 2
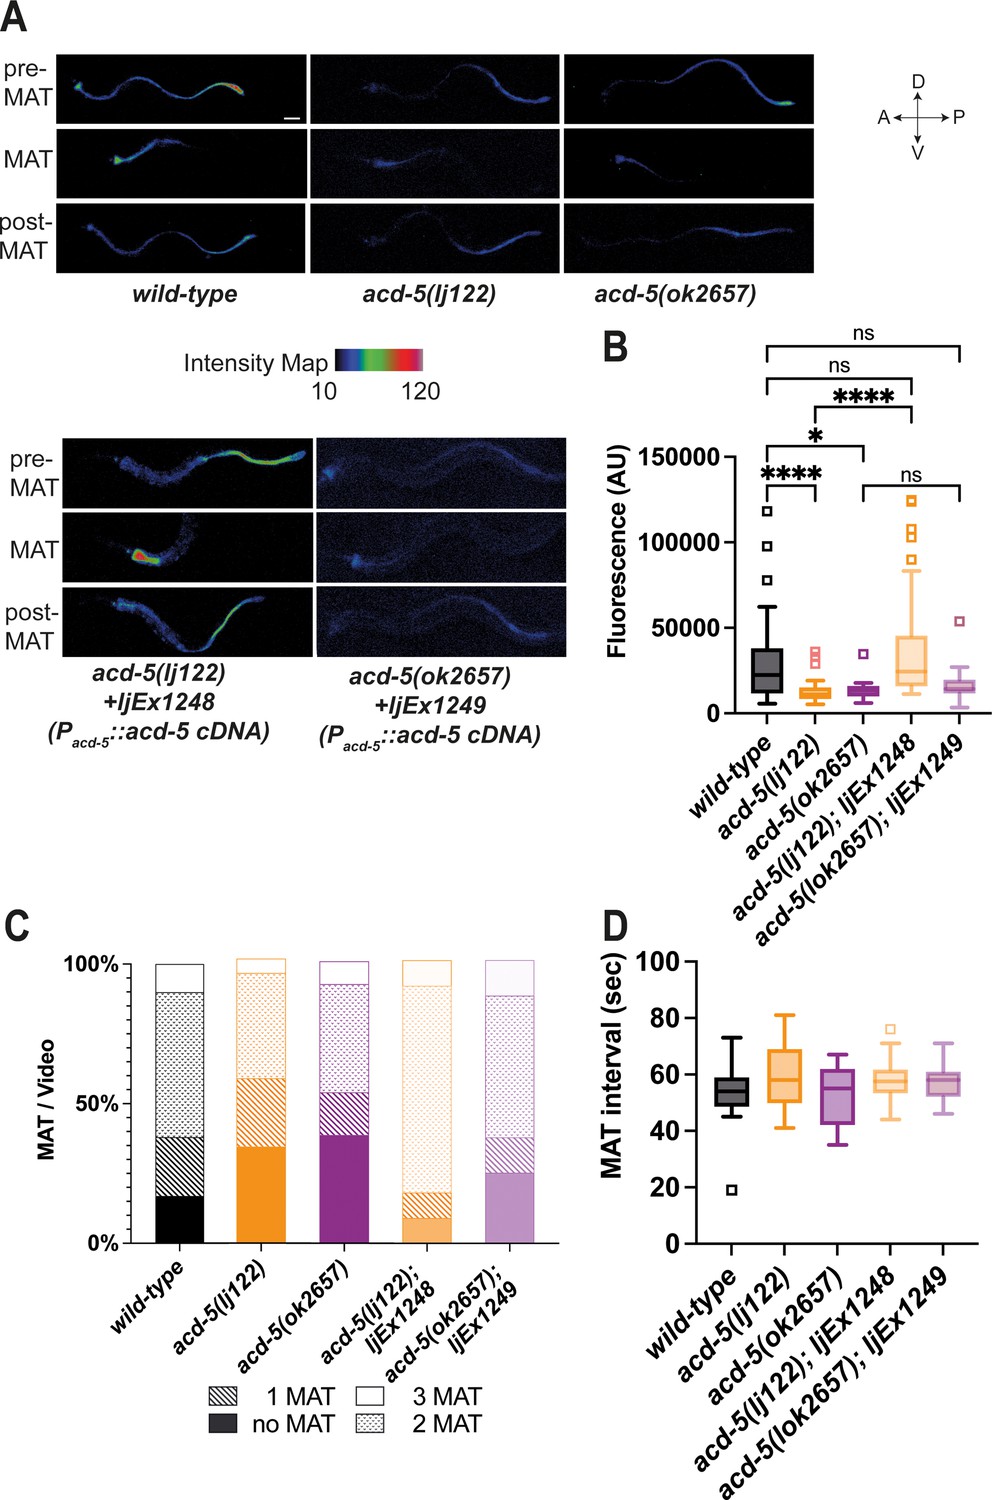
ACD-5 mutations show disruptions in intestinal lumen acidity and luminal proton oscillations.
(A) ACD-5 is important to establish and maintain an acidic intestinal pH. Heat map of pixel fluorescence intensity with red representing highest intensity (high acidity), and black lowest intensity (low acidity), after feeding on the pH-sensitive probe Kansas Red (KR35) for 30min (10μM). Maximum anterior transition (MAT)±15s (pre/post-MAT) during the DMP extracted from videos of free-moving animals are shown. Rescue lines express the ljEx1248(Pacd-5::acd-5 cDNA) or ljEx1249(Pacd-5::acd-5 cDNA) extrachromosomal array, respectively. D=dorsal, V=ventral, A=anterior, P=posterior. Scale bar: 50μm. (B) acd-5(lj122) mutants (****p<0.0001) and acd-5(ok2657) mutants (*p=0.0309) display lower intestinal lumen pH compared to the wild-type. This could be rescued only in the acd-5(lj122) mutants (****p<0.0001). Quantification of fluorescence in the MAT. Data are presented as median and IQR (Tukey method, N=24, 19, 9, 20, and 12, respectively). Outliers are indicated by squared boxes. Kruskal-Wallis test with Dunn’s multiple comparison test. (C) acd-5 mutants display a reduced number of MATs. Quantification of MATs per 2-min video recording shown as percentages of animals displaying 1, 2 or 3 MATs. Median and IQR (Tukey method, N=29, 38, 13, 23, and 16, respectively). (D) MAT intervals are not affected by acd-5 mutations. Time interval of MAT of acd-5 mutants, wild-type and rescues. Kruskal-Wallis test with Dunn’s multiple comparison test was non-significant (P=0.405). Data are presented as median and IQR (Tukey method). N=21, 18, 7, 20, and 12, respectively.
Figure 3 with 4 supplements
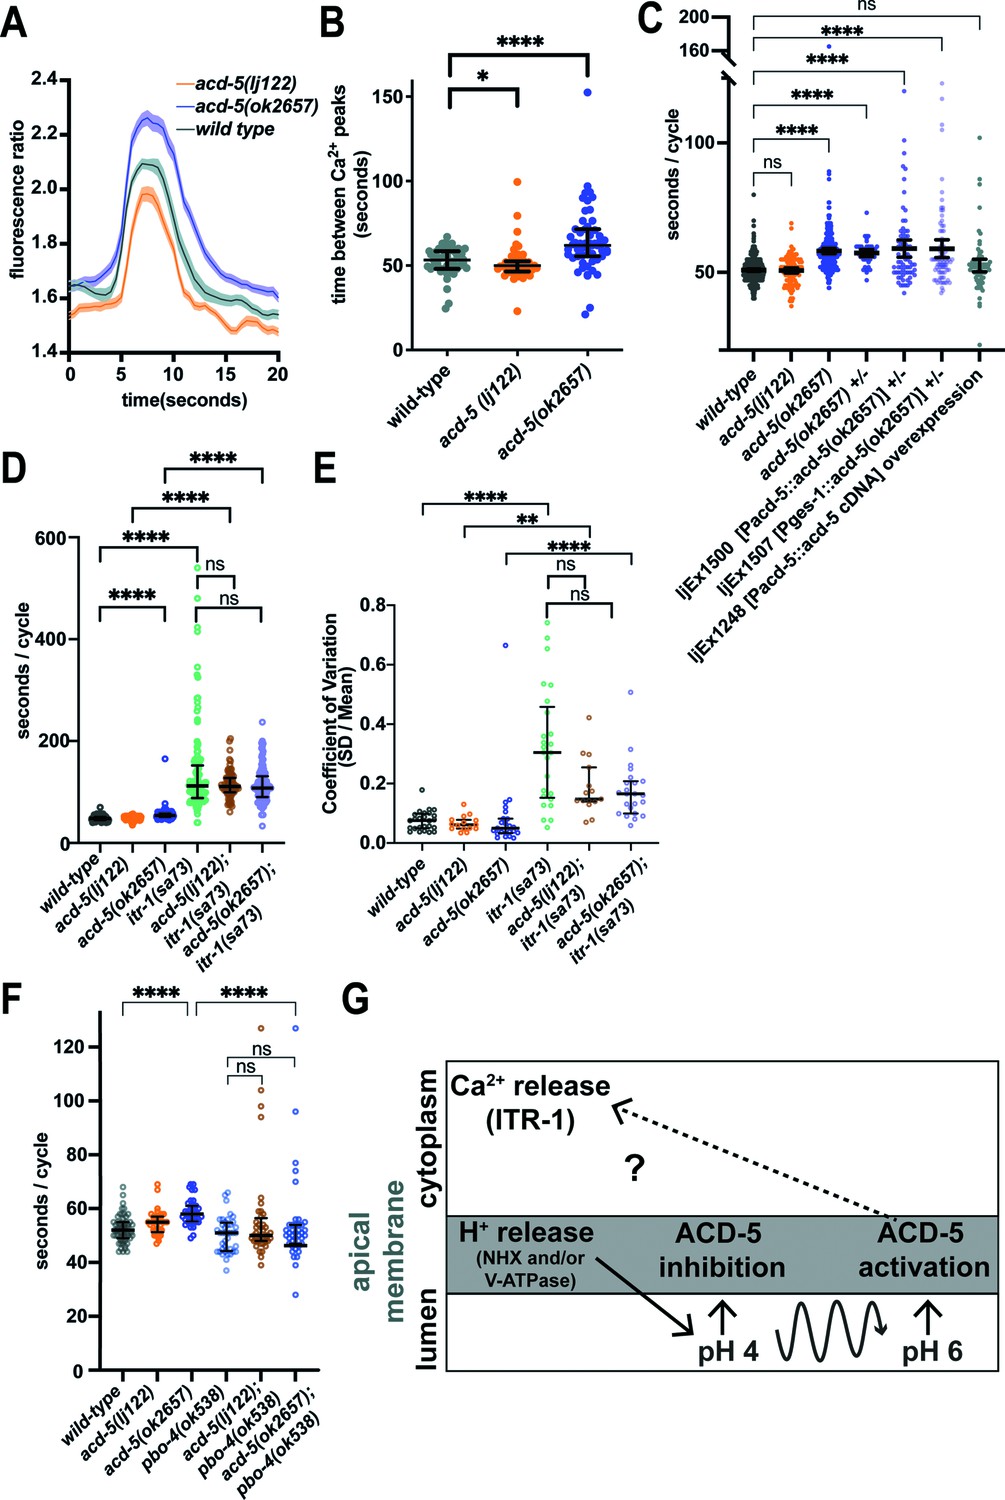
ACD-5 mutations affect Ca2+ oscillations and behaviour.
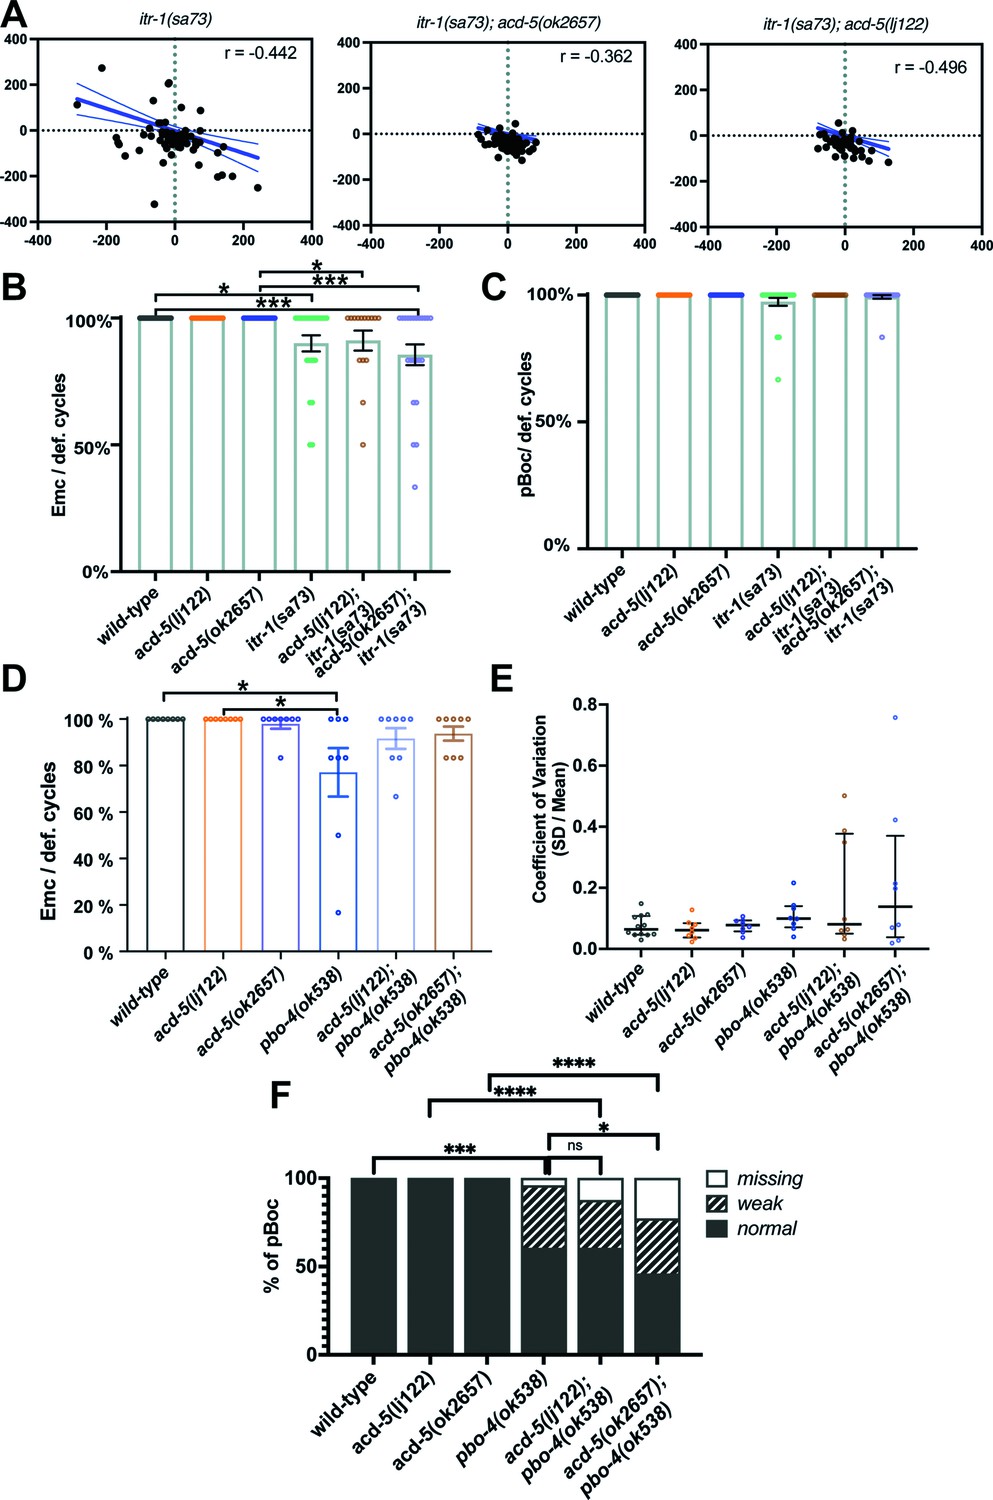
(A) and (B) Ca2+ imaging of the intestinal cells of freely moving, defecating animals. (A) acd-5 mutations affect intestinal Ca2+ oscillations. Ca2+ mean trace± SEM of fluorescence ratio for acd-5 mutants and wild-type. Ca2+ ‘peaks’ were centrally aligned as described in Materials and methods. (B) Ca2+ cycle length. Mann-Whitney U between wild-type and acd-5(ok2657) ****p<0.0001 (indicating a longer cycle interval), and between wild-type and acd-5(lj122) *p=0.0266 (indicating a shorter cycle interval). Error bars represent median and IQR, N=50, 55, and 53, respectively (i.e., individual intervals from 15 animals for each genotype, recorded for 5min each). (C) ACD-5(ok2657) is a dominant mutation. Comparison of defecation cycle length in acd-5 mutant and overexpression strains. Kruskal-Wallis test and post hoc Dunnett’s multiple comparisons test found no significant difference between wild-type and acd-5(lj122) animals (p>0.9999) but a significant difference from wild-type for homo- and heterozygous acd-5(ok2657) animals and wild-type animals expressing ljEx1500(Pacd-5::acd-5[ok2657]) or ljEx1507(Pges-1::acd-5[ok2657]) (****p<0.0001); those overexpressing wild-type ljEx1248(Pacd-5::acd-5cDNA) were not significantly different from wild-type (p>0.9999). Median and IQR. 50<N<75 (10–15 animals for each group, five cycles for each animal). (D) and (E) Effect of acd-5 alleles on the defecation interval of itr-1(sa73) animals. (D) DMP interval length (median and IQR). Kruskal-Wallis test was significant (****p<0.0001). A post hoc Dunn’s multiple comparison test indicated that compared to the wild-type, acd-5(ok2657) mutants and the itr-1 single and double mutants (****p<0.0001) all showed a significant increase in interval length. (E) Coefficient of variation in cycle length. acd-5(lj122) (**p=0.001) or the acd-5(ok2657) (****p<0.0001) double mutants showed significant increase in variability, similar to the itr-1 single mutants. Error bars represent median and IQR. 75<N<130 (15–26 animals×5 cycles for each). See also Figure 3—figure supplement 4, showing comparison of cumulative distribution of cycle length and CV. (F) Effect of acd-5 alleles on defecation cycle length of pbo-4(ok538) animals. DMP interval length (median and IQR). The Kruskal-Wallis test was significant with a post hoc Dunn’s multiple comparison test indicating that only acd-5(ok2657) mutants had increased cycle length (****p<0.0001); pbo-4 single (p=0.885) and double mutants (both p=1) were not significantly different from wild-type. pbo-4(ok538) significantly reduced the cycle length of acd-5(ok2657) animals (****p<0.0001). Error bars represent median and IQR. N=60 (12 animals × 5 cycles, wild-type), 40 (8×5 cycles, all other strains). (G) Schematic of the relationship between ACD-5, proton release and Ca2+ oscillations. Release of protons at the luminal membrane via NHX channels (which could include PBO-4) and/or V-ATPase (of which VHA-6 is a component) results in decrease in luminal pH which inhibits the ACD-5 channel. Proton oscillations (curved line) from pH 4 to 6 activate the ACD-5 channel at pH 6 which in turn influences (but does not drive) itr-1-mediated Ca2+ oscillations.
Figure 3—figure supplement 1
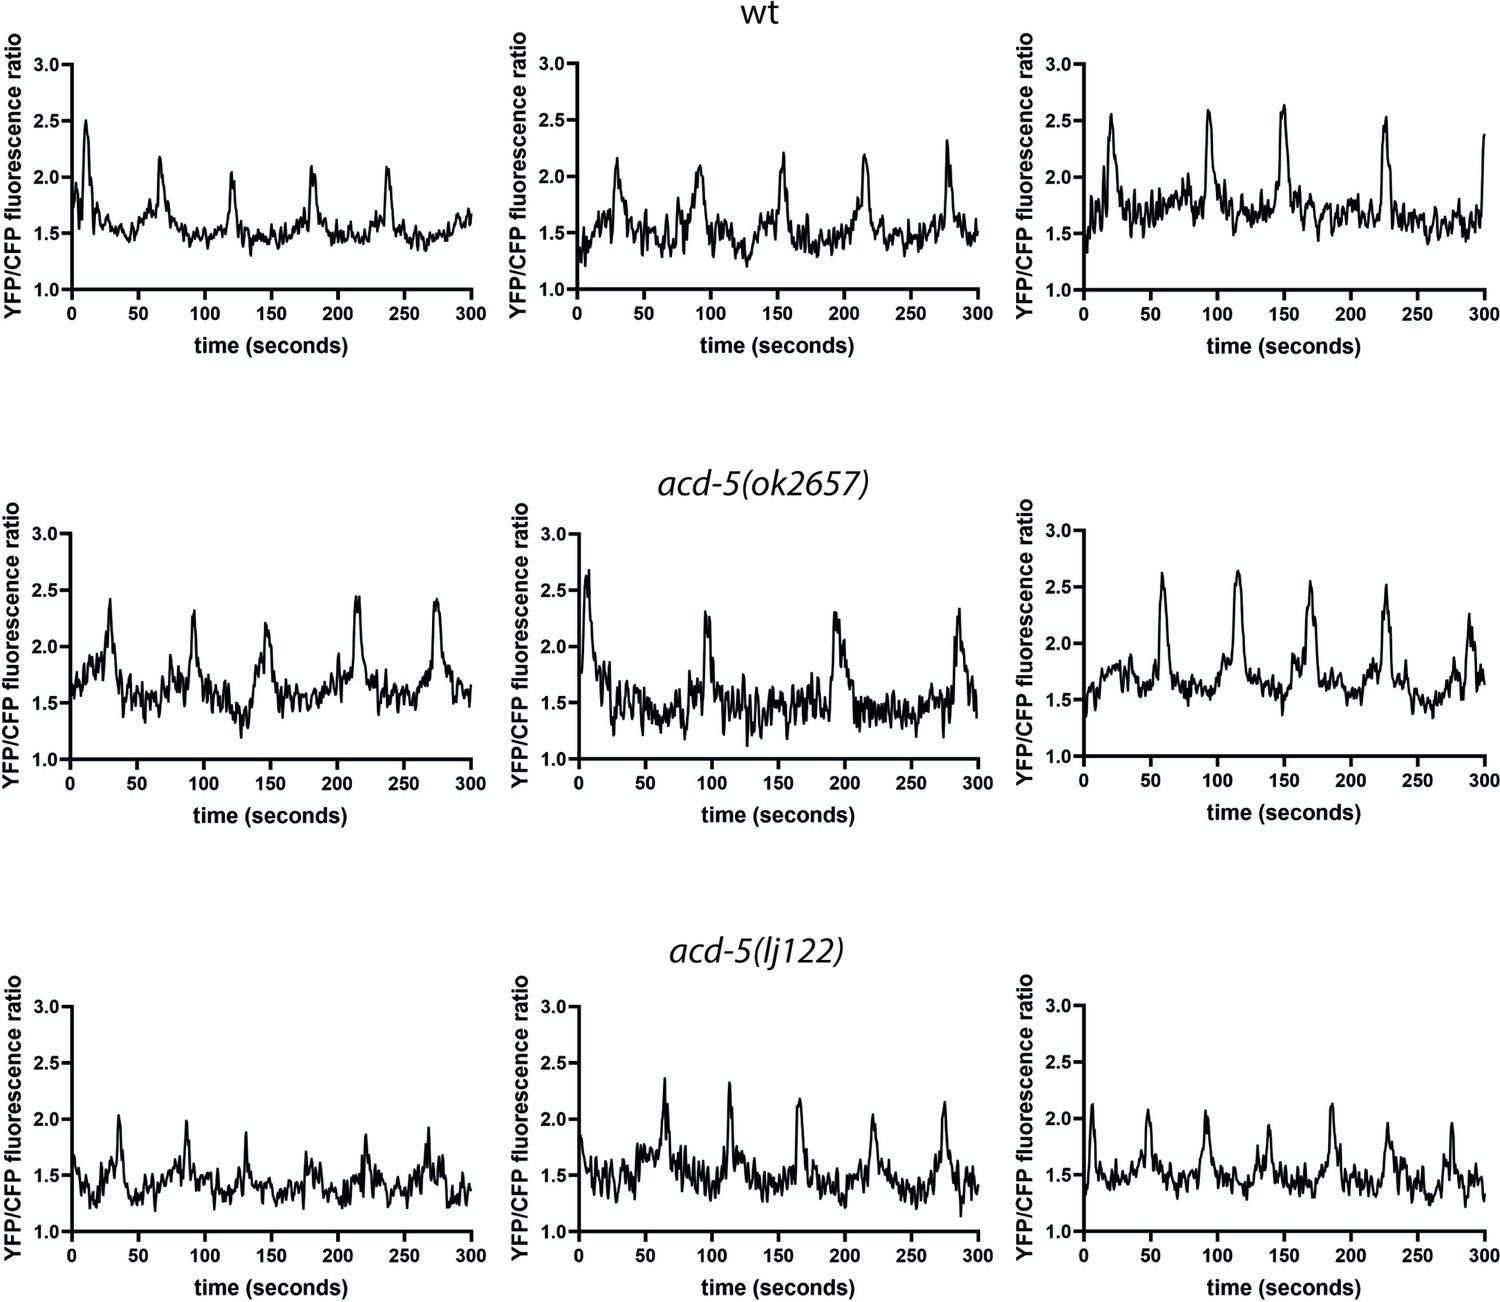
ACD-5 modifies intestinal Ca2+ oscillations.
Ca2+ imaging of the posterior intestinal (int9) cells of freely moving, defecating animals. Three representative example traces of intestinal Ca2+ transients of the wild-type, acd-5(ok2657), and acd-5(lj122) mutants over a 5-min time period.
Figure 3—figure supplement 2
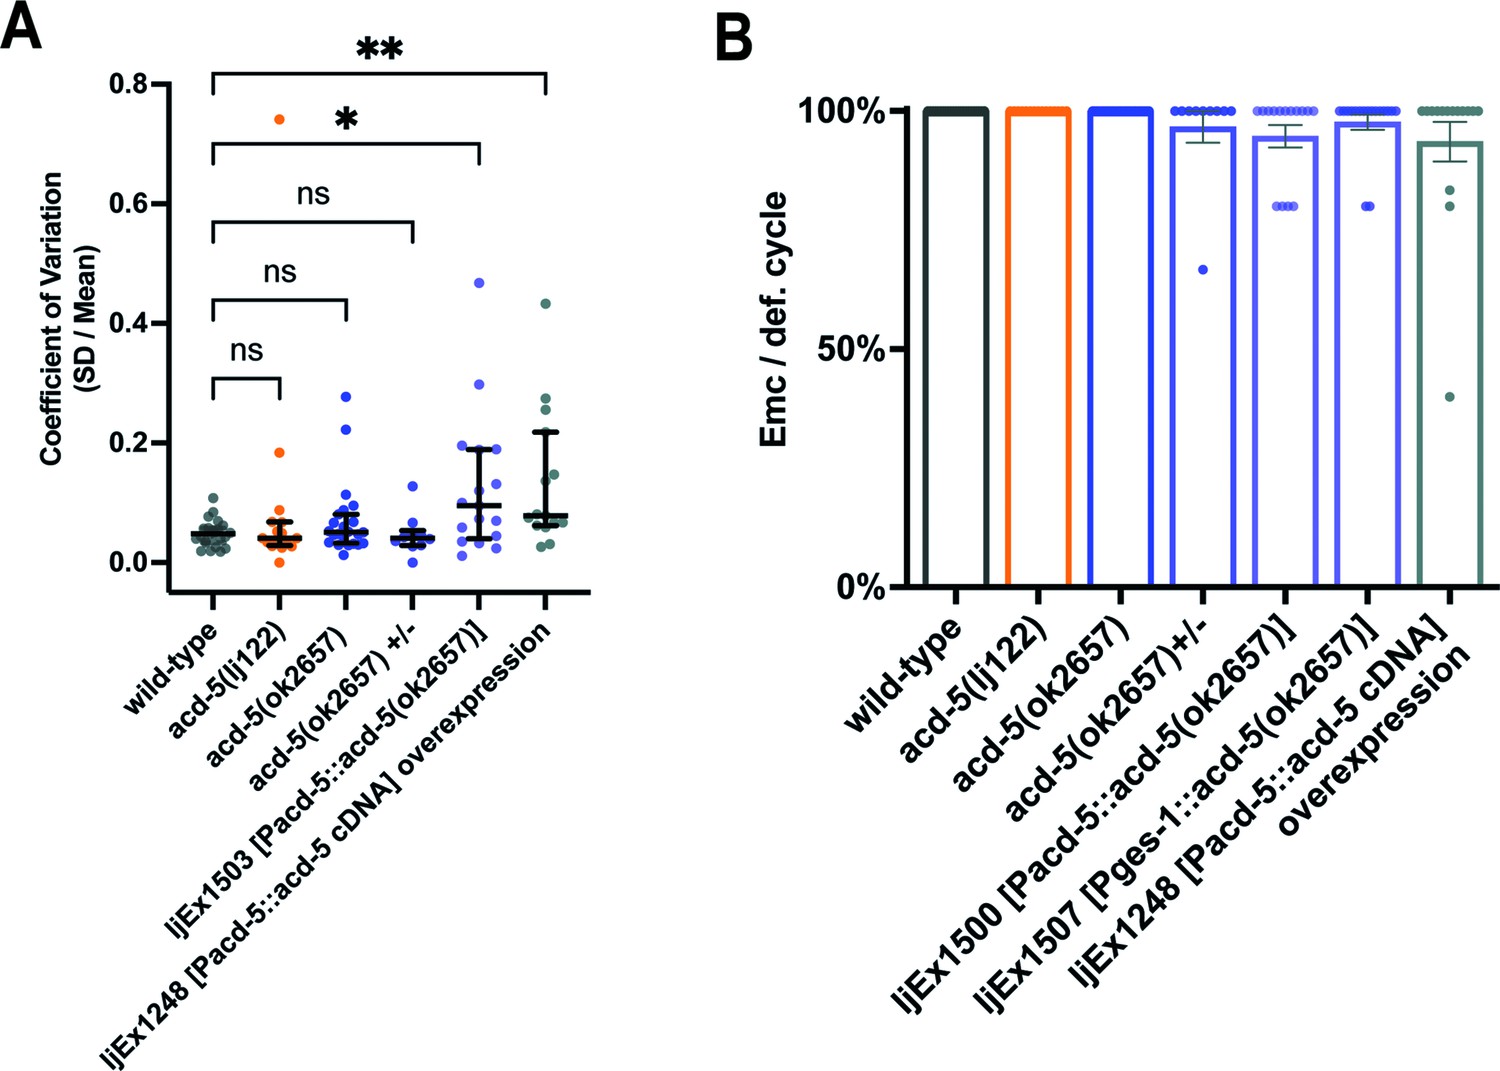
Effect of acd-5(ok2657) overexpression on variation of defecation interval length and DMP.
(A) Variability between DMP cycles. Error bars represent median and IQR. Significance was assessed by a Kruskal-Wallis test with Dunn’s multiple comparison test (*p=0.0466; **p=0.0093). N>10 animals × 5 cycles per animal. (B) Quantification of EMCs. Significance was assessed by a Kruskal-Wallis test with Dunn’s multiple comparison test which was not statistically significant. Left to right, comparing with wt, p=1, 1, 1, 0.1910, 1, and 0.6449; acd-5(ok2657) versus acd-5(ok2657) ±p=1; acd-5(ok2657) versus ljEx1500 p=0.1326; acd-5(ok2657) versus ljEx1507 p=1; acd-5(ok2657) versus ljEx1248 p=0.5110. Error bars represent mean and SEM. N>10 animals, five cycles each animal. EMC, enteric muscle contraction.
Figure 3—figure supplement 3
acd-5 alleles alter the defecation phenotype of itr-1 and pbo-4 loss of function animals.
(A) Analysis of the defecation cycle in itr-1(sa73) single and double mutants with acd-5 reveals compensatory behaviour in the oscillator. Scatter plot of the change in interval duration in one cycle pair compared to the subsequent cycle pair, for itr-1(sa73) mutants. T(n) is the period of the cycle n. Linear regression (Pearson’s r) was used to derive the line, which is shown with 95% confidence limits (dashed lines). N=73, 69, and 43 (from left). (B) Quantification of EMCs executed by itr-1/acd-5 single and double mutants. Significance was assessed by a Kruskal-Wallis test with Dunn’s multiple comparison test (wt vs. itr-1 mutant *p=0.00245; wt vs. acd-5(ok2657)/itr-1 mutant ***p=0.0005; acd-5(ok2657) vs. itr-1 mutant *p=0.0307; acd-5(ok2657) vs. acd-5(ok2657)/itr-1 mutant ***p=0.0008). (C) Quantification of pBocs executed by itr-1/acd-5 single and double mutants. The Kruskal-Wallis test was non-significant (p=0.11). For (B, C), error bars represent mean and SEM, 15<N<26. (D) Quantification of EMCs executed by pbo-4 and acd-5 single and double mutants. Significance was assessed by a Kruskal-Wallis test with Dunn’s multiple comparison test (*p=0.0456). Neither double mutant was different from pbo-4(ok538) (p=1). Error bars represent mean and SEM. (E) Coefficient of variation of cycle length for pbo-4 and acd-5 single and double mutants. The Kruskal-Wallis test was non-significant (p=0.459). Error bars represent median and IQR. (F) Quantification of pBoc strength of pbo-4 and acd-5 single and double mutants. *p=0.232, ***p=0.0003, ns p=3.077, Fisher exact test. For clarity, non-significant results are omitted from graphs (B–E). For (D–F), N=12 for wild-type, 8 for all other strains, from 5 cycles/6 events per animal.
Figure 3—figure supplement 4
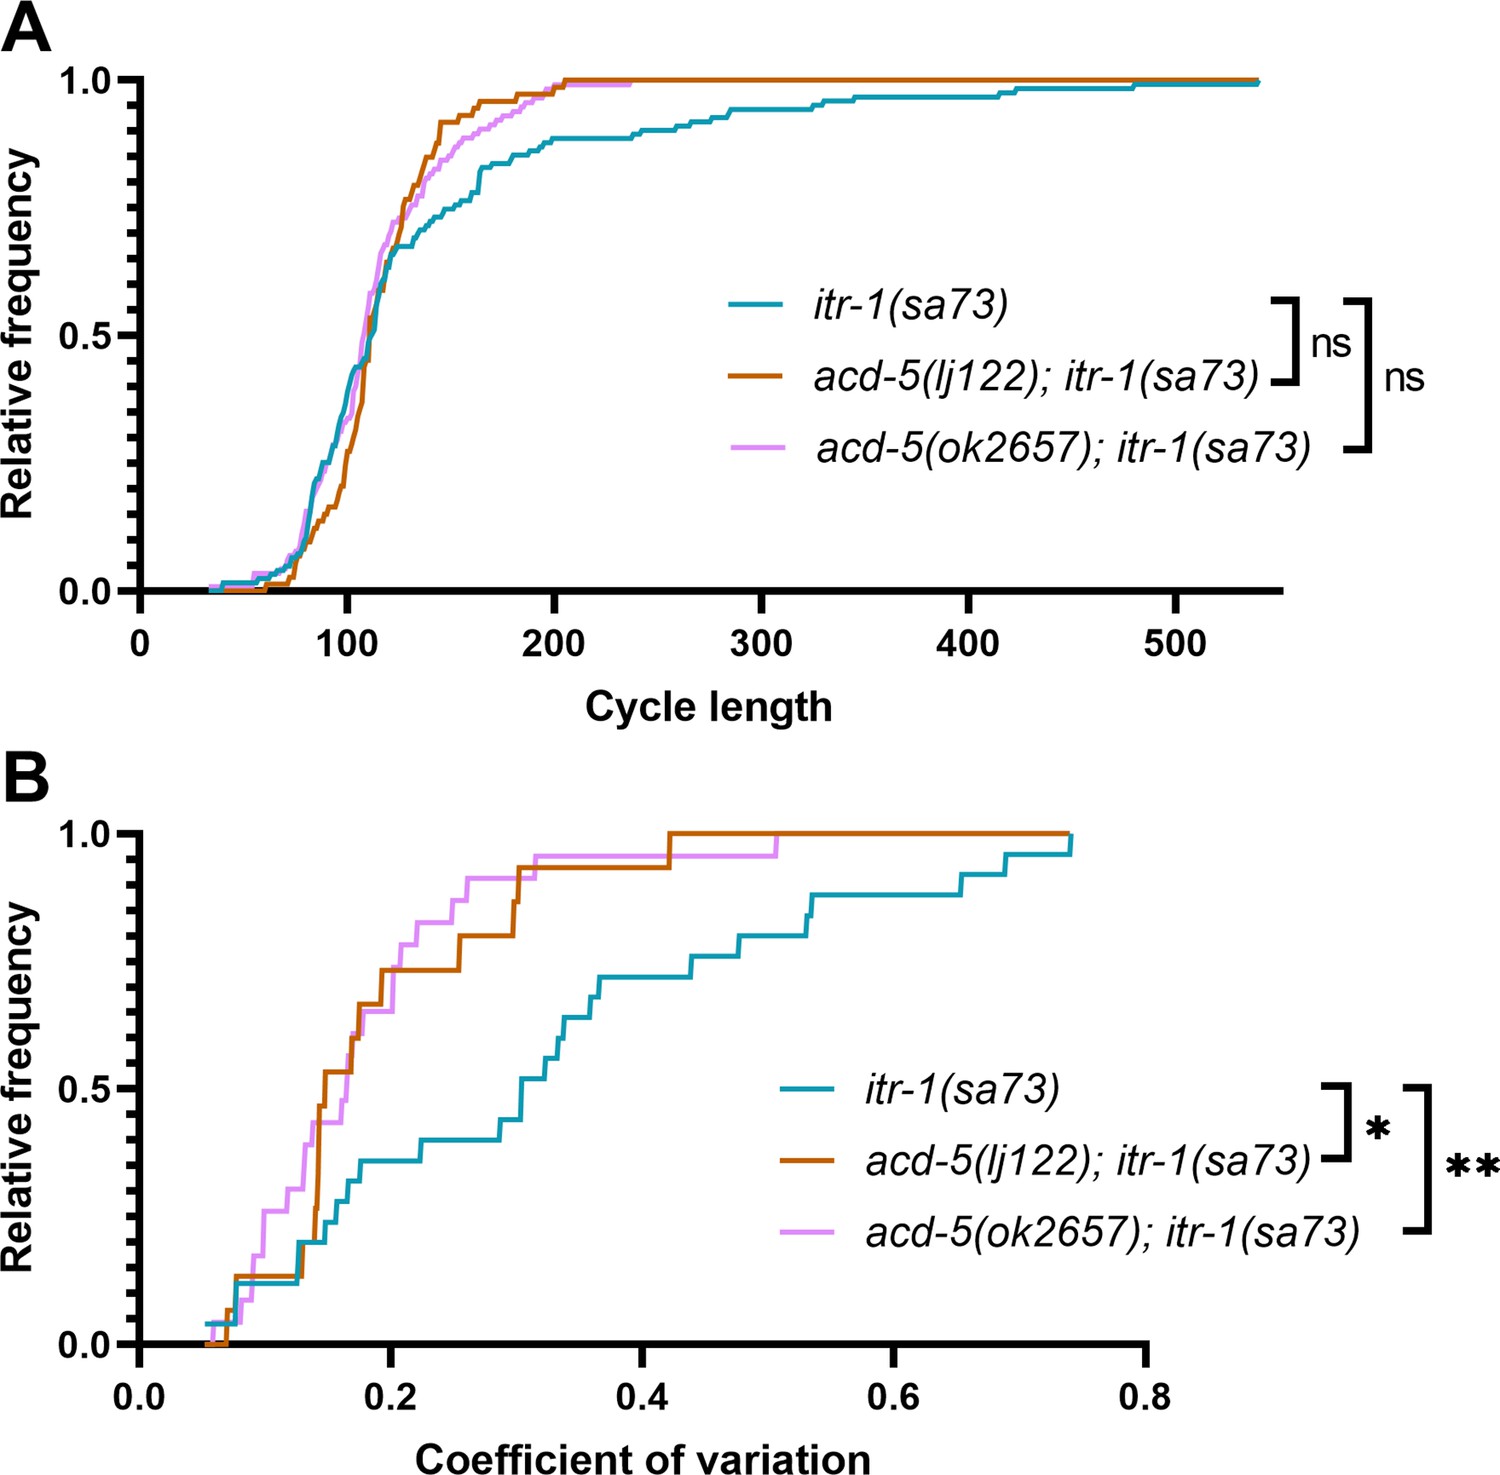
Comparison of cumulative distribution of cycle length and coefficient of variation in itr-1(sa73) strains.
Cumulative distributions using the data from Figure 3E. (A) DMP cycle length. Distribution of cycle length was compared using a Kolmogorov-Smirnov for complimentary cumulative distribution. itr-1(sa73) was not significantly different from acd-5(ok2657); itr-1(sa73) (p=0.3322, ns, D=0.123) or acd-5(lj122); itr-1(sa73) (p=0.0837, ns, D=0.186). (B) Coefficient of variation of cycle length. itr-1(sa73) was significantly different from both acd-5(ok2657); itr-1(sa73) (**p=0.0037, D=0.513) and acd-5(lj122); itr-1(sa73) (*p=0.021, D=0.493).
Figure 4 with 5 supplements
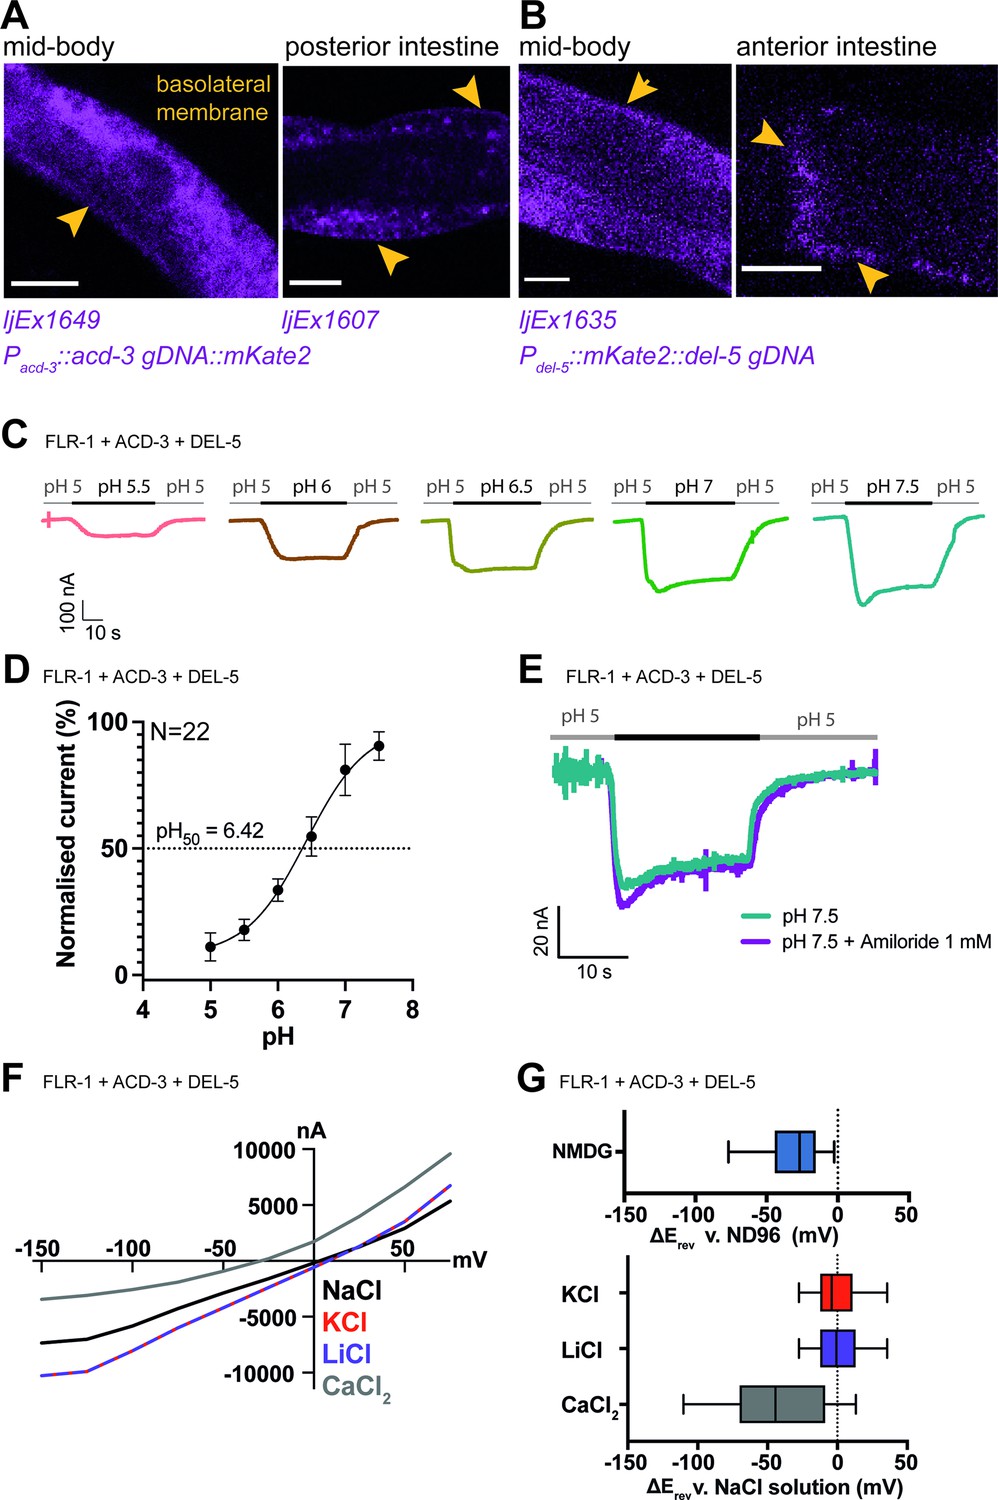
FLR-1 can form pH-sensitive heteromeric channels with ACD-3 and DEL-5.
(A) ACD-3 is localised at the basolateral intestinal membrane. Localisation of mKate2-C-terminally tagged ACD-3 ljEX1649 and ljEx1607 (Pacd-3::acd-3 gDNA::mKate2) (magenta) shows evidence of basolateral membrane localisation (yellow arrows). Shown are the mid-body (Left) and the posterior intestine (Right). Scale bar: 10μm. (B) DEL-5 is localised at the basolateral intestinal membrane. Localisation of mKate2-N-terminally tagged DEL-5 ljEx1635 (Pdel-5:: mKate2::del-5 gDNA) (magenta) shows evidence of basolateral and lateral membrane localisation (yellow arrows). Shown are the mid-body (Left) and the anterior intestine (Right). Scale bar: 10μm. See Figure 5—figure supplement 3 for evidence that the fusions used in (A) and (B) rescue the defecation phenotypes of acd-3/del-5 double mutants discussed later. (C) Representative traces from Xenopus oocytes injected with flr-1, acd-3, and del-5 cRNA (250ng/μl of each construct) for the pH ranges pH 5.5–7.5 (gray bar represents perfusion time) from a holding pH of 5. Currents were recorded at a holding potential of –60mV and traces are baseline-subtracted and drift-corrected using the Roboocyte2+ (Multichannels) software. (D) pH response curve (I/Imax as percentage) covering the ranges pH 5–7.5 from a holding pH of pH 5. N=22. Mean ± SEM. Currents were recorded at a holding potential of –60mV, normalised to maximal currents and best fitted with the Hill’s equation (Nonlin fit Log(inhibitor) versus normalised response–variable slope) in GraphPad Prism. (E) The FLR-1/ACD-3/DEL-5 heteromeric channel is insensitive to the blocker amiloride. Representative traces from Xenopus oocytes injected with flr-1, acd-3, and del-5 cRNA (250ng/μl of each construct) perfused with pH 7.4 (black line) in the absence (cyan) or in the presence (purple) of 1mM amiloride. Currents were recorded at a holding potential of –60mV. (F) Current-voltage (I-V) curve representative trace and (G) change in reversal potential (median and IQR, Tukey method), ΔErev when shifting from a ND96 to NMDG solution (top) (N=14 oocytes) or from a NaCl solution to KCl, LiCl, or CaCl2 solution (bottom) (N=16 oocytes).
Figure 4—figure supplement 1
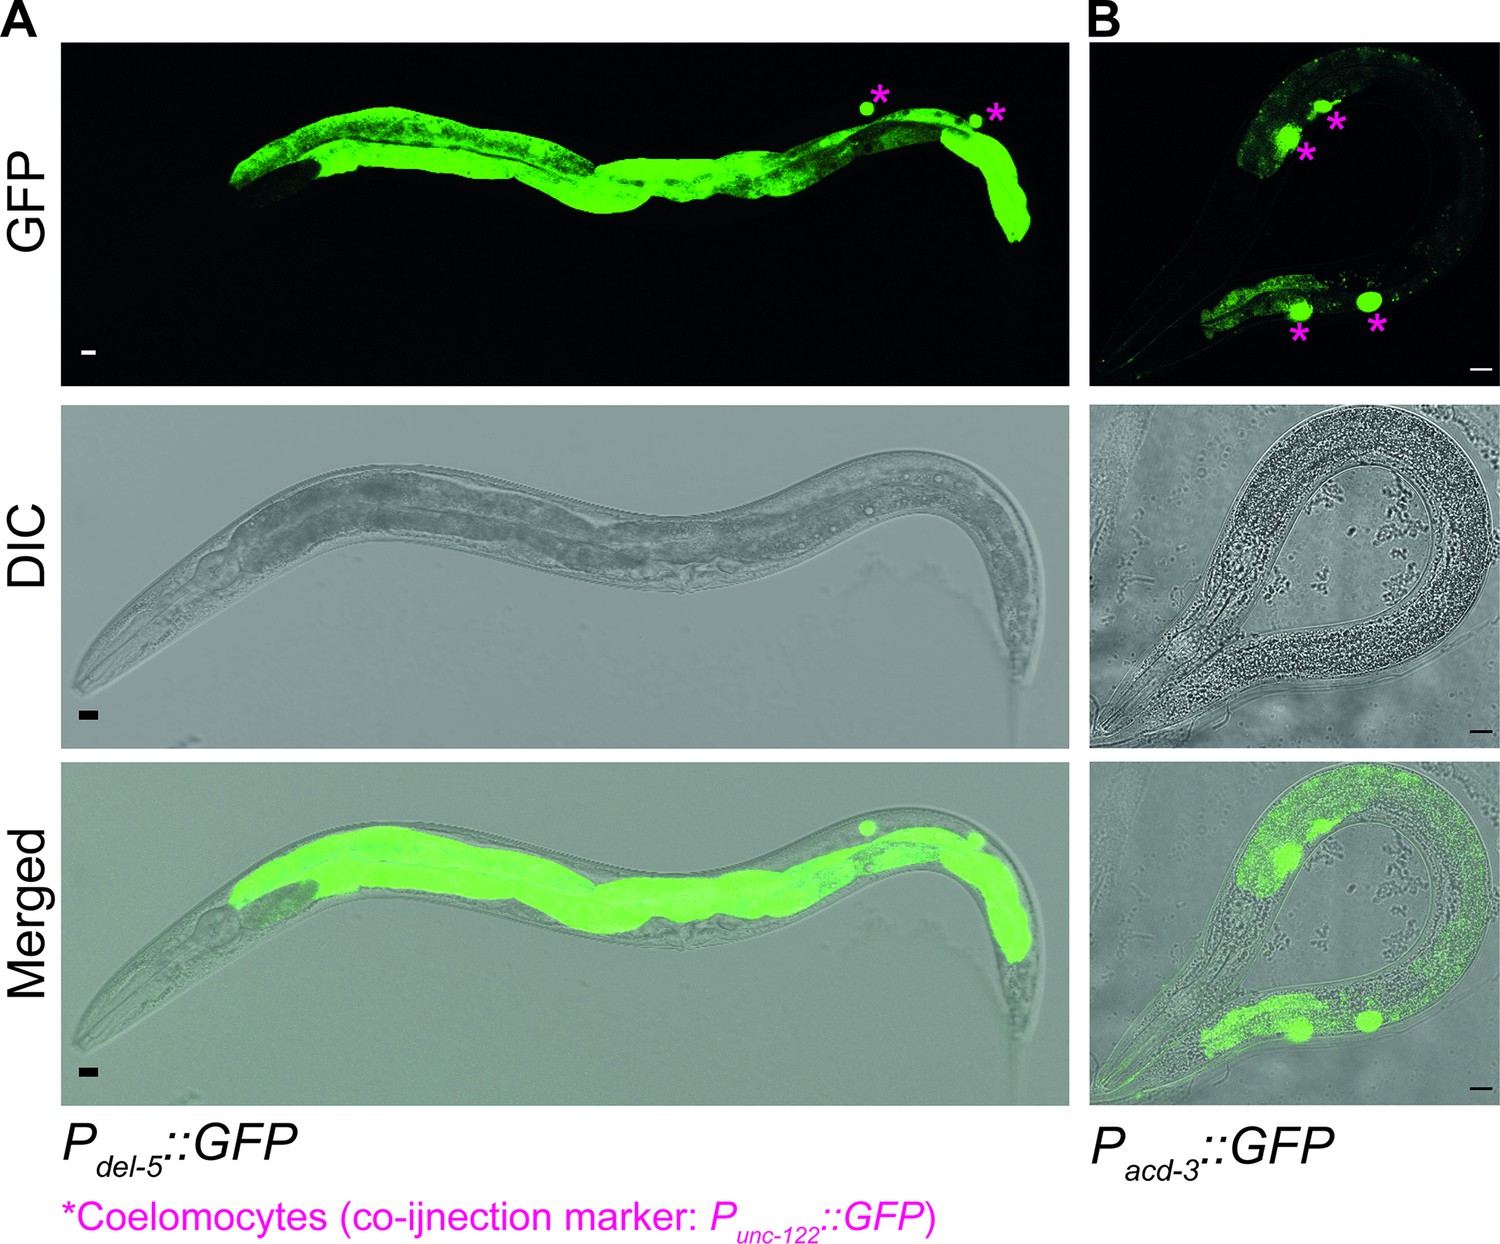
acd-3 and del-5 are expressed in the intestine.
Transcriptional reporters of (A) del-5 (ljEx1349) and (B) acd-3 (ljEx1345) expression, using the 5′ promoter sequences fused to the GFP gene. Scale bars are 10 µm.
Figure 4—figure supplement 2
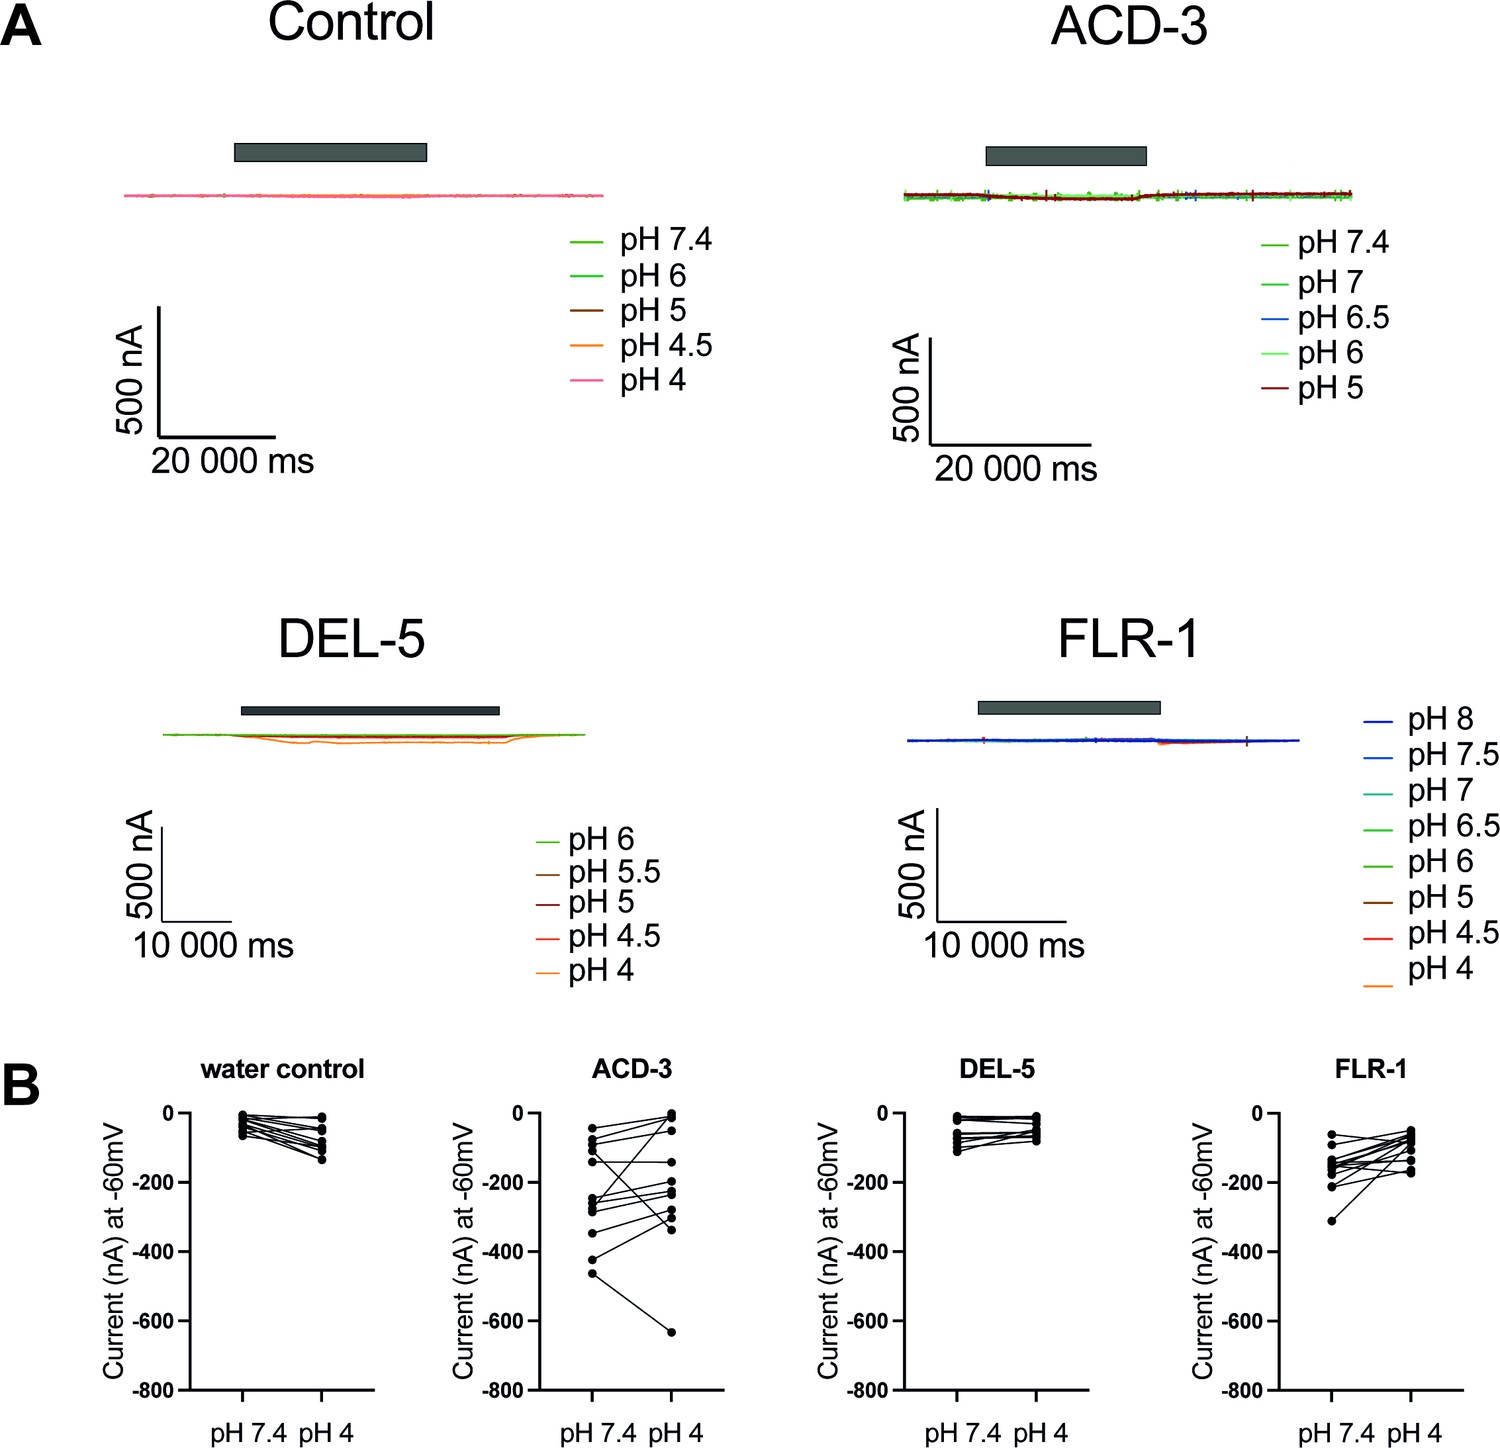
Characterisation of ACD-3, DEL-5, and FLR-1 homomeric channel acid-sensing properties.
(A) Representative traces of Xenopus oocytes injected with acd-3, del-5, or flr-1 cRNA (500 ng/µl) or water. Currents were recorded at a holding potential of −60 mV and traces are baseline-subtracted and drift-corrected using the Roboocyte2+ (Multichannels) software. (B) Actual currents of Xenopus oocytes injected with nuclease-free water (control), acd-3, del-5, or flr-1 cRNA when perfused with pH 7.4 versus pH 4 (each individual oocyte is connected by a line). N=8, 13, 14, and 6, respectively. For ease of visualisation, inward currents are converted to positive values.
Figure 4—figure supplement 3
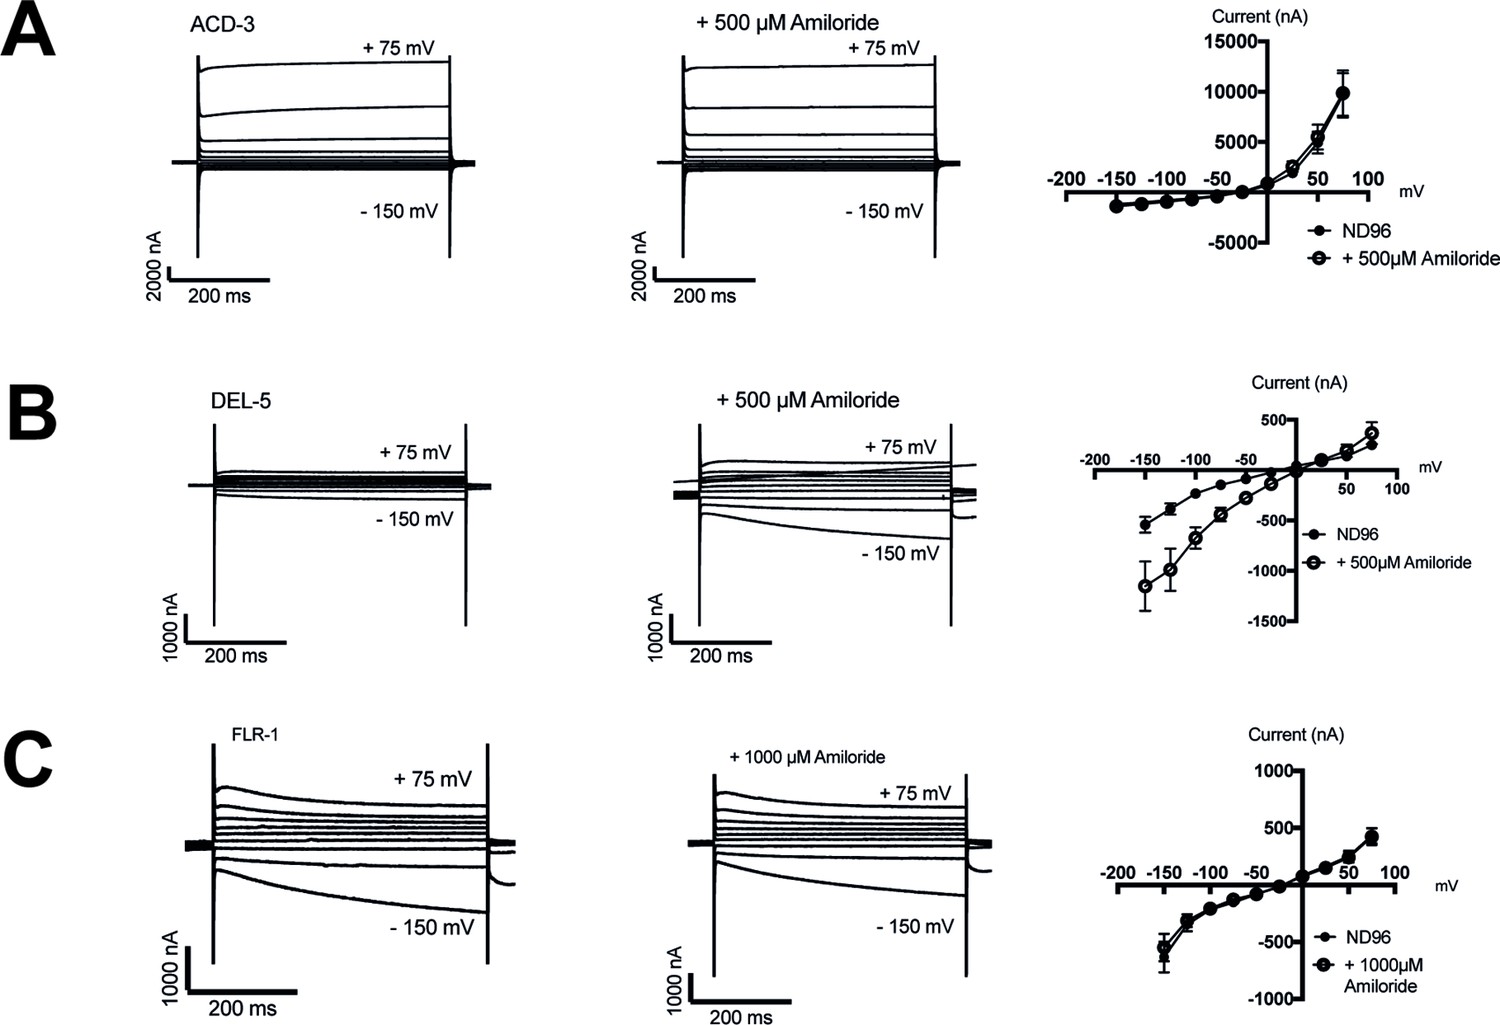
Characterisation of ACD-3, DEL-5, and FLR-1 homomeric channel amiloride-sensitivity.
(A–C) Representative traces and current-voltage relationships when Xenopus oocytes injected with acd-3, del-5, or flr-1 cRNA were perfused with a neutral solution (ND96, pH 7.4) in the presence and absence of 500 μM or 1000 μM amiloride. N=5, 6, and 8, respectively. Error bars represent mean and SEM.
Figure 4—figure supplement 4
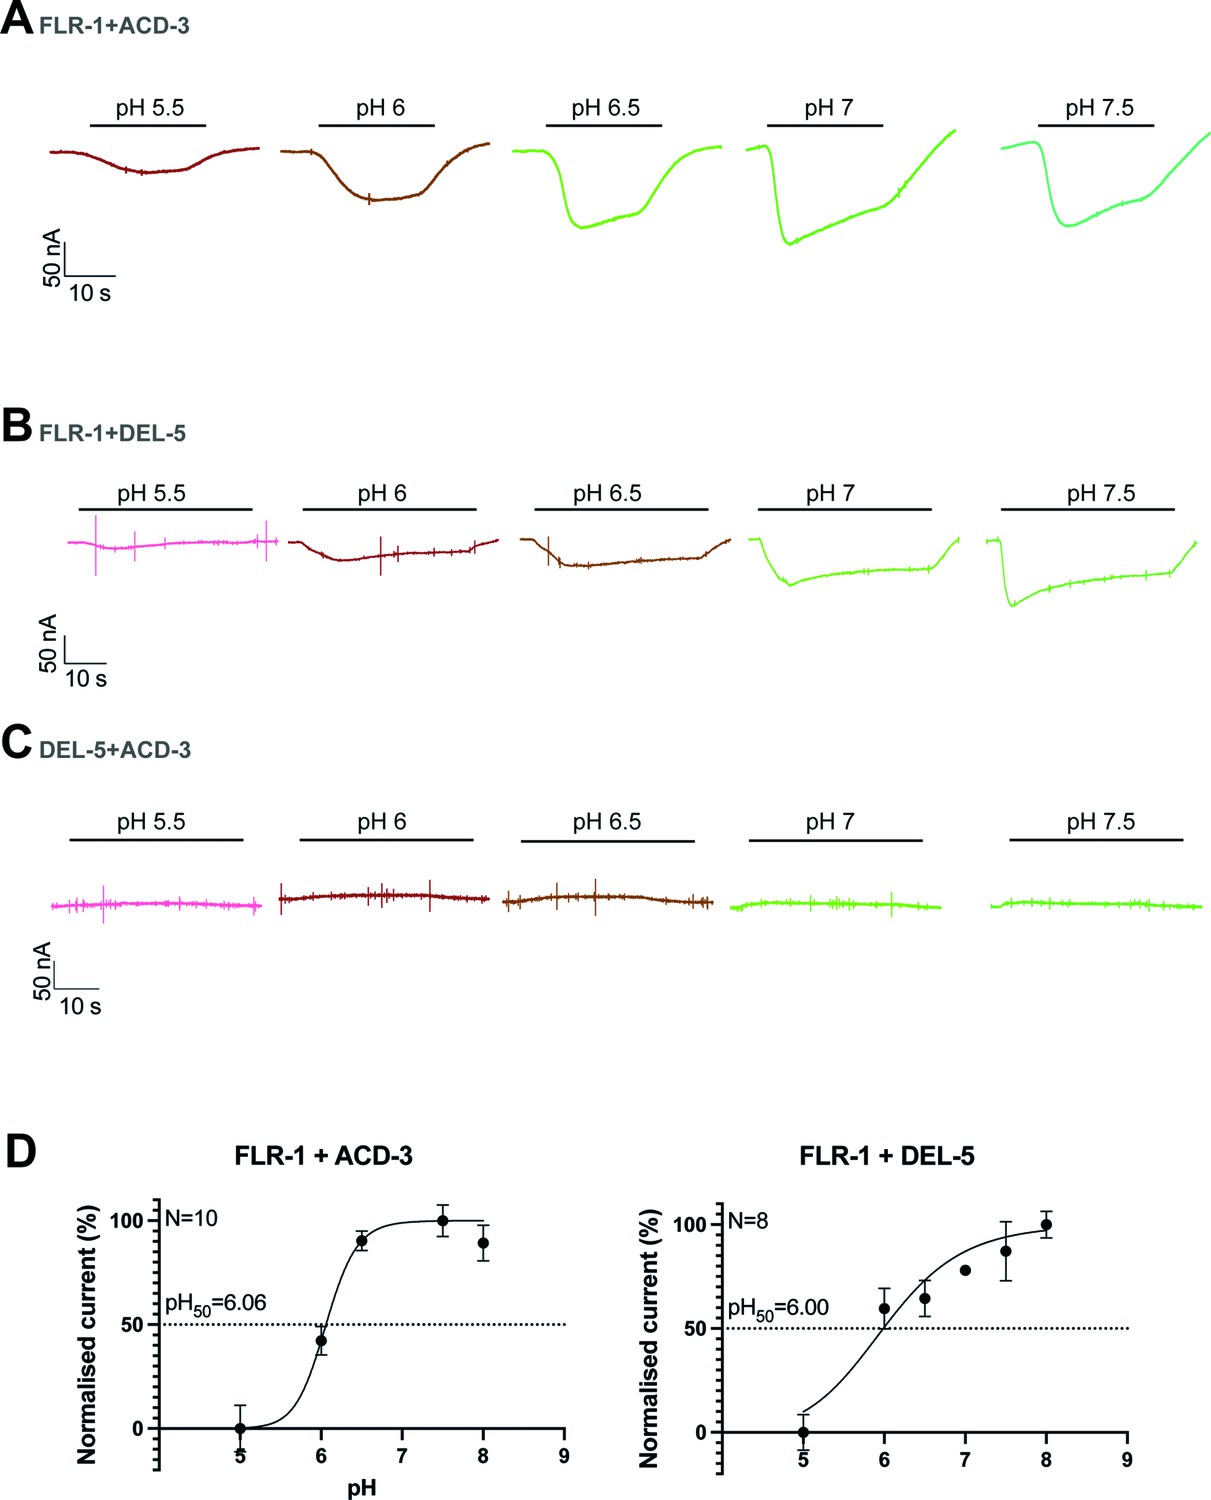
FLR-1 can form a pH-sensitive channel with ACD-3 or DEL-5.
(A–C) Representative traces of Xenopus oocytes injected with flr-1 cRNA with acd-3 or del-5 cRNA or acd-3 and del-5 cRNA (250 ng/µl for each construct). Black bar represents time of perfusion with the indicated pH. (D) pH response curve (I/Imax expressed as percentage) covering the ranges pH 5–8 from a holding pH of 5. N is the number of oocytes. Mean ± SEM. Currents were recorded at a holding potential of −60 mV, normalized to maximal currents and best fitted with the Hill equation (Nonlin fit Log(inhibitor) vs. normalised response–variable slope) in GraphPad Prism. Traces are baseline-subtracted and drift-corrected using the Roboocyte2+ (Multichannels) software.
Figure 4—figure supplement 5
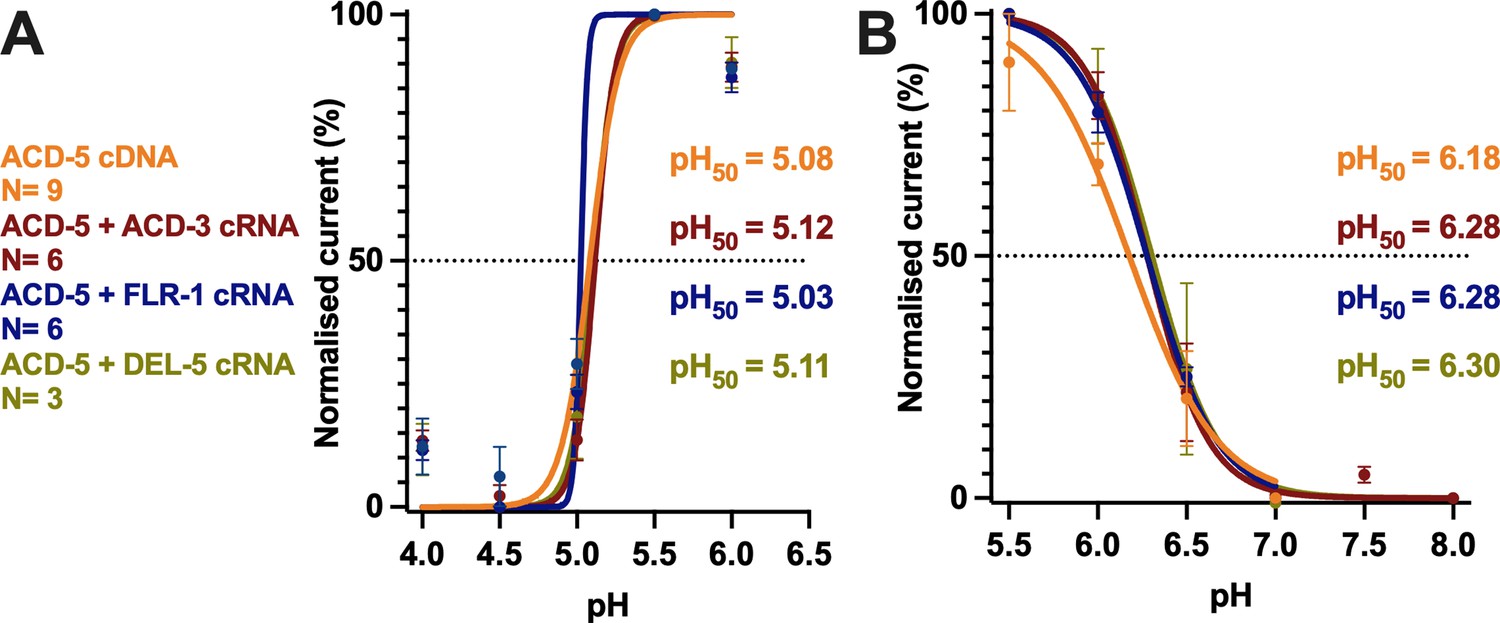
Co-expression with FLR-1, ACD-3, or DEL-5 does not change the pH50 of ACD-5.
PH response curve (I/Imax as percentage) covering the ranges (A) pH 4–6 and (B) pH 5.5–8 from a holding pH of 7.4. pH50 for each construct is indicated in the respective colour. N is the number of oocytes. Mean ± SEM. Currents were recorded at a holding potential of –60 mV, normalised to maximal currents and best fitted with the Hill equation (Nonlin fit Log(inhibitor) vs. normalised response–variable slope) in GraphPad Prism.
Figure 5 with 3 supplements
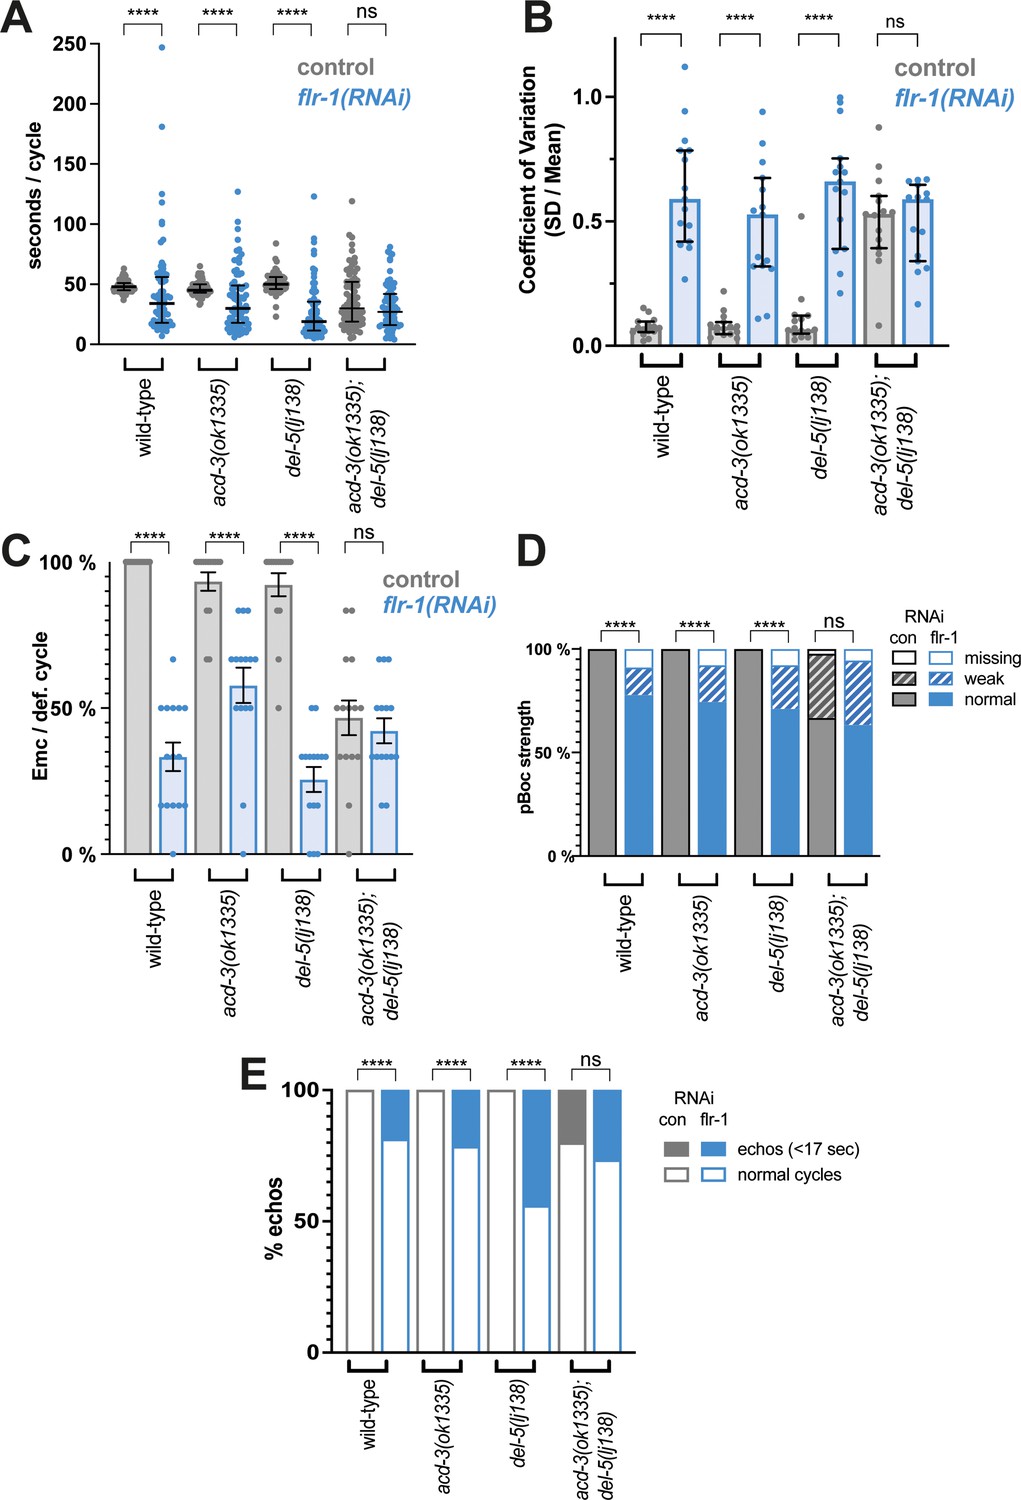
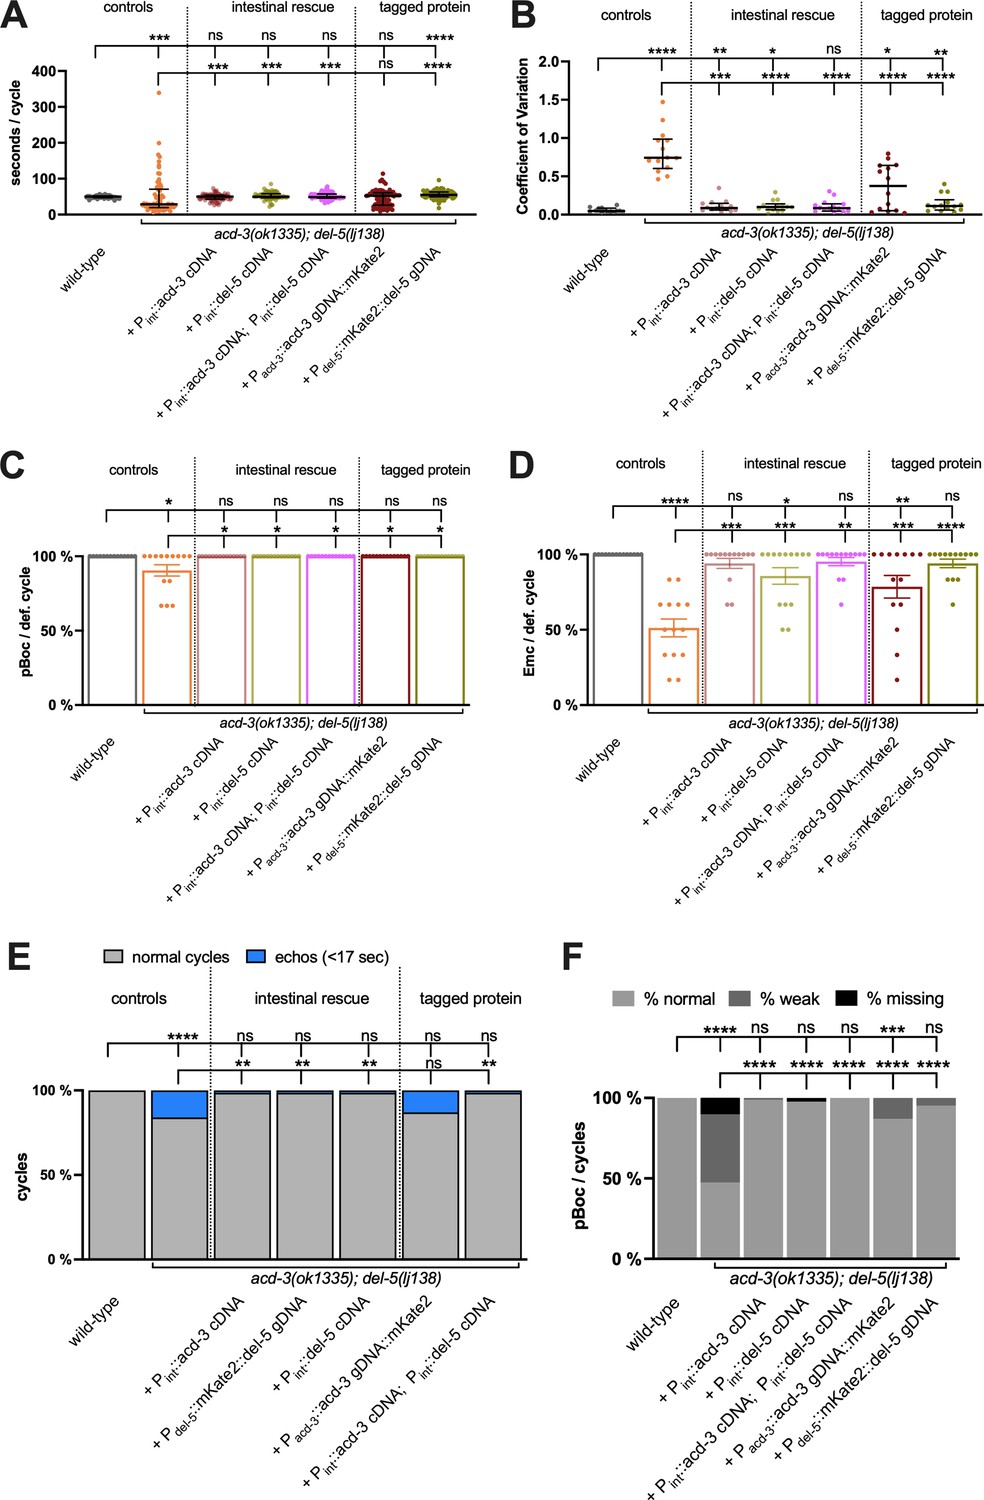
Knockdown of flr-1 and mutations in acd-3/del-5 results in arrhythmic DMP intervals, missed muscle contractions, and echos.
FLR-1 or ACD-3/DEL-5 depletion alters cycle length and variability. (A) DMP interval and (B) coefficient of variation of animals on flr-1(RNAi) (blue) versus control RNAi (grey) assessed by a Mann-Whitney U-test (****p<0.0001, acd-3(ok1335); del-5(lj138) control vs. flr-1 (RNAi) p=0.0.0892for cycle length, p=0.5for CV). Error bars represent median and IQR. (C) Percentage of missed EMCs (mean and SEM) (****p<0.0001; acd-3(ok1335); del-5(lj138) control vs. flr-1 (RNAi) p=0.2535, Mann-Whitney). (D) Percentage of cycles displaying the pBoc characteristics indicated (****p<0.0001; acd-3(ok1335); del-5(lj138) control vs. flr-1 (RNAi) p=0.5861, Fisher exact test). (E) Percentage of ‘echo’ cycles, defined as cycles that last for under 17s (Teramoto and Iwasaki, 2006; Liu and Thomas, 1994) (****p<0.0001; acd-3(ok1335); del-5(lj138) control vs. flr-1 (RNAi) p=0.4516, Fisher exact test). N=13–15 animals for each genotype × 5 cycles scored for each animal.
Figure 5—figure supplement 1
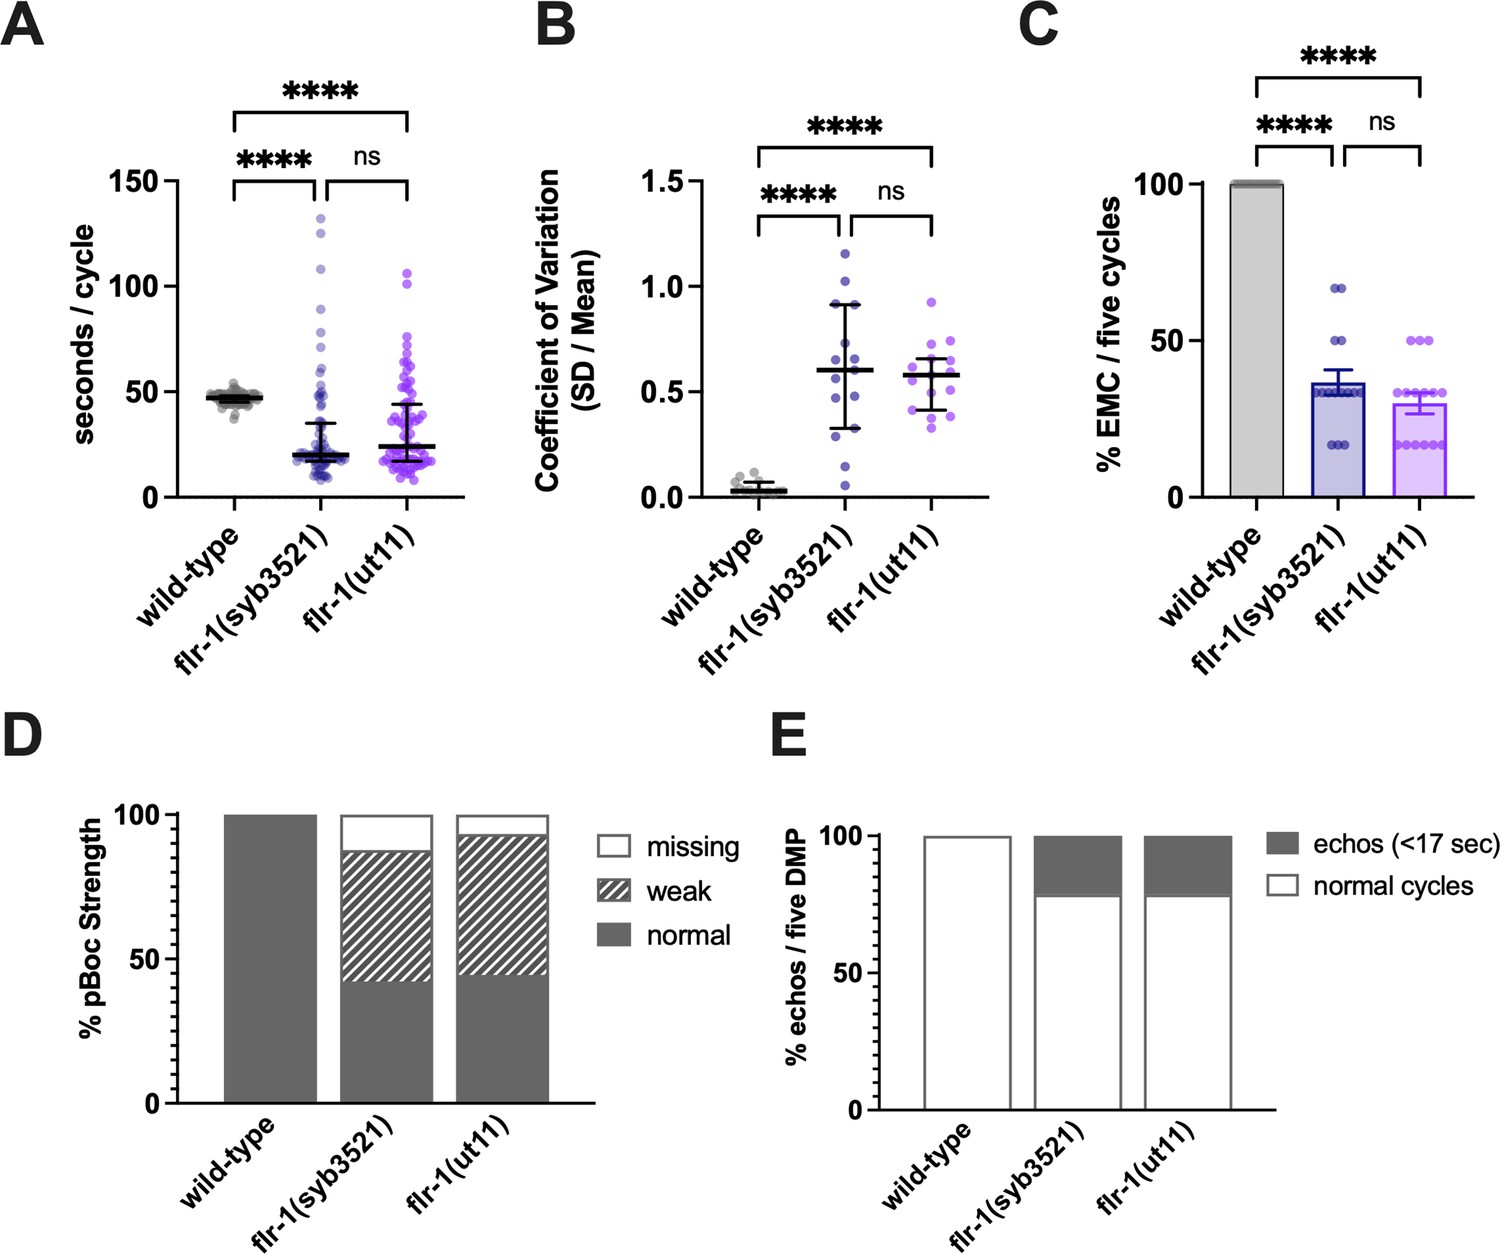
flr-1(ut11) and flr-1(syb3521) mutants show similar phenotypes.
Comparison of flr-1(ut11) and flr-1(syb3521) reveals similar defecation defects: Increased variability of cycle length, with a mix of very short and long cycles; missed EMCs and missed or weak pBocs. (A) Cycle length (median and IQR). Significance was assessed by a Kruskal-Wallis test with Dunn’s multiple comparison test (****p<0.0001, p=0.7514, ns). (B) Coefficient of variation (CV; median and IQR). Significance was assessed by a Kruskal-Wallis test with Dunn’s multiple comparison test (****p<0.0001, p>0.9999, ns). (C) Percentage of missed EMCs (mean and SEM). Significance was assessed by a Kruskal-Wallis test with Dunn’s multiple comparison test (****p<0.0001, p>0.9999, ns). (D) Percentage of pBocs displaying the characteristics indicated. (E) Percentage of echo cycles. N=15 animals, five cycles scored for each animal.
Figure 5—figure supplement 2
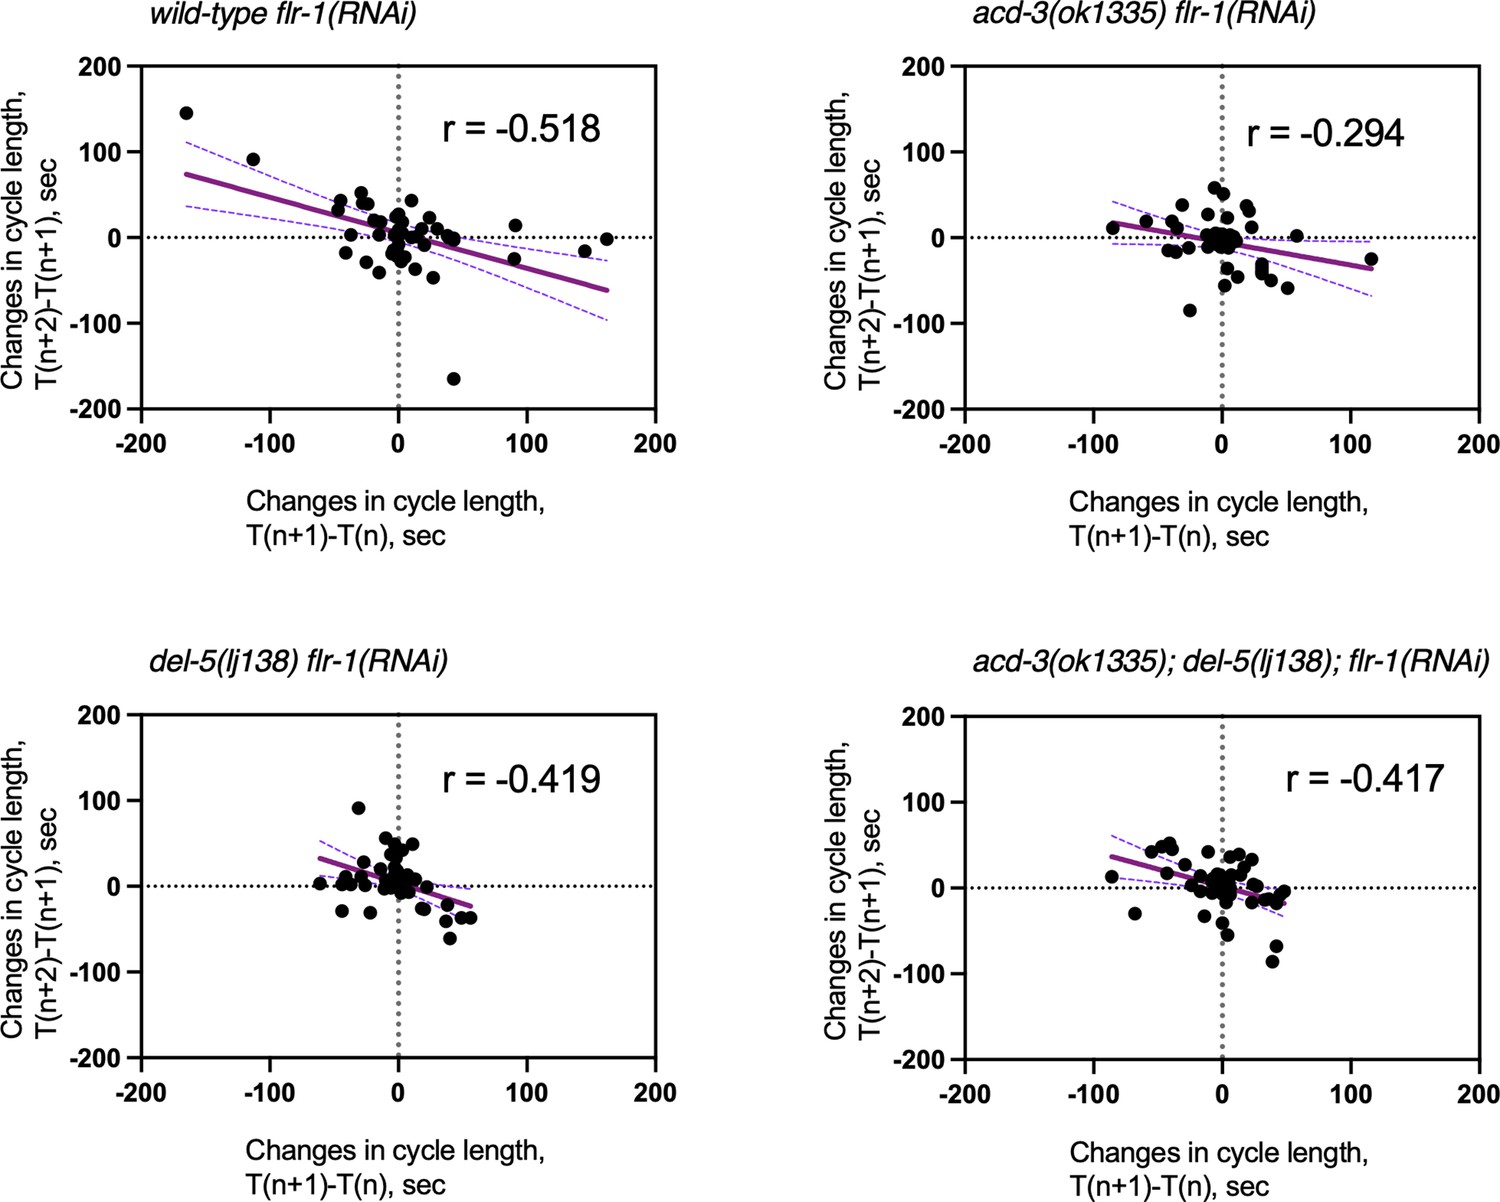
Analysis of the defecation cycle of single and double mutants on flr-1(RNAi) reveals compensatory behaviour in the oscillator.
Scatter plot of the change in period time in one cycle pair compared to the subsequent cycle pair for mutants on flr-1(RNAi). T(n) is the period of the cycle n. Linear regression (Person’s r) was used to derive the line which, is shown with 95% confidence limits (dashed lines). N=13–15 for each genotype, five cycles scored for each animal.
Figure 5—figure supplement 3
Intestine-specific expression of acd-3 or del-5, or expression of acd-3 or del-5 fluorophore fusions, rescues DMP defects of acd-3/del-5 double mutants.
(A) Quantification of DMP interval length and (B) coefficient of variation for acd-3(ok1335), del-5(lj138) double mutant animals, rescued with the constructs indicated. Error bars represent median and IQR. (C) Expression of acd-3 or del-5 can rescue the missed pBoc muscle contractions, (D) missed EMCs (mean and SEM), (E) ‘echo’ DMPs (defined as cycles that last for under 17 s) and (F) strength of pBoc, as percentages of five cycles for each of the 15 individual animals scored. Intestinal specific rescues of either acd-3 or del-5 ljEx1634 [Pint::acd-3 cDNA]and ljEx1637 [Pint::del-5 cDNA] or both ljEx1641 [Pint::acd-3 cDNA; Pint::del-5 cDNA] and tagged proteins ljEx1635 [Pdel-5::mKate2::del-5 gDNA] and ljEx1640 [Pacd-3::acd-3 gDNA::mKate2] under their endogenous promoters are able to ameliorate the severe phenotypes of acd-3/del-5 mutants. All groups are assessed by a Mann-Whitney U-test, see Table 1 for p values. N=14 animals for each genotype, except acd-3(ok1335), del-5(lj138), 13 animals × 5 cycles scored for each animal.
Figure 6 with 3 supplements
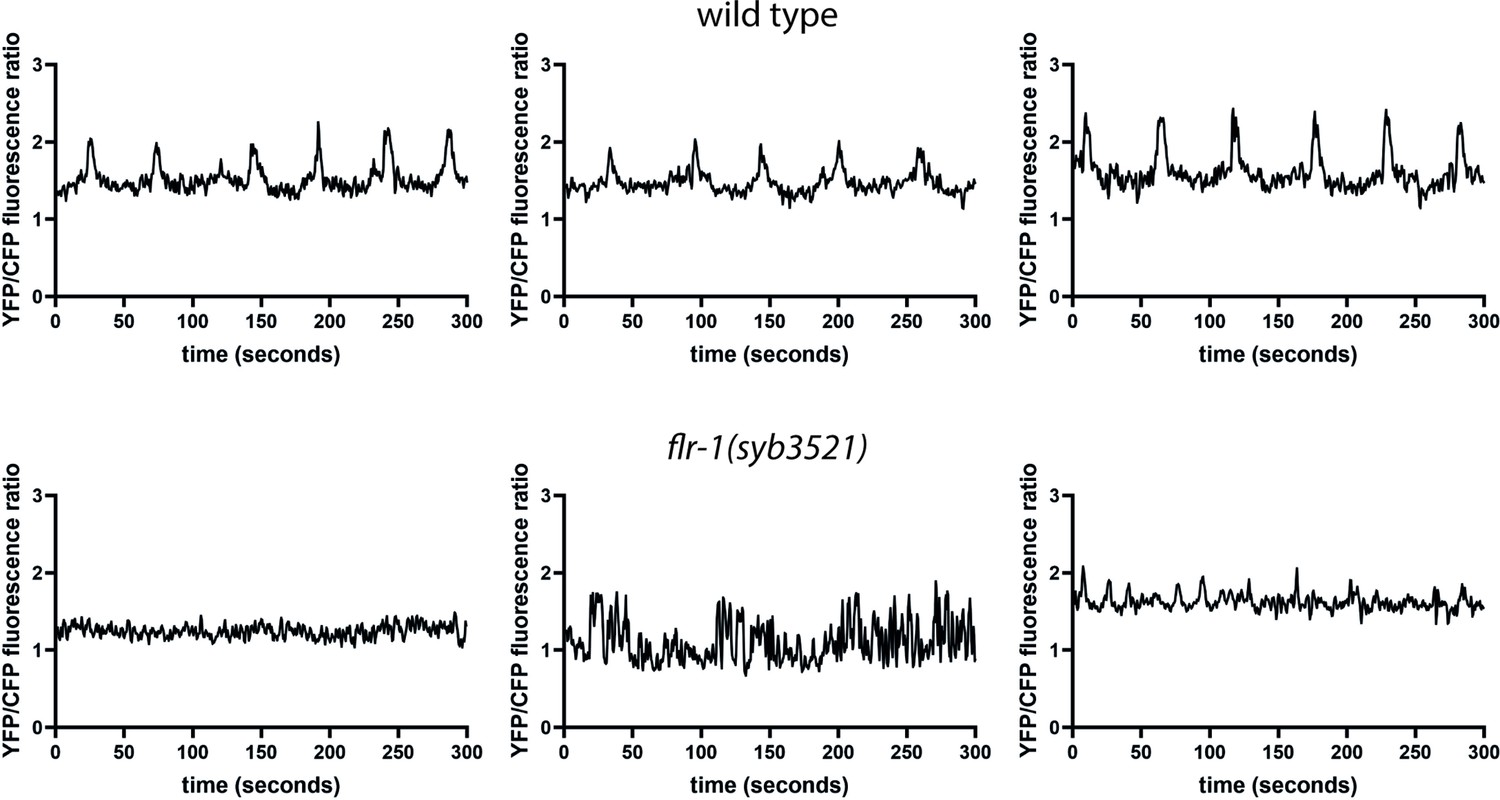
FLR-1 is required for rhythmic intestinal Ca2+ transients.
Representative example traces of Ca2+ transients in the posterior intestinal cells (int9), recorded in freely moving animals expressing the ratiometric indicator D3cpv.
Figure 6—figure supplement 1
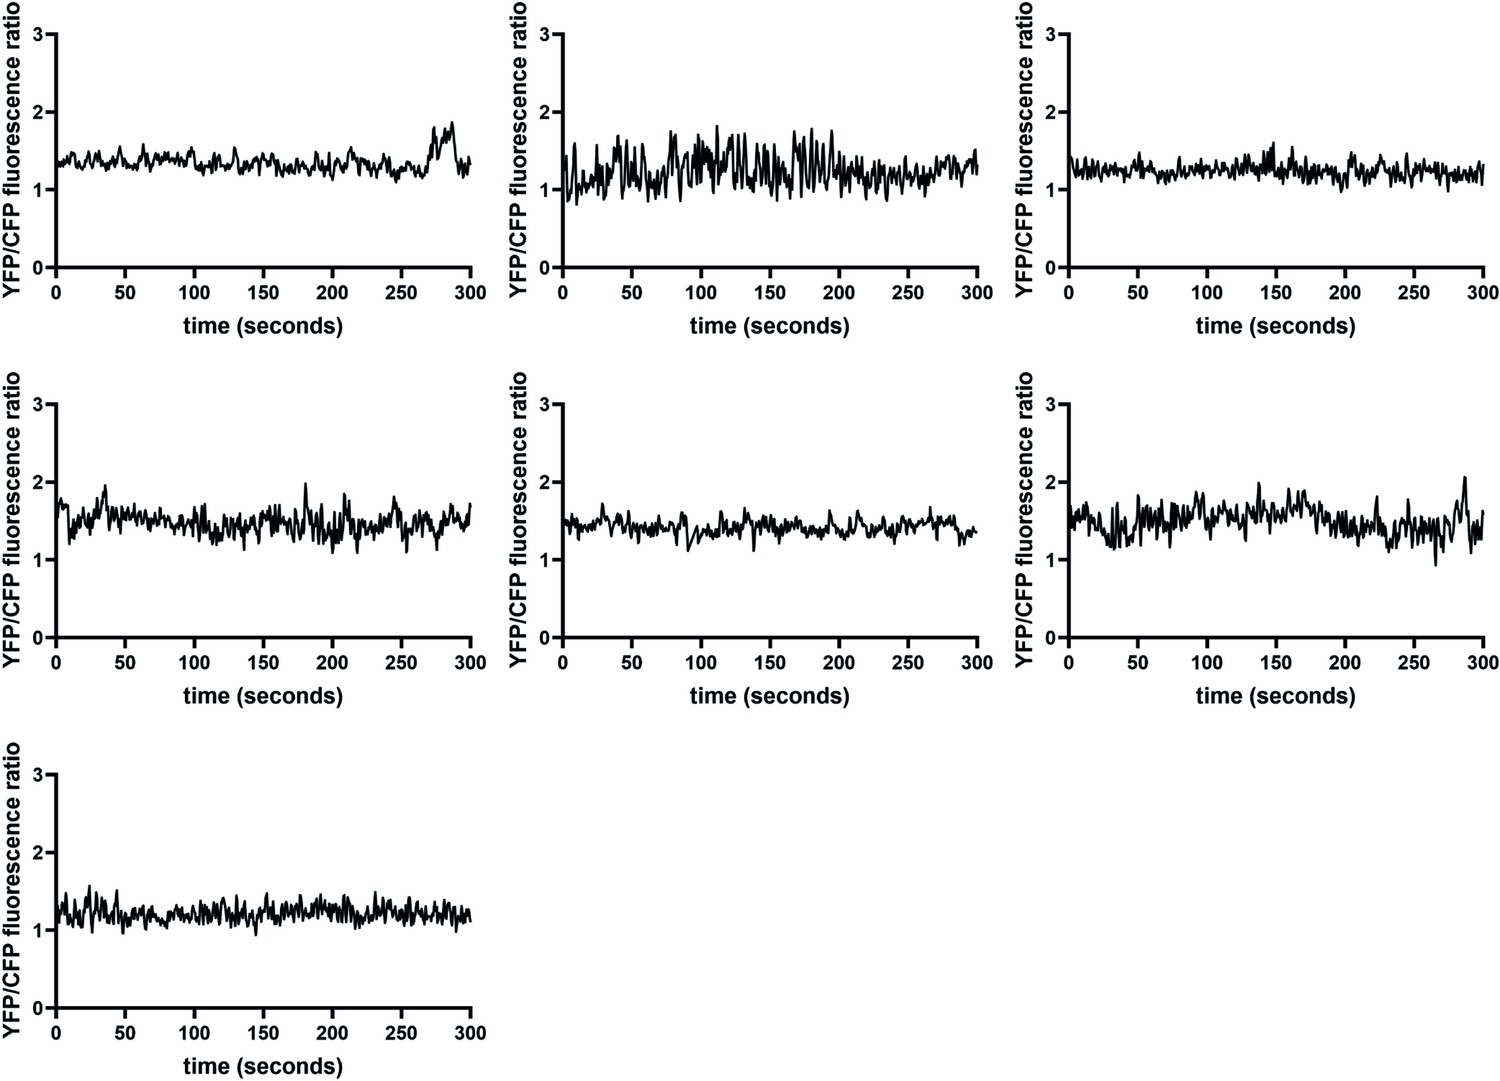
Additional intestinal Ca2+ traces for flr-1(syb3521), demonstrating the disruption of rhythmicity.
Ca2+ transients in the posterior intestinal cells (int9), recorded in freely moving animals expressing the ratiometric indicator D3cpv. This supplements the examples shown in Figure 6, showing all additional traces used in Figure 6—figure supplement 3.
Figure 6—figure supplement 2
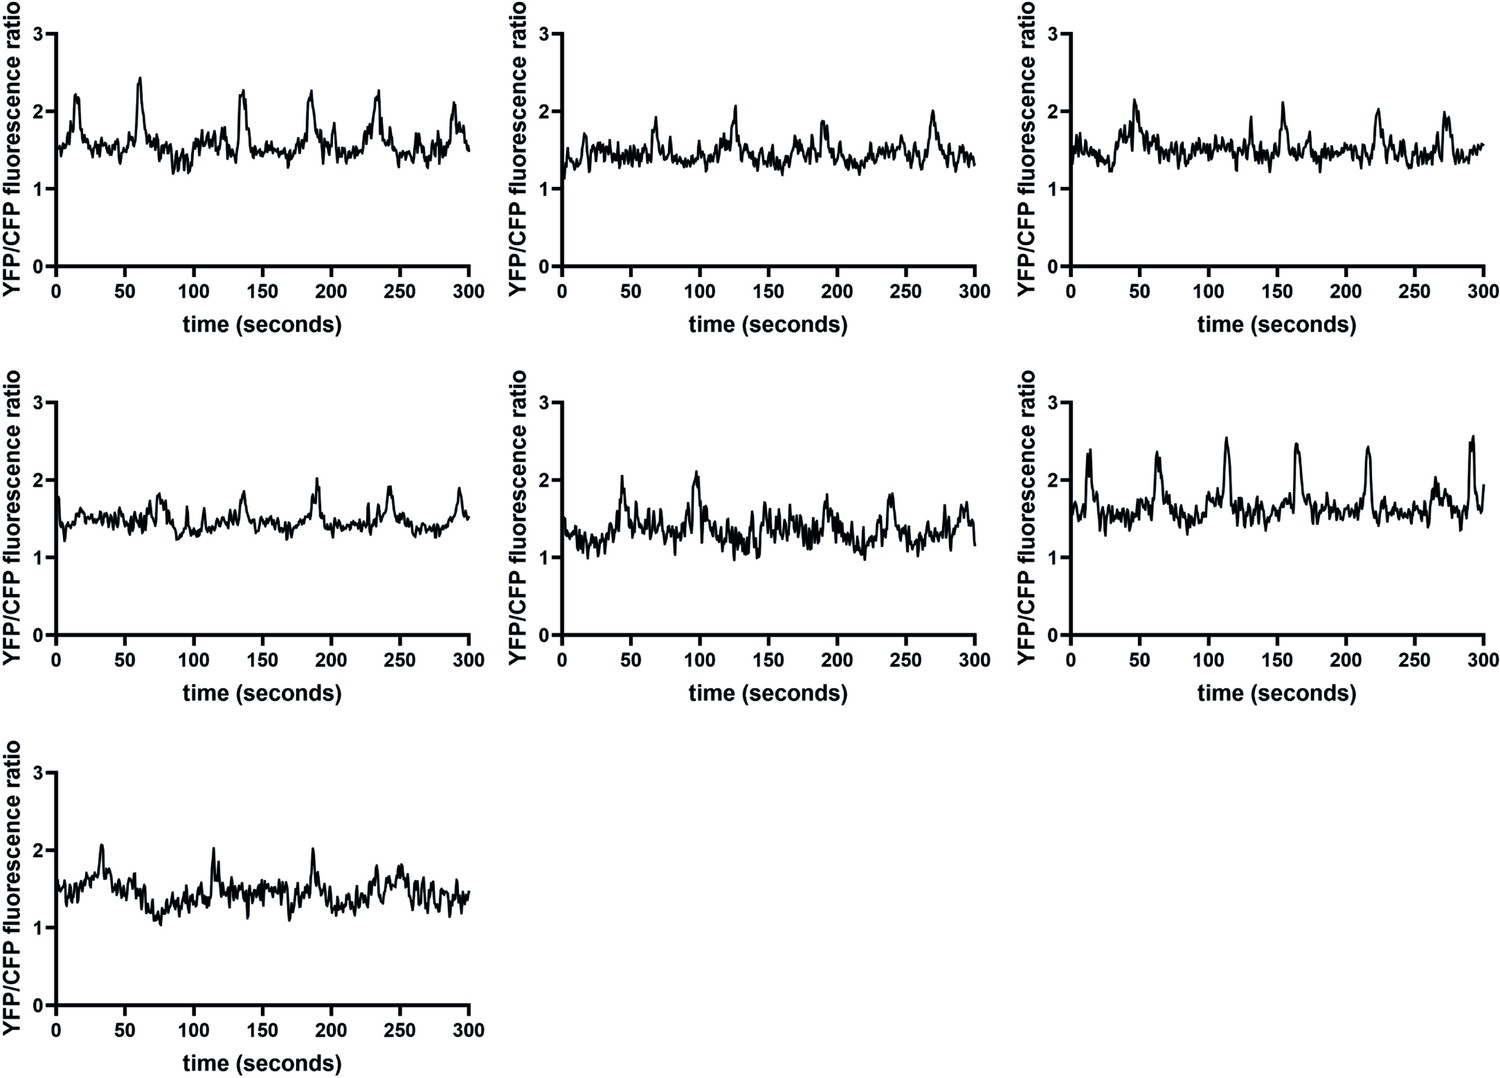
Additional intestinal Ca2+ traces for wild-type animals, demonstrating the rhythmicity of oscillations.
Ca2+ transients in the posterior intestinal cells (int9), recorded in freely moving, defecating animals expressing the ratiometric indicator D3cpv. This supplements the examples shown in Figure 6, showing all additional traces used in Figure 6—figure supplement 3.
Figure 6—figure supplement 3
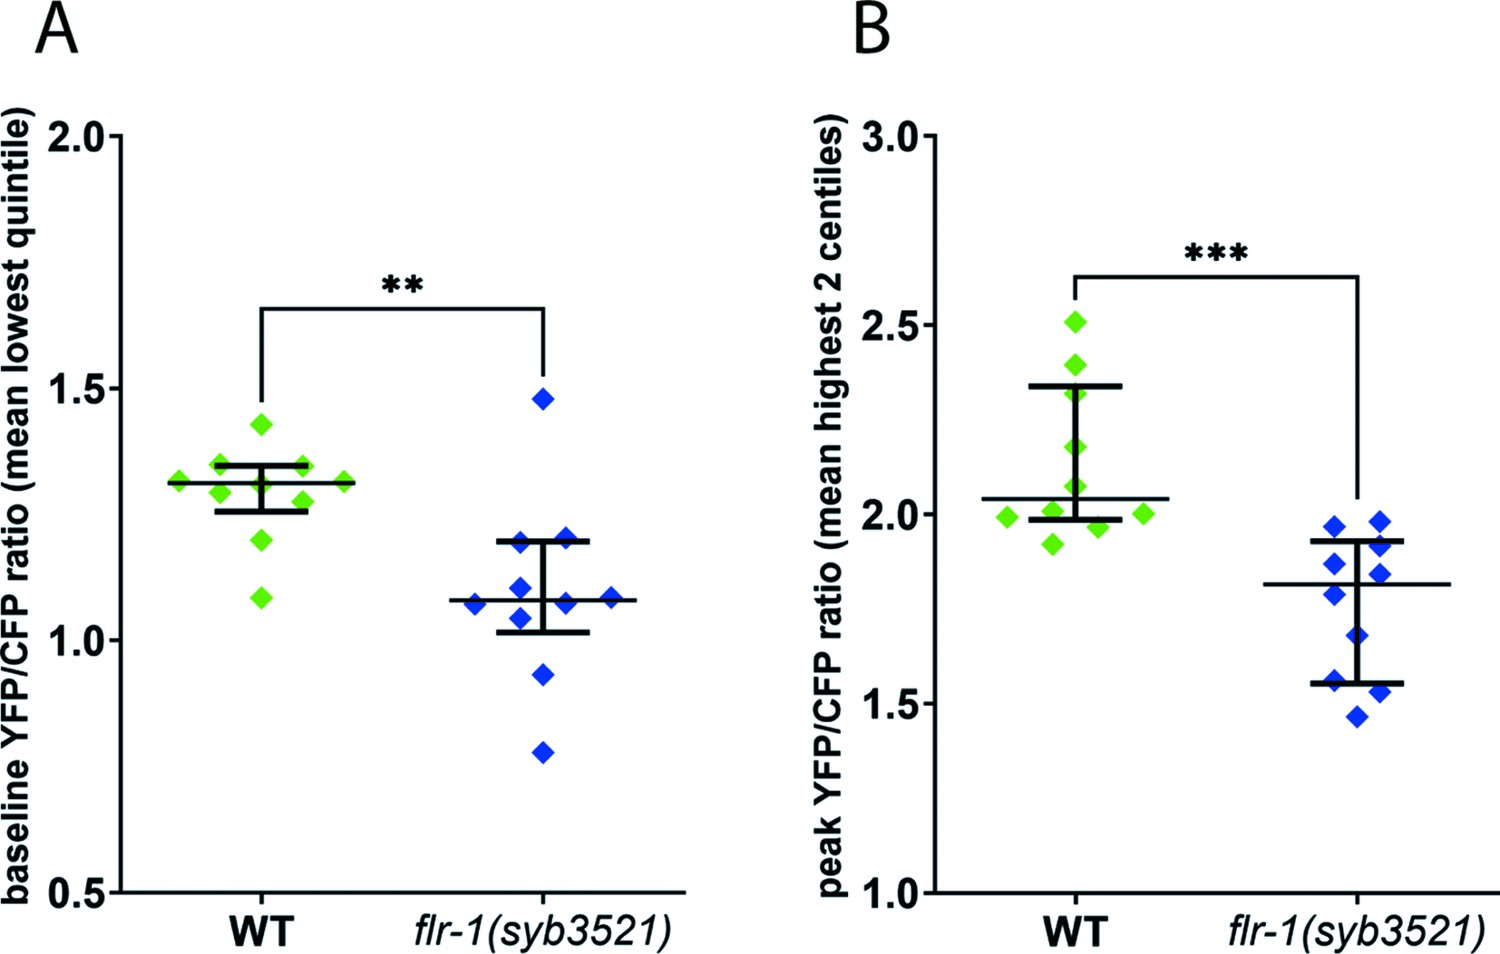
FLR-1 is required for rhythmic intestinal Ca2+ oscillations.
Ca2+ imaging of the posterior intestinal (int9) cells of freely moving, defecating animals. (A) flr-1(syb3521) animals exhibit reduced baseline Ca2+ levels. Scatter plot of mean YFP/CFP fluorescence ratio, for the frames corresponding to the lowest quintile, as a measure of baseline ratio, **p=0.0076, unpaired t-test. (B) flr-1(syb3521) animals exhibit reduced maximal Ca2+ levels. Scatter plot of mean YFP/CFP fluorescence ratio, for the frames corresponding to the two highest centiles, as a measure of maximal ratio, ***p=0.0005, unpaired t-test. Each data point is the mean for the relevant frames, for an individual recording; error bars are SEM, N=10 animals.
Figure 7

FLR-1 is required for rhythmic intracellular intestinal and pseudocoelomic pH oscillations.
Dynamic ratiometric fluorescent imaging to measure pH in freely moving, defecating animals. (A–C) Animals expressing an intestinal cytoplasmic pH-sensitive GFP construct pHluorin, to measure pHi. (D–F) Animals expressing an extracellular pH biosensor localised to the basolateral membrane of int9, to measure pHe. (A, D) Composites of adjacent frames extracted from a representative experiment, with relative pH values mapped to a ratio palette, as shown. Images were acquired at 2Hz, and each series is time normalised to pBoc. Animals are oriented anterior upward. Blue arrow denotes pBoc. Scale bars indicate 100µm. (B–C) Plots of R/R0 for pHi, time-normalised to pBoc, in control and flr-1(RNAi) treated worms, as indicated (N=6). (E–F) Plots of R/R0 for pHe, time-normaliszed to pBoc, in control and flr-1(RNAi) treated worms, as indicated (N=6). Note that the x-axis differs for pHi and pHe traces. (G) Mean pHi ± SD (calculated using a Boltzmann calibration) or pHe (ratio) ± SD (raw YFP/CFP ratio, as calibration was not possible for this biosensor) for the resting and minimum observed values, as well as ΔpH (N=6). Control and respective flr-1(RNAi) means were statistically compared using two-tailed, unpaired t-tests (*p<0.05). (H) Single, extended pHi traces (80s) to highlight the arrhythmia, weak internal acidification, and ‘echo’ cycles observed in many flr-1(RNAi) animals.
Figure 8 with 1 supplement

Consequences of disruptions of proton signalling in the intestine.
(A) acd-5(ok2657), acd-3, and del-5 single mutants show a subtle developmental delay. Developmental timing (generation time) of DEG/ENaC single mutants in hours from egg laid to first egg laid as an adult. N=115, 102, 96, 49, and 62, in order on graph. Kruskal-Wallis test with Dunn’s multiple comparison post hoc test, ***p=0.0004, ****p<0.0001. (B) flr-1 single mutants and acd-3/del-5 double mutants show a severe developmental delay. Developmental timing of DEG/ENaC single, double and triple mutants in days from egg-laid to day of onset of egg-laying. N=as in (A) for single mutants; 76, 92 for the remainder. (C) flr-1 single mutants and acd-3/del-5 double mutants are short. Quantification of body size of DEG/ENaC single, and double mutants. Each circle is an individual worm. N=12, 23, 17, 15, 31, and 15. Kruskal-Wallis test with Dunn’s multiple comparison post hoc test, ****p<0.0001. Error bars indicate median and IQR. Each individual point is one animal. (D) flr-1 single mutants and acd-3/del-5 double mutants show aberrant fat metabolism. Fat storage and distribution of DEG/ENaC single and double mutants assessed by Oil-Red-O staining of 10 representative animals. Scale bar: 50μm.
Figure 8—figure supplement 1
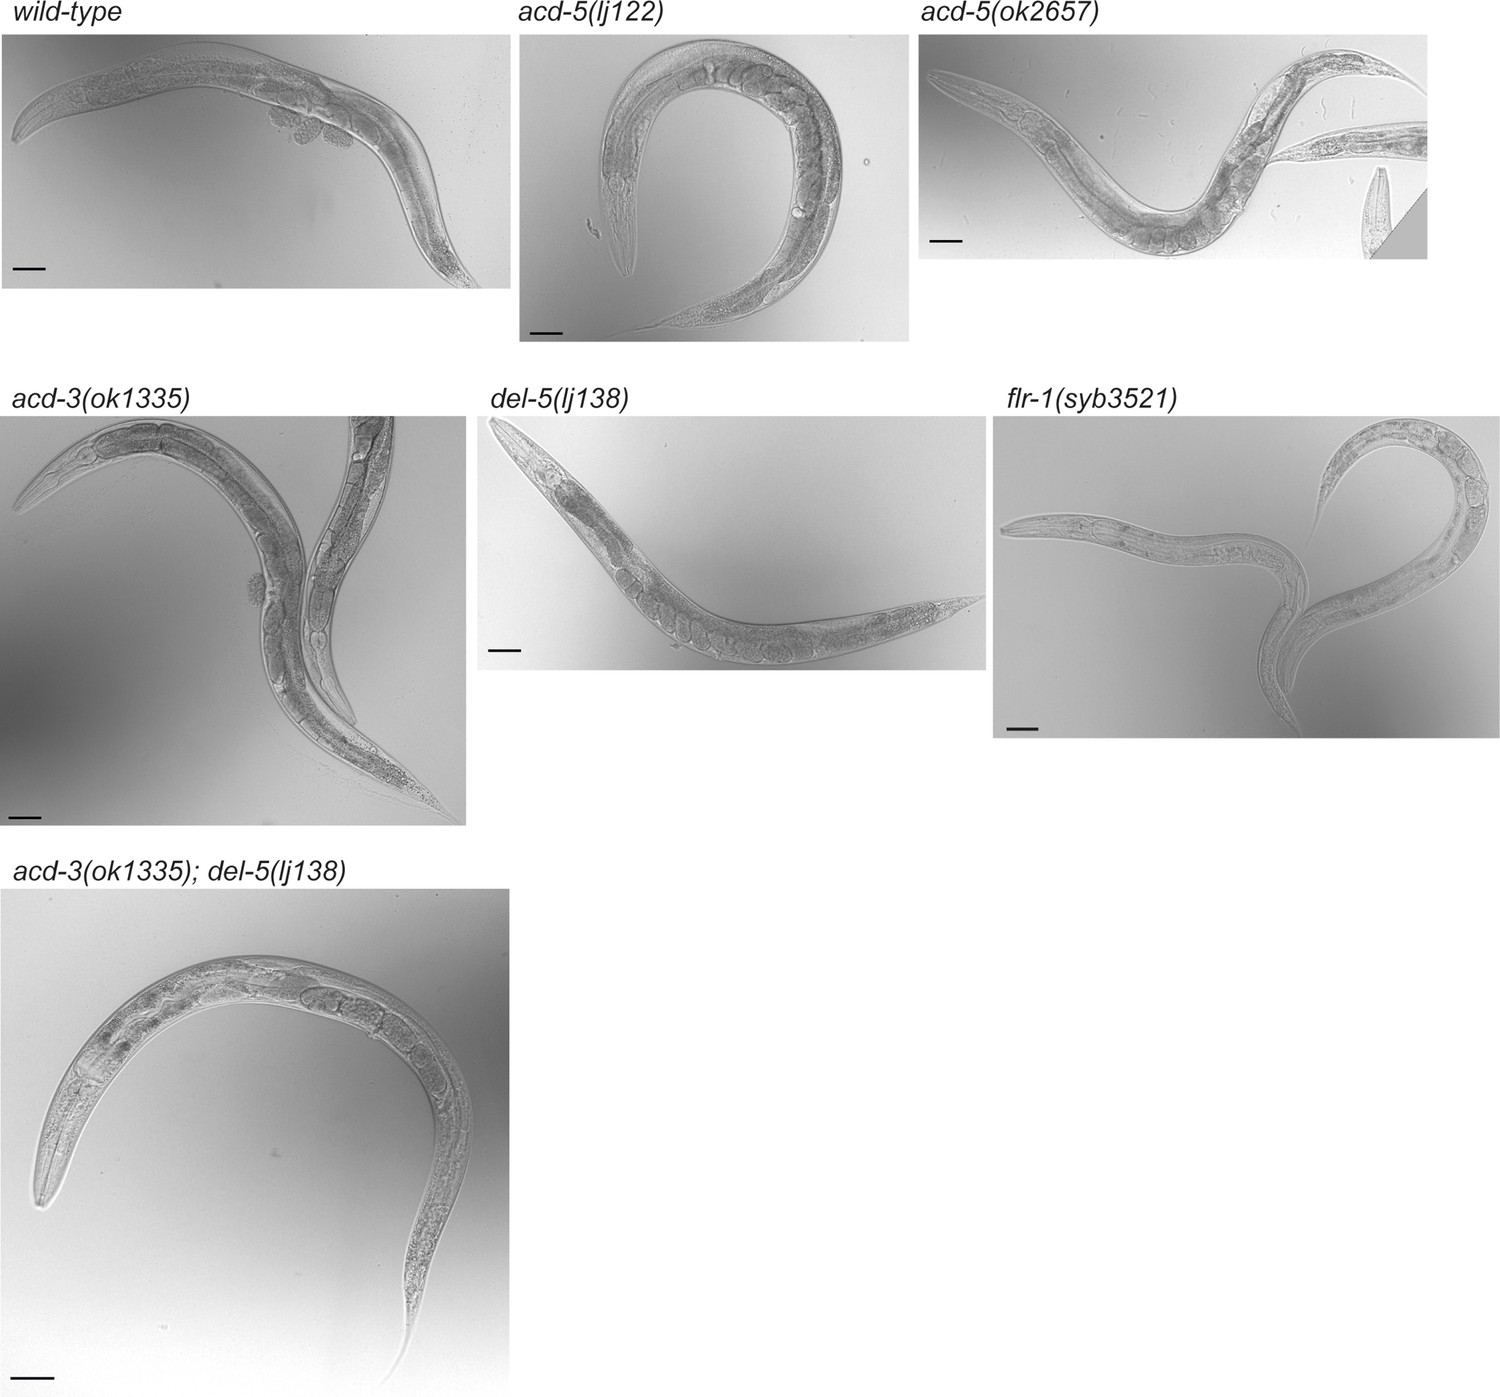
flr-1 and acd-3/del-5 deficient animals exhibit a caloric restriction phenotype.
Single and double mutant day-1 adults for the DEG/ENaCs expressed in the intestine. Single mutants for acd-5, acd-3, or del-5 show a wild-type body shape, while flr-1 single or acd-3/del-5 double mutants are thin with few eggs. Scale bars are 50 μm.
Figure 9
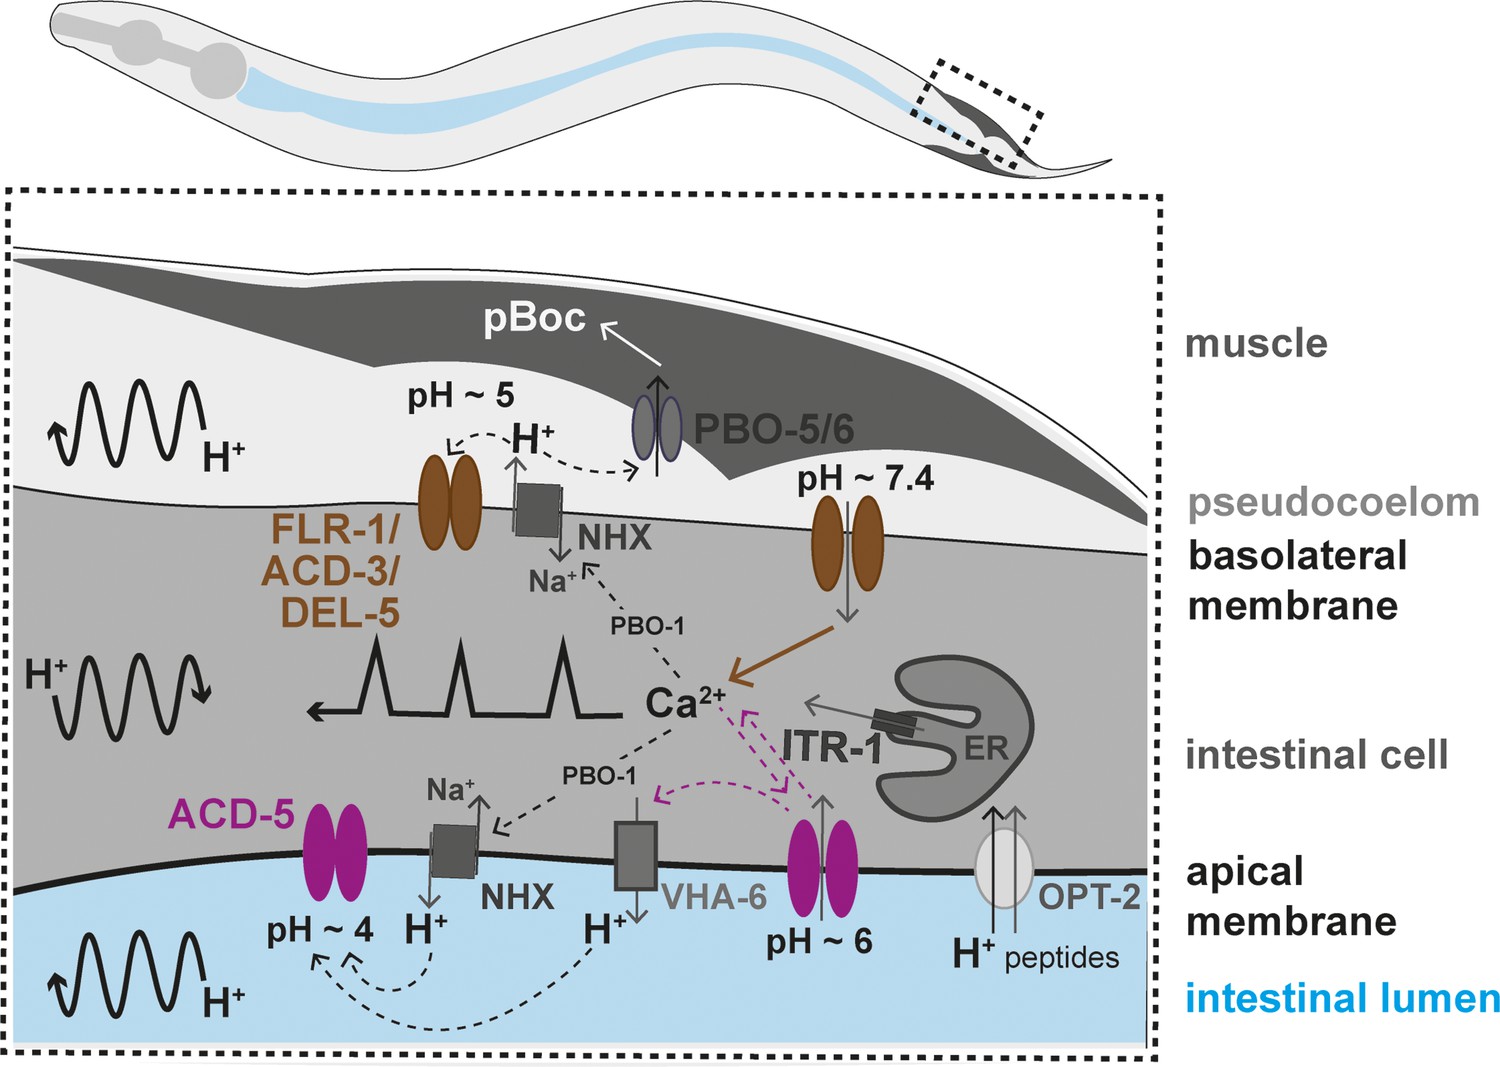
Working model of the two acid-sensing DEG/ENaCs in the Caenorhabditis elegans intestinal cells.
Ca2+ release from the endoplasmic reticulum (ER), via the IP3 receptor, ITR-1, is responsible for the Ca2+ oscillations transitioning from the posterior to the anterior part of the intestine (represented by the black line with sharp peaks). Ca2+ also influences the activity Na+/H+ exchangers (NHX) via the CHP1 homolog PBO-1. H+ oscillations occur in the intestinal cell, transitioning posteriorly, and pseudocoelom and intestinal lumen, transitioning anteriorly (represented by the curved black arrow lines). The FLR-1/ACD-3/DEL-5 containing channel localises to the basolateral intestinal membrane, it is likely open for much of the cycle, directly affecting Ca2+ oscillations and ion homeostasis. The Ca2+ transient triggers efflux of H+ via NHXs (including PBO-4), decreasing pseudocoelomic pH and closing FLR-1/ACD-3/DEL-5, and Ca2+ concentration returns to baseline. ACD-5 is localised at the apical membrane. Proton pumps such as NHXs and VHA-6 maintain the acidity in the lumen during most of the DMP (pH~4, ACD-5 is closed). Once a cycle, H+ influx, through the H+/dipeptide symporter OPT-2 and other unknown channels raises the luminal pH to about pH~6 (ACD-5 opens), the resulting cation-influx reactivates H+ efflux (via VHA-6?). ACD-5 has limited influence on the Ca2+ oscillations, masked by the dominant role of IP3 signalling.
Tables
Table 1
Intestine-specific expression of acd-3 or del-5, or expression of acd-3 or del-5 fluorophore fusions, rescues DMP defects of acd-3/del-5 double mutants.
Table showing p values for data shown in Figure 5—figure supplement 3.
| A. Interval length | p (Mann-Whitney) comparing with: | |
|---|---|---|
| Genotype | Wild-type | acd-3(ok1335) del-5(lj138) |
| acd-3(ok1335) del-5(lj138) | 0.0002 ns | – |
| +ljEx1634 [Pint::acd-3 cDNA] | 0.8441 ns | 0.0006 *** |
| +ljEx1637 [Pint::del-5 cDNA] | 0.3193 ns | 0.0003 *** |
| +ljEx1641 [Pint::acd-3 cDNA; Pint::del-5 cDNA] | 0.5833 ns | 0.0002 *** |
| +ljEx1640 [Pacd-3::acd-3 gDNA::mKate2] | 0.7638 ns | 0.1185 ns |
| +ljEx1635 [Pdel-5::mKate2::del-5 gDNA] | <0.0001 **** | <0.0001 **** |
| B. CV of interval length | p (Mann-Whitney) comparing with: | |
| acd-3(ok1335) del-5(lj138) | <0.0001 **** | -– |
| +ljEx1634 [Pint::acd-3 cDNA] | 0.0091 ** | <0.0001 **** |
| +ljEx1637 [Pint::del-5 cDNA] | 0.0141 * | <0.0001 **** |
| +ljEx1641 [Pint::acd-3 cDNA; Pint::del-5 cDNA] | 0.0620 ns | <0.0001 **** |
| +ljEx1640 [Pacd-3::acd-3 gDNA::mKate2] | 0.0162 * | 0.0008 *** |
| +ljEx1635 [Pdel-5::mKate2::del-5 gDNA] | 0.0049 ** | <0.0001 **** |
| C. pBoC/def. cycle | p (Mann-Whitney) comparing with: | |
| acd-3(ok1335) del-5(lj138) | 0.0407 * | - |
| +ljEx1634 [Pint::acd-3 cDNA] | 1 ns | 0.0407 * |
| +ljEx1637 [Pint::del-5 cDNA] | 1 ns | 0.0407 * |
| +ljEx1641 [Pint::acd-3 cDNA; Pint::del-5 cDNA] | 1 ns | 0.0407 * |
| +ljEx1640 [Pacd-3::acd-3 gDNA::mKate2] | 1 ns | 0.0407 * |
| +ljEx1635 [Pdel-5::mKate2::del-5 gDNA] | 1 ns | 0.0047 * |
| D. EMC/def. cycle | p (Mann-Whitney) comparing with: | |
| acd-3(ok1335) del-5(lj138) | <0.0001 **** | – |
| +ljEx1634 [Pint::acd-3 cDNA] | 0.2222 ns | <0.0001 **** |
| +ljEx1637 [Pint::del-5 cDNA] | 0.0407 * | 0.0005 *** |
| +ljEx1641 [Pint::acd-3 cDNA; Pint::del-5 cDNA] | 0.2222 ns | <0.0001 **** |
| +ljEx1640 [Pacd-3::acd-3 gDNA::mKate2] | 0.0058 ** | 0.0066 ** |
| +ljEx1635 [Pdel-5::mKate2::del-5 gDNA] | 0.0978 ns | <0.0001 **** |
| E. Echos | p (Mann-Whitney) comparing with: | |
| acd-3(ok1335) del-5(lj138) | 0.0002 *** | – |
| +ljEx1634 [Pint::acd-3 cDNA] | 1 ns | 0.0012 ** |
| +ljEx1637 [Pint::del-5 cDNA] | 1 ns | 0.0012 ** |
| +ljEx1641 [Pint::acd-3 cDNA; Pint::del-5 cDNA] | 1 ns | 0.0012 ** |
| +ljEx1640 [Pacd-3::acd-3 gDNA::mKate2] | 0.0978 ns | 0.1025 ns |
| +ljEx1635 [Pdel-5::mKate2::del-5 gDNA] | 1 ns | 0.0012 ** |
| F. pBoc strength (% normal) | p (Fisher exact) comparing with: | |
| acd-3(ok1335) del-5(lj138) | <0.0001 **** | – |
| +ljEx1634 [Pint::acd-3 cDNA] | 1 ns | <0.0001 **** |
| +ljEx1637 [Pint::del-5 cDNA] | 0.1205 ns | <0.0001 **** |
| +ljEx1641 [Pint::acd-3 cDNA; Pint::del-5 cDNA] | 0.4970 ns | <0.0001 **** |
| +ljEx1640 [Pacd-3::acd-3 gDNA::mKate2] | 0.0007 *** | <0.0001 **** |
| +ljEx1635 [Pdel-5::mKate2::del-5 gDNA] | 1 ns | <0.0001 **** |
Appendix 1—key resources table
| Reagent type (species) or resource | Designation | Source or reference | Identifiers | Additional information |
|---|---|---|---|---|
| Strain, strain background (Escherichia coli) | OP50 | Caenorhabditis Genetics Center (CGC) | OP50 | |
| Strain, strain background L4440 (empty vector) strain | RNAi control | Ahringer C. elegans RNAi library (Source Bioscience) | L4440 | |
| Strain, strain background, X-6G10 (FLR-1) strain | X-6G10 (FLR-1) | Ahringer C. elegans RNAi library (Source Bioscience) | X-6G10 | |
| Peptide, recombinant protein | Alt-RO S.p. Cas9 Nuclease V3 | IDT | Cat#1081058 | |
| Chemical compound, drug | Oil Red O | Sigma Aldrich | Cat#O0625 | |
| Chemical compound, drug | Amiloride hydrochloride | Sigma Aldrich | Cat#A7410 | |
| Commercial assay, kit | NEBuilder HiFi DNA Assembly Master Mix | New England Biolabs Inc | Cat#E2621L | |
| Commercial assay, kit | TRIzol Direct-zol RNA Miniprep | Zymo Research | Cat#R2051 | |
| Commercial assay, kit | Invitrogen SuperScript III First-Strand Synthesis System | Invitrogen | Cat#18080051 | |
| Commercial assay, kit | Multisite Gateway Three-Fragment cloning system | Thermo Fisher Scientific | Cat#12537–023 | |
| Commercial assay, kit | mMessage mMachineTm T3 Transcription Kit | Ambion | Cat#AM1348 | |
| Commercial assay, kit | RNeasy Mini Kit | Qiagen | Cat#74,104 | |
| Biological sample (Xenopus laevis oocytes) | X. laevis oocytes | EcoCyte Bioscience (Dortmund, Germany) | ||
| Strain, strain background (Caenorhabditis elegans) | acd-5(ok2657) I | Caenorhabditis Genetics Center (CGC) | RB2005 | |
| Strain, strain background (C. elegans) | acd-5(ok2657) I | CGC | VC1047 | |
| Strain, strain background (C. elegans) | itr-1(sa73) IV | CGC | JT73 | |
| Strain, strain background (C. elegans) | pbo-4(ok583) X | CGC | RB793 | |
| Strain, strain background (C. elegans) | flr-1(syb3521) X | SunyBiotech Co., Ltd | PHX3521 | |
| Strain, strain background (C. elegans) | flr-1(ut11) X | Take-uchi et al., 1998 | JC55 | |
| Strain, strain background (C. elegans) | acd-5(lj122) I | This study | AQ4667 | C. elegans strain generated using CRISP/Cas9 (for requesting strain please refer to the AQ number) |
| Strain, strain background (C. elegans) | del-5(lj138) X | This study | AQ4802 | C. elegans strain generated using CRISP/Cas9 (for requesting strain please refer to the AQ number) |
| Strain, strain background (C. elegans) | del-5(lj138) X; acd-3(ok1335) X | This study | AQ5188 | C. elegans strain (for requesting strain please refer to the AQ number) |
| Strain, strain background (C. elegans) | acd-5(ok2657) I; itr-1(sa73) IV | This study | AQ5048 | C. elegans strain (for requesting strain please refer to the AQ number) |
| Strain, strain background (C. elegans) | acd-5(ok2657) I; pbo-4(ok583) X | This study | AQ5050 | C. elegans strain (for requesting strain please refer to the AQ number) |
| Strain, strain background (C. elegans) | acd-5(lj122) I; itr-1(sa73) IV | This study | AQ5218 | C. elegans strain (for requesting strain please refer to the AQ number) |
| Strain, strain background (C. elegans) | acd-5(lj122) I; pbo-4(ok583) X | This study | AQ5074 | C. elegans strain (for requesting strain please refer to the AQ number) |
| Strain, strain background (C. elegans) | acd-5(lj122) I; ljEx1248 [Pacd-5::acd-5 cDNA; Punc-122::GFP] | This study | AQ4400 | C. elegans strain (for requesting strain please refer to the AQ number) |
| Strain, strain background (C. elegans) | acd-5(ok2657); ljEx1249 [Pacd-5::acd-5 cDNA; Punc-122::GFP] | This study | AQ4401 | C. elegans strain (for requesting strain please refer to the AQ number) |
| Strain, strain background (C. elegans) | acd-5(ok2657) I; rnyEx109 [nhx-2p::D3cpv +pha-1(+)] | This study | AQ5122 | C. elegans strain (for requesting strain please refer to the AQ number) |
| Strain, strain background (C. elegans) | acd-5 (lj122) I; rnyEx109 [nhx-2p::D3cpv +pha-1(+)] | This study | AQ5182 | C. elegans strain (for requesting strain please refer to the AQ number) |
| Strain, strain background (C. elegans) | flr-1(syb3521) X; rnyEx109 [nhx-2p::D3cpv +pha-1(+)] | This study | AQ5192 | C. elegans strain (for requesting strain please refer to the AQ number) |
| Strain, strain background (C. elegans) | ljEx1470 [Pacd-5::acd-5(no stop) cDNA::mKate2; Punc-122::GFP] | This study | AQ4872 | C. elegans strain (for requesting strain please refer to the AQ number) |
| Strain, strain background (C. elegans) | ljEx1248[Pacd-5::acd-5 cDNA; Punc-122::GFP] | This study | AQ4496 | C. elegans strain (for requesting strain please refer to the AQ number) |
| Strain, strain background (C. elegans) | ljEx1249[Pacd-5::acd-5 cDNA; Punc-122::GFP] | This study | AQ4497 | C. elegans strain (for requesting strain please refer to the AQ number) |
| Strain, strain background (C. elegans) | ljEx1349 [Pdel-5::GFP; Punc-122::GFP] | This study | AQ4652 | C. elegans strain (for requesting strain please refer to the AQ number) |
| Strain, strain background (C. elegans) | ljEx1345 [Pacd-3::GFP; Punc-122::GFP] | This study | AQ4648 | C. elegans strain (for requesting strain please refer to the AQ number) |
| Strain, strain background (C. elegans) | ljEx1500 [Pacd-5::acd-5(ok2657); Punc-122::RFP] | This study | AQ4934 | C. elegans strain (for requesting strain please refer to the AQ number) |
| Strain, strain background (C. elegans) | ljEx1507 [Pges-1::acd-5(ok2657); Punc-122::RFP] | This study | AQ4925 | C. elegans strain (for requesting strain please refer to the AQ number) |
| Strain, strain background (C. elegans) | ljEx1607 [pEK337 (Pacd-3::acd-3 gDNA::mKate2); Punc-122::GFP] | This study | AQ5194 | C. elegans strain (for requesting strain please refer to the AQ number) |
| Strain, strain background (C. elegans) | ljEx1621 [pEK352 (Pdel-5::Nsig::mKate2::del-5 gDNA); Punc-122::GFP] | This study | AQ5222 | C. elegans strain (for requesting strain please refer to the AQ number) |
| Strain, strain background (C. elegans) | pha-1(e2123) III; rnyEx133 [pKN114 (opt-2p::opt-2(aa1-412)::GFP)+pCL1 (pha-1+)]; | CGC Wagner et al., 2011; Allman et al., 2009 | KWN246 | |
| Strain, strain background (C. elegans) | pha-1(e2123) III; him-5(e1490) V; rnyEx109 [nhx-2p::D3cpv +pha-1(+)] | CGC Wagner et al., 2011; Allman et al., 2009 | KWN190 | |
| Strain, strain background (C. elegans) | pha-1(e2123ts)III, rnyEx006 [pIA5nhx-2 (Pnhx-2::pHluorin)], pCL1 (pha-1+) | Allman et al., 2009 | KWN26 | |
| Strain, strain background (C. elegans) | pha-1(e2123ts)III, him-5(e1490)V, rnyEx116 [pKT82 (Pnhx-7::EC sensor), pCL1 (pha-1+)] | This study | KWN197 | C. elegans strain (for requesting strain please refer to the KWN number) |
| Sequence-based reagent | Pacd-5 F | This study | PCR primer for generating pEK165 | Pacd-5 F ggggacaactttgtatagaaaagttgtaagaaaaattatcacattttttgtagatgaaac |
| Sequence-based reagent | Pacd-5 R | This study | PCR primer for generating pEK165 | Pacd-5 R ggggactgcttttttgtacaaacttgtcctggaacaactccactttcaaacctg |
| Sequence-based reagent | acd-5 cDNA_KSM_F | This study | PCR primer for generating pEK171 | acd-5 cDNA_KSM_F ttgggcccctcgaggtcgacatgcgacgcgtaagaaacc |
| Sequence-based reagent | acd-5 cDNA_KSM_R | This study | PCR primer for generating pEK171 | acd-5 cDNA_KSM_R ctccattcgggtgttcttgattatgcttcatgtatcacagctggc |
| Sequence-based reagent | acd-5(ok2657) mut_F | This study | PCR primer for generating pEK172 | acd-5(ok2657) mut_F tgtcaagaacacccgaatgg |
| Sequence-based reagent | acd-5(ok2657) mut_R | This study | PCR primer for generating pEK172 | acd-5(ok2657) mut_R cattcatatgcggaatcgtc |
| Sequence-based reagent | Pacd-5_acd-5_no stop_F | This study | PCR primer for generating pEK190 | Pacd-5_acd-5_no stop_F ccaagctcggacaccgttaatccaattactcttcaacatccctacatgc |
| Sequence-based reagent | Pacd-5_acd-5_no stop_R | This study | PCR primer for generating pEK190 | Pacd-5_acd-5_no stop_R ctccttgatgagctcggacattttttctaccggtactttctgatctactccgccgactt |
| Sequence-based reagent | mKate2_Fragment_F | This study | PCR primer for generating pEK190 | mKate2_Fragment_F gtcggcggagtagatcagaaagtaccggtagaaaaaatgtccgagctcatcaaggagaac |
| Sequence-based reagent | mKate2_Fragment_R | This study | PCR primer for generating pEK190 | mKate2_Fragment_R gatgttgaagagtaattggattaacggtgtccgagcttgga |
| Sequence-based reagent | C27C12.5b_acd-3_KSM_F | This study | PCR primer for generating pEK207 | C27C12.5b_acd-3_KSM_F ccctcgaggtcgacggatgactgaaacttcaaattgctccag |
| Sequence-based reagent | C27C12.5b_acd-3_KSM_R | This study | PCR primer for generating pEK207 | C27C12.5b_acd-3_KSM_R cttagagactccattcgggtttagaaatcacaatttccgagatacacagaatttctttt |
| Sequence-based reagent | F02D10.5_flr-1_KSM_F | This study | PCR primer for generating pEK215 | F02D10.5_flr-1_KSM_F agcttgatatcgaattcctgatggaaacggagacggaaagtg |
| Sequence-based reagent | F02D10.5_flr-1_KSM_R | This study | PCR primer for generating pEK215 | F02D10.5_flr-1_KSM_R ttcttgaggctggtttagtgtcaaattaattgtgatttgaatatggaggatgttgaaact |
| Sequence-based reagent | F59F3.4_del-5_KSM_F | This study | PCR primer for generating pEK228 | F59F3.4_del-5_KSM_F cttgatatcgaattcctgcaatgacgagtgtctcgtttggt |
| Sequence-based reagent | F59F3.4_del-5_KSM_R | This study | PCR primer for generating pEK228 | F59F3.4_del-5_KSM_R gtttagtggtaaccagatctttaaaaatcattcataggcatatttttggtgaatgct |
| Sequence-based reagent | acd-5_cDNA_attB1_F | This study | PCR primer for generating pEK262 | acd-5_cDNA_attB1_F ggggacaagtttgtacaaaaaagcaggcttaatgcgacgcgtaagaaacct |
| Sequence-based reagent | acd-5_cDNA_attB1_R | This study | PCR primer for generating pEK262 | acd-5_cDNA_attB1_R ggggaccactttgtacaagaaagctgggttttatgcttcatgtatcacagctggc |
| Sequence-based reagent | acd-5(ok2657) mut_F | This study | PCR primer for generating pEK286 | acd-5(ok2657) mut_F tgtcaagaacacccgaatgg |
| Sequence-based reagent | acd-5(ok2657) mut_R | This study | PCR primer for generating pEK286 | acd-5(ok2657) mut_R cattcatatgcggaatcgtc |
| Sequence-based reagent | acd-5(ok2657) mut_F | This study | PCR primer for generating pEK287 | acd-5(ok2657) mut_F tgtcaagaacacccgaatgg |
| Sequence-based reagent | acd-5(ok2657) mut_R | This study | PCR primer for generating pEK287 | acd-5(ok2657) mut_R cattcatatgcggaatcgtc |
| Sequence-based reagent | flr-1_F | This study | PCR primer for generating pEK288 | flr-1_F ggtaccgagctcggatccacatggaaacggagacggaaagtga |
| Sequence-based reagent | flr-1_noStop_R | This study | PCR primer for generating pEK288 | flr-1_noStop_R tcgaattccaccacactggaaattaattgtgatttgaatatggaggatgttgaaact |
| Sequence-based reagent | acd-3_F | This study | PCR primer for generating pEK289 | acd-3_F ggtaccgagctcggatccacatgactgaaacttcaaattgctccagc |
| Sequence-based reagent | acd-3_noStop_R | PCR primer for generating pEK289 | acd-3_noStop_R tcgaattccaccacactggagaaatcacaatttccgagatacacagaatttct | |
| Sequence-based reagent | del-5_F | This study | PCR primer for generating pEK290 | del-5_F ggtaccgagctcggatccacatgacgagtgtctcgtttggt |
| Sequence-based reagent | del-5_noStop_R | This study | PCR primer for generating pEK290 | del-5_noStop_R tcgaattccaccacactggaaaaatcattcataggcatatttttggtgaatgct |
| Sequence-based reagent | acd-5_pcDNA_F | This study | PCR primer for generating pEK291 | acd-5_pcDNA_F ccactagtccagtgtggtggatgcgacgcgtaagaaacc |
| Sequence-based reagent | acd-5_pcDNA_R | This study | PCR primer for generating pEK291 | acd-5_pcDNA_R actgtgctggatatctgcagttatgcttcatgtatcacagctggcg |
| Sequence-based reagent | ok2657_v1_F | This study | PCR primer for generating pEK292 | ok2657_v1_F aggtcaagacaattctgcag |
| Sequence-based reagent | ok2657_v1_R | This study | PCR primer for generating pEK292 | ok2657_v1_R ttcatatgcggaatcgtcc |
| Sequence-based reagent | KSM_F | This study | PCR primer for generating any KSM backbone containing plasmid | KSM_F agatctggttaccactaaaccagcc |
| Sequence-based reagent | KSM_R | This study | PCR primer for generating any KSM backbone contanining plasmid | KSM_R tgcaggaattcgatatcaagcttatcgatacc |
| Sequence-based reagent | Pacd-3_F | This study | PCR primer for generating pEK337 | Pacd-3_F ggaaacagctatgaccatgtttatcgcaaaatttcgtacatcaaatattcaatgattcag |
| Sequence-based reagent | acd-3_mKate2_R | This study | PCR primer for generating pEK337 | acd-3_mKate2_R tccttgatgagctcggacatcatgaaatcacaatttccgagatacacagaatttctt |
| Sequence-based reagent | mKate2_acd-3_F | This study | PCR primer for generating pEK337 | mKate2_acd-3_F tcggaaattgtgatttcatgatgtccgagctcatcaaggagaac |
| Sequence-based reagent | mKate2_R | This study | PCR primer for generating pEK337 | mKate2_R ccgtacatgaaggaggtggcg |
| Sequence-based reagent | mKate2_unc-54 3’URT _R | This study | PCR primer for generating pEK337 | mKate2_unc-54 3’URT _R accggcgctcagttggaattttaacggtgtccgagcttgga |
| Sequence-based reagent | unc-54 3’URT_mKate2_F | This study | PCR primer for generating pEK337 | unc-54 3’URT_mKate2_F ccaagctcggacaccgttaaaattccaactgagcgccgg |
| Sequence-based reagent | Pdel-5_F | This study | PCR primer for generating pEK337 | Pdel-5_F aggaaacagctatgaccatgctaaactatcaaaatacacgaaagttatctaaaaacctc |
| Sequence-based reagent | del-5_mKate2_R | This study | PCR primer for generating pEK337 | del-5_mKate2_R gttctccttgatgagctcggacatcataaaatcattcataggcatatttttggtgaatgc |
| Sequence-based reagent | mKate2_del-5_F | This study | PCR primer for generating pEK338 | mKate2_del-5_F tgcctatgaatgattttatgatgtccgagctcatcaaggagaac |
| Sequence-based reagent | mKate2_R | This study | PCR primer for generating pEK338 | mKate2_R ccgtacatgaaggaggtggcg |
| Sequence-based reagent | mKate2_unc-54 3’URT _R | This study | PCR primer for generating pEK338 | mKate2_unc-54 3’URT _R accggcgctcagttggaattttaacggtgtccgagcttgga |
| Sequence-based reagent | unc-54 3’URT_mKate2_F | This study | PCR primer for generating pEK338 | unc-54 3’URT_mKate2_F ccaagctcggacaccgttaaaattccaactgagcgccgg |
| Sequence-based reagent | CD.Cas9.VZPJ2357.AN+AltR2 | This study | Guide RNA for CRISPR deletion acd-5(lj122)I | CD.Cas9.VZPJ2357.AN gtttgatctgaaagatatca+AltR2 |
| Sequence-based reagent | Ce.Cas9.ACD-5.1.AK+AltR2 | This study | Guide RNA sequence for CRISPR deletion acd-5(lj122)I | Ce.Cas9.ACD-5.1.AK tttgtataacgacggaccga+AltR2 |
| Sequence-based reagent | ssODN_acd-5 | This study | Repair template for CRISPR deletion acd-5(lj122)I | ssODN_acd-5 aacctattattcacaccgttcagaaacctctcactaggatcaaataacacgtggaagggctgcatcaatg |
| Sequence-based reagent | Ce.Cas9.DEL-5.1.AE+Alt2 | This study | Guide RNA sequence for CRISPR deletion del-5(lj138)X | Ce.Cas9.DEL-5.1.AE accaatcattattttcgagc+Alt2 |
| Sequence-based reagent | Ce.Cas9.DEL-5.1.AD+Alt2 | This study | Guide RNA sequence for CRISPR deletion del-5(lj138)X | Ce.Cas9.DEL-5.1.AD caaagtcttgatccagctcc+Alt2 |
| Sequence-based reagent | del-5_ssODN | This study | Repair template for CRISPR deletion del-5(lj138)X | del-5_ssODN gactctcaatttcaaagtcttgatccagctccttaatgtcatgatgggtgtgatgaatacaccaatttaa |
| Sequence-based reagent | acd-5_Fwd | This study | PCR primer for genotyping acd-5(lj122)I or acd-5(ok2657)I | acd-5_Fwd cgcagctagagtttcacagc |
| Sequence-based reagent | acd-5_Rev | This study | PCR primer for genotyping acd-5(lj122)I or acd-5(ok2657)I | acd-5_Rev cagagctttaacattgagatgcc |
| Sequence-based reagent | del-5(lj138)_F | This study | PCR primer for genotyping del-5(lj138)X | del-5(lj138)_F aatgacgagtgtctcgtttg |
| Sequence-based reagent | del-5(lj138)_R | This study | PCR primer for genotyping del-5(lj138)X | del-5(lj138)_R cgttgattctcataaaactggg |
| Sequence-based reagent | acd-3(ok1335)_F | This study | PCR primer for genotyping acd-3(ok1335)X | acd-3(ok1335)_F catgaaagtactaacttccagattcg |
| Sequence-based reagent | acd-3(ok1335)_R | This study | PCR primer for genotyping acd-3(ok1335)X | acd-3(ok1335)_R gagatccatggatacttccg |
| Sequence-based reagent | flr-1(syb3521)_F | This study | PCR primer for genotyping flr-1(syb3521)X | flr-1(syb3521)_F tcgagggcacaagctcataaa |
| Sequence-based reagent | flr-1(syb3521)_R | This study | PCR primer for genotyping flr-1(syb3521)X | flr-1(syb3521)_R cccaaccaaaaccatttccact |
| Sequence-based reagent | itr-1(sa73)_F | This study | PCR primer for genotyping itr-1(sa73)IV | itr-1(sa73)_F cgagctttcgattcgggaga |
| Sequence-based reagent | itr-1 (sa73)_R | This study | PCR primer for genotyping itr-1(sa73)IV | itr-1 (sa73)_R tgatcaacacacggcaggtaa |
| Sequence-based reagent | pbo-4(ok583)_F | This study | PCR primer for genotyping pbo-4(ok583)X | pbo-4(ok583)_F actagatgagagttggcgaga |
| Sequence-based reagent | pbo-4(ok583)_R | This study | PCR primer for genotyping pbo-4(ok583)X | pbo-4(ok583)_R agtcgtgtggtaaagctccg |
| Recombinant DNA reagent | Plasmid: pDEST Pacd-5::mKate2 | This study | pEK165 | Plasmid generated for generating transgenic C. elegans strains (for requesting plasmid please refer to the pEK number) |
| Recombinant DNA reagent | Plasmid: KSM acd-5 cDNA | This study | pEK171 | Plasmid generated for generating cRNA for the expression of channels in Xenopus oocytes (for requesting plasmid please refer to the pEK number) |
| Recombinant DNA reagent | Plasmid KSM acd-5(ok2657) cDNA | This study | pEK172 | Plasmid generated for generating cRNA for the expression of channels in Xenopus oocytes (for requesting plasmid please refer to the pEK number) |
| Recombinant DNA reagent | Plasmid: Pacd-3::GFP | Kyuhyung Kim | pEK187 | Plasmid generated for generating transgenic C. elegans strains (for requesting plasmid please refer to the pEK number) |
| Recombinant DNA reagent | Plasmid: pDEST Pacd-5::acd-5 cDNA::mKate2 | This study | pEK190 | Plasmid generated for generating transgenic C. elegans strains (for requesting plasmid please refer to the pEK number) |
| Recombinant DNA reagent | Plasmid: Pdel-5::GFP | Kyuhyung Kim | pEK195 | Plasmid generated for generating transgenic C. elegans strains (for requesting plasmid please refer to the pEK number) |
| Recombinant DNA reagent | Plasmid: KSM acd-3 cDNA | This study | pEK207 | Plasmid generated for generating cRNA for the expression of channels in Xenopus oocytes (for requesting plasmid please refer to the pEK number) |
| Recombinant DNA reagent | Plasmid: KSM flr-1 cDNA | This study | pEK215 | Plasmid generated for generating cRNA for the expression of channels in Xenopus oocytes (for requesting plasmid please refer to the pEK number) |
| Recombinant DNA reagent | Plasmid: KSM del-5 cDNA | This study | pEK228 | Plasmid generated for generating cRNA for the expression of channels in Xenopus oocytes (for requesting plasmid please refer to the pEK number) |
| Recombinant DNA reagent | Plasmid: pDEST Pacd-5::acd-5 cDNA | This study | pEK262 | Plasmid generated for generating transgenic C. elegans strains (for requesting plasmid please refer to the pEK number) |
| Recombinant DNA reagent | Plasmid: pDEST Pacd-5::acd-5(ok2657) cDNA | This study | pEK286 | Plasmid generated for generating transgenic C. elegans strains (for requesting plasmid please refer to the pEK number) |
| Recombinant DNA reagent | Plasmid: pDEST Pges-1::acd-5(ok2657) cDNA | This study | pEK287 | Plasmid generated for generating transgenic C. elegans strains (for requesting plasmid please refer to the pEK number) |
| Recombinant DNA reagent | Plasmid: pDEST Pacd-3::acd-3 gDNA::mKate2 | This study | pEK337 | Plasmid generated for generating transgenic C. elegans strains (for requesting plasmid please refer to the pEK number) |
| Recombinant DNA reagent | Plasmid: pDEST Pdel-5::Nsig::mKate2::del-5 gDNA | This study | pEK338 | Plasmid generated for generating transgenic C. elegans strains (for requesting plasmid please refer to the pEK number) |
| Software, algorithm | Matlab | MathWorks | https://www.mathworks.com | |
| Software, algorithm | Fiji (ImageJ). | Schneider et al., 2012 | https://imagej.nih.gov/ij/ | |
| Software, algorithm | NEBiocalculator | New England Biolabs Inc | https://tmcalculator.neb.com/ | |
| Software, algorithm | NEBaseChanger | New England Biolabs Inc | https://nebasechanger.neb.com | |
| Software, algorithm | Graphpad | GraphPad Software, https://www.graphpad.com | Prism 9.0.2 | |
| Software, algorithm | Robocyte2+ | Multichannel Systems | https://www.multichannelsystems.com/products/roboocyte2 | |
| Software, algorithm | Neurontracker | Ithai Rabinowitch Rabinowitch et al., 2013; Rabinowitch, 2020 | https://github.com/ithairab/NeuronTracker | |
| Other | Roboocyte2 | Multichannel Systems | https://www.multichannelsystems.com/products/roboocyte2 | Fully-automated system for screening of ligand-gated channels based on the standard Xenopus oocyte expression system. |
| Other | Roboinject | Multichannel Systems | https://www.multichannelsystems.com/products/roboinject | Fully-automated system for injecting cRNA into Xenopus oocytes. |
Additional files
Download links
A two-part list of links to download the article, or parts of the article, in various formats.
Downloads (link to download the article as PDF)
Open citations (links to open the citations from this article in various online reference manager services)
Cite this article (links to download the citations from this article in formats compatible with various reference manager tools)
Distinct roles for two Caenorhabditis elegans acid-sensing ion channels in an ultradian clock
eLife 11:e75837.
https://doi.org/10.7554/eLife.75837


