GWAS and functional studies suggest a role for altered DNA repair in the evolution of drug resistance in Mycobacterium tuberculosis
- National Institute of Immunology, India
- Centre for Cellular and Molecular Biology, India
- Department of Zoology, University of Delhi, India
- Centre for Genetic Manipulation of Crop Plants, University of Delhi South Campus, India
- Department of Microbiology and Cell Biology, Indian Institute of Science Bangalore, India
Figures
Figure 1 with 1 supplement
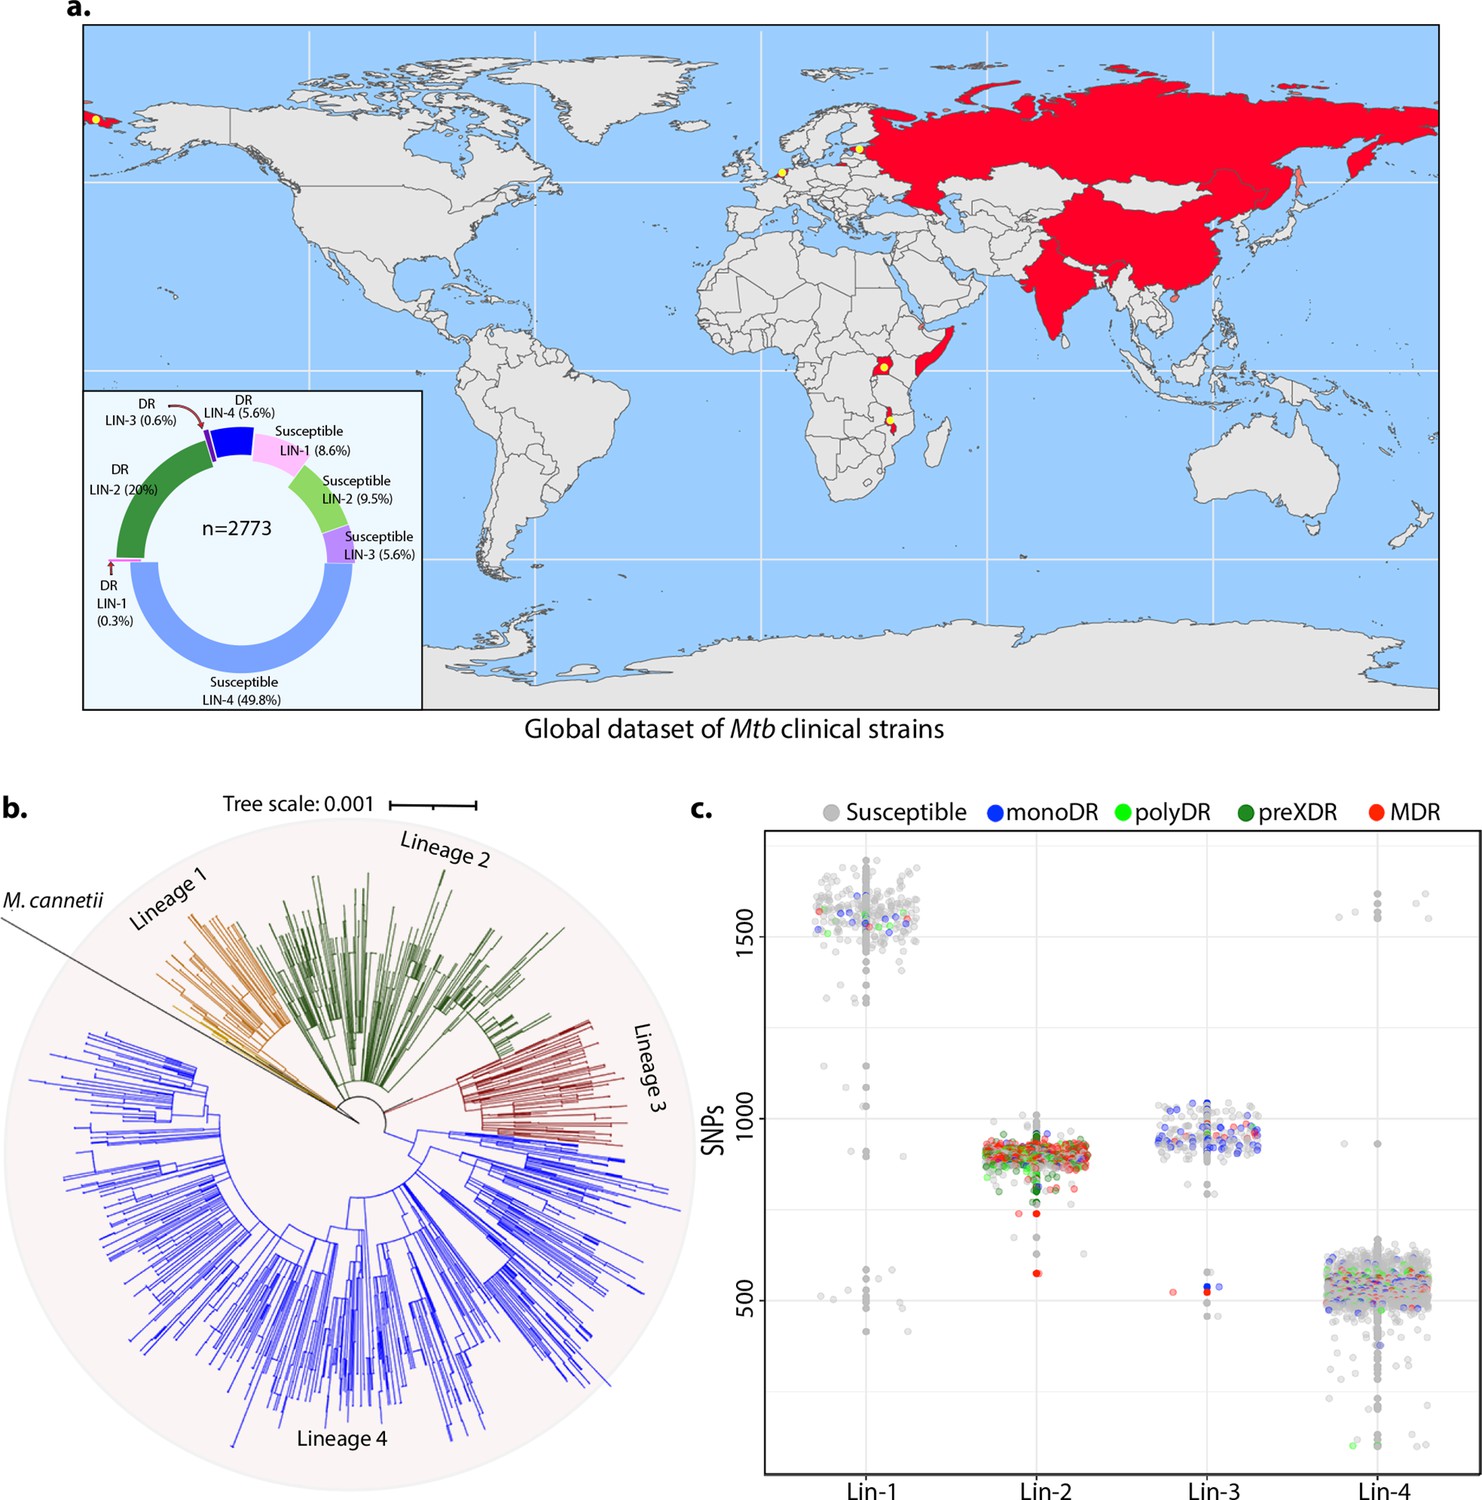
Genome-wide association study unveils mutations in the DNA repair genes.
(a) Geographical distribution of 2773 clinical strains of Mycobacterium tuberculosis (Mtb). The donut plot represents the proportion of susceptible and drug-resistant (DR) strains in each lineage. DR includes mono-DR, poly-DR, multidrug resistant (MDR), and pre-extensively drug resistant (XDR). A detailed breakup of distribution is given in Supplementary file 1. (b) Phylogenetic tree constructed using 1,60,000 single nucleotide polymorphisms (SNPs) using Mycobacterium canetti as an outgroup. (c) Dot-plot showing the number of SNPs identified in each strain. Different colored dots indicate the drug resistance phenotype of strain.
Figure 1—figure supplement 1
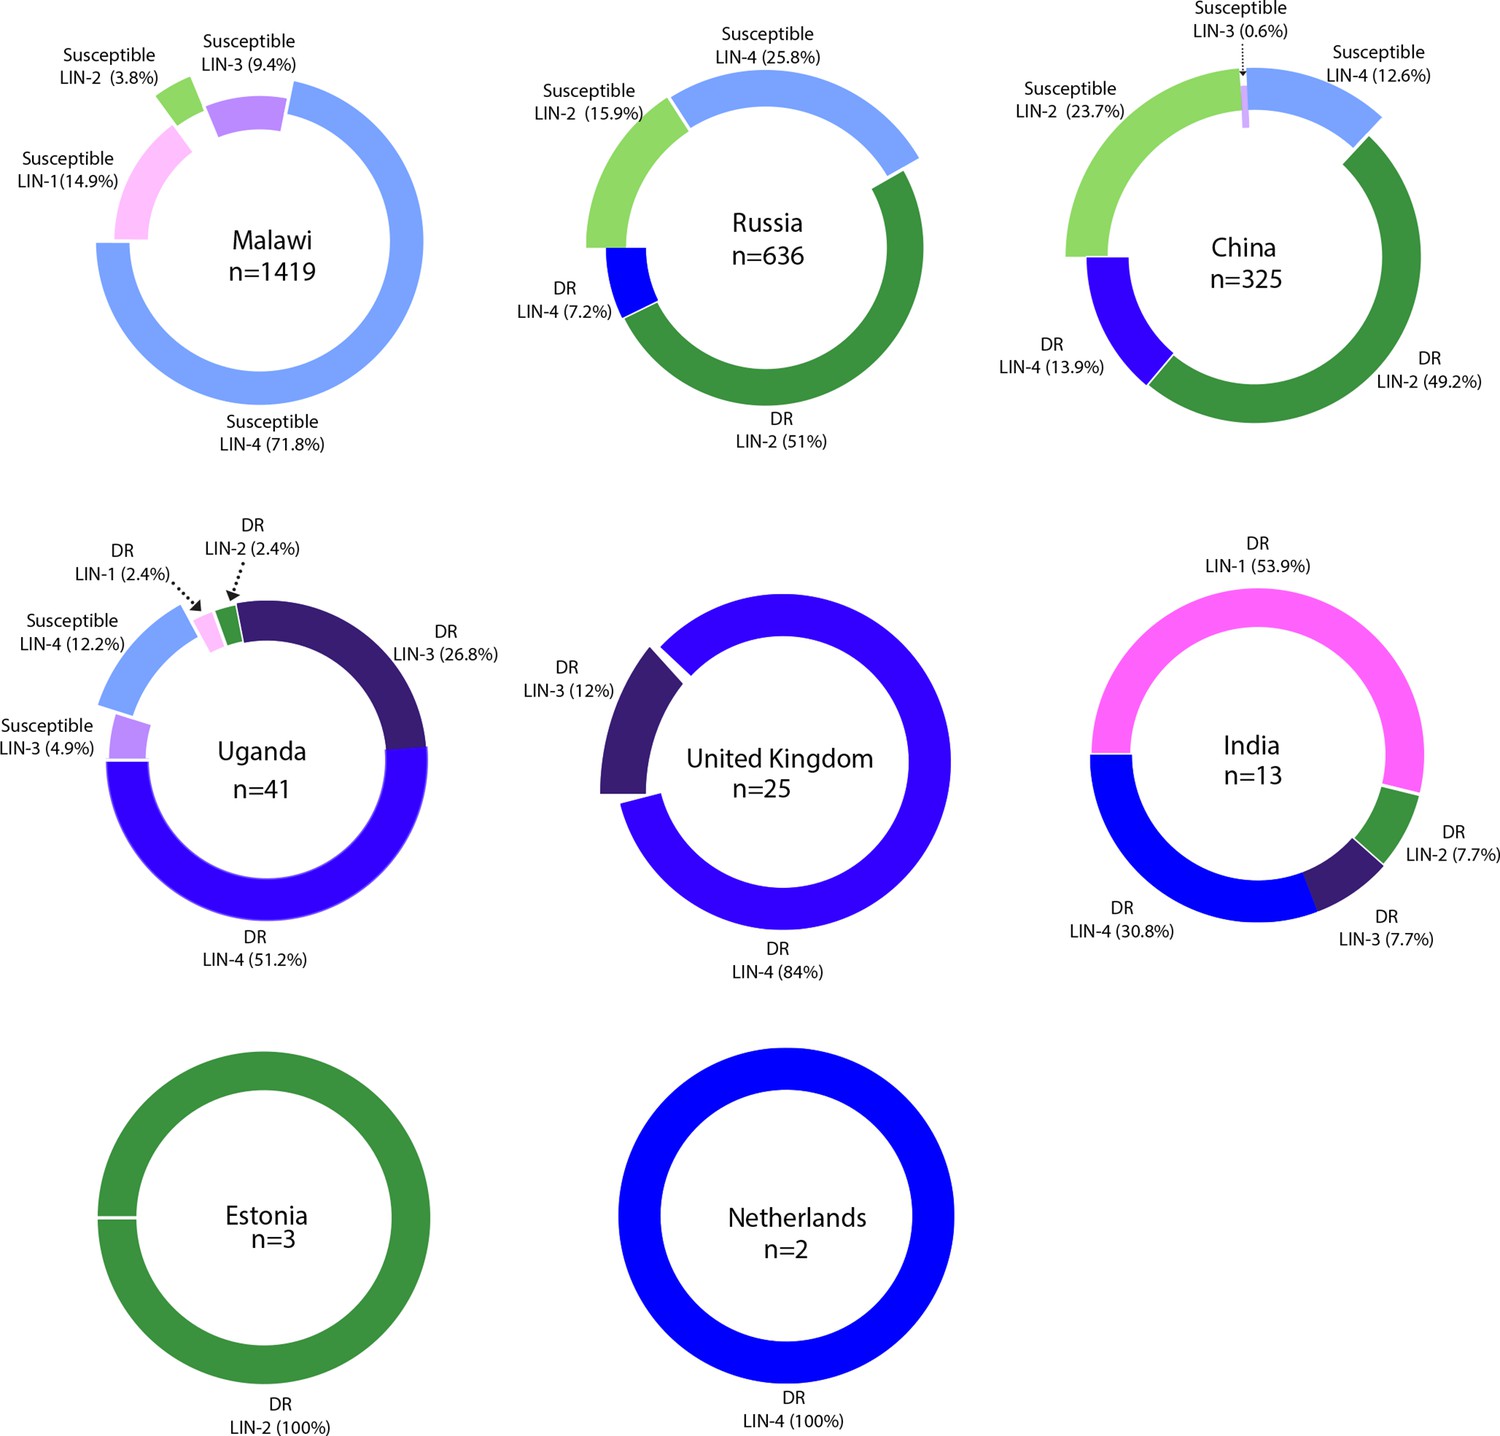
Country-wide distribution of clinical strains.
Each donut plot represents proportion of clinical strains used for the genome-wide association study. Susceptible refers to the antibiotic sensitive strains. DR refers to ‘drug resistance’ to first- and second-line antibiotics.
Figure 2 with 6 supplements
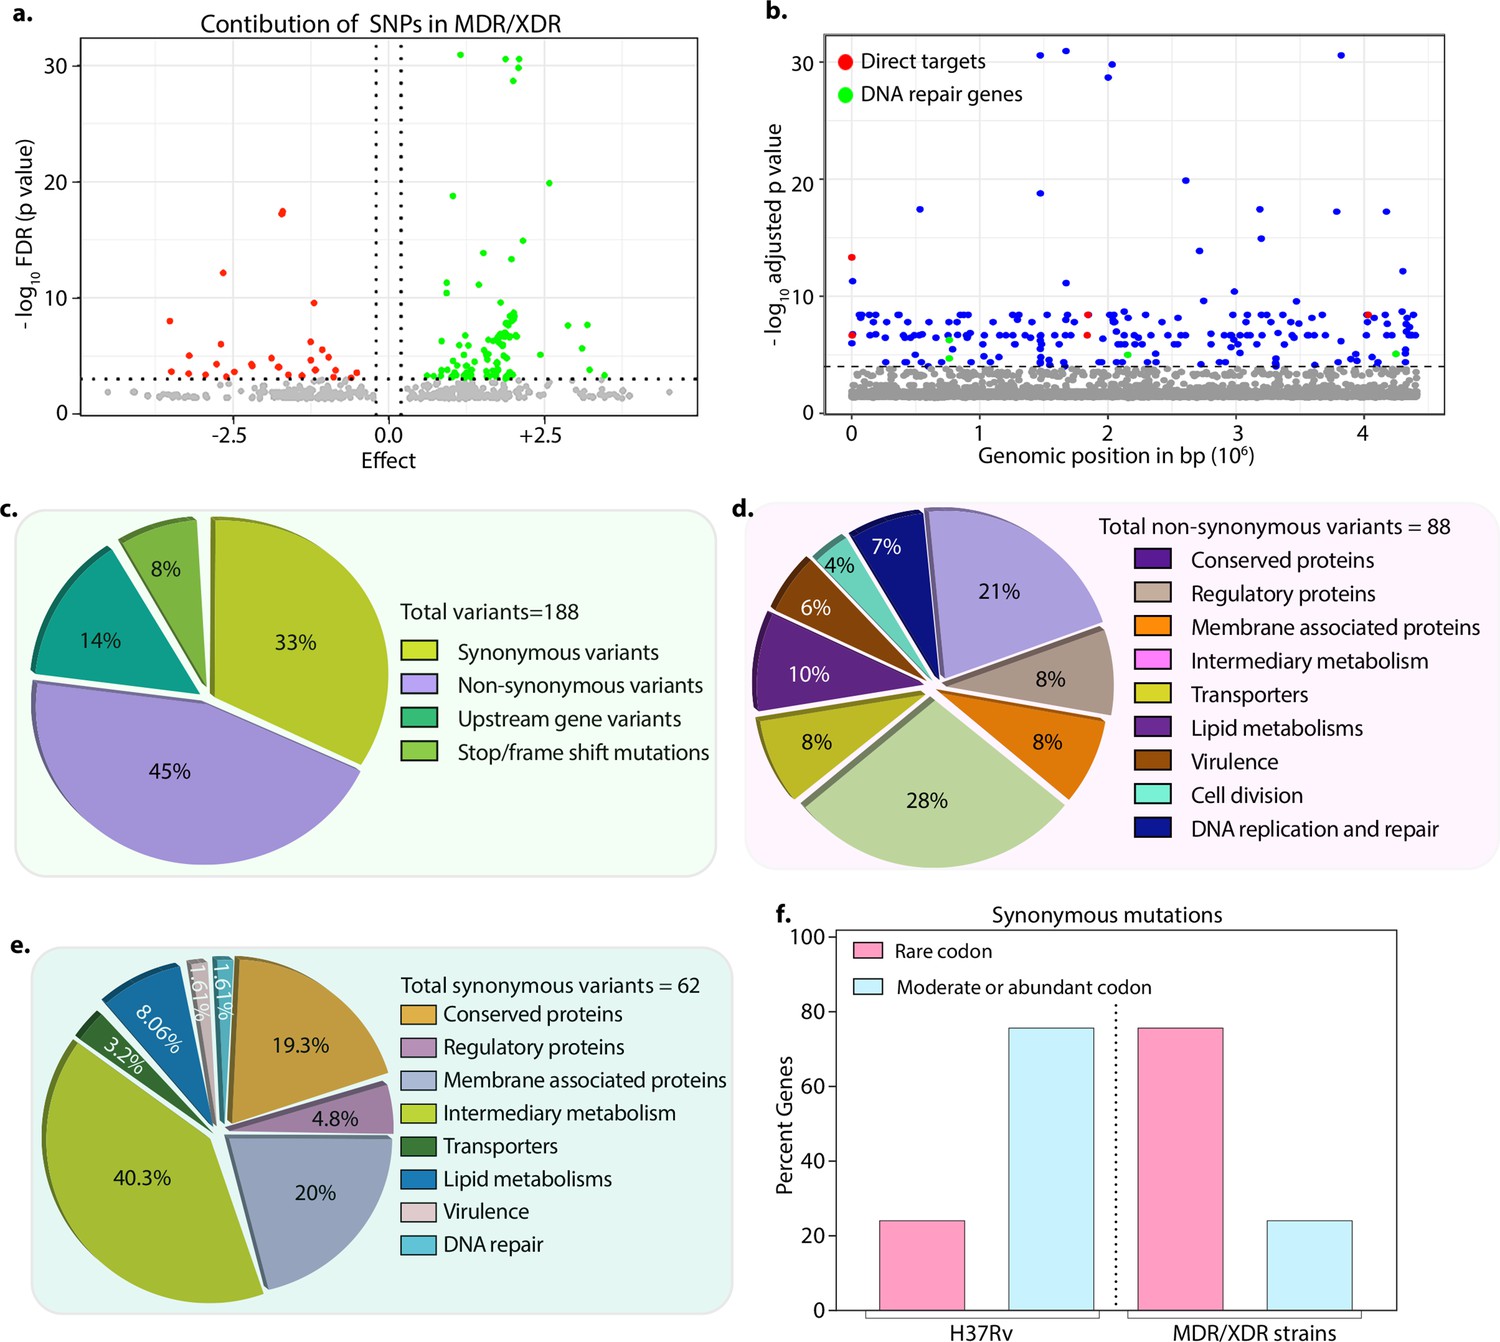
Drug-resistant strains carry mutations in the DNA repair genes.
(a) Volcano plot represents the effect of identified single nucleotide polymorphisms (SNPs) on the development of multidrug resistant/extensively drug resistant TB (MDR/XDR-TB). The positive effect (green dots) shows that the identified SNPs would aid in MDR/XDR development. The negative effect (red dots) shows that the SNPs would restrain the development of MDR/XDR. (b) Manhattan plot representing the association between the genes and drug resistance phenotype. A total of 188 genes that include intergenic regions were identified above the 10–5 cut-off value through association studies. Blue dots represent mutation in the lipid metabolism, membrane proteins, intermediary metabolism genes, and others. Green dots represent mutation in the direct targets for the first- and second-line antibiotics. Red dots represent mutations associated with the DNA repair genes. A detailed list of associated genes is provided in Supplementary file 3; Supplementary file 4. (c–e) Pie chart represents the total (c), non-synonymous (d), and synonymous (e) SNPs identified in the genes that belong to different categories. (f) Bar plot represents the percentage of synonymous mutations in the genes that resulted in abundant/moderate codon usage to the rare codon compared to H37Rv.
-
Figure 2—source data 1
Mutations identified in genes that belong to different categories.
- https://cdn.elifesciences.org/articles/75860/elife-75860-fig2-data1-v3.xlsx
Figure 2—figure supplement 1
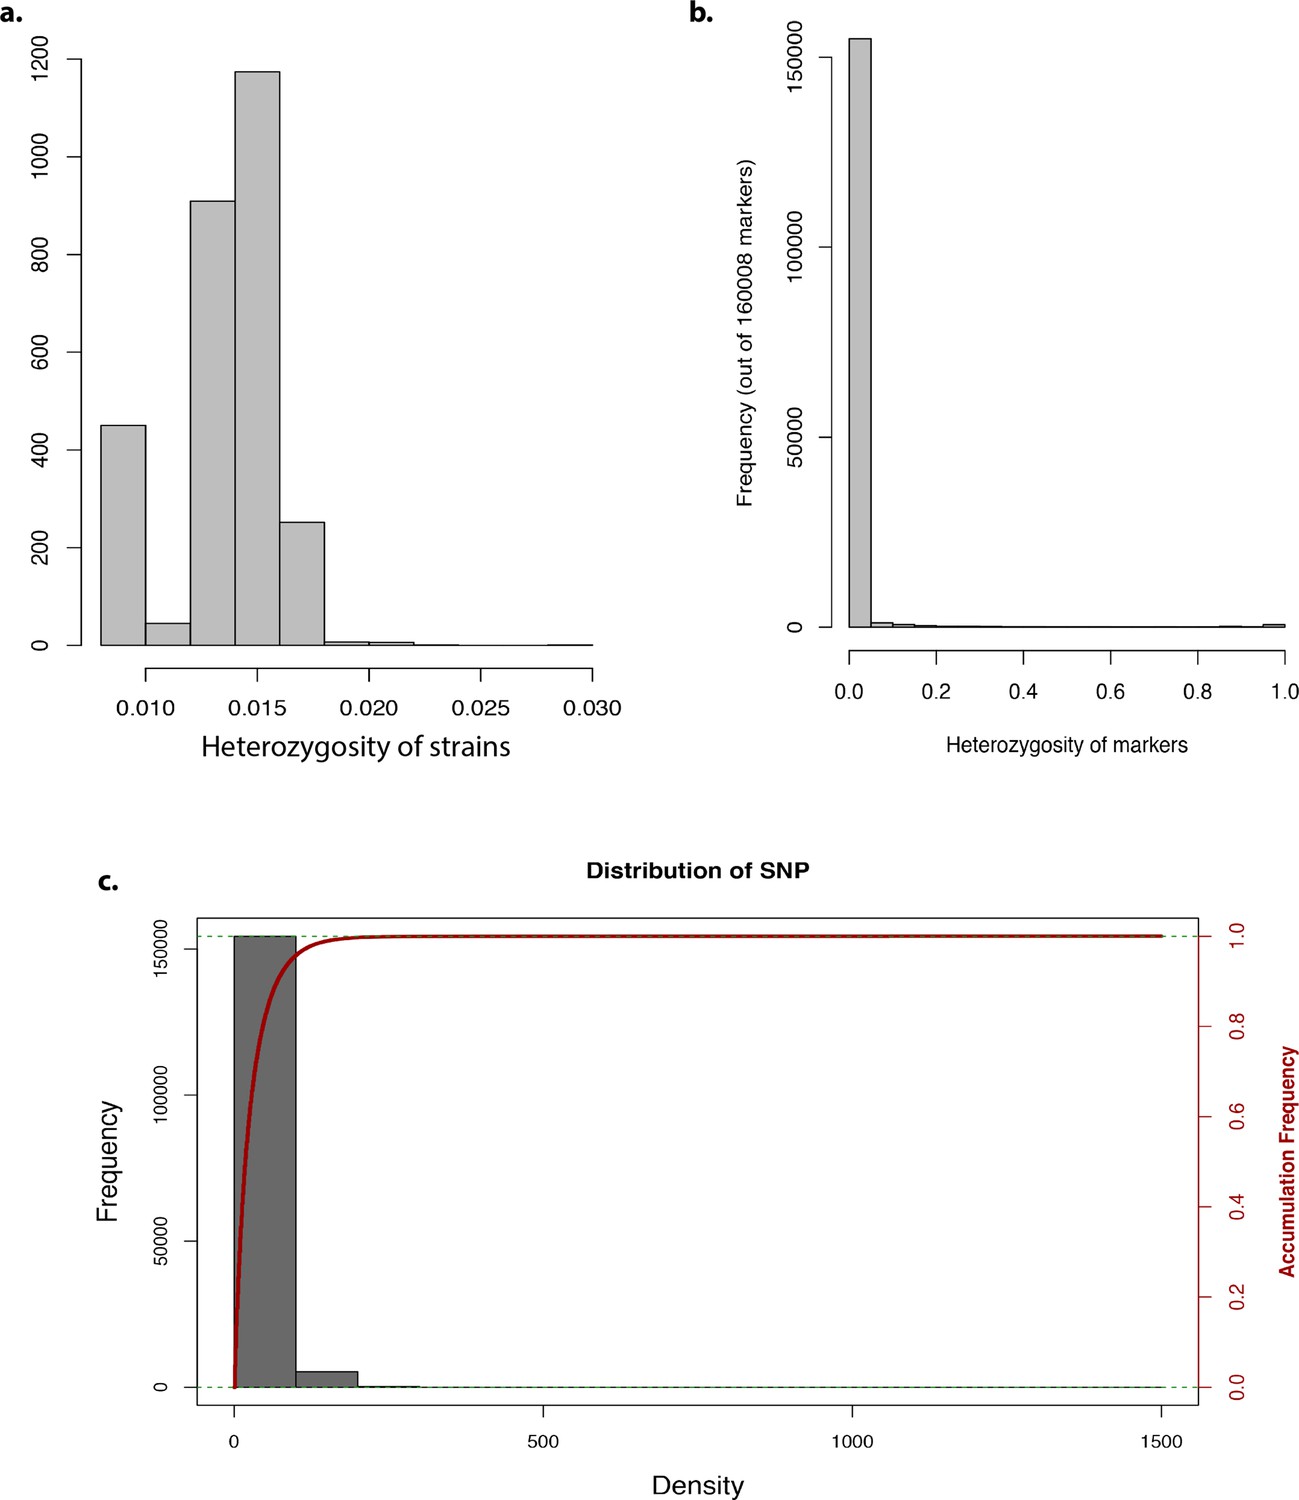
Genome-wide association study analysis.
Bar graph representing the (a) heterozygosity of strains, (b) heterozygosity of markers, and (c) frequency and accumulative frequency of marker density.
Figure 2—figure supplement 2
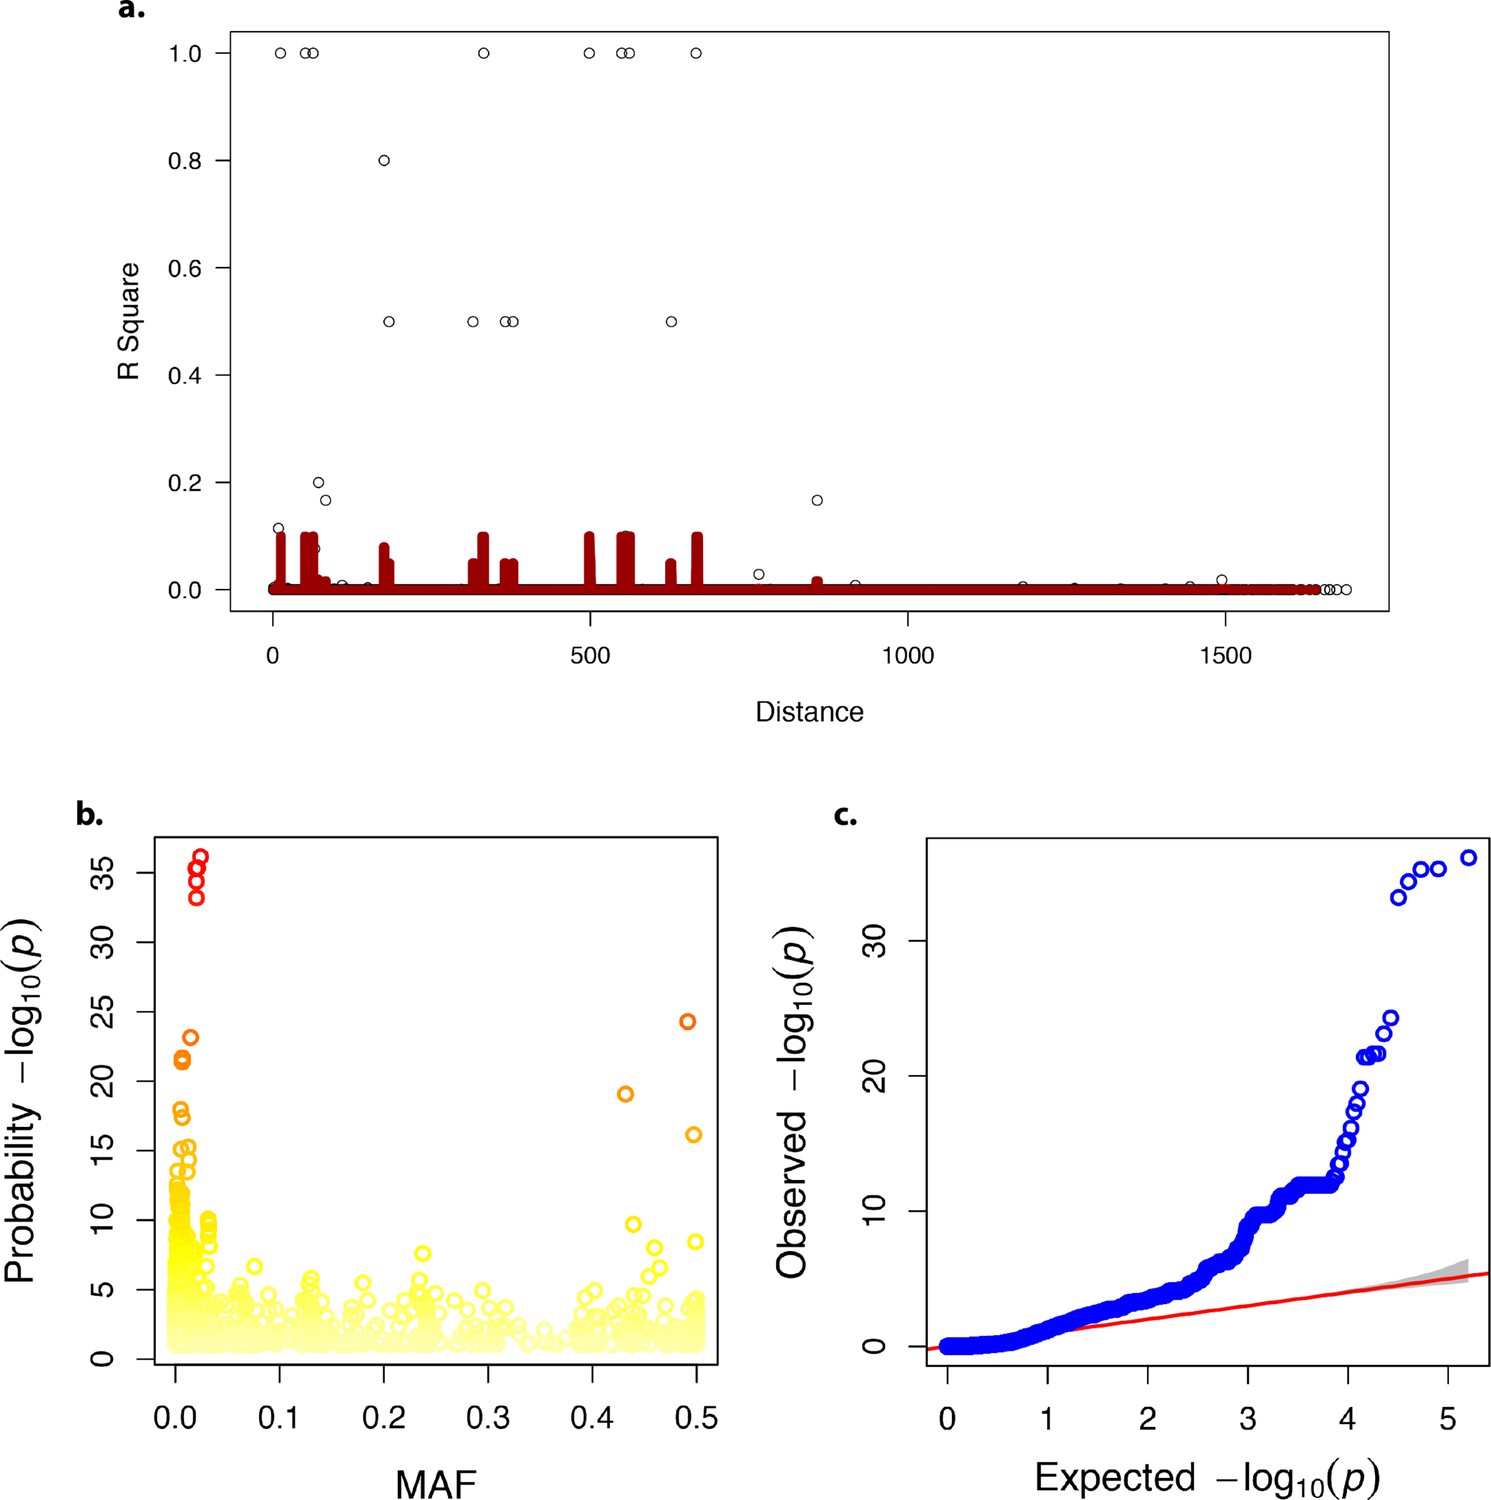
Linkage disequilibrium, minor allele frequency and quantile-quantile plot in the genome-wide association analysis.
(a) Linkage disequilibrium decay over distance. (b) Minor allele frequency (MAF). (c) Quantile-quantile – plot of p-values.
Figure 2—figure supplement 3
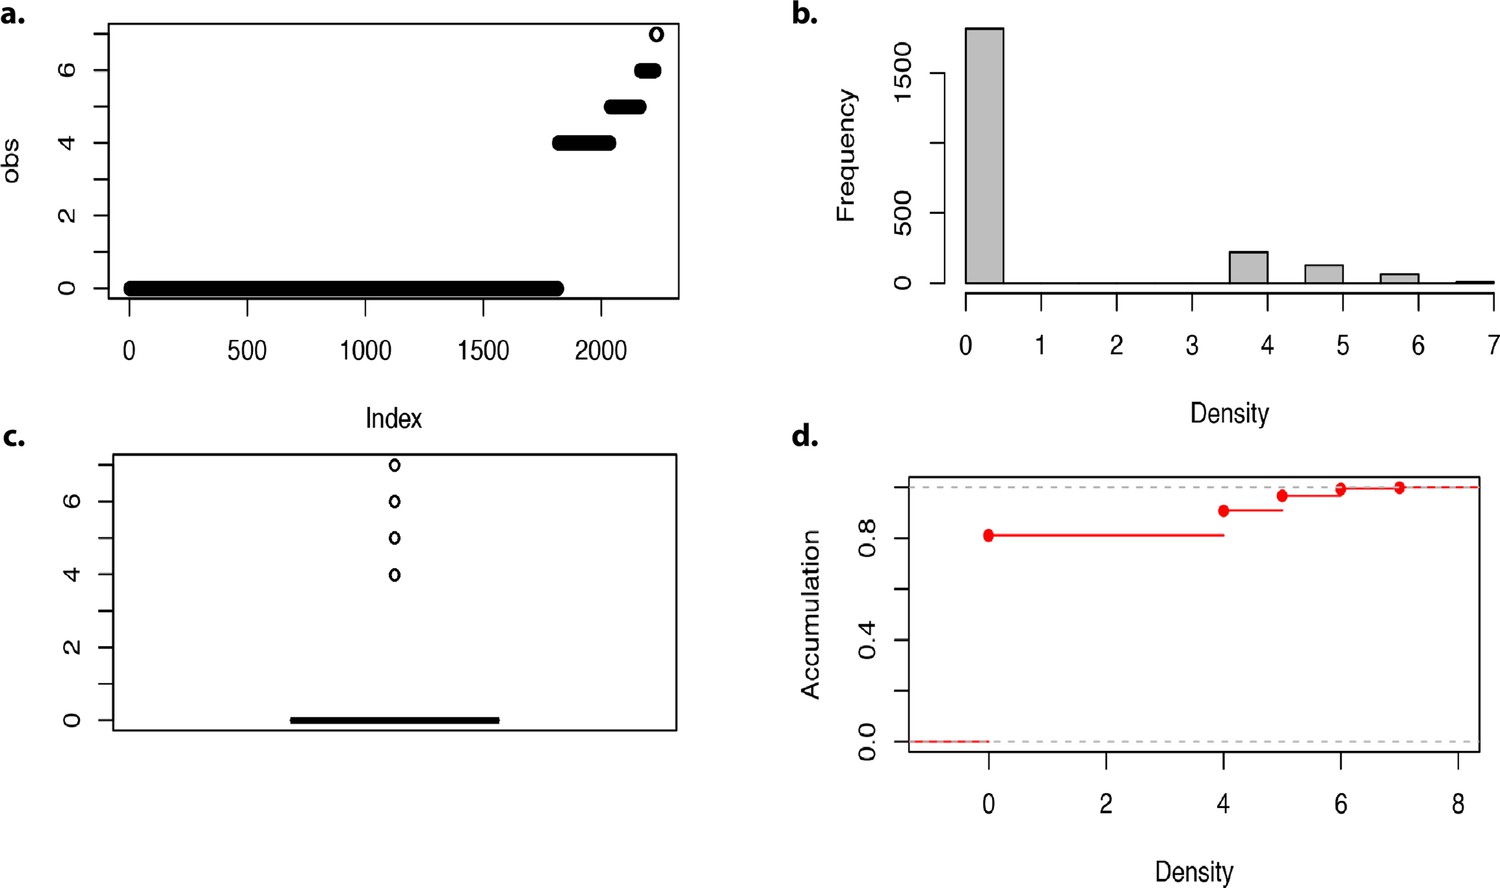
Density of markers in the genome-wide association analysis.
(a–d) Density of markers.
Figure 2—figure supplement 4
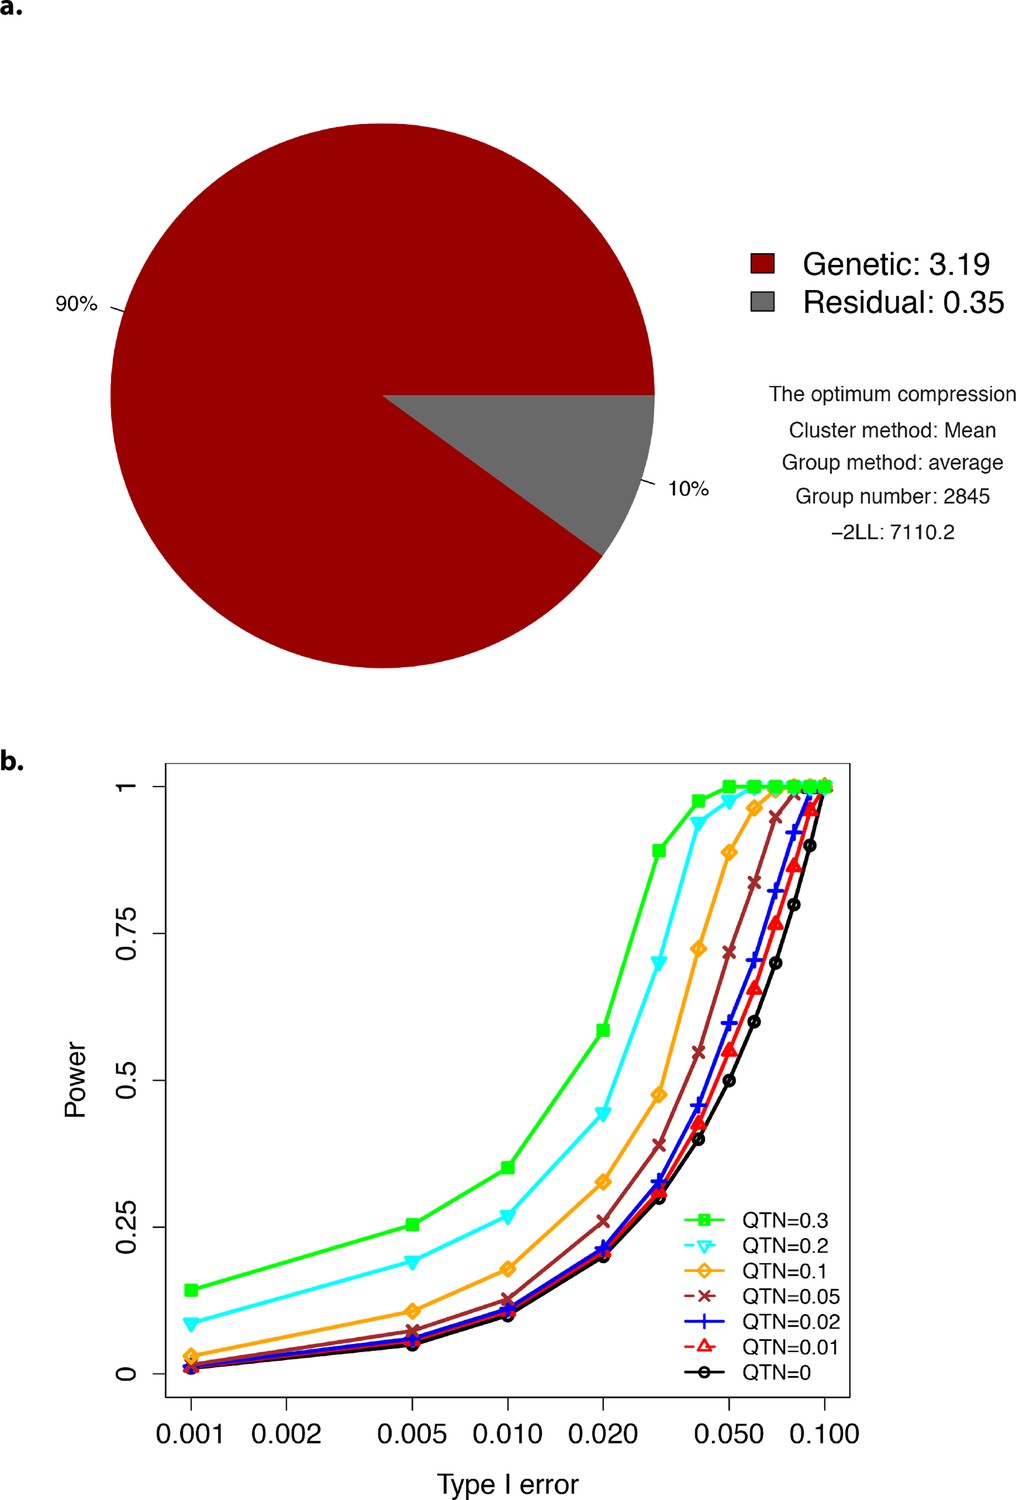
Plots showing optimum compression and Type-I error.
(a) The profile for the optimum compression. (b) Type-I error plot.
Figure 2—figure supplement 5
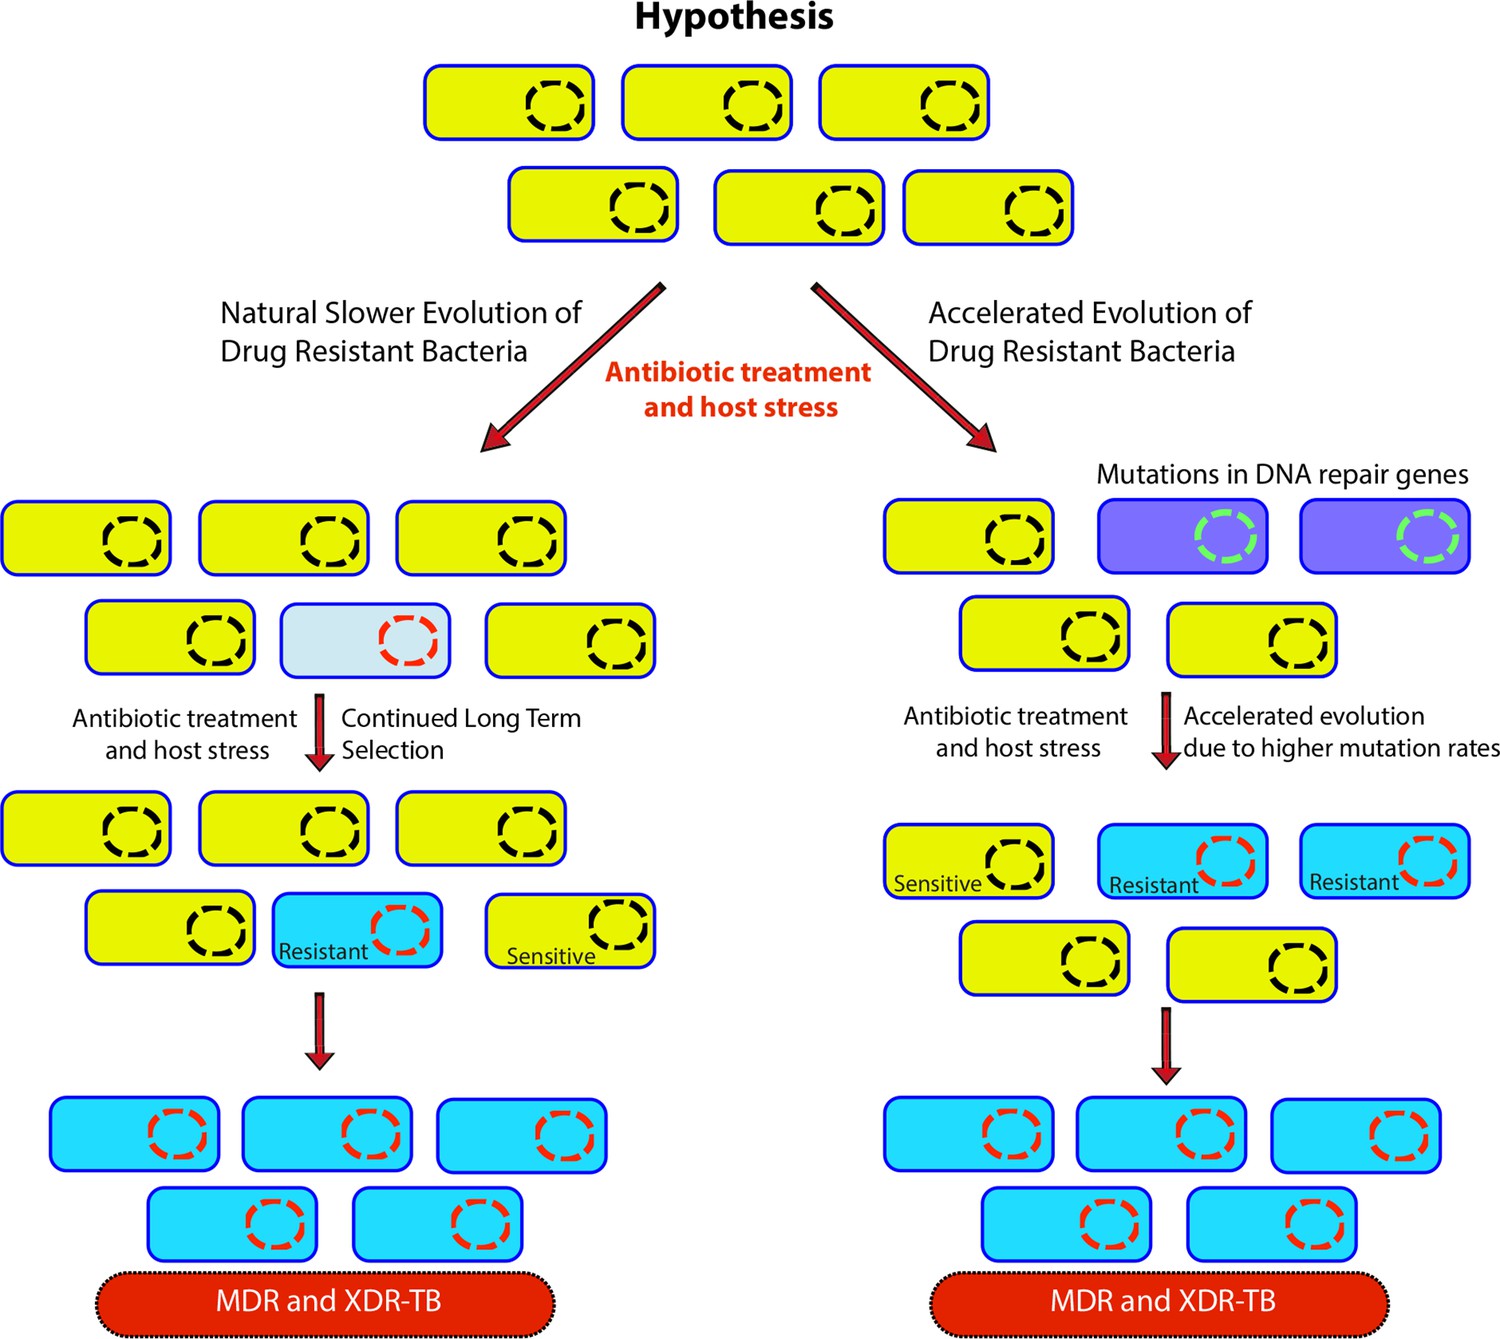
Genome-wide association study-based hypothesis.
In the natural process of evolution, host-imposed stress and antibiotic treatment result in the evolution of wild-type bacteria to multidrug resistant/extensively drug resistant (MDR/XDR). However, in bacteria with compromised DNA repair pathways, the evolution to MDR/XDR-TB is accelerated.
Figure 2—figure supplement 6
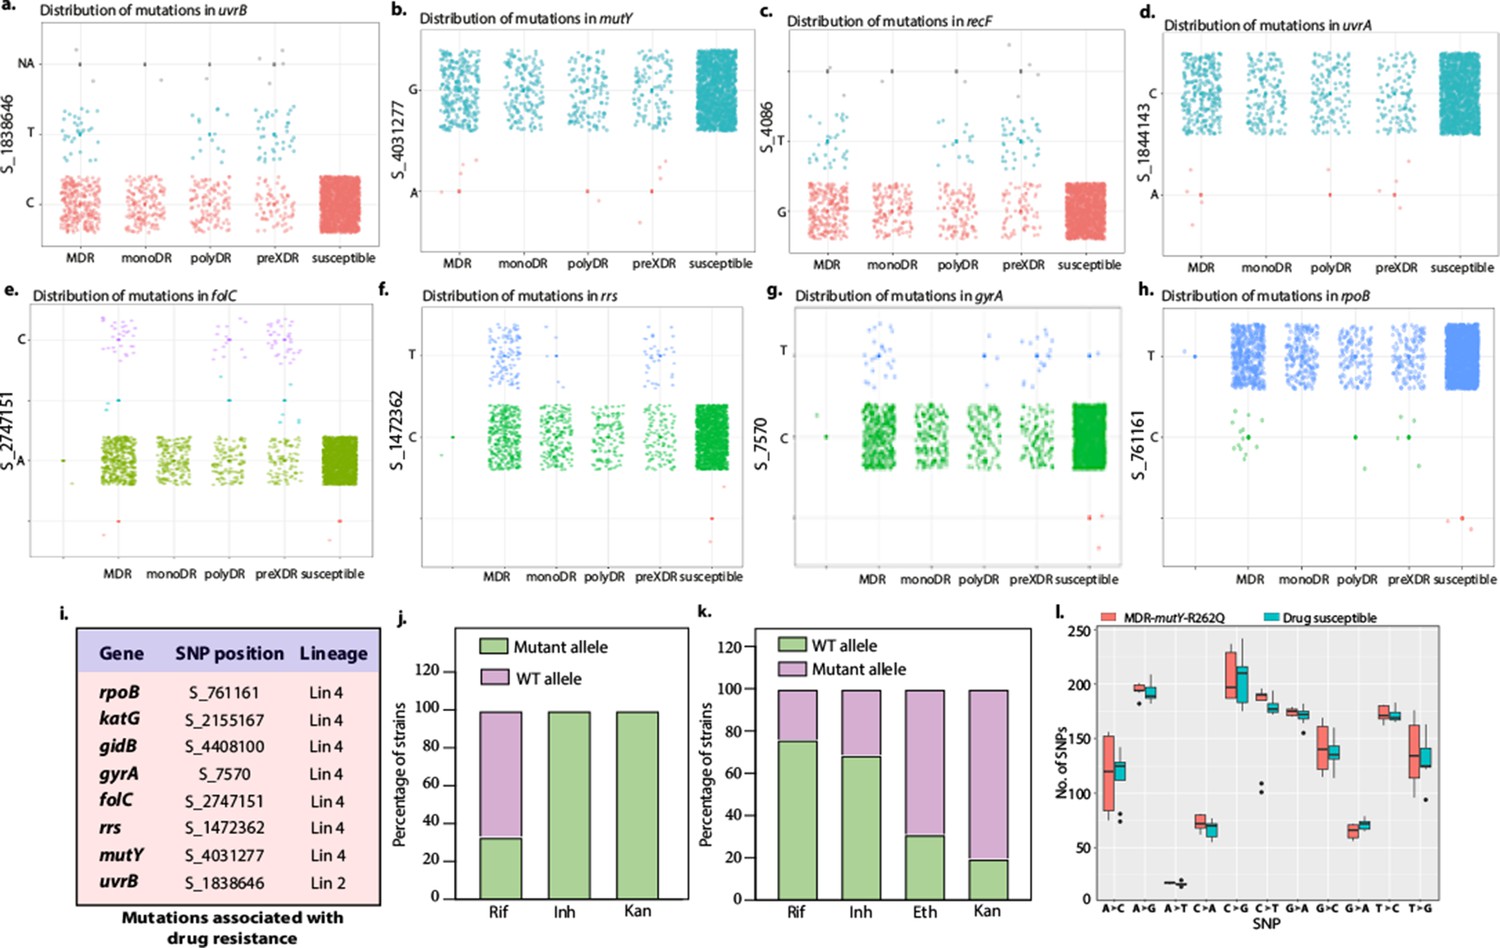
Distribution of mutations in the DNA repair genes.
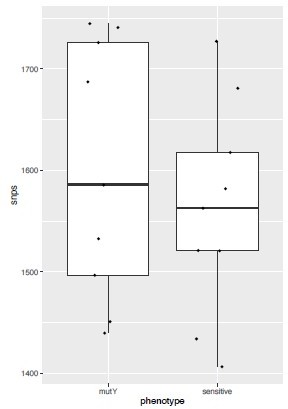
(a–d) Distribution plot showing single nucleotide polymorphisms (SNPs) in mutY, recF, uvrA, and uvrB identified in drug-resistant strains. Wild type and the alternative alleles are shown. (e–h) Distribution plot showing SNPs in mutY, recF, uvrA, and uvrB identified in drug-resistant strains. Wild type and the alternative alleles are shown. (i) Table representing the distribution of drug resistant–associated mutations. (j&k) Bar graph representing direct target mutations in the strains harboring mutY mutation (e) or mutations in the other identified DNA repair genes (f). (l) Box and Whisker plot represent mutation spectrum of clinical strains harboring mutY variant and closely related drug susceptible strains. The analysis showed a trend toward higher C→T, A→G, and C→A mutations, but we could not perform statistical analysis, as the strains harboring mutY variant were limited.
Figure 3 with 2 supplements
Variants identified in DNA repair genes abrogate their function.
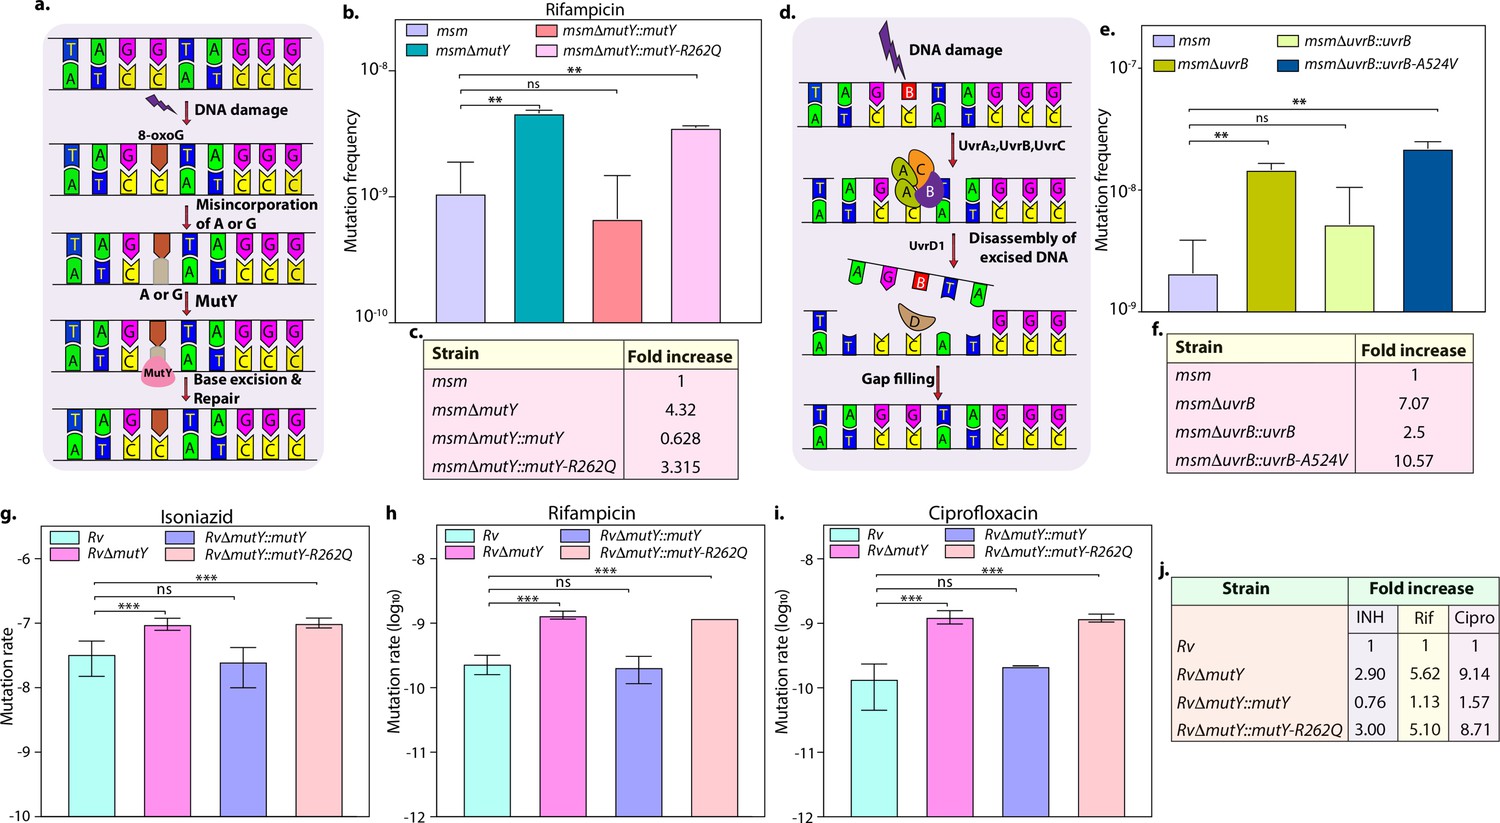
(a) A schematic representation of the base excision repair pathway that operates in mycobacteria. Oxidative damage can result in the conversion of G to 8-oxo-G. If MutM (Fpg) does not repair 8-oxo-G before replication, often an A is inserted against 8-oxo-G during replication. Under these conditions, MutM must avoid repair of 8-oxo-G until MutY removes the erroneously incorporated A. The predominant target of MutY is 8-oxo-G:A pair where it removes A; thus, the action of MutY provides another opportunity to incorporate C (the correct base) against 8-oxo-G. Now the DNA becomes a target for MutM again, leading to the removal of 8-oxo-G and allowing incorporation of G. (b) Mutation frequency was calculated using msm, msmΔmutY, msmΔmutY::mutY, msmΔmutY::mutY-R262Q. (c) Fold increase in the mutation frequency with respect to wild-type msm. (d) A schematic representation of the nucleotide excision repair pathway showing the recognition and initiation of repair by UvrA-UvrB and UvrC. (e) Mutation frequency of msm, msmΔuvrB, msmΔuvrB::uvrB, and msmΔuvrB::uvrB-A524V. (f) Fold increase in the mutation frequency with respect to wild-type msm. Two biologically independent experiment sets were performed. Each biological experiment was performed in a biological sextet. Data represent one set of experiments. Statistical analysis (two-way ANOVA) was performed using Graph pad prism software. ***p<0.0001, **p<0.001, and *p<0.01. (g, h & i) Mutation rate was calculated for different strains in the presence of isoniazid (g), rifampicin (h), or ciprofloxacin (i). (j) Table showing the fold increase in the mutation rate in comparison with wild-type Rv. The experiment was performed using six independent colonies. Data represent mean and standard deviation. Statistical analysis (two-way ANOVA) was performed using Graph pad prism software. ***p<0.0001, **p<0.001, and *p<0.01.
-
Figure 3—source data 1
Mutation rate analysis in the presence of different drugs.
- https://cdn.elifesciences.org/articles/75860/elife-75860-fig3-data1-v3.xlsx
Figure 3—figure supplement 1
Genome-wide association study of lineage 4 strains identified mutations in the DNA repair genes.
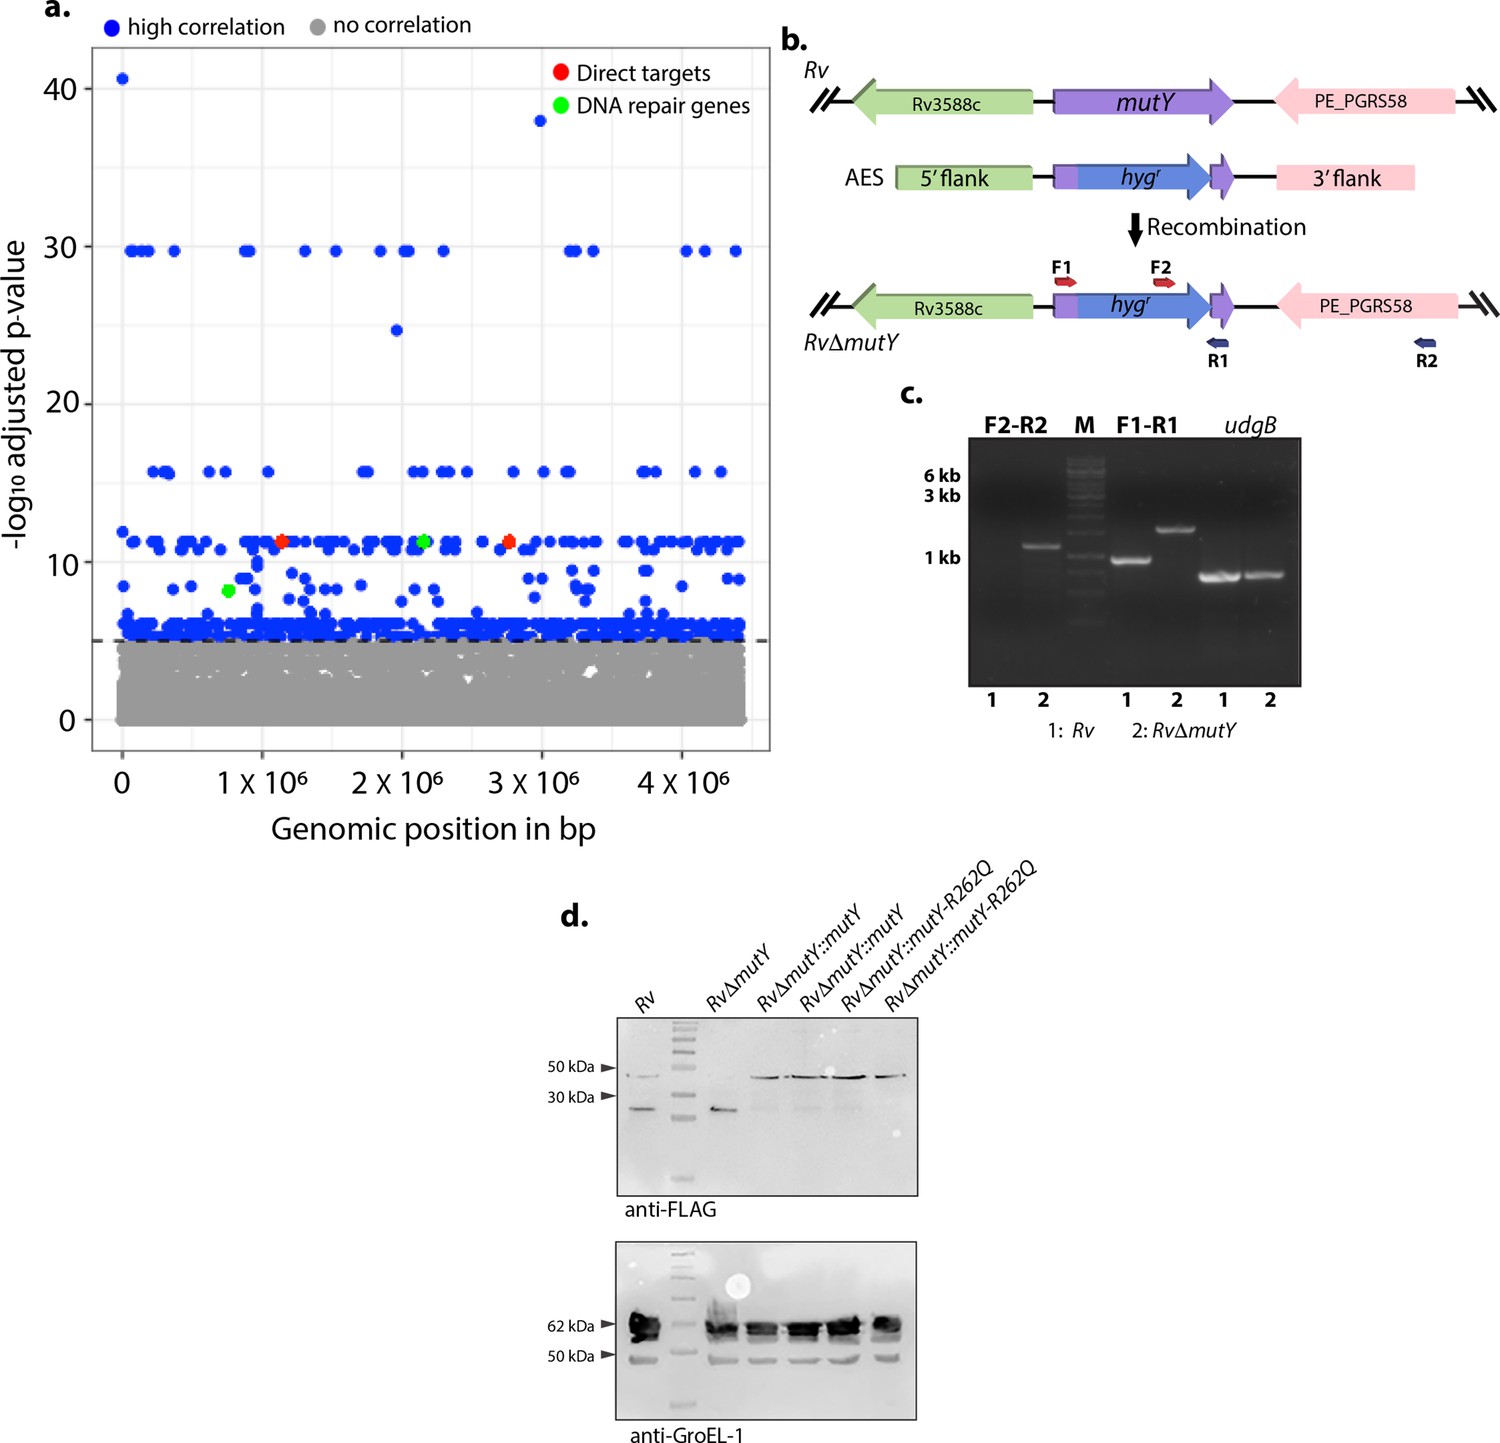
(a) Manhattan plot showing identifying genes that belong to DNA repair and direct target of antibiotics. (b) Schematic depicting the generation of gene replacement mutant of mutY. The hygromycinr cassette disrupted the native allele. (c) PCR using F1-R1 (gene-specific primers) amplified 900 bp in Rv and ~1.6 kb in RvΔmutY. PCR using F2-R2 (hygromycinr cassette forward primer and reverse primer beyond the 3' flank) resulted from amplification in the RvΔmutY but not in Rv. (d) Immunoblot analysis to confirm the expression of complementation constructs RvΔmutY::mutY and RvΔmutY::mutY-R262Q. The upper panel probed with α-FLAG antibody, and the lower panel probed with α-GroEl-1 antibody as a control.
-
Figure 3—figure supplement 1—source data 1
Confirmation of gene repalcement mutant and complementation strains.
- https://cdn.elifesciences.org/articles/75860/elife-75860-fig3-figsupp1-data1-v3.zip
Figure 3—figure supplement 2
Mutation frequency analysis.
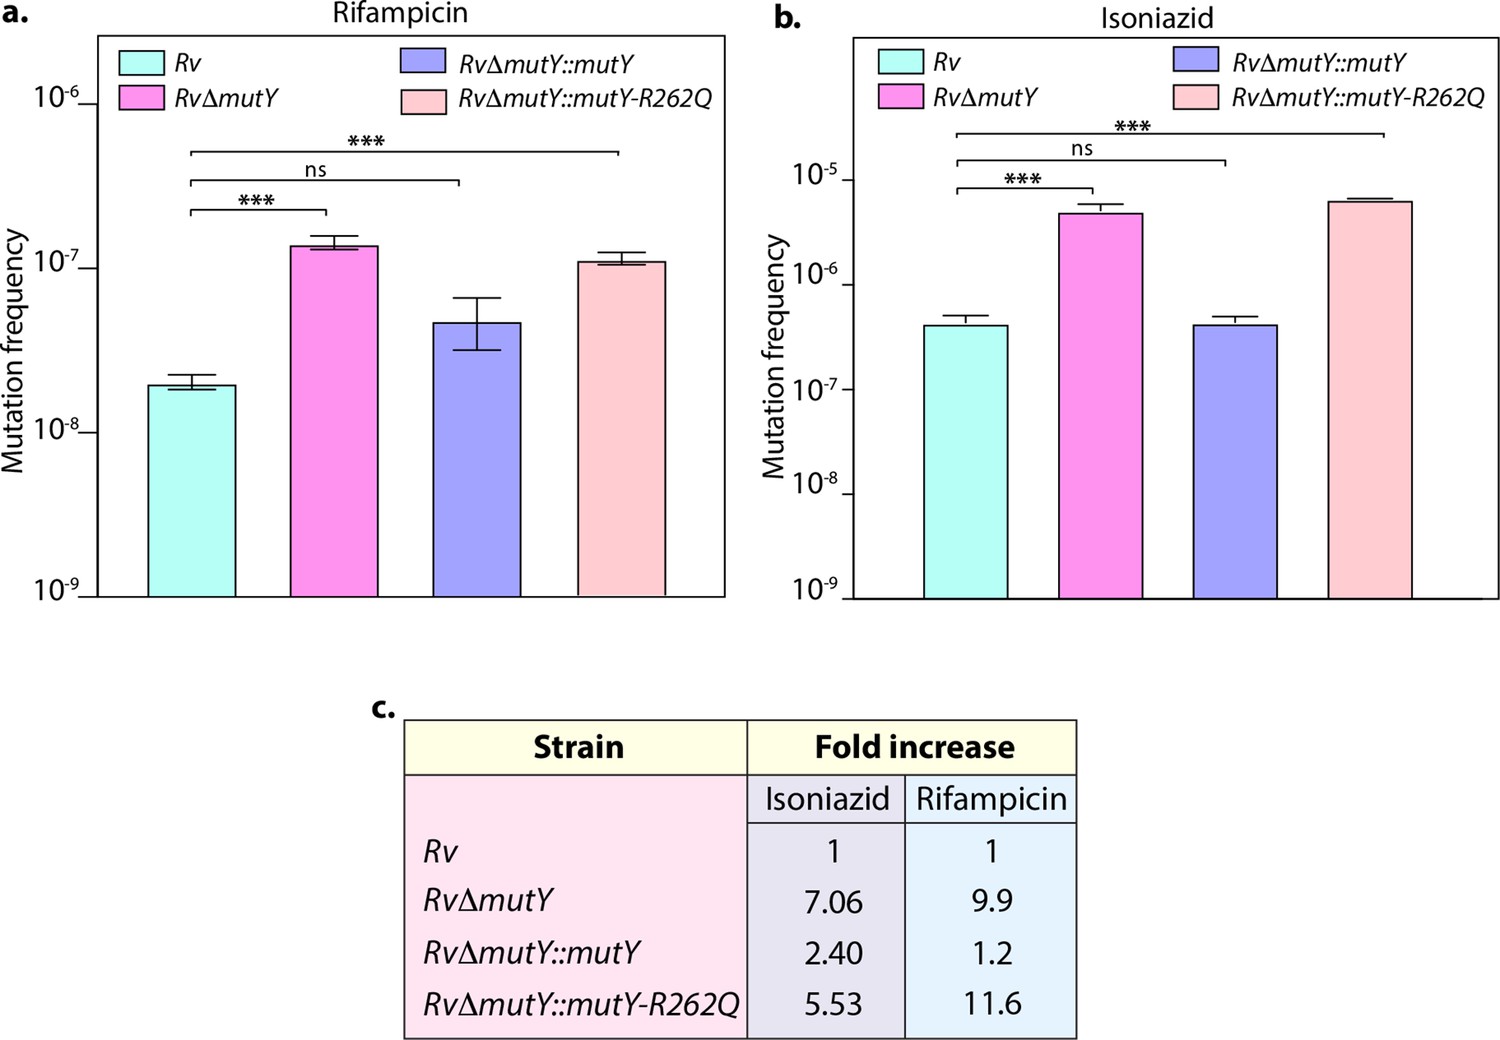
(a) Mutation frequency was calculated for different strains in the presence of rifampicin (a) or isoniazid (b). (c) Table showing the fold increase in the mutation frequency in comparison with wild-type Rv. Two biologically independent experiment sets were performed, and each experiment was performed in sextet. Data represent mean and standard deviation. Statistical analysis (two-way ANOVA) was performed using Graph pad prism software. ***p<0.0001, **p<0.001, and *p<0.01.
-
Figure 3—figure supplement 2—source data 1
Analysis of Mutation frequency.
- https://cdn.elifesciences.org/articles/75860/elife-75860-fig3-figsupp2-data1-v3.xlsx
Figure 4
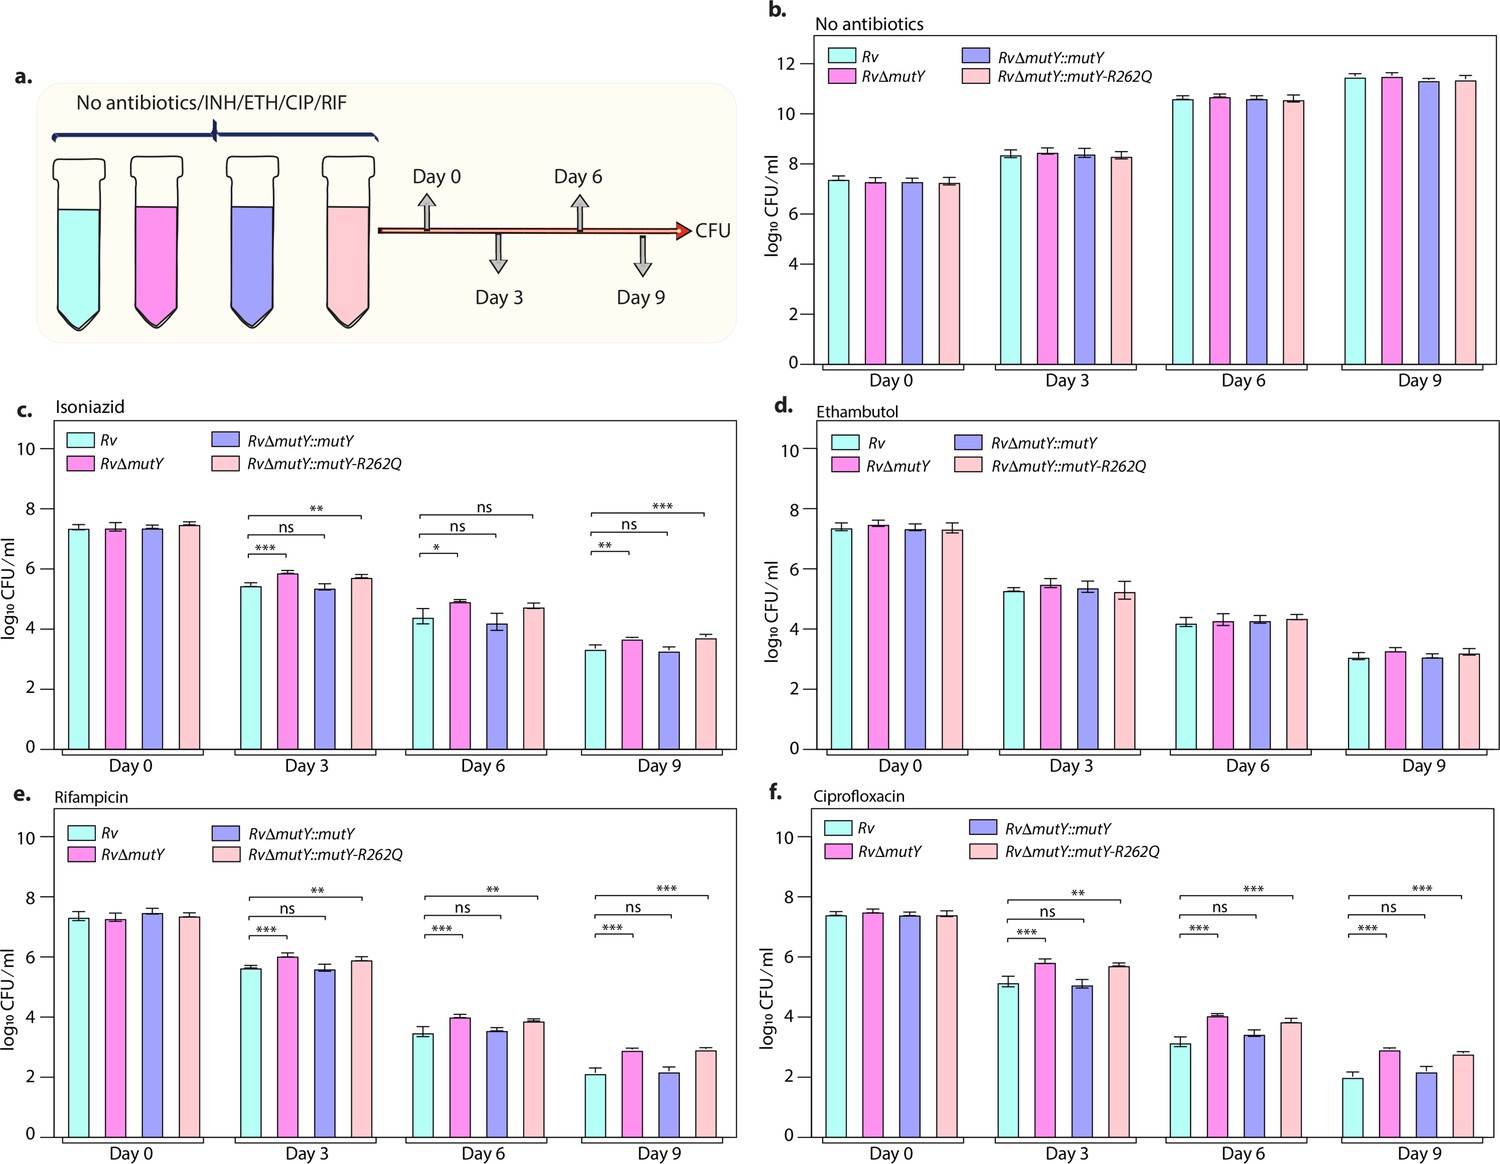
Killing kinetics in the presence of antibiotics show better survival of RvΔmutY and RvΔmutY::mutY R262Q.
(a) Schematic representation of killing kinetics. (b) Growth kinetics in the absence of drugs. (c–f) Growth kinetics in the presence of isoniazid, rifampicin, ciprofloxacin, and ethambutol. Two biologically independent sets of experiments were performed. Each biological experiment was performed in biological triplicates. Data represent one set of experiments. Statistical analysis (two-way ANOVA) was performed using Graph pad prism software. ***p<0.0001, **p<0.001, and *p<0.01.
-
Figure 4—source data 1
Killing kinetics in the absence and presence of different antibiotics.
- https://cdn.elifesciences.org/articles/75860/elife-75860-fig4-data1-v3.xlsx
Figure 5 with 1 supplement
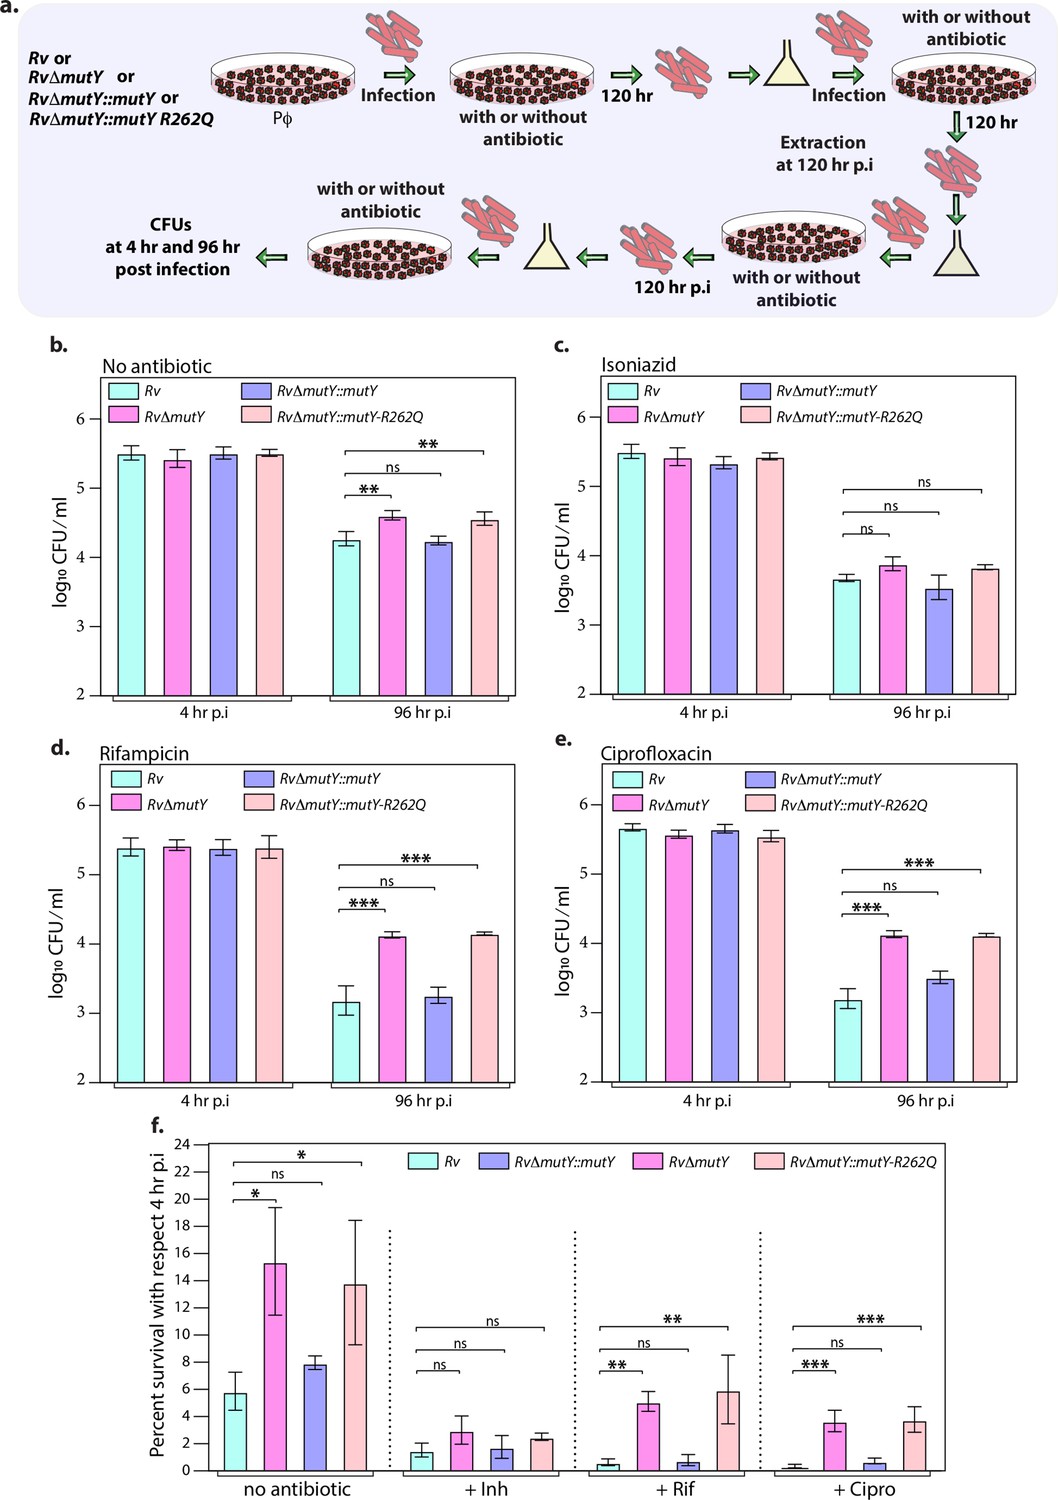
Mutations in the DNA repair genes provide a survival advantage in the presence of antibiotics.
(a) A schematic is representing the ex vivo infection experiment in the presence and absence of different antibiotics. (b–e) Survival of the strains in the peritoneal macrophages at 4 and 96 hr post-infection (p.i.) without and with antibiotics (isoniazid or rifampicin, or ciprofloxacin). (f) Percent survival with respect to 4 hr p.i. was determined for each strain without and with antibiotics (isoniazid or rifampicin or ciprofloxacin). Two biologically independent sets of experiments were performed. Each biological experiment was performed in biological triplicates. Data represent one set of experiments. Statistical analysis (two-way ANOVA) was performed using Graph pad prism software. ***p<0.0001, **p<0.001, and *p<0.01.
-
Figure 5—source data 1
Survival of different strains in the absence and presence of antibiotics ex vivo.
- https://cdn.elifesciences.org/articles/75860/elife-75860-fig5-data1-v3.xlsx
Figure 5—figure supplement 1
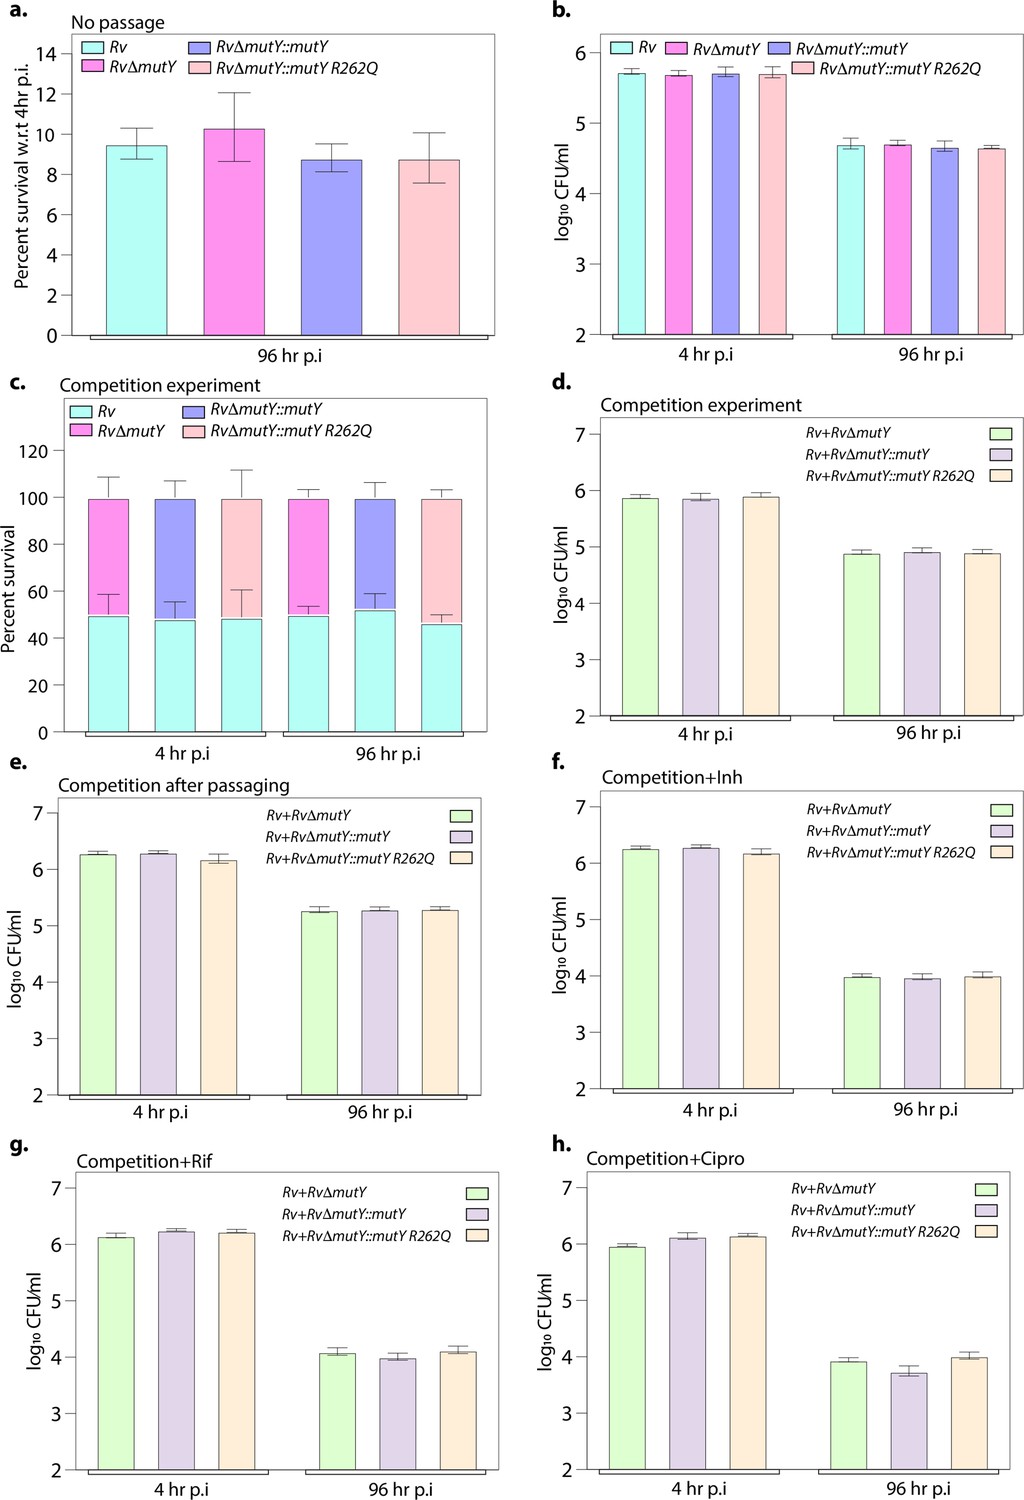
Ex vivo survival of strains.
(a) Survival of strains with respect to 4 hr post-infection (p.i.) in peritoneal macrophages. (b) CFU enumeration of strains at 4 and 96 hr p.i. (c) Percent survival of each strain in the competition experiment. (d) CFU enumeration of strains at 4 and 96 hr p.i. in competition experiment. (e) Competition experiment after passaging of strains ex vivo. In the absence of antibiotics, the CFU enumeration was performed at 4 and 96 hr p.i. CFU enumeration in the presence of (f) isoniazid, (g) rifampicin, and (h) ciprofloxacin at 4 and 96 hr p.i. Two biologically independent experiments and each experiment was performed in the biological triplicates. Data represents one set of the biological experiments.
-
Figure 5—figure supplement 1—source data 1
Survival of strains before and after passage in the peritoneal macrophages.
- https://cdn.elifesciences.org/articles/75860/elife-75860-fig5-figsupp1-data1-v3.xlsx
Figure 6
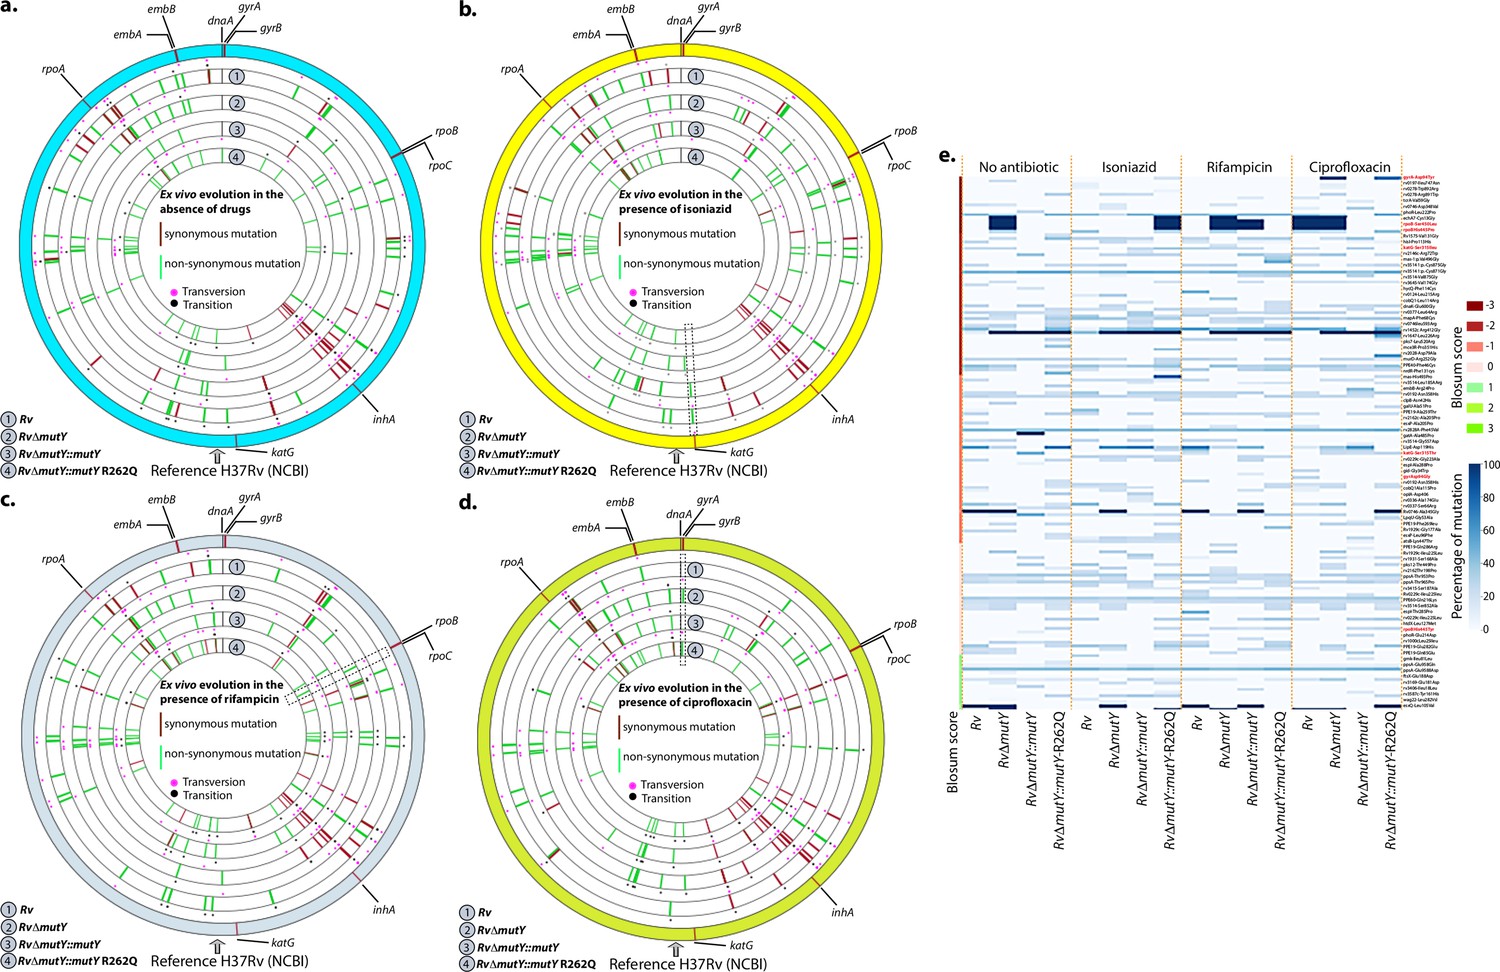
WGS reveals the acquisition of direct target mutations in the ex vivo passaged strains.
(a–d) Circos plot showing the WGS analysis of the strains passaged ex vivo in the absence (a) and in the presence of isoniazid (b), rifampicin (c), and ciprofloxacin (d). The outermost circle represents the reference genome labeled with the known direct target mutations. Circles (from outside to inside) represent Rv, RvΔmutY, RvΔmutY::mutY, and RvΔmutY::mutY-R262Q genome. (e) Heat map represents the single nucleotide polymorphisms identified in the Rv, RvΔmutY, RvΔmutY::mutY, and RvΔmutY::mutY-R262Q after ex vivo passage.
Figure 7

Variant of mutY outcompetes Rv in competition experiment.
(a) Schematic representing the competition experiment performed in peritoneal macrophages. Strains obtained after three rounds of infection in the peritoneal macrophages were used to perform a competition experiment (Figure 4a). (b–e) Percent survival of Rv, RvΔmutY, RvΔmutY::mutY, and RvΔmutY::mutY R262Q in the absence and presence of antibiotics. Two biologically independent experiments, with each experiment performed in technical triplicates. Data represent one of the two biological experiments. Data represent mean and standard deviation. Statistical analysis (two-way ANOVA) was performed using Graph pad prism software. ***p<0.0001, **p<0.001, and *p<0.01.
-
Figure 7—source data 1
Competition experiment in the presence and absence of different drugs after passage in the peritoneal macrophages.
- https://cdn.elifesciences.org/articles/75860/elife-75860-fig7-data1-v3.xlsx
Figure 8 with 2 supplements
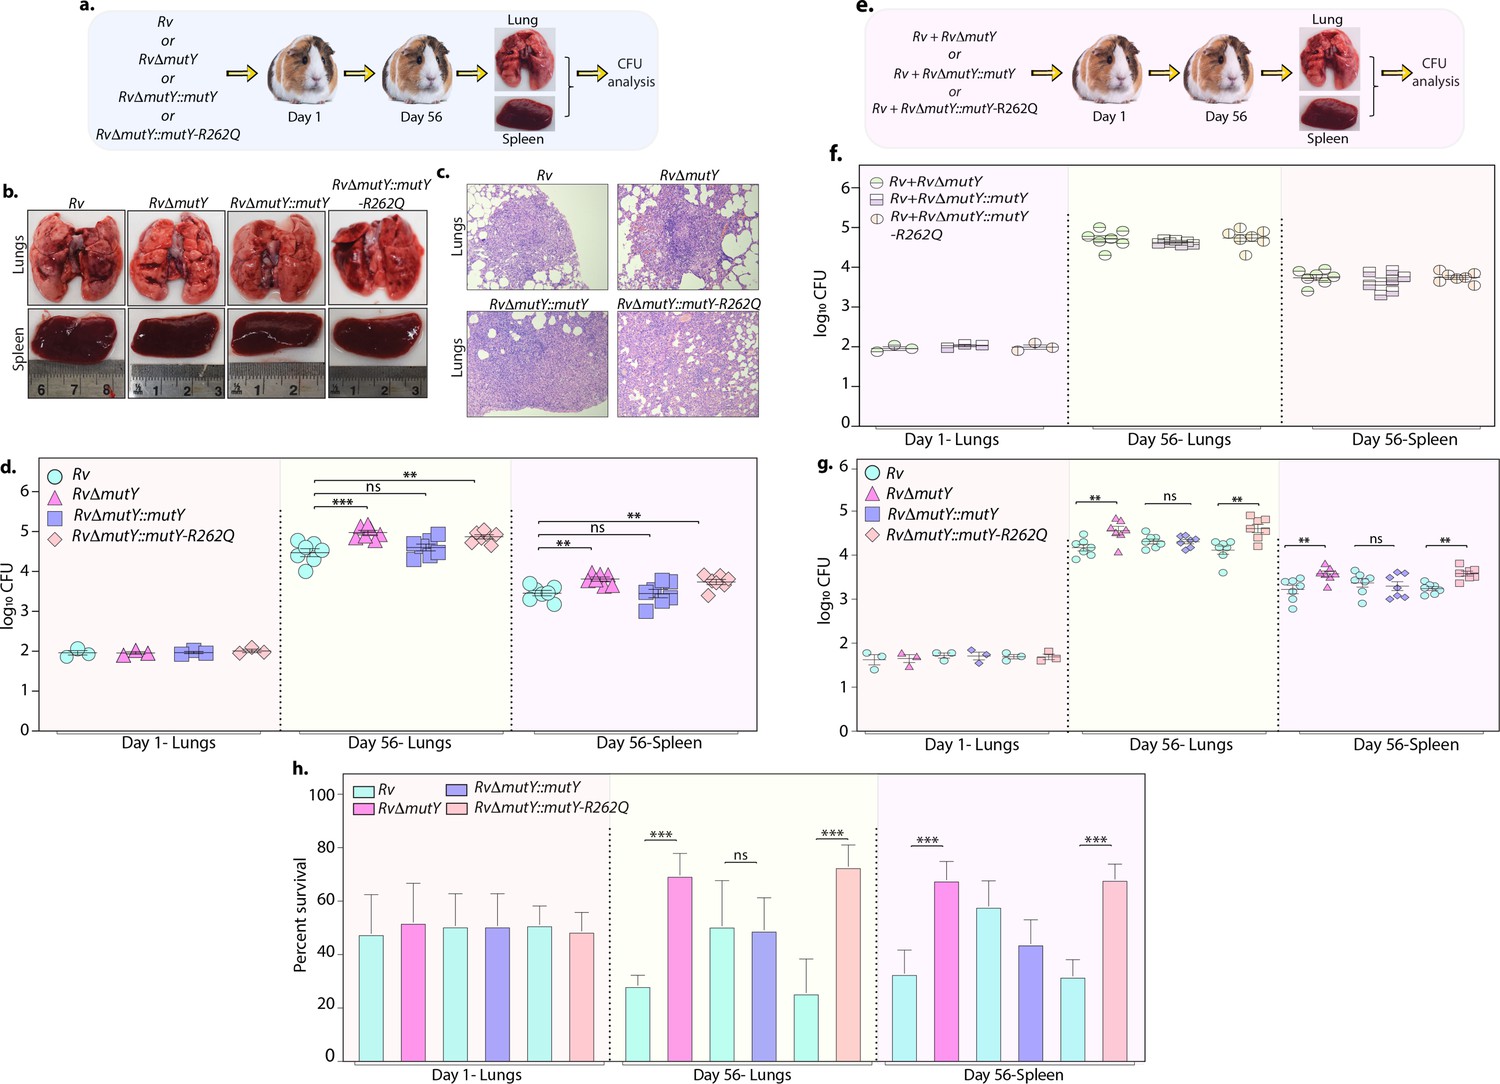
Perturbation of DNA repair results in enhanced survival in vivo.
(a) A schematic representation of the guinea pig infection experiment. (b) Gross histopathology of lungs and spleen of infected guinea pigs. (c) Hematoxylin and eosin staining of infected lung tissue showing the well-formed granuloma. Magnification ×10. (d) Guinea pigs were challenged with Rv, RvΔmutY, RvΔmutY::mutY, and RvΔmutY::mutY-R262Q via the aerosol route. CFUs were enumerated at day 1 post-infection to determine the lungs’ initial load (n=3). The CFUs at 1 day post-infection (p.i.) are represented for the whole lung. At 56 days p.i., lungs and spleen were isolated to determine survival (CFU / ml, n=7). (e) Outline showing the competition experiment performed in guinea pigs. (f) Total CFU enumeration of Rv + RvΔmutY, Rv + RvΔmutY::mutY, and Rv + RvΔmutY::mutY-R262Q in the lungs and spleen of guinea pigs at 1 day (whole lung, n=3) and 56 days p.i. (CFU/ml, n=7). (g) CFU enumeration of Rv + RvΔmutY, Rv + RvΔmutY::mutY, and Rv + RvΔmutY::mutY-R262Q on kanamycin and hygromycin containing plates. Statistical analysis was performed using two-way ANOVA. Graphpad prism was employed for performing statistical analysis. ***p<0.0001, **p<0.001, and *p<0.01. (h) Survival of each strain at indicated time points in the mixed infection. (i) Percent survival at 1 and 56 days in the competition experiment. Statistical analysis was performed using unpaired t-test. ***p<0.0001, **p<0.001, and *p<0.01.
-
Figure 8—source data 1
Gross histopathology of the infected lungs and spleen isolated from guinea pig.
- https://cdn.elifesciences.org/articles/75860/elife-75860-fig8-data1-v3.pdf
-
Figure 8—source data 2
Haematoxylin and eosin staining.
- https://cdn.elifesciences.org/articles/75860/elife-75860-fig8-data2-v3.pdf
-
Figure 8—source data 3
Survival of different strains in vivo.
- https://cdn.elifesciences.org/articles/75860/elife-75860-fig8-data3-v3.xlsx
Figure 8—figure supplement 1
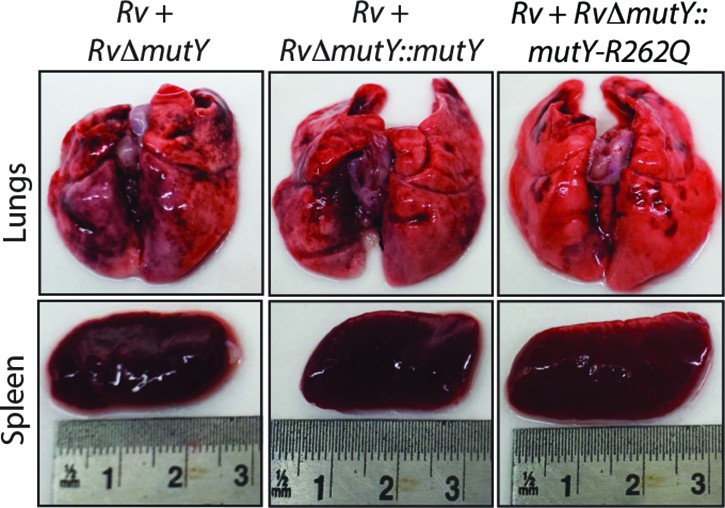
Gross histopathology of infected lungs and spleen isolated at 56days post-infection.
-
Figure 8—figure supplement 1—source data 1
Gross histopathology of lungs and spleen isolated from guinea pigs after competition experiment.
- https://cdn.elifesciences.org/articles/75860/elife-75860-fig8-figsupp1-data1-v3.pdf
Figure 8—figure supplement 2
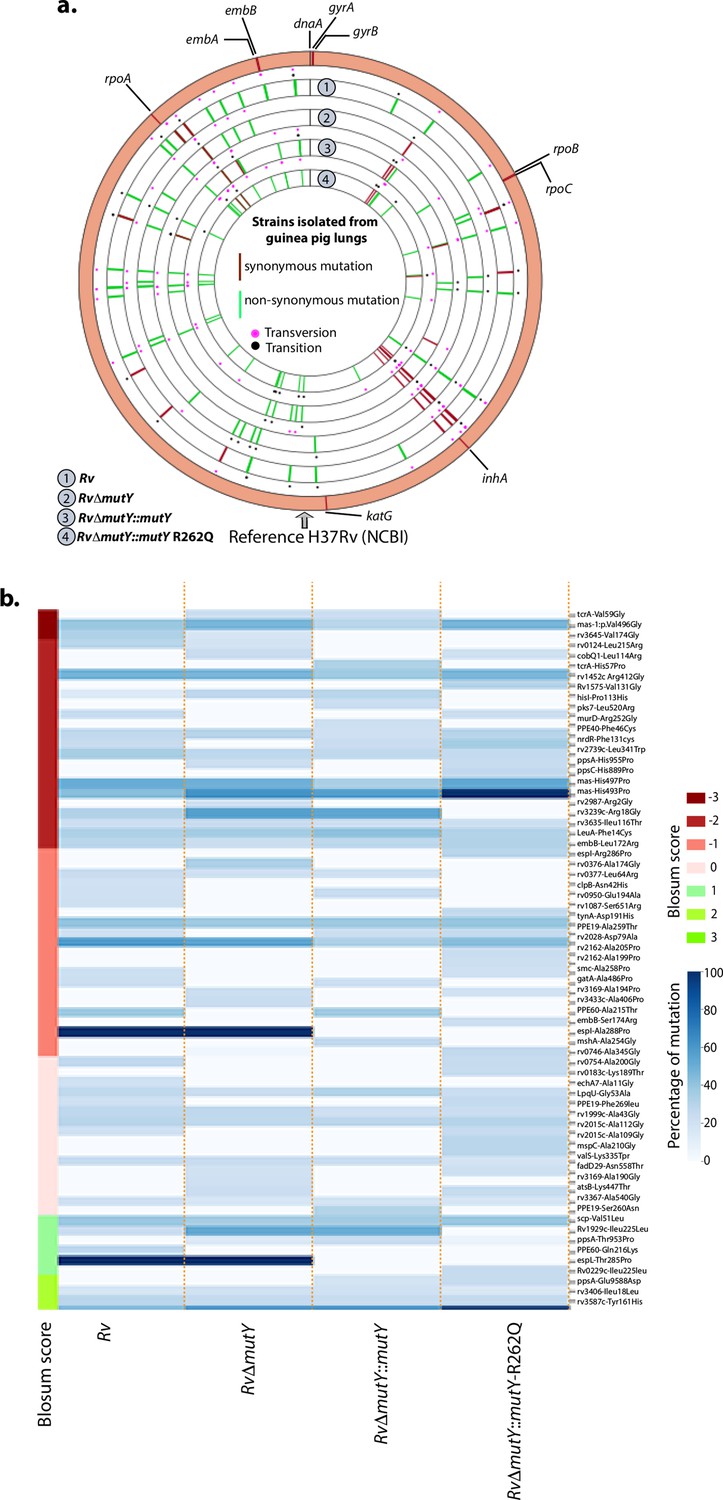
WGS analysis of strains isolated from guinea pig lungs.
(a) Circos plot shows the WGS analysis of the strains isolated from guinea pig lungs. The outermost circle represents the reference genome labeled with the known direct target mutations. Circles (from outside to inside) represent Rv, RvΔmutY, RvΔmutY::mutY, and RvΔmutY::mutY-R262Q genome. (b) Heat map representing the single nucleotide polymorphisms identified in the Rv, RvΔmutY, RvΔmutY::mutY, and RvΔmutY::mutY-R262Q after ex vivo passage.
Figure 9
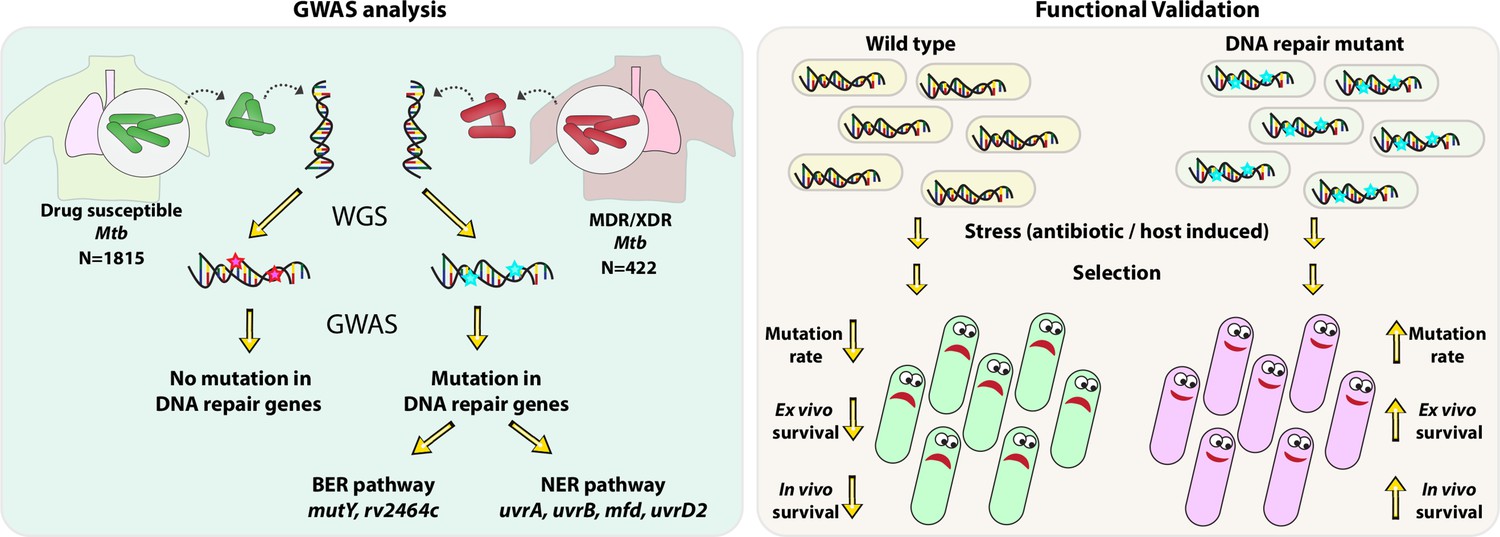
Model.
Model depicts the analysis and subsequent validation. Genome-wide association study (GWAS) revealed mutation in three DNA repair pathway genes in multidrug resistant/extensively drug resistant (MDR/XDR) strains. Based on GWAS, we proposed that mutations in DNA repair genes are associated with the evolution of antibiotic resistance in Mycobacterium tuberculosis (Mtb). Functional validation was performed using the gene replacement mutants of base excision repair (BER) and nucleotide excision repair (NER) pathway genes in Mycobacterium smegmatis and Mtb. In vitro, ex vivo, and in vivo experiments show that compromised DNA repair pathway leads to the enhanced survival of bacteria.
Author response image 1

Author response image 2
Tables
Table 1
Mutations identified in the direct targets of antibiotics.
| Antibiotic | Gene | Mutations identified |
|---|---|---|
| Rifampicin | rpoB | Leu452Pro, Val496Meth |
| Isoniazid | katG | Ser315Thr |
| Ethambutol | embB | Gly406Ser |
| Ofloxacin | gyrA | Ala90Val, Ser91Pro |
| Kanamycin | rrs | 7 independent mutations |
| Pyrazinamide | pncA | His71Arg |
| Ethionamide | ethA | Met95Arg, Pro160(frame-shift) |
| Streptomycin | gidB | Leu35 (frame-shift) |
| Cycloserine | ald | Thr427Pro |
Table 2
Mutations in DNA repair genes associated with drug resistance phenotype.
| Gene | Amino acid change | Wild type | Mutated | False discovery rate-adjusted p-value |
|---|---|---|---|---|
| mutY | Arg262Gln | G | A | 3.83E-09 |
| uvrB | Ala524Val | C | T | 2.15E-07 |
| uvrA | Gln135Lys | C | A | 3.83E-09 |
| RecF | Gly269Gly | G | T | 2.15E-07 |
Table 3
Transporters associated with drug resistance phenotype.
| Gene | False discovery rate-adjusted p-value | Variant |
|---|---|---|
| rv1258c | 1.60E-08 | Non-syn |
| mmpL2 | 9.51E-05 | Non-syn |
| rv0987 | 1.60E-08 | Non-syn |
| rv1250 | 3.44E-07 | Non-syn |
| kdpC | 2.15E-07 | Non-syn |
| rv0928 | 2.15E-07 | Non-syn |
| rv2333c | 1.32E-20 | Frameshift |
| mmpL13a | 1.25E-06 | Syn |
| kdpB | 2.15E-07 | Syn |
Additional files
-
Supplementary file 1
Total number of clinical strains used in this study.
The table contains the total number of clinical strains obtained from different studies.
- https://cdn.elifesciences.org/articles/75860/elife-75860-supp1-v3.xlsx
-
Supplementary file 2
Clinical strains used for the Genome-wide association analysis.
The table contains the clinical strains which are used for performing genome-wide association study analysis.
- https://cdn.elifesciences.org/articles/75860/elife-75860-supp2-v3.xlsx
-
Supplementary file 3
Synonymous change identified in the association analysis.
The table contains synonymous changes identified in the multidrug-resistant/extensively drug-resistant strains.
- https://cdn.elifesciences.org/articles/75860/elife-75860-supp3-v3.xlsx
-
Supplementary file 4
Non-synonymous change identified in the association analysis.
The table contains non-synonymous changes identified in the multidrug-resistant/extensively drug-resistant strains.
- https://cdn.elifesciences.org/articles/75860/elife-75860-supp4-v3.xlsx
-
Supplementary file 5
Upstream gene variants identified in the association analysis.
The table contains non-upstream gene variants identified in the multidrug-resistant/extensively drug-resistant strains.
- https://cdn.elifesciences.org/articles/75860/elife-75860-supp5-v3.xlsx
-
Supplementary file 6
Stop codon or frameshift mutations identified in the association analysis.
The table contains Stop codon or frameshift mutations identified in the multidrug-resistant/extensively drug-resistant strains.
- https://cdn.elifesciences.org/articles/75860/elife-75860-supp6-v3.xlsx
-
Supplementary file 7
Codon usage of the multidrug-resistant/extensively drug-resistant (MDR/XDR) strains.
The table contains codon usage in the MDR/XDR and Rv strain.
- https://cdn.elifesciences.org/articles/75860/elife-75860-supp7-v3.xlsx
-
Supplementary file 8
Mutations identified in Rv, RvΔmutY, RvΔmutY::mutY, and RvΔmutY::mutY-R262Q strains under different conditions.
The table consists of percentage of mutation and blosum score of genes that harbor s under different conditions.
- https://cdn.elifesciences.org/articles/75860/elife-75860-supp8-v3.xlsx
-
Supplementary file 9
Oligonucleotide used in the study.
The table consists of oligonucleotide used in the study.
- https://cdn.elifesciences.org/articles/75860/elife-75860-supp9-v3.xlsx
-
Transparent reporting form
- https://cdn.elifesciences.org/articles/75860/elife-75860-transrepform1-v3.pdf
Download links
A two-part list of links to download the article, or parts of the article, in various formats.
Downloads (link to download the article as PDF)
Open citations (links to open the citations from this article in various online reference manager services)
Cite this article (links to download the citations from this article in formats compatible with various reference manager tools)
GWAS and functional studies suggest a role for altered DNA repair in the evolution of drug resistance in Mycobacterium tuberculosis
eLife 12:e75860.
https://doi.org/10.7554/eLife.75860


