Macrophage inflammation resolution requires CPEB4-directed offsetting of mRNA degradation
- Institute for Research in Biomedicine (IRB Barcelona), The Barcelona Institute of Science and Technology, Spain
- Universitat Pompeu Fabra, Spain
- Institució Catalana de Recerca i Estudis Avançats (ICREA), Spain
Figures
Figure 1 with 2 supplements
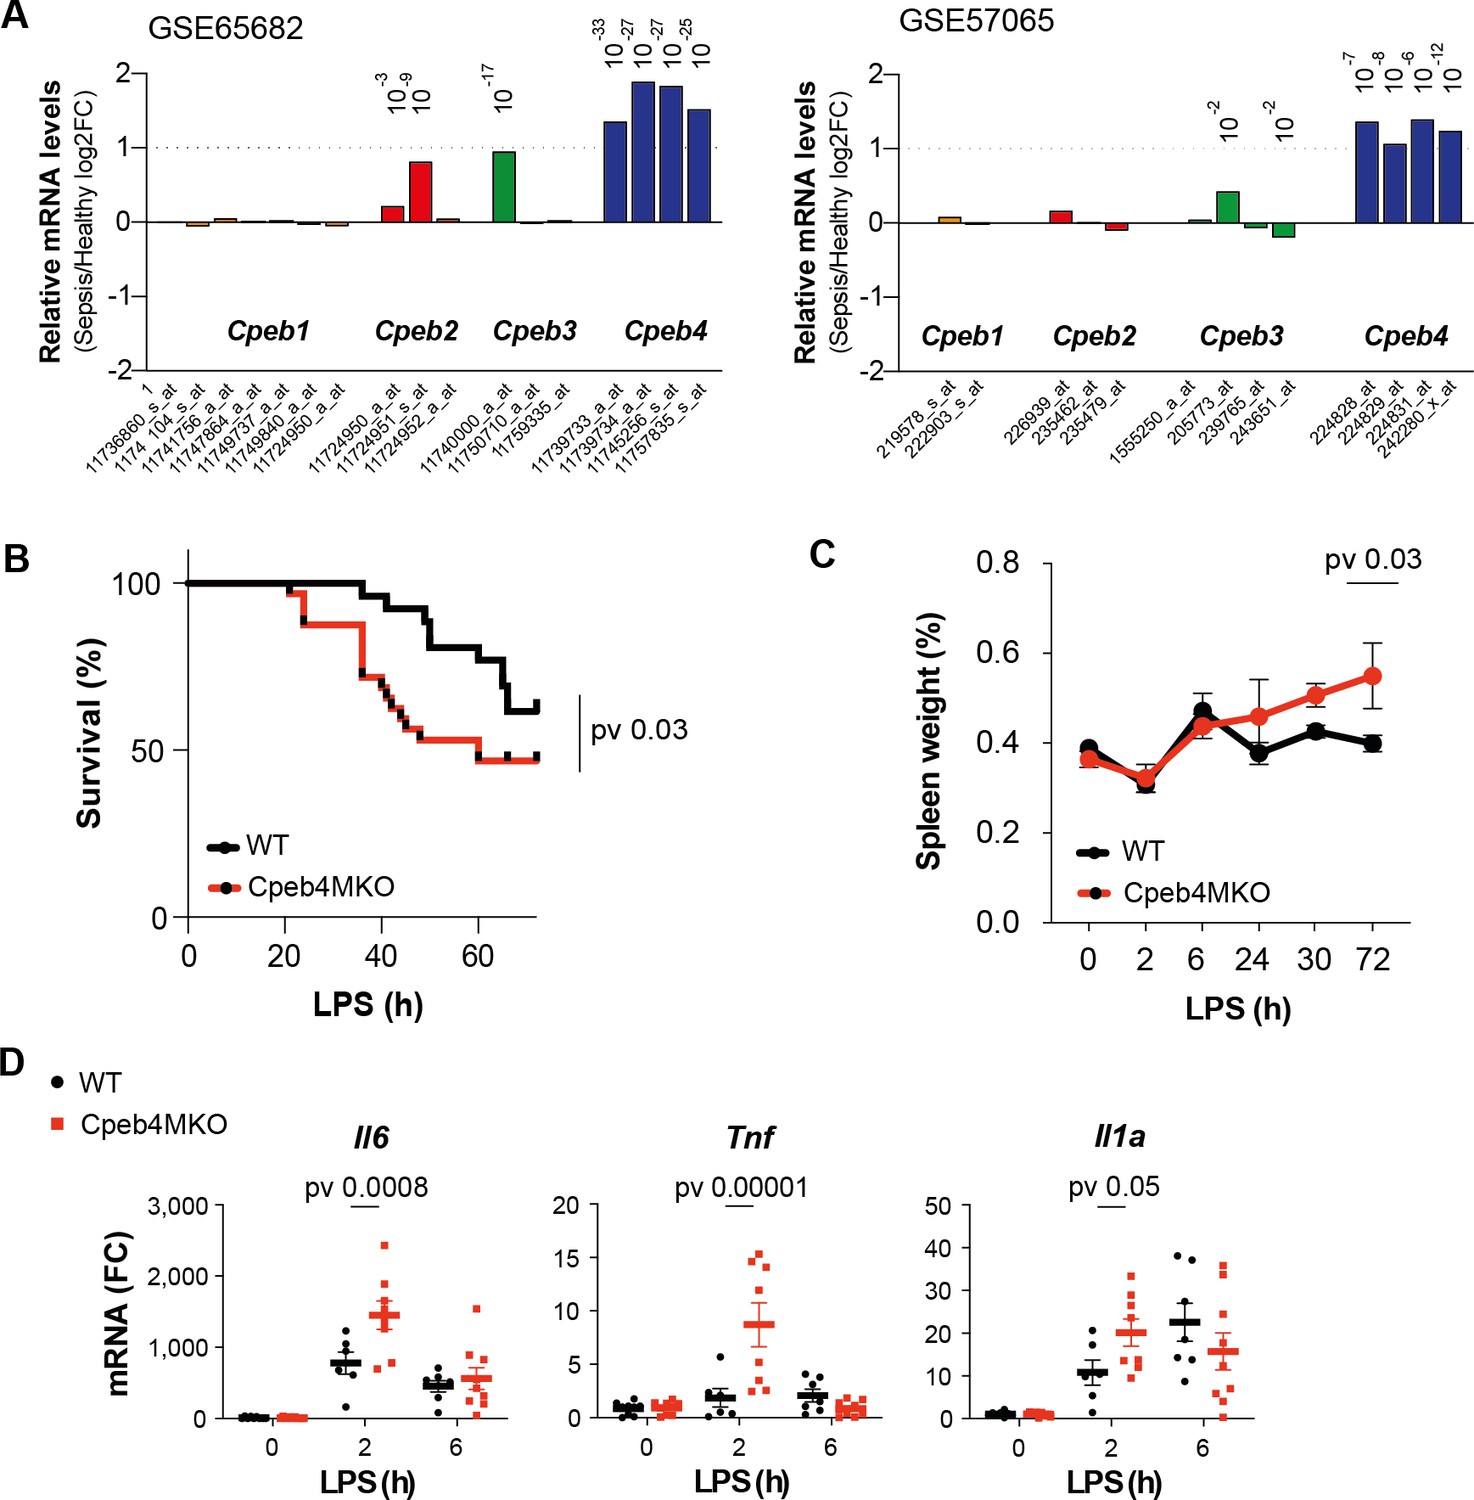
CPEB4 downregulation in myeloid cells increases sepsis-induced mortality.
(A) Differential expression of Cpeb mRNAs in the blood of sepsis patients/healthy individuals. Statistics: limma-moderated t-test. Pvadj (Benjamini–Hochberg) is shown. (B–D) Wildtype (WT) and myeloid-specific Cpeb4 KO mice (Cpeb4MKO) were injected with an i.p. dose of lipopolysaccharide (LPS). (B) Kaplan–Meier survival curves. Results represent three independent experiments (n > 7/group/experiment). Statistics: likelihood-ratio test p-value. (C) Spleen weights normalized to total animal weight. Statistics: two-way ANOVA. (D) Splenic total mRNA was measured by RT-qPCR and referred to Tbp (n > 5 animals/condition). Statistics: multiple t-test. (C, D) Data are represented as mean ± SD.
Figure 1—figure supplement 1
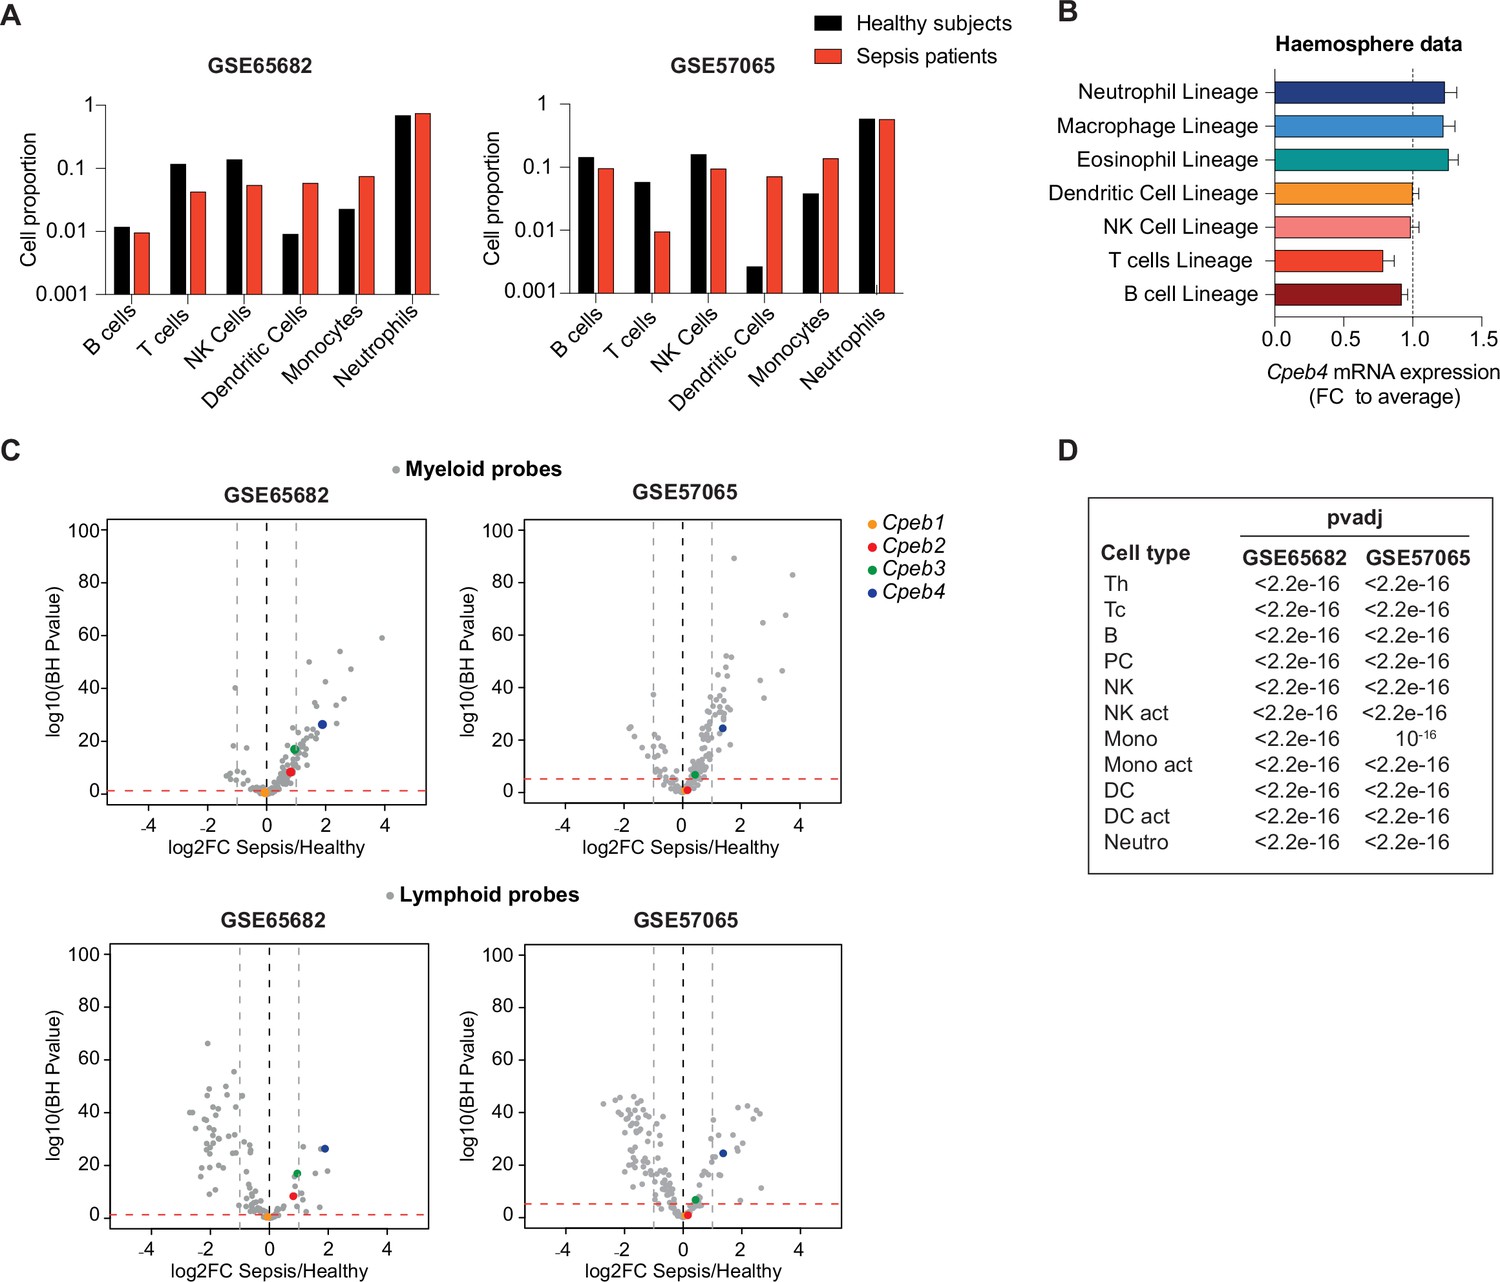
CPEB4 upregulation in myeloid cells in septic patients.
(A) Gene expression deconvolution was performed to estimate cell proportion contribution of blood samples from septic patients and healthy subjects. (B) Cpeb4 mRNA expression in human immune cell lineages (Haemosphere data). (C) Volcano plots showing differential expression of Smith/Abbas myeloid and lymphoid signature genes (gray) and Cpebs (colored) in septic patients vs. healthy subjects. Horizontal red dashed lines represent a pvadj of 0.05. Vertical gray dashed lines represent log2FC of –1 or 1 thresholds. (D) p-Values for Cpeb4 differential expression between septic patients and healthy subjects. Gene expression deconvolution was performed to adjust for the different estimated cell proportions between septic and healthy individuals.
Figure 1—figure supplement 2

Characterization of Cpeb4MKO mice.
(A) Bone marrow-derived macrophages (BMDMs) were obtained from wildtype or Cpeb4MKO mice. Immunoblot analysis of CPEB4 during lipopolysaccharide (LPS) stimulation. Vinculin served as loading control. (B) Percentage of mice of the indicated phenotype born from matings between Cpeb4+/+ or Cpeb4lox/lox females and a corresponding male carrying the Lyz2Cre gene (n > 47 for each genotype). (C) Total animal body weight (n > 10). (D) Normalized organ weight (n = 6). (E) Complete blood counts from wildtype or Cpeb4MKO mice (n = 6). WBC, white blood cells; LYM, lymphocytes; MID, monocytes; GRA, granulocytes; PLT, platelets; RBC, red blood cells.
Figure 2 with 3 supplements
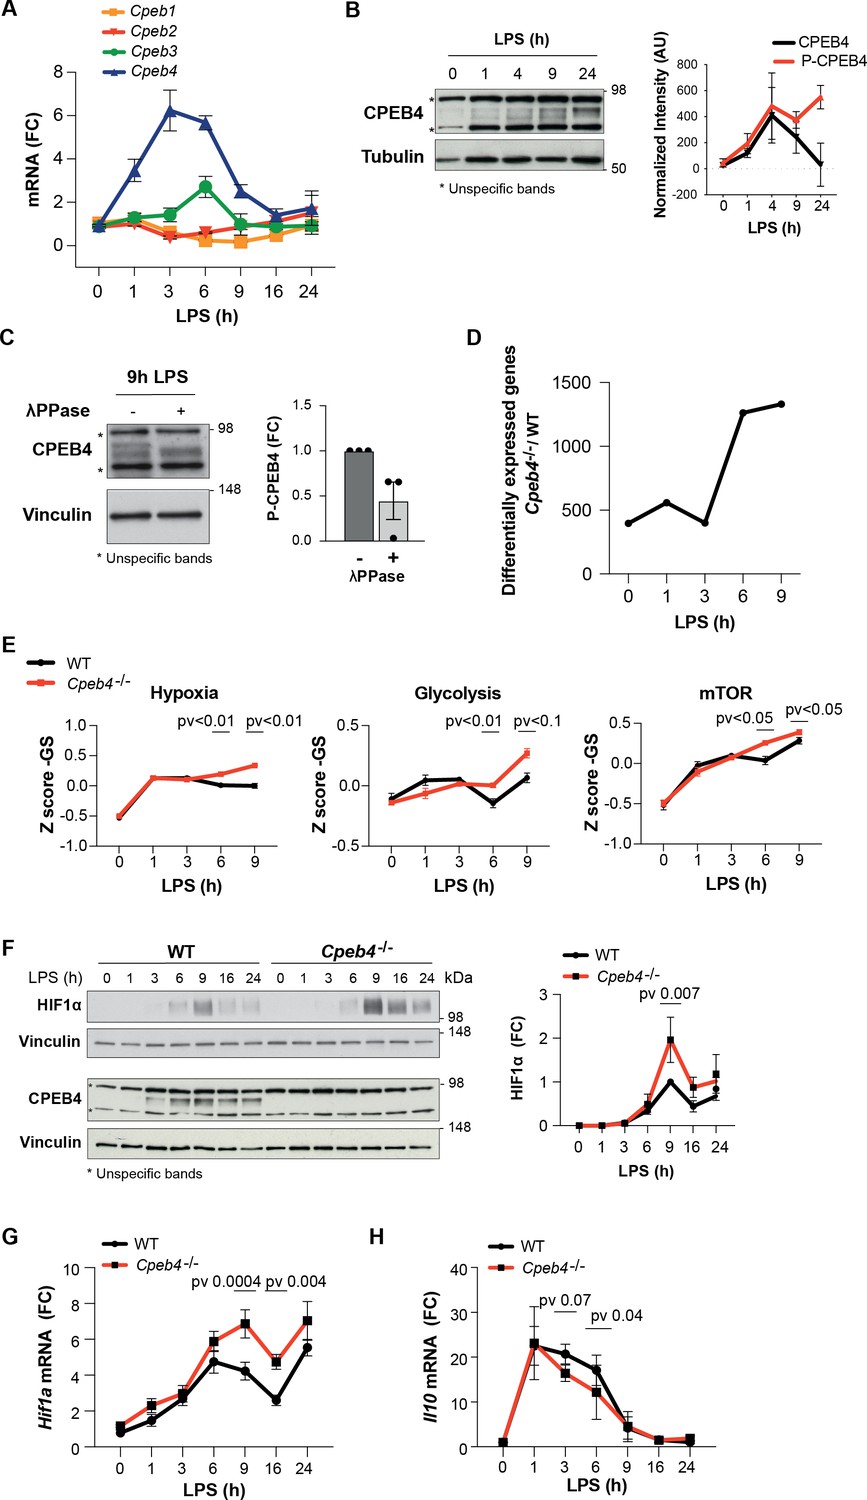
Inflammation resolution is impaired in Cpeb4–/– macrophages.
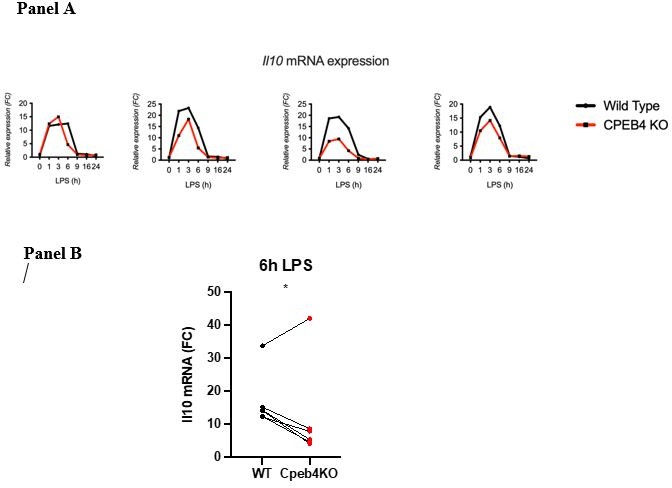
(A–C) Lipopolysaccharide (LPS)-stimulated wildtype (WT) bone marrow-derived macrophages (BMDMs). (A) Cpeb1–4 levels were measured by RT-qPCR (n = 6). (B, left) CPEB4 immunoblot, using α-tubulin as loading control. (Right) CPEB4 quantification normalized to α-tubulin (n = 3; data shown in Figure 2—figure supplement 2). (C, left) CPEB4 immunoblot in protein extracts treated with λphosphatase when indicated. (Right) Quantification of P-CPEB4 signal (n = 3). (D–H) LPS-stimulated WT and Cpeb4–/– BMDMs. (D) Number of differentially expressed genes (p<0.01) between genotypes. mRNA levels were quantified by RNAseq (n = 4). Statistics: DESeq2 R package. (E) Z-score signature of the indicated pathways. mRNA levels were quantified by RNAseq (n = 4). Statistics: rotation gene set enrichment analysis. (F, left) HIF1a and CPEB4 immunoblot, vinculin served as loading control. (Right) Normalized quantification, signal intensity was normalized to vinculin and fold change to WT at 9 hr after LPS induction was calculated (n = 3; data shown in Figure 2—figure supplement 2). (G, H) Hif1a and Il10 levels measured by RT-qPCR (n = 6). (A, G) Tbp was used to normalize. (B, C, E, F) Data are represented as mean ± SEM. (F–H) Statistics: two-way ANOVA. (D, E) See also Supplementary file 1.
-
Figure 2—source data 1
Blots corresponding to Figure 2B and Figure 2—figure supplement 1A.
- https://cdn.elifesciences.org/articles/75873/elife-75873-fig2-data1-v2.pdf
-
Figure 2—source data 2
Blots corresponding to Figure 2C.
- https://cdn.elifesciences.org/articles/75873/elife-75873-fig2-data2-v2.pdf
-
Figure 2—source data 3
Blots corresponding to Figure 2F and Figure 2—figure supplement 3A.
- https://cdn.elifesciences.org/articles/75873/elife-75873-fig2-data3-v2.pdf
Figure 2—figure supplement 1
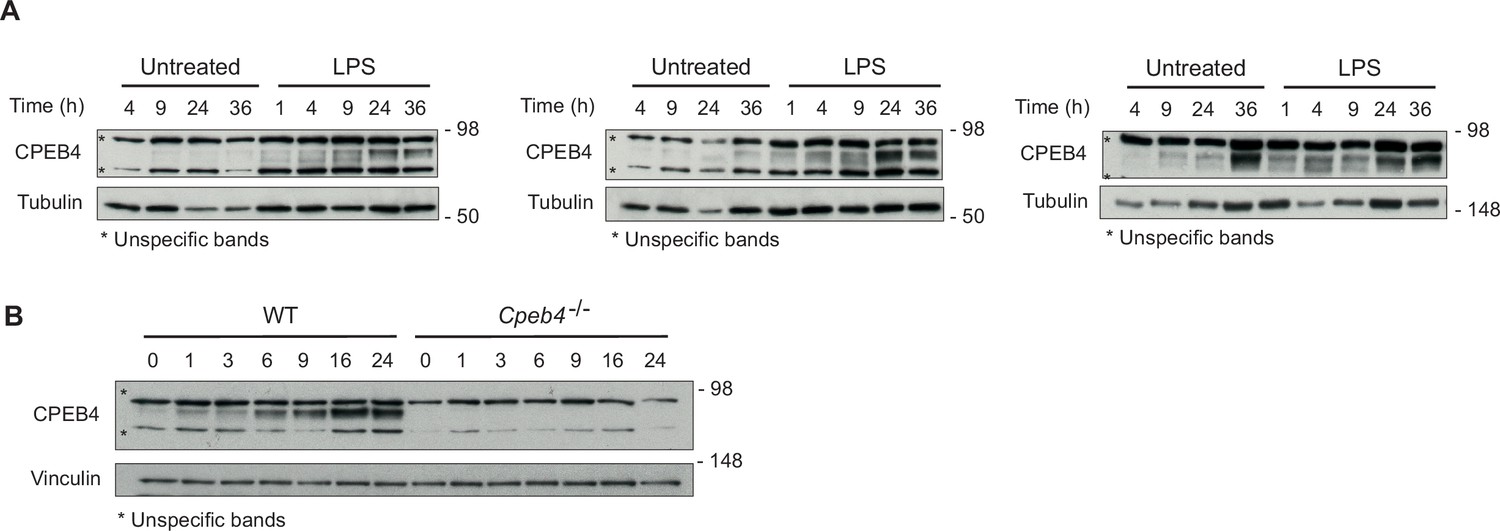
CPEB4 upregulation in lipopolysaccharide (LPS)-stimulated macrophages.
(A) Immunoblot analysis of CPEB4 in control or LPS-treated macrophages. α-Tubulin served as loading control. (B) Immunoblot analysis of CPEB4 in LPS-stimulated bone marrow-derived macrophages (BMDMs) obtained from wildtype or Cpeb4–/– mice. Vinculin served as loading control.
Figure 2—figure supplement 2
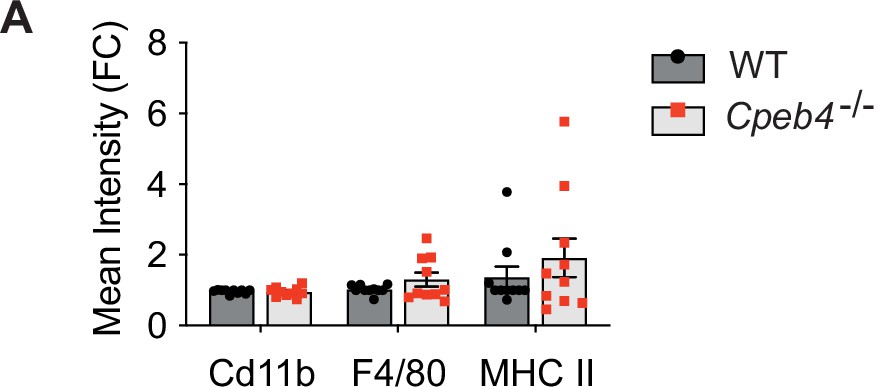
Differentiation of Cpeb4–/– bone marrow derived macrophages.
(A) Mean expression of myeloid markers in wildtype and Cpeb4–/– bone marrow-derived macrophages (BMDMs) was analyzed by flow cytometry. For each experiment, fold change to wildtype was calculated (n = 10).
Figure 2—figure supplement 3
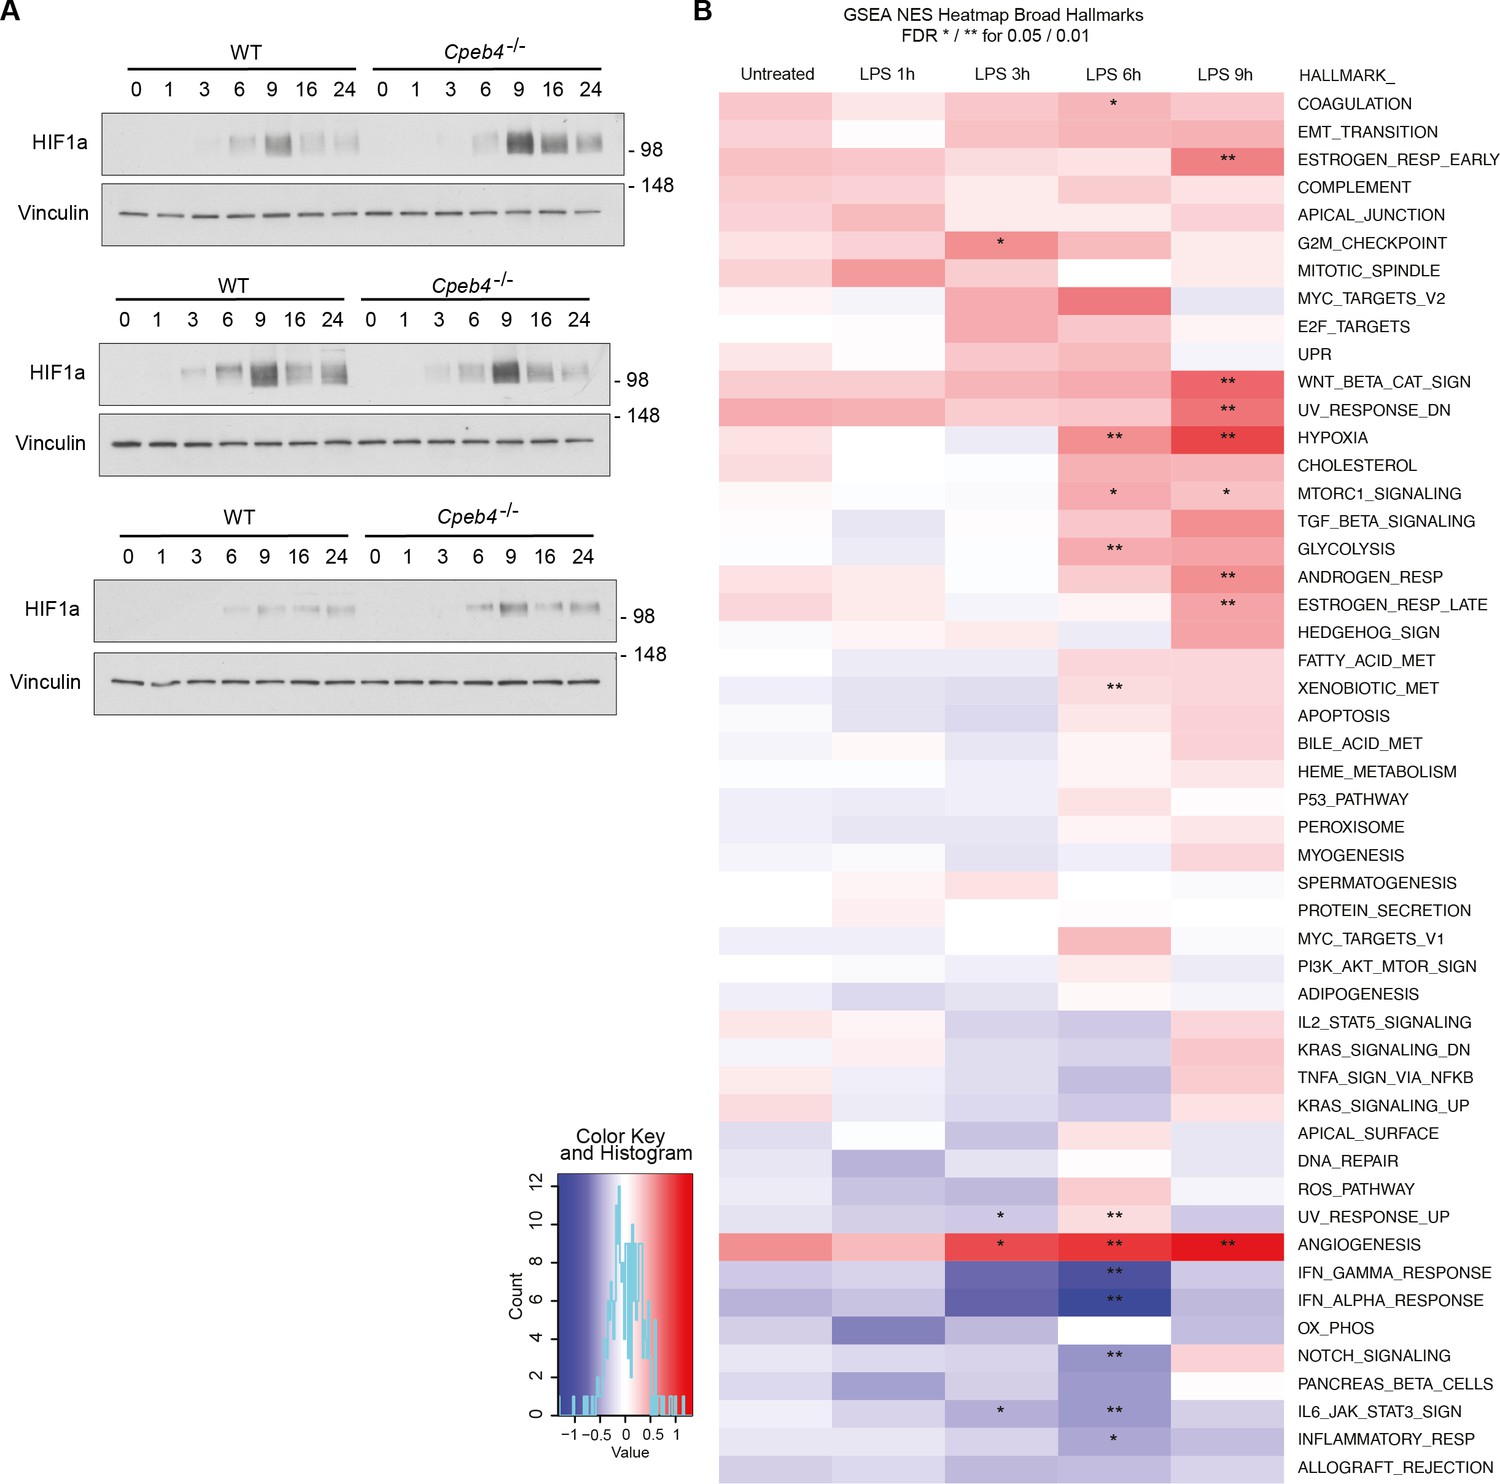
Characterization of lipopolysaccharide (LPS) response in Cpeb4–/– macrophages.
(A) Immunoblot analysis of HIF1a in LPS-stimulated bone marrow-derived macrophages (BMDMs) obtained from wildtype or Cpeb4–/– mice. Vinculin served as loading control. Quantification is shown in Figure 2E. (B) Gene set analysis of Hallmark pathways in LPS-stimulated WT and Cpeb4–/– BMDMs. Differential mRNA expression was measured by RNAseq (n = 4). Statistics: DESeq2 R package. See also Supplementary file 1.
Figure 3 with 5 supplements

The p38α-HuR-TTP axis regulates Cpeb4 mRNA stability.
(A) Cpeb4 levels in wildtype (WT) and p38αMKO bone marrow-derived macrophages (BMDMs) stimulated with lipopolysaccharide (LPS) (n = 3). (B) Cpeb4 levels in LPS-stimulated BMDMs treated with the p38α inhibitor PH-797804 (or DMSO as control) (n = 4). (C) WT or p38αMKO BMDMs were stimulated with LPS for 1 hr; Cpeb4 mRNA stability was measured after treating with actinomycin D (ActD). Statistics: paired t-test (60 min time point; n = 3). See also Figure 3—figure supplement 2. (D) Cpeb4 mRNA levels in HuR RNA-immunoprecipitates (IP) performed in WT or p38αMKO BMDMs, after LPS stimulation as indicated. IgG IPs served as control. IP/input enrichment is shown, normalized to WT IP LPS (n = 2). See also Figure 3—figure supplement 3. (E) Immunoblot of TTP protein in WT BMDMs treated with LPS for 0–9 hr. Vinculin served as loading control (n = 2). (F) Cpeb4 and Tnf decay rates in WT and TTPMKO BMDMs stimulated for 6 hr with LPS (data from Sedlyarov et al., 2016). Data represents the mean of three biological replicates. (G, H) U2OS cells were treated with tetracycline to induce the expression of a constitutively active MKK6, which induces p38α MAPK activation (Trempolec et al., 2017). (G) Cpeb4 levels upon p38α activation (+MKK6) or inhibition with SB203580 or PH-797804 (n = 3). (H) Cpeb4 levels in control or HuR-depleted U2OS cells, where p38α MAPK signaling has been activated (+MKK6) or inhibited (SB) (n = 2). See also Figure 3—figure supplement 5. (A–D, G, H) mRNA levels were quantified by RT-qPCR. Gapdh (A, B, C, G) was used to normalize. (A, B, D, G, H) Data are represented as mean ± SEM. (A, B) Statistics: two-way ANOVA. (C) Statistics: paired t-test. (G, H) Statistics: one-way ANOVA, selected pvadj are shown.
-
Figure 3—source data 1
Blots corresponding to Figure 3E.
- https://cdn.elifesciences.org/articles/75873/elife-75873-fig3-data1-v2.pdf
Figure 3—figure supplement 1
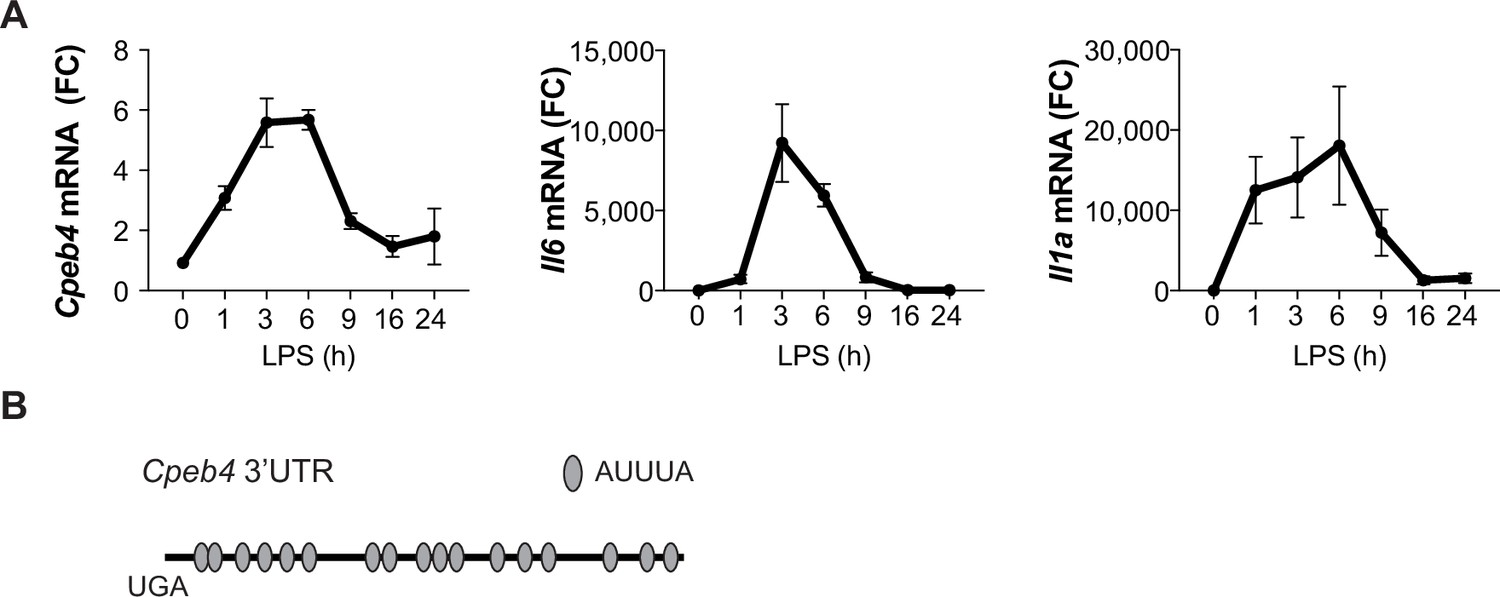
Cpeb4 mRNA as a target of the p38α-HuR-TTP axis.
(A) Bone marrow-derived macrophages (BMDMs) were stimulated with lipopolysaccharide (LPS) and mRNA levels were measured by RT-qPCR, normalizing to Tbp (n = 6). Cpeb4 mRNA values are also shown in Figure 2A. (B) Schematic representation of the Cpeb4 3’-UTR showing AU-rich element (ARE) domains.
Figure 3—figure supplement 2
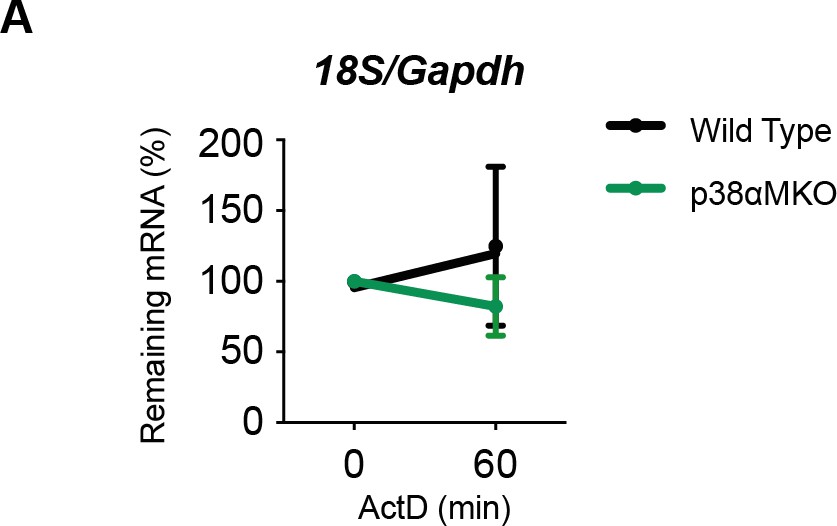
mRNA stability in wildtype (WT) and p38αMKO bone marrow-derived macrophages (BMDMs).
(A) WT or p38αMKO BMDMs were stimulated with lipopolysaccharide (LPS) for 1 hr; and mRNA stability was measured after treating with actinomycin D (ActD). mRNA levels were quantified by RT-qPCR. Gapdh was used to normalize.
Figure 3—figure supplement 3
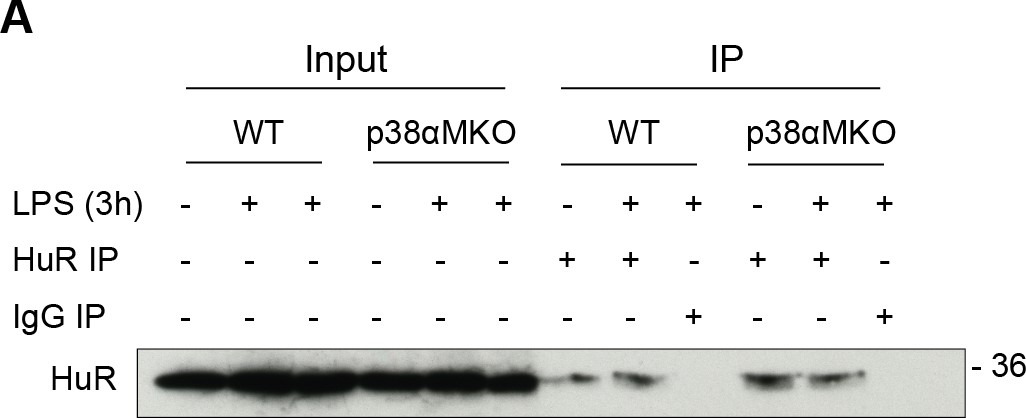
HuR Immunoprecipitation (IP) in wildtype (WT) and p38αMKO bone marrow-derived macrophages (BMDMs).
(A) HuR IP was performed in wildtype (WT) and p38αMKO BMDMs (Youssif et al., 2018) stimulated with lipopolysaccharide (LPS) for 3 hr when indicated. IgG IP was used as control.
Figure 3—figure supplement 4
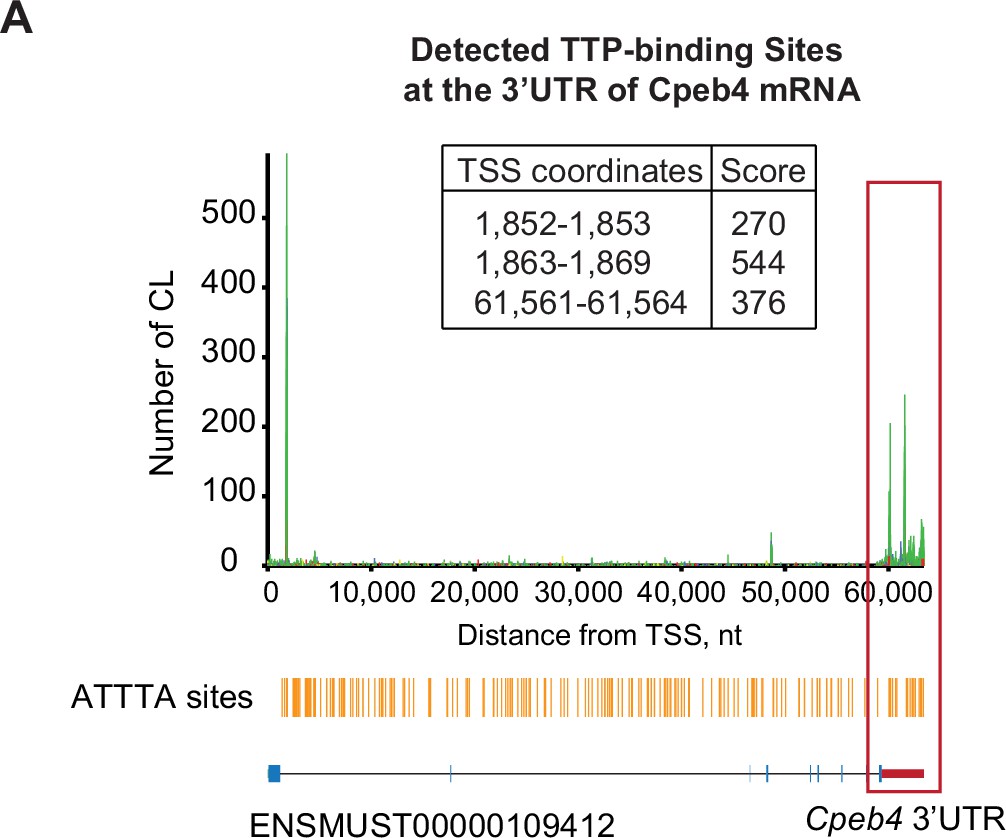
Tristetraprolin (TTP) binds Cpeb4 mRNA.
(A) TTP PAR-iCLIP was performed in bone marrow-derived macrophages (BMDMs) treated with lipopolysaccharide (LPS) for 6 hr. Coverage plots represent the number of crosslink sites (CL) detected in each position of Cpeb4 mRNA. For binding sites located in the Cpeb4 3′-UTR, distance to the transcription start site (TSS) and their scores is indicated (data from Sedlyarov et al., 2016).
Figure 3—figure supplement 5
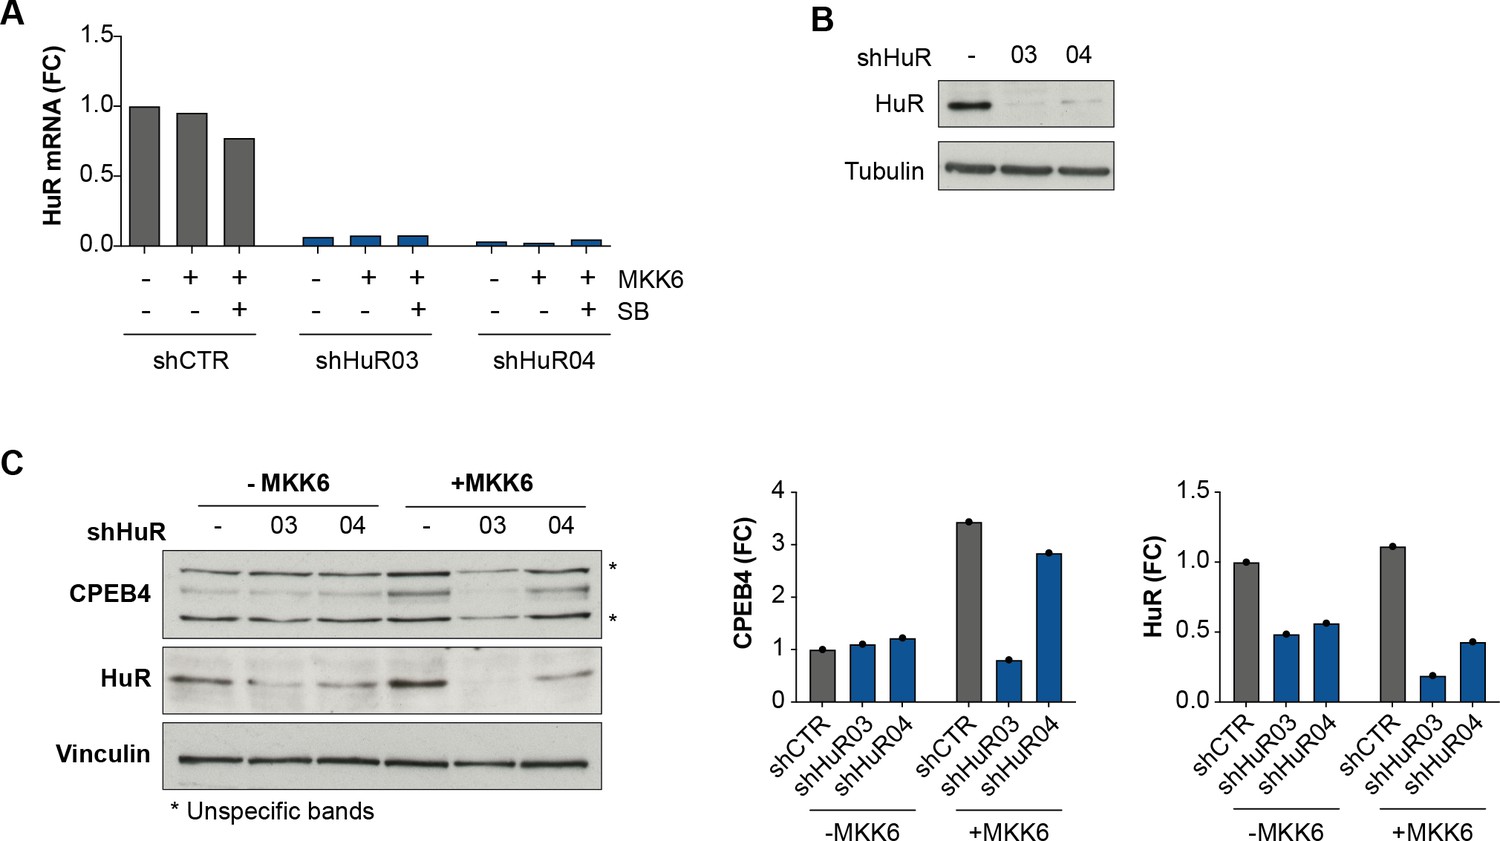
The p38α-HuR axis regulates Cpeb4 mRNA.
(A–C) U2OS cells, infected with shHuR (03, 04) or shCTR (-), were treated with tetracycline to induce the expression of a constitutively active MKK6, which induces p38α MAPK activation. (A) HuR mRNA expression was measured by RT-qPCR, normalizing to Gapdh (n = 1). (B) HuR immunoblot, vinculin served as loading control. (C) CPEB4 and HuR immunoblot after p38α MAPK activation (+MKK6) in cells infected with shHuR or shCTR. Vinculin served as loading control. Quantification is shown.
Figure 4 with 2 supplements
CPEB4 stabilizes mRNAs encoding negative feedback regulators of the lipopolysaccharide (LPS) response.
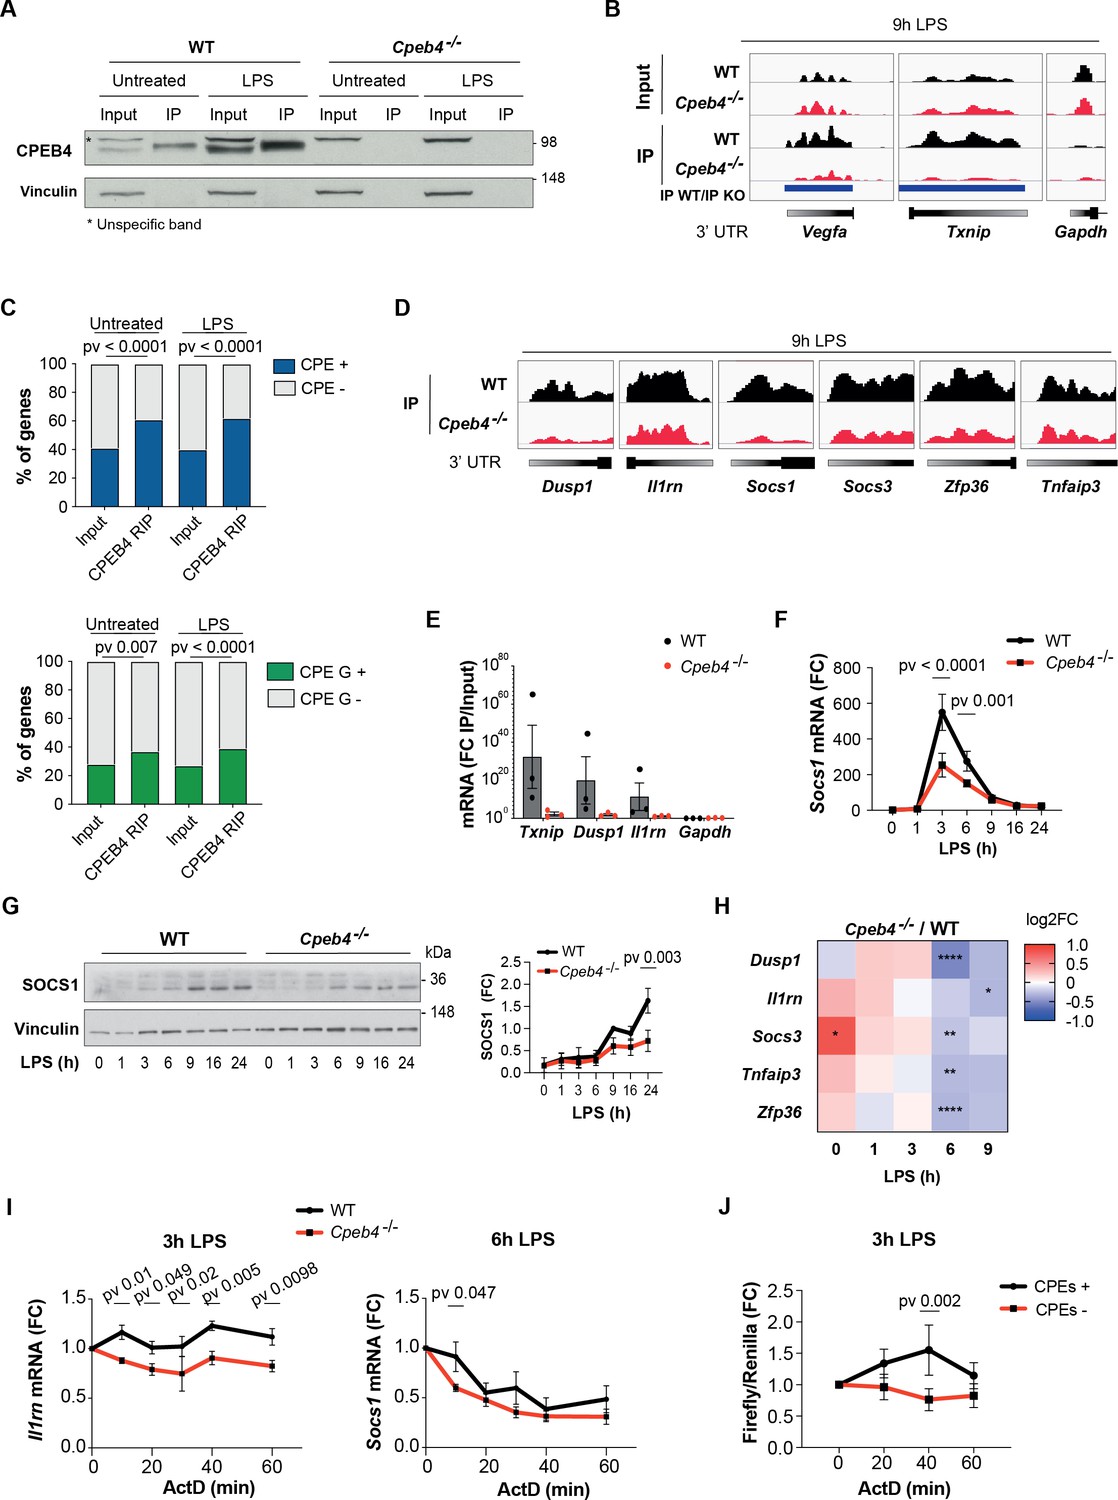
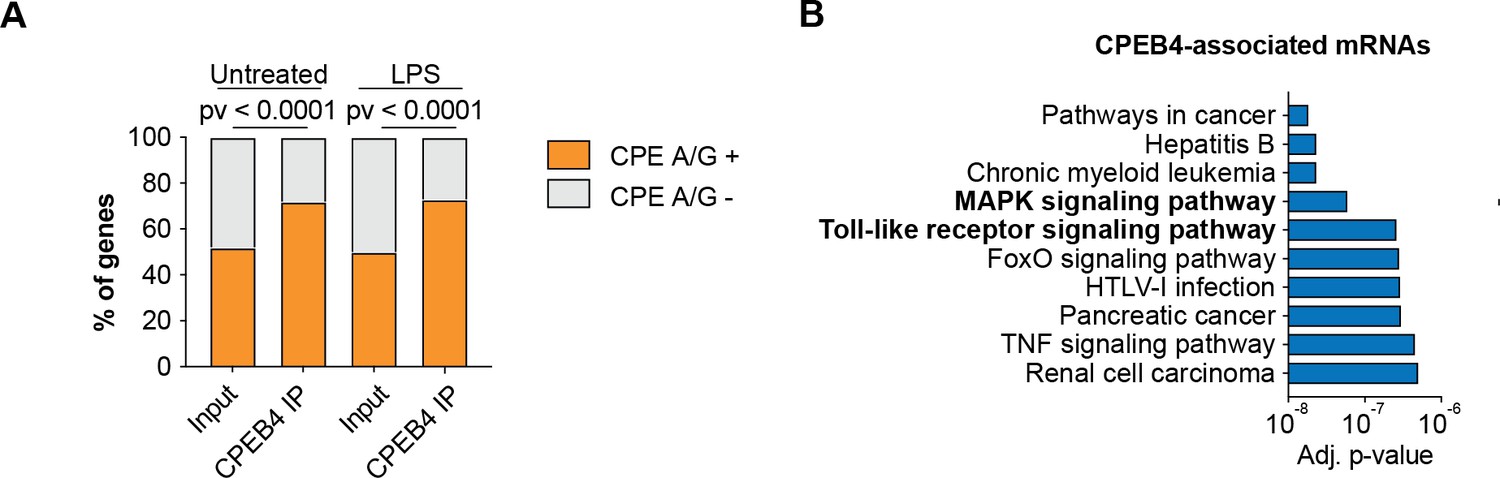
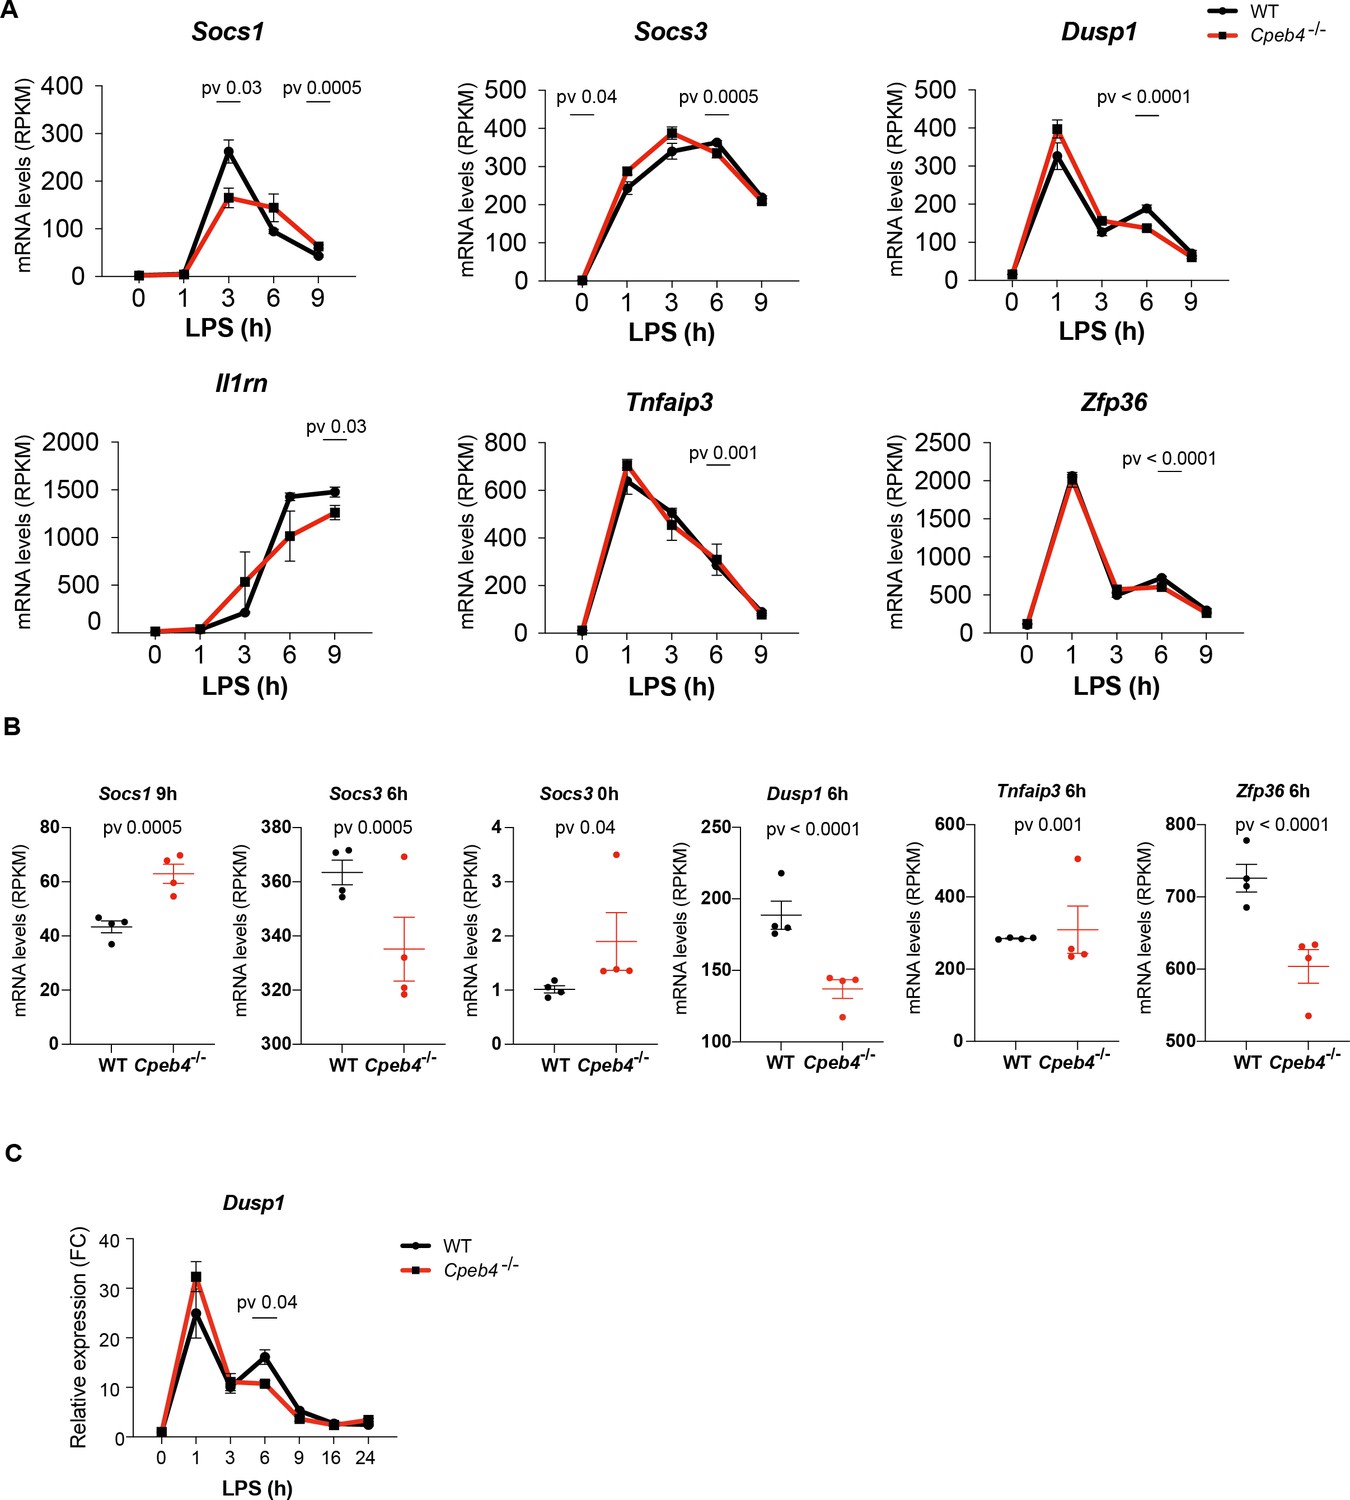
(A–D) CPEB4 RNA-Immunoprecipitation (IP) and sequencing was performed using total lysates (input) from wildtype (WT) or Cpeb4–/– bone marrow-derived macrophages (BMDMs) that had been treated or not with LPS for 9 hr (n = 1). (A) CPEB4 immunoblot, using vinculin as a loading control. (B) Examples of read coverage of input or IP of selected mRNAs. Peak enrichments between WT and Cpeb4–/– IPs are shown in blue. (C) Cytoplasmic polyadenylation element (CPE) and CPE G-containing transcripts according to Piqué et al., 2008) in input and CPEB4 IPs. The script from Piqué et al., 2008 was modified to consider TTTTGT as a CPE motif. Statistics: Fisher’s exact test. (D) Read coverage of IPs of selected mRNAs. (E) CPEB4 IP and RT-qPCR were performed for WT or Cpeb4–/– BMDMs stimulated with LPS for 9 hr. IP/input enrichment is shown (n = 3). (F) Socs1 mRNA levels in LPS-stimulated WT and Cpeb4–/– BMDMs. mRNA levels were measured by RT-qPCR normalizing to Tbp (n = 6). (G) Immunoblot of SOCS1 in WT and Cpeb4–/– BMDMs treated with LPS. Vinculin served as loading control. Quantification is shown (FC to WT, after 9 hr of LPS) (n = 3). (H) Differential expression between WT and Cpeb4–/– BMDMs treated with LPS measured by RNAseq (n = 4). Statistics: DESeq2 R package. (I) mRNA stability was measured by treating with actinomycin D (ActD) WT and Cpeb4–/– BMDMs stimulated with LPS for the indicated times. Gene expression was analyzed by RT-qPCR, normalized to Gapdh/Tbp (n = 4). (J) RAW 264.7 macrophages were transfected with a Firefly luciferase reporter under the control of the cyclin B1 3′-UTR, containing either WT (CPE+) or mutated (CPE–) CPE motifs. The same plasmid contained Renilla luciferase reporter as a control. Macrophages were stimulated with LPS for 3 hr, at which point ActD was added. mRNA levels were measured by RT-qPCR. (B, D) Integrated Genomic Viewer (IGV) images. (E–G) Data are represented as mean ± SEM. (F, G, I, J) Statistics: two-way ANOVA. See also Supplementary files 1-2.
-
Figure 4—source data 1
Blots corresponding to Figure 4A.
- https://cdn.elifesciences.org/articles/75873/elife-75873-fig4-data1-v2.pdf
-
Figure 4—source data 2
Blots corresponding to Figure 4G.
- https://cdn.elifesciences.org/articles/75873/elife-75873-fig4-data2-v2.pdf
Figure 4—figure supplement 1
Characterization of CPEB4 targets in lipopolysaccharide (LPS)-stimulated macrophages.
(A, B) CPEB4 RNA-Immunoprecipitation (IP) and sequencing was performed in total lysates (Input) from wildtype and Cpeb4 KO bone marrow-derived macrophages (BMDMs), untreated or stimulated with LPS for 9 hr (n = 1). (A) CPE-A- or CPE-G-containing transcripts in Inputs and CPEB4 IPs. Statistics with Fisher’s exact test. (B) Top 10 Gene Ontology KEGG categories enriched in CPEB4 target mRNAs in wildtype BMDMs stimulated with LPS for 9 hr. Mus musculus transcriptome was used as background. Statistics: Benjamini–Hochberg adjusted p-value is shown. See also Supplementary file 2.
Figure 4—figure supplement 2
Expression of negative feedback regulators of the lipopolysaccharide (LPS) response is impared in Cpeb4–/– bone marrow-derived macrophages (BMDMs).
(A, B) Differential expression between wildtype (WT) and bone marrow-derived macrophages (BMDMs) treated with LPS measured by RNAseq (n = 4). Statistics: DESeq2cR package (C) Dusp1 mRNA levels were measured by RT-qPCR, normalizing to Tbp.
Figure 5 with 2 supplements
The equilibrium between CPEB4/cytoplasmic polyadenylation elements (CPEs) and tristetraprolin (TTP)/AU-rich elements (AREs) defines different transcript-level patterns.
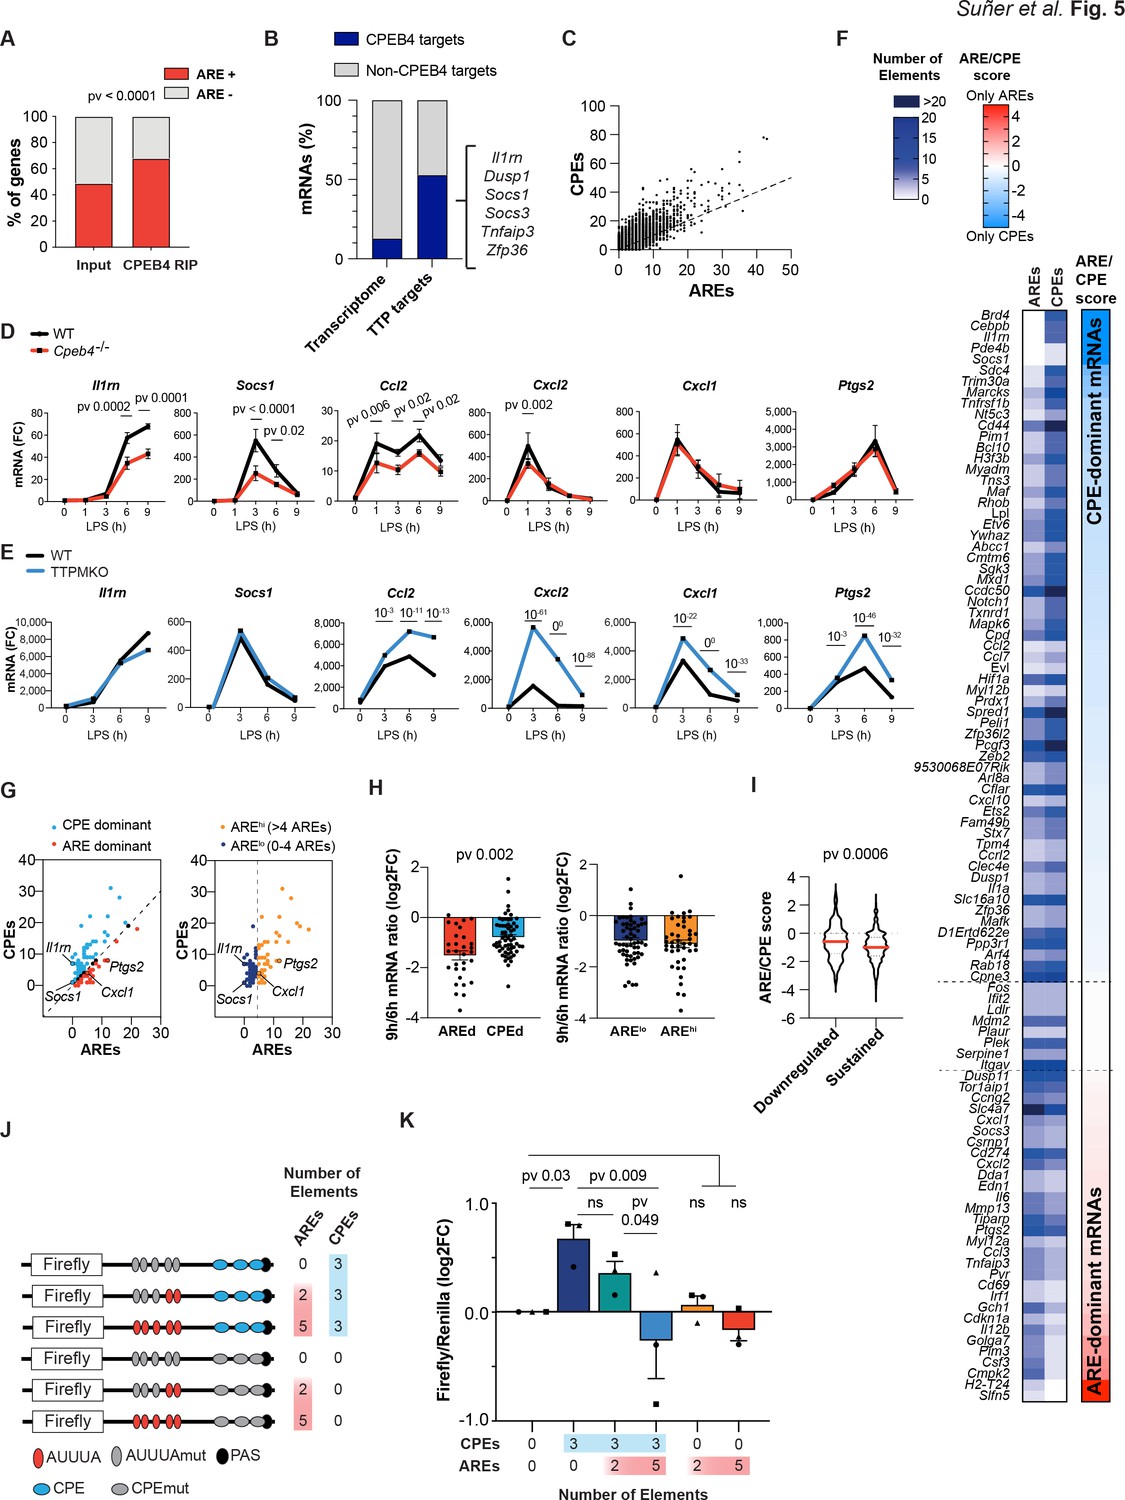
(A) ARE-containing transcripts in the input and CPEB4 immunoprecipitations (IPs) from Figure 4A–D. Statistics: Fisher’s exact test. (B) Percentage of CPEB4 targets in lipopolysaccharide (LPS)-stimulated bone marrow-derived macrophages (BMDMs) transcriptome and TTP targets in LPS-stimulated BMDMs (Sedlyarov et al., 2016). (C) Genome-wide correlation between ARE and CPE motifs in 3′-UTRs. The black line shows the linear regression trend line. R2 = 0.6364. (D) mRNA levels in wildtype (WT) and Cpeb4–/– BMDMs were measured by RT-qPCR, normalizing to Tbp (n = 6). Statistics: two-way ANOVA. Socs1 data are also shown in Figure 4F. (E) mRNA expression in WT or TTPMKO BMDMs treated with LPS. Statistics: DESeq2 software, qval is shown (data from Sedlyarov et al., 2016). (F) Common TTP and CPEB4 target mRNAs were classified according to the ARE:CPE score as ARE-dominant (ARE-d; red; 30 mRNAs) or CPE-dominant (CPE-d; blue; 61 mRNAs) (see also Figure 5—figure supplement 1). (G) CPEB4 and TTP target mRNAs were plotted according to the number of AREs and CPEs in the 3′-UTR. (Left) The dashed line separates ARE-d and CPE-d mRNAs. (Right) mRNAs were classified according to only the number of AREs in their 3'-UTR. The dashed line separates AREhigh (>4 AREs; yellow; 43 mRNAs) from ARElow (≤4 AREs; navy; 56 mRNAs) mRNAs. (H, I) WT BMDMs were stimulated with LPS and mRNA levels were quantified by RNAseq (n = 4). (H) Common CPEB4 and TTP target mRNAs were classified as AREd/CPEd (left) or AREhigh/ARElow (right). For each mRNA, the levels after 9 hr of LPS treatment were normalized by its expression at 6 hr LPS. (I) 1521 CPE- and ARE-containing mRNAs were classified as sustained >0.5 (1319 mRNAs) or downregulated <0.5 (202 mRNAs) according to their expression after 9 hr of LPS treatment, after normalizing to the peak of expression throughout the LPS response. For each mRNA, the ARE:CPE score was calculated. (J, K) RAW 264.7 macrophages were transfected with a Firefly luciferase reporter under the control of a chimeric 3′-UTR combining Ier3 and cyclin B1 AREs and CPEs motifs, respectively. Inactivating specific CPE or ARE motifs, six different 3′-UTRs with distinct ARE:CPE scores were generated. The same plasmid contained Renilla luciferase reporter as a control. (J) Scheme of the six constructs used for the dual luciferase reporter assay. Inactivated motifs are shown in gray. (K) RAW 264.7 macrophages were stimulated with LPS for 6 hr and Firefly/Renilla levels were measured by RT-qPCR. Values were normalized to the 0AREs/0CPEs construct. Statistics: one-way ANOVA Friedman test. All significant differences are shown except 5AREs/0CPEs vs. 0AREs/3CPEs (**) and 2AREs/3CPEs (*). (D, H, K) Data are represented as mean ± SEM. (H, I) Statistics: Mann–Whitney t-test. See also Supplementary files 2-6.
Figure 5—figure supplement 1
The equilibrium between CPEB4/cytoplasmic polyadenylation elements (CPEs) and tristetraprolin (TTP)/AU-rich elements (AREs) defines mRNA oscillation patterns.
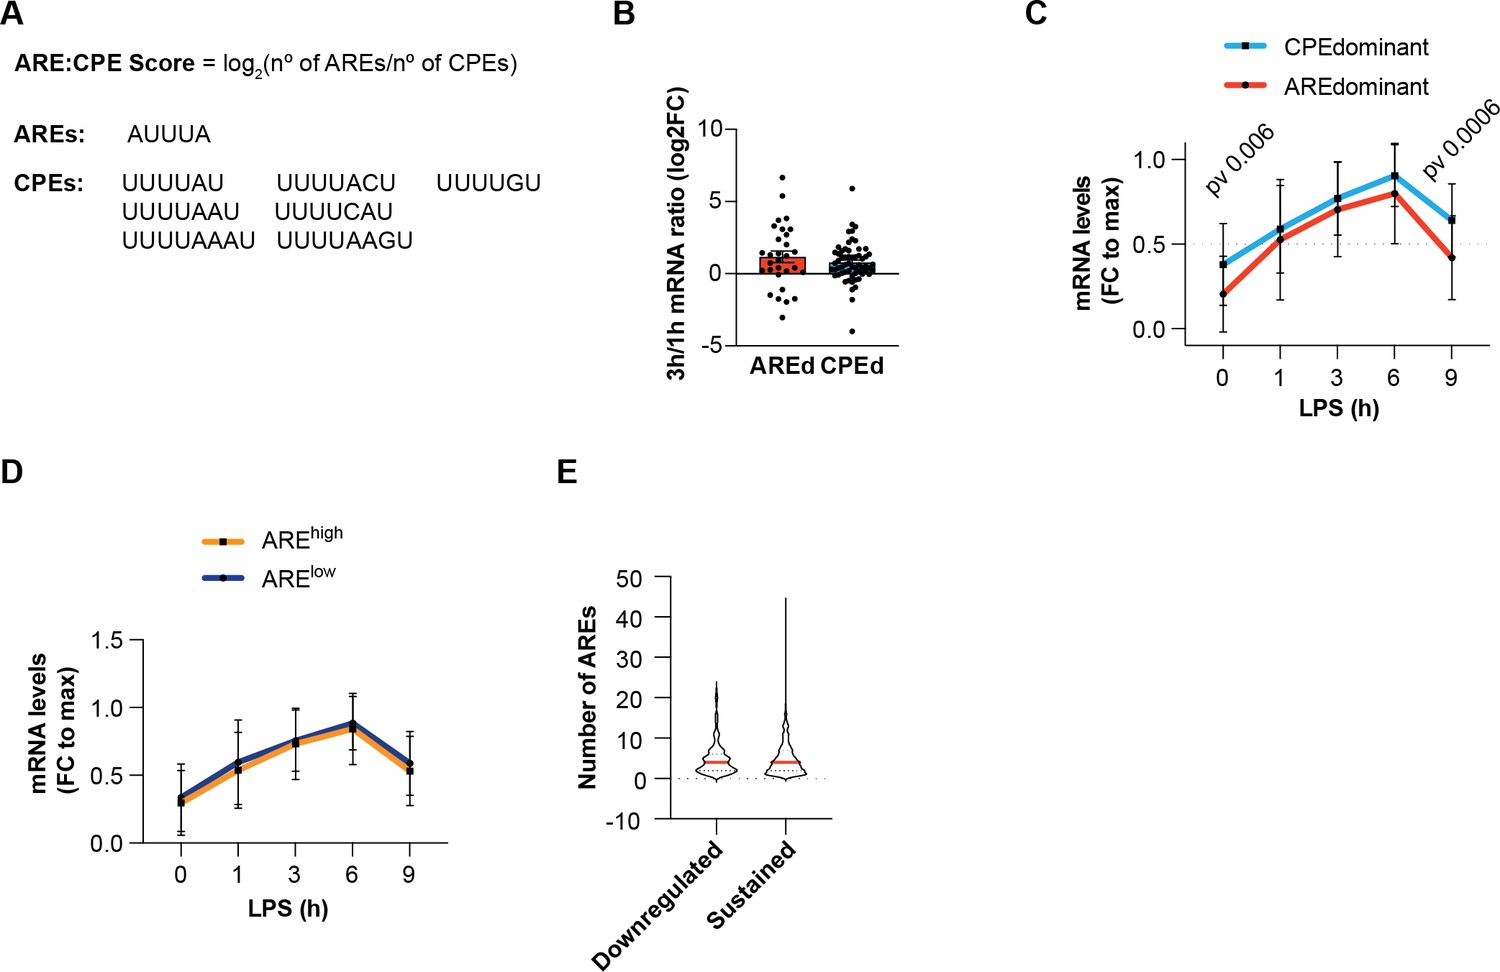
(A) ARE/CPE score definition. ARE and CPE motifs used to calculate the score are specified. (B–E) Wildtype bone marrow-derived macrophages (BMDMs) were treated with lipopolysaccharide (LPS) and mRNA levels were quantified by RNAseq (n = 4). (B–D) Common TTP and CPEB4 target mRNAs were considered. (B) ARE-dominant (AREd, red) and CPE-dominant (CPEd, blue) mRNA levels after 3 hr of LPS stimulation, normalized for its expression at 1 hr. Statistics: Mann–Whitney t-test. (C) Mean expression profile of CPEd and AREd mRNAs in LPS-stimulated BMDMs. For each mRNA, values were normalized to its peak of expression. Statistics: two-way ANOVA. (D) Mean mRNA expression profile of AREhigh and ARElow mRNAs in LPS-stimulated BMDMs. For each mRNA, values were normalized to its peak of expression. (E) 1521 CPE- and ARE-containing mRNAs were classified as sustained >0.5 or downregulated <0.5, on the basis of their expression after 9 hr of LPS treatment, normalized by their peak of expression during the LPS response. For each mRNA, the number of AREs in its 3’-UTR was calculated. (B) Data are represented as mean ± SEM. (C, D) Data are represented as mean ± SD. See also Supplementary files 2-6.
Figure 5—figure supplement 2
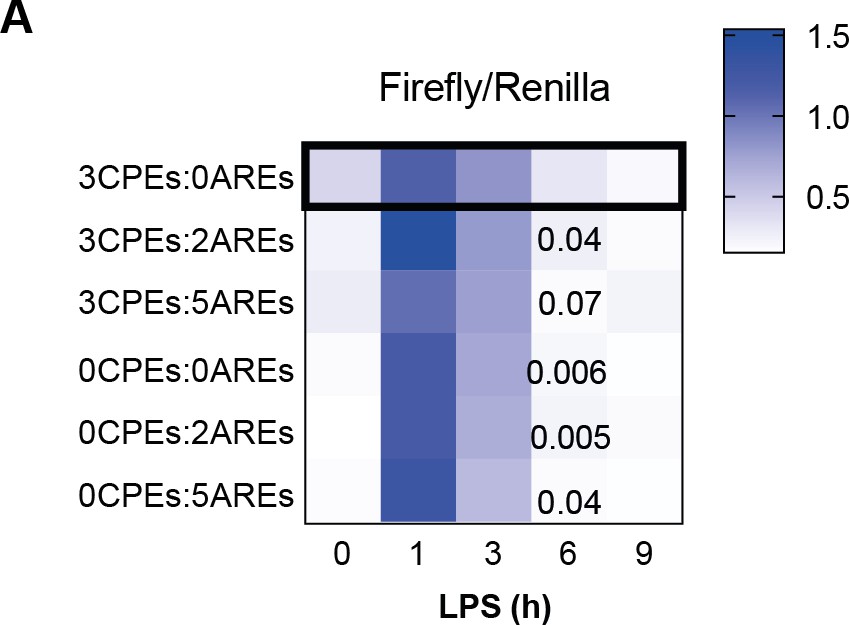
Expression of mRNAs with distinct AU-rich element (ARE)/cytoplasmic polyadenylation element (CPE) score in lipopolysaccharide (LPS)-stimulated macrophages.
(A) RAW 264.7 macrophages were transfected with a Firefly/Renilla luciferase reporter under the control of six different 3’-UTR with distinct ARE/CPE scores (see Figure 5J and K). Then, macrophages were stimulated with LPS and mRNA expression was analyzed by RT-qPCR. Heatmap shows the Firefly/Renilla expression ratio. Statistics: two-way ANOVA vs. 3CPEs/0AREs.
Figure 6 with 1 supplement
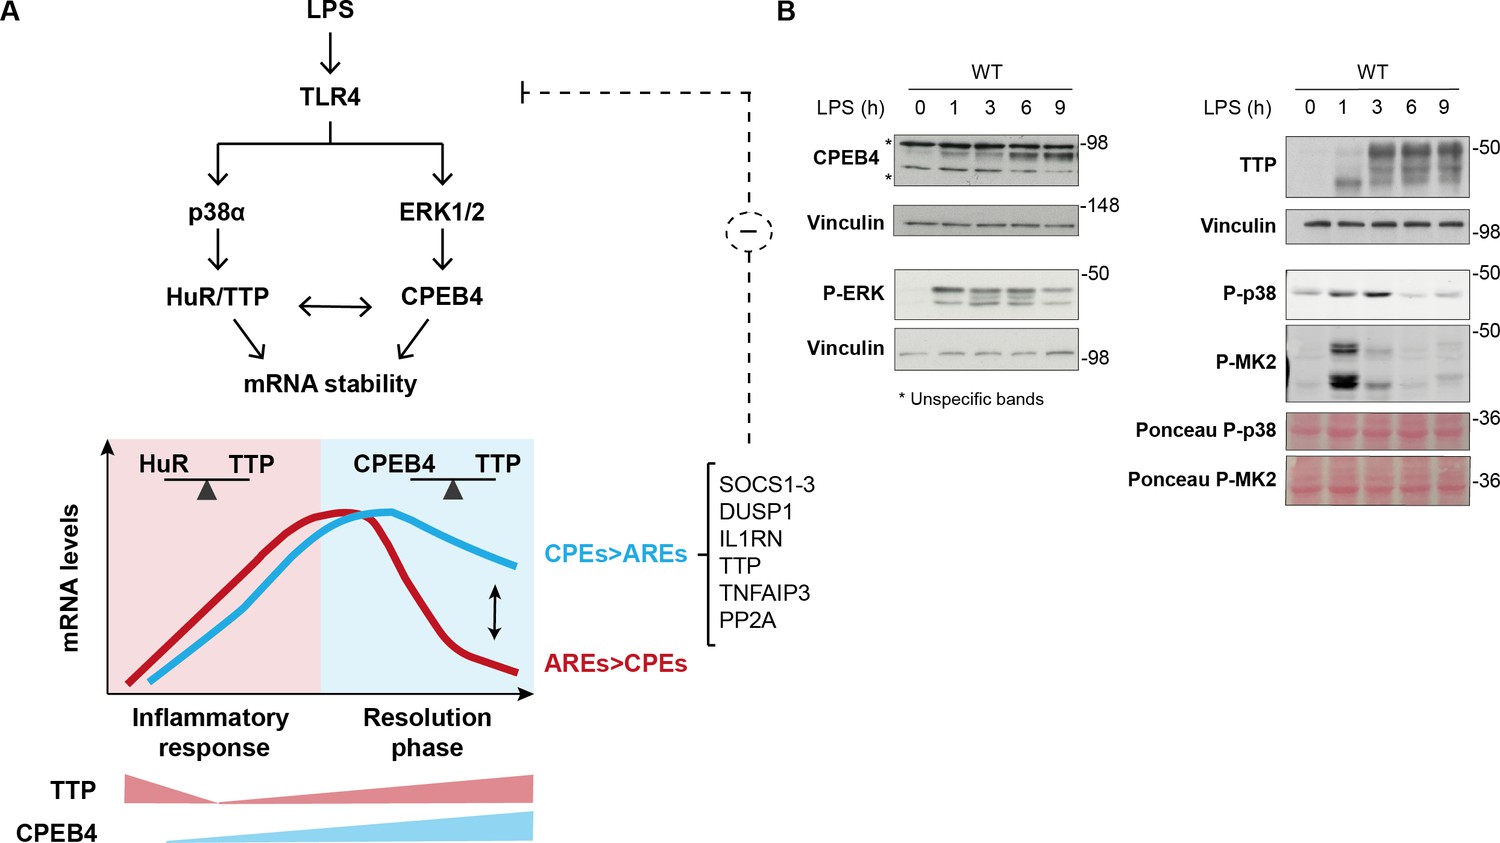
Dynamic equilibrium between tristetraprolin (TTP)- and CPEB4-mediated regulation of mRNAs during inflammation resolution.
(A) Lipopolysaccharide (LPS) stimulates the MAPK signaling cascades downstream of TLR4. p38α controls TTP phosphorylation, causing a shift in the competitive binding equilibrium between Hu-antigen R (HuR) and tristetraprolin (TTP) towards HuR, which stabilizes AU-rich element (ARE)-containing mRNAs. The p38α/HuR/TTP axis also regulates Cpeb4 mRNA stability and promotes CPEB4 expression during the late phase of the LPS response. CPEB4 then accumulates in its active state, which involves phosphorylation by ERK1/2 MAPK signaling. During the resolutive phase of the LPS response, CPEB4 and TTP compete to stabilize/destabilize mRNAs containing cytoplasmic polyadenylation elements (CPEs) and AREs. The equilibrium between these positive and negative cis-acting elements in the mRNA 3′-UTRs generates customized temporal expression profiles. CPEB4 stabilizes CPE-dominant mRNAs, which are enriched in transcripts encoding negative regulators of MAPKs that contribute to inflammation resolution. (B) Immunoblot of the indicated proteins in wildtype (WT) BMDMs treated with LPS for 0–9 hr. Vinculin and Ponceau staining served as loading control.
-
Figure 6—source data 1
Blots corresponding to Figure 6B.
- https://cdn.elifesciences.org/articles/75873/elife-75873-fig6-data1-v2.pdf
Figure 6—figure supplement 1
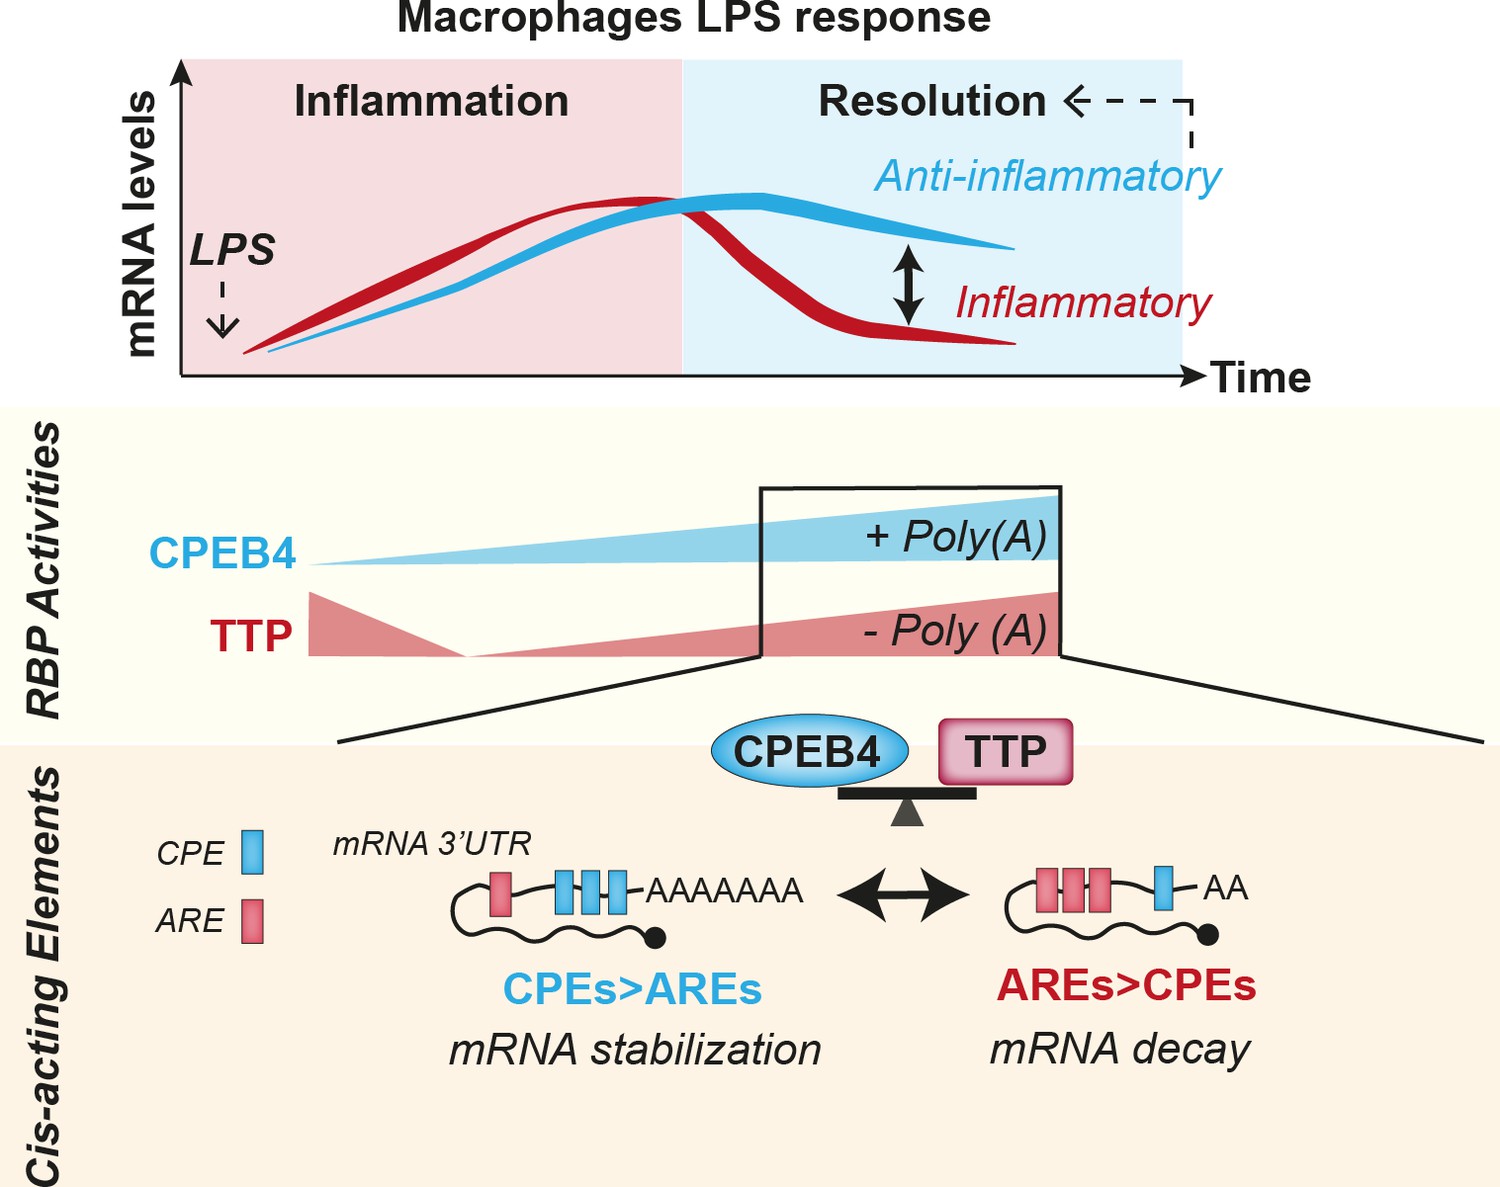
Graphical abstract.
In macrophages, during the resolution phase of the LPS-triggered inflammatory response, the activities of CPEB4 and TTP compete to stabilize and destabilize CPE- and ARE-containing mRNAs, respectively. The balance between the number of CPEs and AREs in the 3'UTR of mRNAs generates distinct expression patterns: while ARE-dominant mRNAs are destabilized and downregulated (red), CPE-dominant mRNAs are stabilized and their expression is sustained (blue). Both the downregulation inflammatory AREd mRNAs, and the stabilization of CPEd mRNAs encoding for anti-inflammatory signalling molecules, is required to limit the extent of the inflammatory response.
Author response image 1
Additional files
-
Supplementary file 1
RNAseq wildtype_vs_Cpeb4 KO bone marrow-derived macrophages (BMDMs).
Wildtype and Cpeb4 KO BMDMs were stimulated with lipopolysaccharide (LPS) and mRNA levels were quantified by RNAseq (n = 4). Differential expression between genotype conditions was performed with DESeq2 R package. Wildtype and Cpeb4 KO samples were compared for each time point independently. Sample information, alignment statistics, and principal component analysis are shown.
- https://cdn.elifesciences.org/articles/75873/elife-75873-supp1-v2.xlsx
-
Supplementary file 2
RIPseq-defined CPEB4 target mRNAs.
Wildtype and Cpeb4 KO bone marrow-derived macrophages (BMDMs) were left untreated or stimulated with lipopolysaccharide (LPS) for 9 hr. Immunoprecipitation (IP) with anti-CPEB4 antibody was then performed, and RNA was extracted and analyzed by RNAseq. CPEB4 targets were defined based on the enrichment between wildtype and Cpeb4 KO IPs.
- https://cdn.elifesciences.org/articles/75873/elife-75873-supp2-v2.xlsx
-
Supplementary file 3
Genome-wide AU-rich elements (AREs), cytoplasmic polyadenylation elements (CPEs), and ARE/CPE score.
For each gene, the reference sequence of the longest 3′-UTR was selected. The number of AREs and CPEs was calculated by scanning the corresponding 3′-UTR and counting the number of occurrences of each motif. The ARE/CPE score was calculated as the log2 transformed ratio between the number of ARE and CPE motifs.
- https://cdn.elifesciences.org/articles/75873/elife-75873-supp3-v2.xlsx
-
Supplementary file 4
Tristetraprolin (TTP) and Hu-antigen R (HuR) target mRNAs.
Data were obtained from TTP and HuR PAR-iCLIP experiments in lipopolysaccharide (LPS)-stimulated bone marrow-derived macrophages (BMDMs) (Sedlyarov et al., 2016). Only mRNAs with HuR/TTP binding in the 3′-UTR were considered. For TTP, mRNAs bound after 3 hr or 6 hr of LPS stimulation were considered. For HuR-bound mRNAs, PAR-iCLIP data corresponded to 6 hr of LPS stimulation.
- https://cdn.elifesciences.org/articles/75873/elife-75873-supp4-v2.xlsx
-
Supplementary file 5
RNAseq wildtype bone marrow-derived macrophages (BMDMs).
Wildtype BMDMs were stimulated with lipopolysaccharide (LPS), and mRNA levels were quantified by RNAseq (n = 4). Wildtype and Cpeb4 KO samples were compared for each time point independently. The expression pattern over time for wildtype samples was analyzed (differential expression results against consecutive time points and Rlog data normalized by maximum).
- https://cdn.elifesciences.org/articles/75873/elife-75873-supp5-v2.xlsx
-
Supplementary file 6
AU-rich element (ARE)- and cytoplasmic polyadenylation element (CPE)-containing mRNAs.
ARE- and CPE-containing mRNAs were defined as all mRNAs regulated by CPEB4, tristetraprolin (TTP), or Hu-antigen R (HuR) in lipopolysaccharide (LPS)-stimulated bone marrow-derived macrophages (BMDMs) (see also Supplementary files 2 and 4).
- https://cdn.elifesciences.org/articles/75873/elife-75873-supp6-v2.xlsx
-
Supplementary file 7
Primers used for RT-qPCR analysis.
- https://cdn.elifesciences.org/articles/75873/elife-75873-supp7-v2.xlsx
-
Supplementary file 8
Constructs.
- https://cdn.elifesciences.org/articles/75873/elife-75873-supp8-v2.xlsx
-
Supplementary file 9
Scripts for CPE-A and CPE-G.
To analyze CPE-A-containing mRNAs, the script developed by Piqué et al. was run over mm10 3′-UTR reference sequences (Biomart ENSEMBL archive February 2014). mRNAs containing a putative 3′-UTR with a cytoplasmic polyadenylation element (CPE)-mediated repression and/or activation prediction were considered CPE-containing mRNAs. For CPE-G-containing mRNAs, the same script was adapted to mRNAs containing a putative 3′-UTR with the TTTTGT motif within the optimal distances to the polyadenylation signal (PAS) established by Piqué et al., 2008.The original and modified script, as well as the input and output files of the CPE-A and CPE-G analysis, are included.
- https://cdn.elifesciences.org/articles/75873/elife-75873-supp9-v2.zip
-
Transparent reporting form
- https://cdn.elifesciences.org/articles/75873/elife-75873-transrepform1-v2.pdf
Download links
A two-part list of links to download the article, or parts of the article, in various formats.
Downloads (link to download the article as PDF)
Open citations (links to open the citations from this article in various online reference manager services)
Cite this article (links to download the citations from this article in formats compatible with various reference manager tools)
Macrophage inflammation resolution requires CPEB4-directed offsetting of mRNA degradation
eLife 11:e75873.
https://doi.org/10.7554/eLife.75873


