Investigating the relationship of COVID-19 related stress and media consumption with schizotypy, depression, and anxiety in cross-sectional surveys repeated throughout the pandemic in Germany and the UK
- Department of Diagnostic and Interventional Neuroradiology, School of Medicine, Technical University of Munich, Germany
- Department of Anaesthesiology and Intensive Care Medicine, Ludwig‐Maximilians‐Universität München, Germany
- Institute for Medical Information Processing, Biometry and Epidemiology, Ludwig-Maximilians‐Universität München, Germany
- Department of Psychiatry, University of Cambridge, United Kingdom
- Cambridgeshire and Peterborough NHS Foundation Trust, United Kingdom
Figures
Figure 1
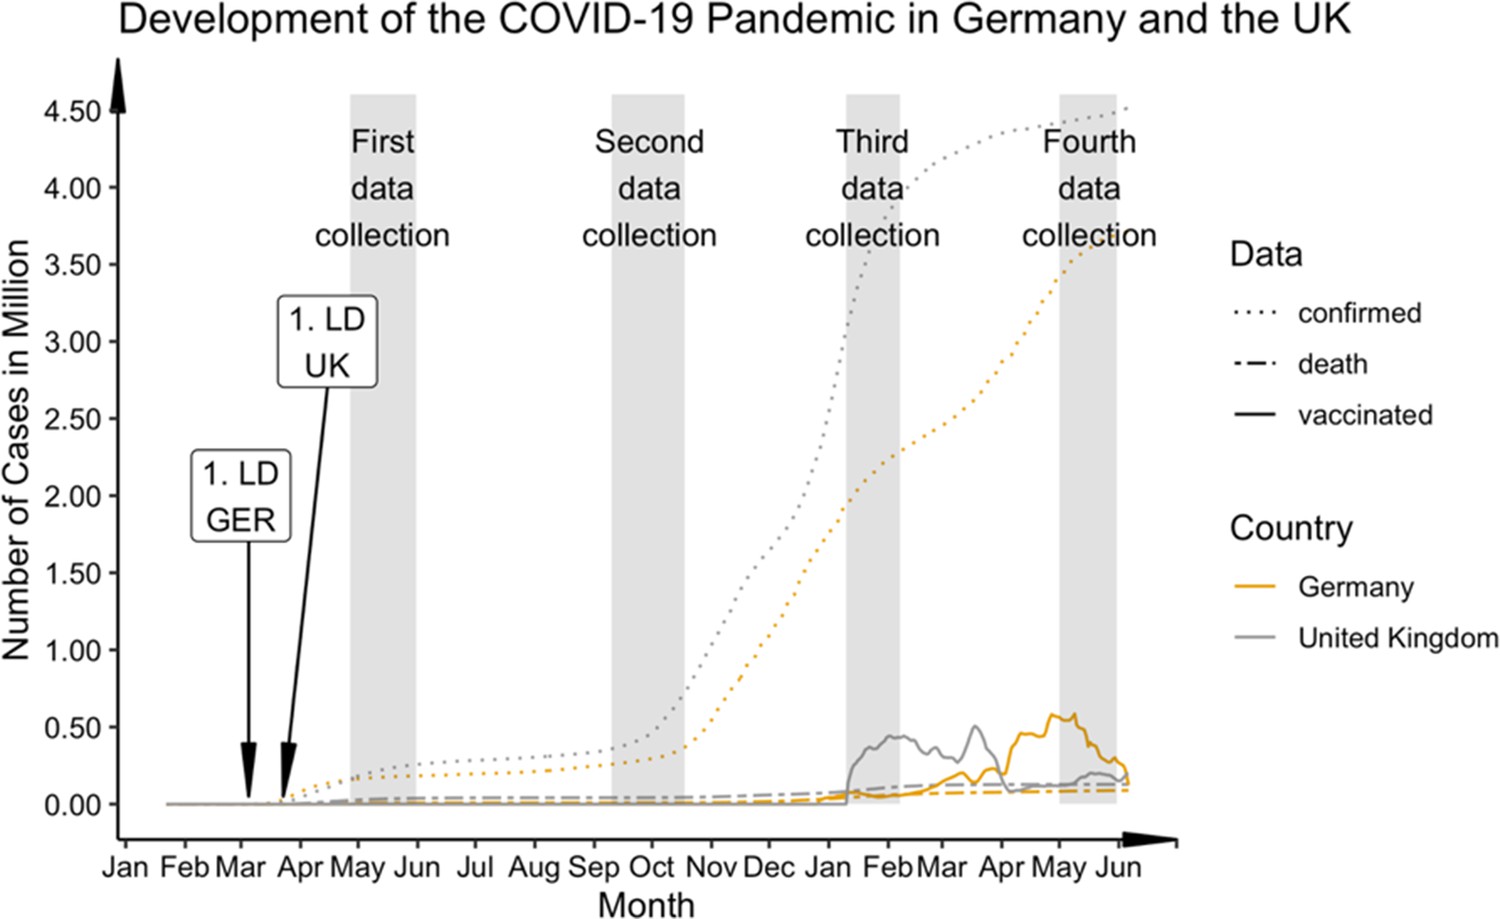
Progression of COVID-19 cases, deaths, and vaccine rate (first dose) in comparison between Germany and the UK from January 2020 to June 2021.
Germany: 1. State-wise lockdown (LD) on 16 March 2020; UK: 1. National LD on 23 March 2020. Numbers of vaccinations averaged over the week. Data (cases and deaths) taken from the 2019 Novel CoronaVirus CoViD (2019-nCoV) data repository by Johns Hopkins University Center for Systems Science and Engineering (JHU CSSE). Data for UK vaccination rate taken from GOV.UK Coronavirus in the UK (https://coronavirus.data.gov.uk/details/vaccinations) and for the German vaccination rate from Impfdashboard (https://impfdashboard.de/daten). The grey bars mark the time sections of data collection in the present study.
Figure 2
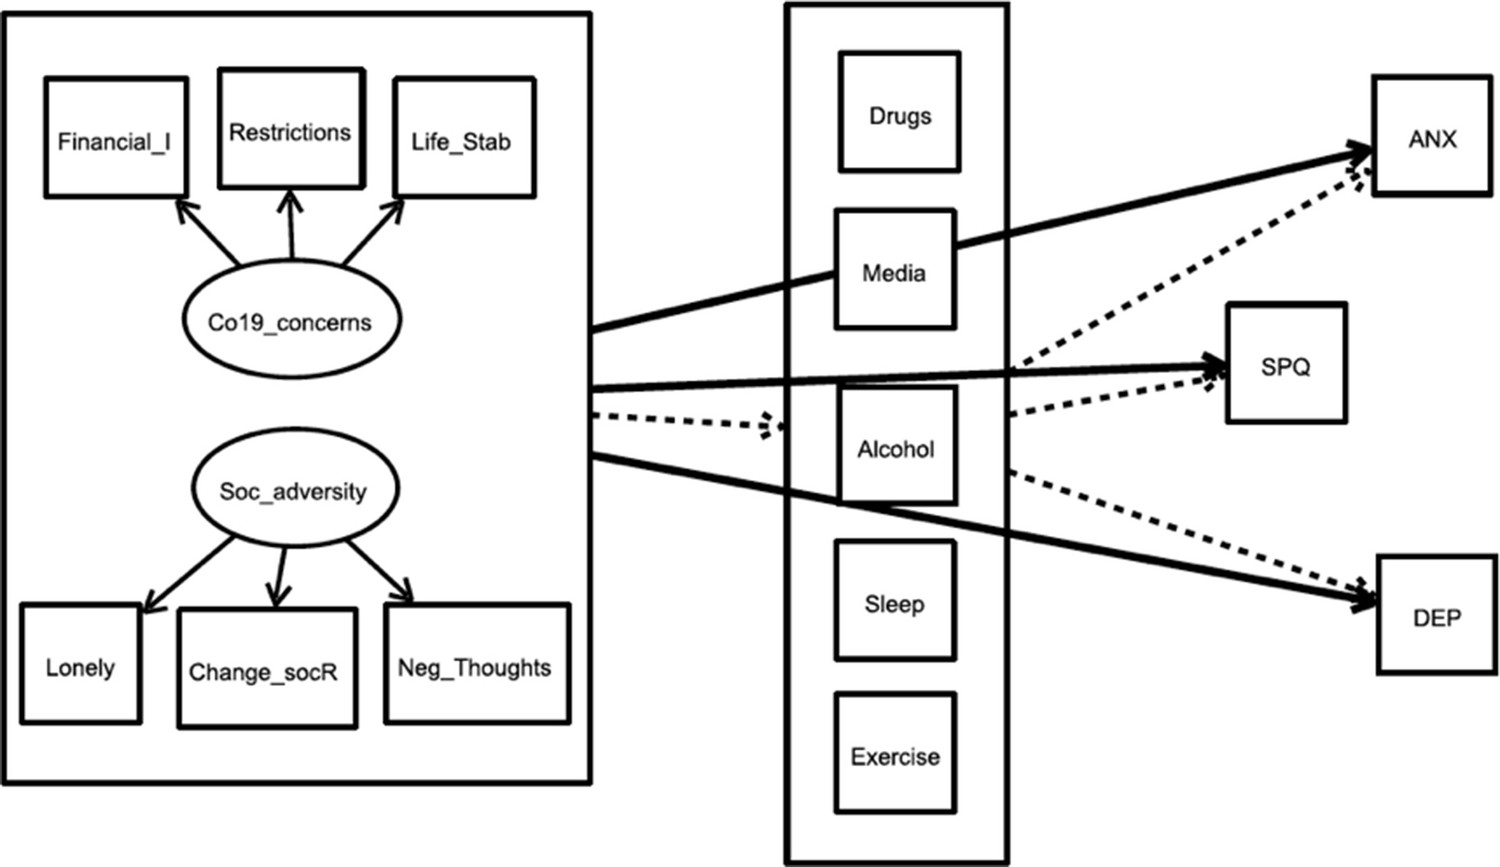
Overview of the complete theoretical model for the influence of ‘social adversity’ and ‘COVID-19 related life concerns’ directly on mental health scores and indirectly via healthy and harmful behaviour variables.
The same model was calculated separately for the two exogeneous variables (‘predictors’, left large box) for all four time points. The bold arrows indicate the direct pathways to the three endogenous variables (‘outcomes’). The dashed arrows indicate the indirect pathways from predictor to outcomes via the five mediators (box in the middle). Co19_concerns: COVID-19 related life concerns; Soc_adversity: social adversity; financial_I: financial impact due to the crisis; Restrictions: Perception of the restrictions as stressful; Life_Stability: Concerns about life stability due to the crisis; Change_socR: stressful social relationship changes; Neg_Thoughts: Negative Thoughts during COVID 19; ANX: anxiety symptoms; DEP: depressive Symptoms, SPQ: total sum scores of SPQ.
Figure 3

Boxplot of (A) Schizotypal Personality Questionnaire (SPQ), (B) anxiety scores (SCL-27) and (C) depression scores (SCL-27) separately for four time point samples.
The colored dots represent the means of the distributions, the boxplot the median (middle line in the box), the lower and upper quartiles (edges of the box), the area where 95% of the distribution lies (vertical lines), and the outliers (black dots). The respective sample sizes are April-May sample N = 781, September – October sample N = 498, January – February sample N = 544, May sample N = 486.
Figure 4
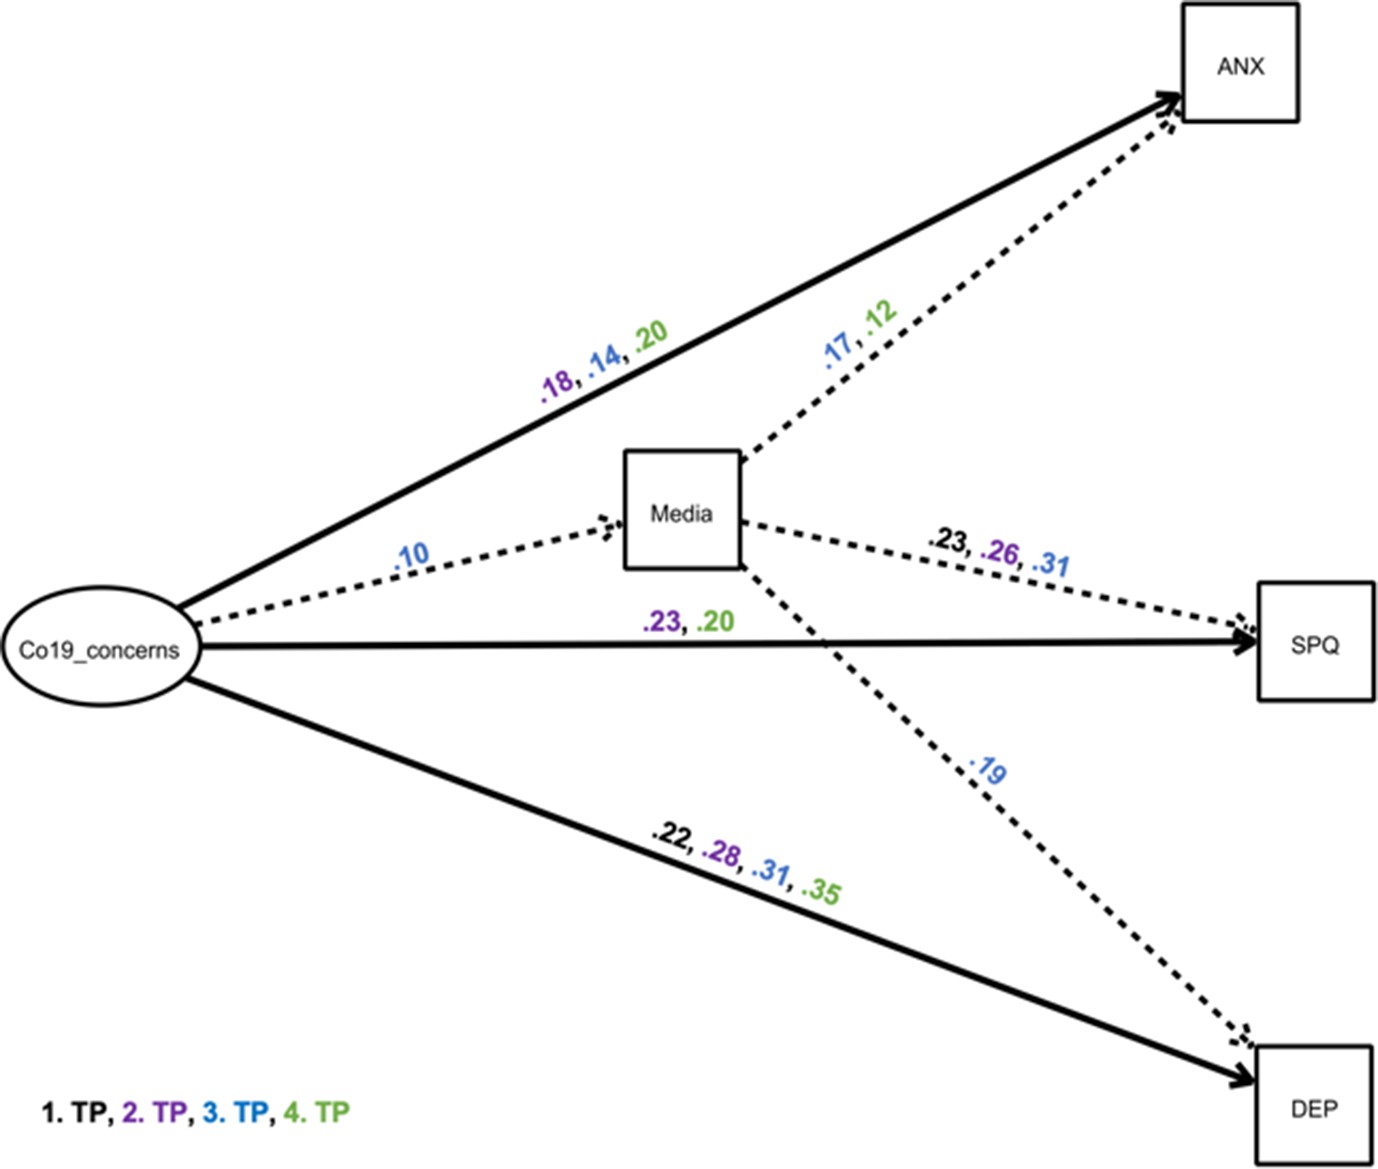
Structural equation model showing a mediator model of the impact of ‘COVID-19 related life concerns’ on depressive and anxiety-related symptoms and Schizotypal traits, via the mediator excessive media use.
The exogeneous latent variable (‘predictor’) had an elevating effect on the endogenous variable (‘outcome’) and the mediator. Black estimates: April/May 2020 survey, purple estimates: September/October 2020 survey, blue estimates: January/February 2021 survey, green estimates: May 2021 survey. Solid, bold lines indicate direct effects; dashed lines indicate indirect effects. Effects are only shown where p<0.05 (see Table 4). Other possible mediators were included in the model, but are not depicted for simplicity, as indirect effects were non-significant (Table 4). ANX: anxiety symptoms; DEP: depressive Symptoms, SPQ: total sum scores of Schizotypal Personality Questionnaire; TP: time point; Co19_concerns: COVID-19 related life concerns.
Figure 5
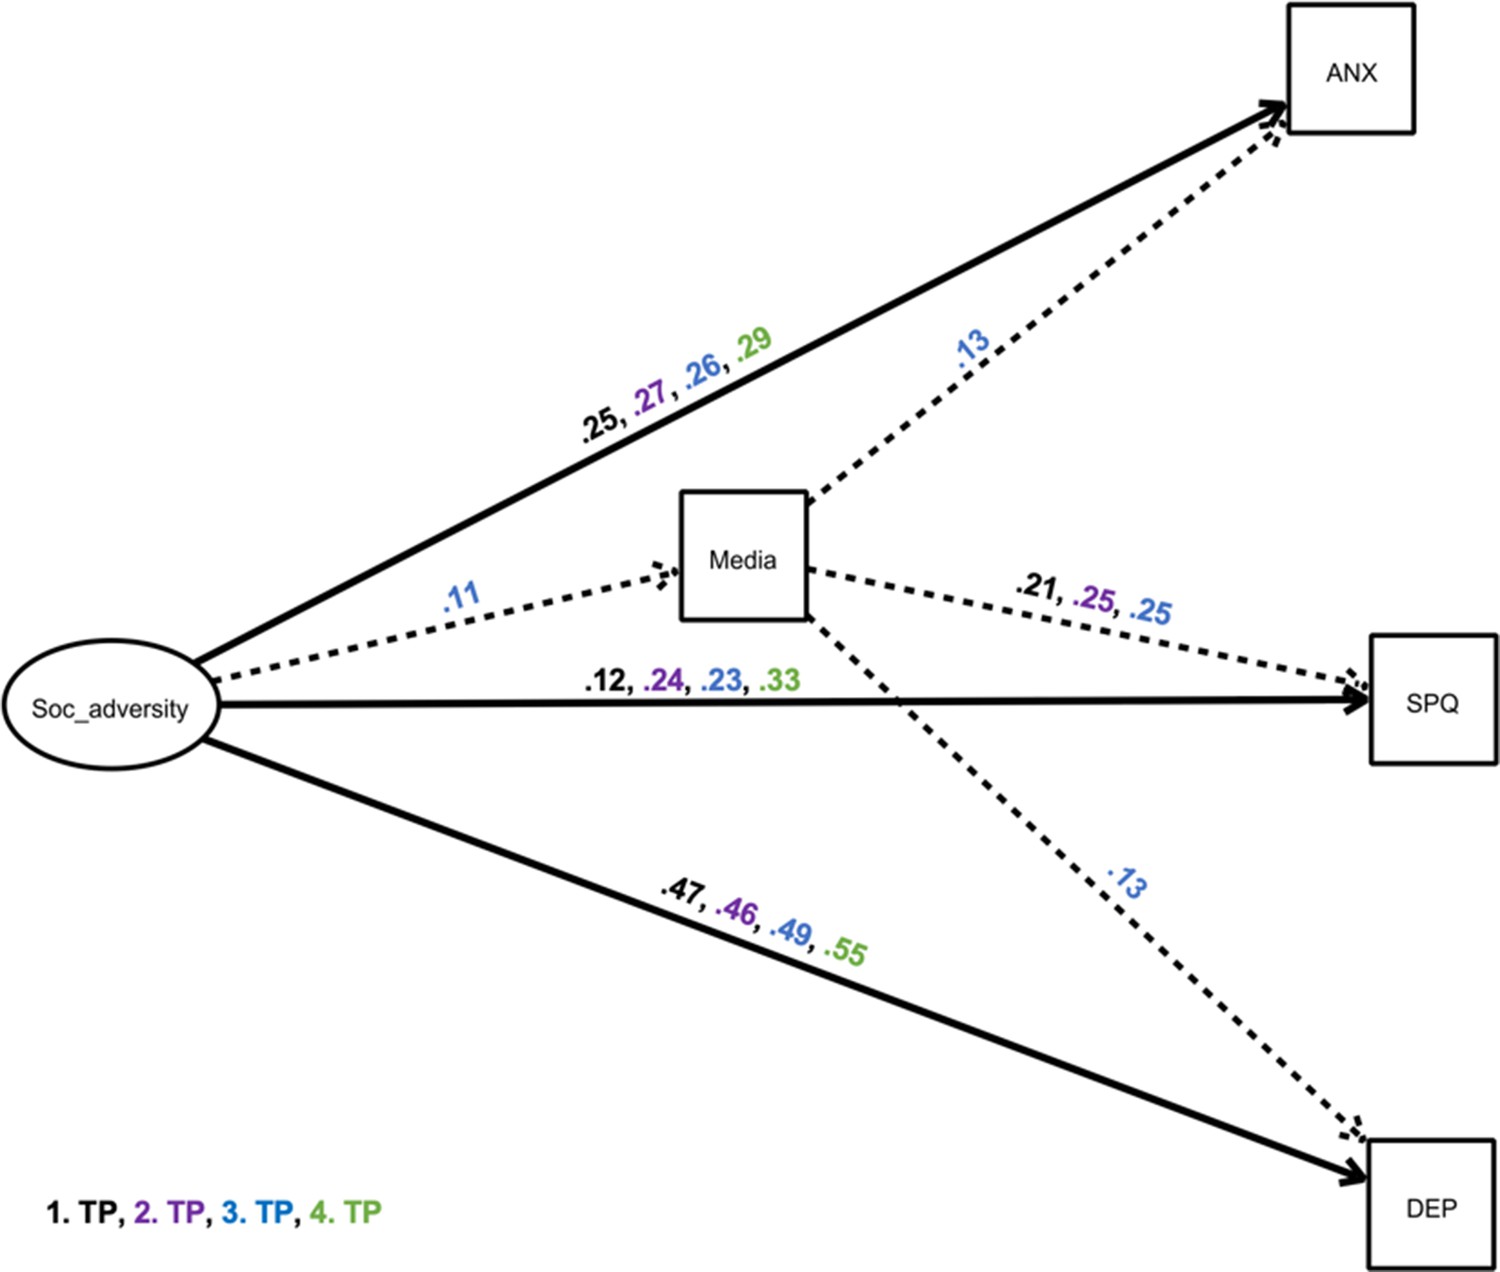
Structural equation model showing a mediator model of the impact of ‘social adversity’ on depressive and anxiety-related symptoms and schizotypal traits and via the mediator excessive media use.
The exogeneous latent variable (‘predictor’) had an elevating effect on the endogenous variable (‘outcome’) and the mediator. We only present significant pathways (p<0.05). Black estimates: April/May 2020 survey, purple estimates: September/October 2020 survey, blue estimates: January/February 2021, green estimates: May 2021 survey. Solid, bold lines indicate direct effects; dashed lines indicate indirect effects. Other possible mediators were included in the model, but are not depicted for simplicity, as indirect effects were non-significant (Table 5). ANX: anxiety symptoms; DEP: depressive Symptoms, SPQ: total sum scores of Schizotypal Personality Questionnaire; TP: time point; Soc_adversity: social adversity.
Tables
Table 1
Cohort demographics and COVID-19 exposure divided by country and time point.
Values in percent if not indicated otherwise.
| Survey 1April/May 2020 | Survey 2September/October 2020 | Survey 3January/February 2021 | Survey 4May 2021 | Country comparison | Survey comparison | ||||||||||
|---|---|---|---|---|---|---|---|---|---|---|---|---|---|---|---|
| UK | Ger | UK | Ger | UK | Ger | UK | Ger | W/X2 | df | p | K/X2 | df | p | ||
| N | 239 | 542 | 115 | 383 | 96 | 448 | 70 | 416 | 55.31 | 3 | 0.000 | ||||
| Percent | 27.9 | 63.1 | 21.1 | 70.4 | 16.3 | 76.1 | 13.7 | 81.6 | |||||||
| Age | Mean | 39.01 | 45.36 | 40.9 | 42.87 | 42.05 | 43.18 | 44.04 | 43.84 | 398,256 | 0.000 | 2.85 | 3 | 0.416 | |
| SD | 16.02 | 14.87 | 16.17 | 16.04 | 17.38 | 14.45 | 18.73 | 14.64 | |||||||
| Gender | Male | 24.3 | 25.9 | 29.6 | 25.1 | 21.9 | 29.7 | 22.9 | 24.5 | 0.69 | 2 | 0.709 | 6.76 | 6 | 0.343 |
| Female | 73.6 | 71.2 | 68.7 | 72.8 | 75.0 | 68.5 | 74.3 | 74.8 | |||||||
| other/ n.a. | 2.1 | 3.0 | 1.7 | 2.1 | 3.1 | 1.8 | 2.9 | 0.7 | |||||||
| Education | School leavers | 0.4 | 0.0 | 0.0 | 0.0 | 0.0 | 0.0 | 0.0 | 0.2 | 194.74 | 8 | 0.000 | 125.74 | 24 | 0.000 |
| 8 years | 19.2 | 13.1 | 16.5 | 13.8 | 17.7 | 25.9 | 5.7 | 20.9 | |||||||
| Prof. college | 31.8 | 21.6 | 39.1 | 30.8 | 49.0 | 32.6 | 44.3 | 34.1 | |||||||
| Master or < | 47.3 | 64.9 | 43.5 | 55.1 | 33.0 | 41.3 | 48.6 | 44.7 | |||||||
| Missing | 1.3 | 0.4 | 0.9 | 0.3 | 0.0 | 0.2 | 1.4 | 0.0 | |||||||
| Living Area | City | 20.50 | 60.30 | 25.20 | 43.30 | 24.00 | 37.10 | 20.00 | 47.40 | 147.64 | 5 | 0.000 | 52.74 | 15 | 0.000 |
| Suburb | 7.90 | 13.10 | 12.20 | 13.80 | 14.60 | 11.80 | 14.30 | 10.10 | |||||||
| Town | 36.40 | 10.70 | 26.10 | 14.10 | 15.60 | 18.30 | 35.70 | 14.20 | |||||||
| Village, rural | 34.70 | 15.70 | 35.70 | 26.40 | 44.80 | 31.50 | 30.00 | 26.00 | |||||||
| Missing | 0.40 | 0.20 | 0.90 | 2.30 | 1.00 | 1.30 | 0.00 | 2.40 | |||||||
| Rating physical health before Co19 | Exc. | 13.00 | 11.30 | 8.70 | 10.70 | 13.50 | 15.80 | 8.60 | 13.90 | 28.49 | 5 | 0.000 | 29.62 | 15 | 0.013 |
| Very good | 32.20 | 33.30 | 25.20 | 32.90 | 27.10 | 36.20 | 34.30 | 38.20 | |||||||
| Good | 31.80 | 35.70 | 42.60 | 42.00 | 33.30 | 34.60 | 34.30 | 35.10 | |||||||
| Fairly | 17.20 | 15.50 | 18.30 | 110 | 15.60 | 9.60 | 17.10 | 9.10 | |||||||
| Poor | 3.80 | 3.30 | 4.30 | 1.60 | 10.40 | 1.80 | 5.70 | 1.70 | |||||||
| Missing | 2.10 | 0.90 | 0.90 | 1.80 | 0.00 | 2.00 | 0.00 | 1.90 | |||||||
| Treatment physical illness | No | 66.90 | 72.80 | 71.30 | 81.50 | 72.90 | 76.10 | 75.70 | 76.20 | 26.27 | 2 | 0.000 | 101.25 | 6 | 0.000 |
| Yes | 18.40 | 20.10 | 27.00 | 17.80 | 260 | 22.80 | 22.90 | 23.10 | |||||||
| Missing | 14.60 | 7.00 | 1.70 | 0.80 | 1.00 | 1.10 | 1.40 | 0.70 | |||||||
| Rating mental health before Co19 | Exc. | 14.20 | 15.30 | 8.70 | 11.50 | 15.60 | 17.90 | 15.70 | 15.10 | 87.86 | 5 | 0.000 | 41.85 | 15 | 0.000 |
| Very good | 21.80 | 37.00 | 23.50 | 33.40 | 27.10 | 40.80 | 25.70 | 42.10 | |||||||
| Good | 30.10 | 28.30 | 38.30 | 37.90 | 28.10 | 28.30 | 32.90 | 27.20 | |||||||
| Fairly | 21.30 | 14.60 | 18.30 | 12.30 | 16.70 | 9.40 | 14.30 | 11.80 | |||||||
| Poor | 11.30 | 3.30 | 9.60 | 3.90 | 10.40 | 2.50 | 11.40 | 2.90 | |||||||
| Missing | 1.30 | 1.50 | 1.70 | 1.00 | 2.10 | 1.10 | 0.00 | 1.00 | |||||||
| Psych. Treatment | No | 69.00 | 81.90 | 79.10 | 89.60 | 78.10 | 86.40 | 80.00 | 87.70 | 41.63 | 2 | 0.000 | 92.40 | 6 | 0.000 |
| Yes | 17.60 | 10.90 | 18.30 | 9.70 | 20.80 | 12.70 | 20.00 | 10.80 | |||||||
| Missing | 13.40 | 7.20 | 2.60 | 0.80 | 1.00 | 0.90 | 0.00 | 1.40 | |||||||
| Suspected infection | Positive Test | 0.00 | 0.20 | 0.00 | 0.80 | 5.20 | 3.10 | 1.40 | 3.80 | 41.76 | 12 | 0.004 | 41.76 | 12 | 0.000 |
| Diagn. | 2.50 | 0.70 | 0.90 | 0.50 | 1.00 | 0.90 | 0.00 | 0.50 | |||||||
| Sympt. | 18.80 | 14.20 | 19.10 | 15.40 | 21.90 | 16.50 | 28.60 | 14.70 | |||||||
| No inf. | 78.70 | 83.90 | 79.10 | 82.50 | 71.90 | 79.20 | 70.00 | 80.80 | |||||||
| Missing | 0.00 | 0.90 | 0.90 | 0.80 | 0.00 | 0.20 | 0.00 | 0.20 | |||||||
-
GER: German sample; UK: UK sample; TP: time point; p: p-vlaue; n.a.: missing values; Exc. Excellent; Diagn: positive diagnosis; Sympt: Symptoms of COVID-19; No inf: No infection.
Table 2
Overview of the results of the Kruskal-Wallis Chi square test and Dunn’s post-hoc test for the endogenous variables, mediators, or exogeneous latent variables in the following structural equation models.
Comparisons presented are those comparing the latter survey to the prior survey, as well the last survey to the first survey.
| Survey comparison | Post-hoc test (Dunn’s test p-values) | |||||
|---|---|---|---|---|---|---|
| Kruskal-WallisX2 | p | April/May 2020 vsSeptember/ Oct. 2020 | September/ October 2020 vsJanuary/ February 2021 | January /February 2021 vsMay 2021 | April/May 2020 vsMay 2021 | |
| Endogenous variable | ||||||
| SPQ | 0.61 | 0.893 | 0.58 | 0.44 | 0.79 | 0.99 |
| Anxiety | 57.56 | 0.000 | 0.00 | 1.00 | 0.37 | 0.00 |
| Depression | 28.04 | 0.000 | 0.00 | 0.00 | 0.93 | 0.09 |
| Mediators | ||||||
| Excessive media use | 39.98 | 0.000 | 0.00 | 0.00 | 0.00 | 0.92 |
| Drug consumption | 1.92 | 0.590 | 0.98 | 0.57 | 0.58 | 0.21 |
| Alcohol consumption | 28.40 | 0.000 | 0.02 | 0.32 | 0.11 | 0.00 |
| Exercise | 78.98 | 0.000 | 0.00 | 0.00 | 0.92 | 0.00 |
| Sleep | 20.96 | 0.000 | 0.01 | 0.43 | 0.58 | 0.00 |
| Exogeneous variables | ||||||
| Restrictions stressful | 33.49 | 0.000 | 0.00 | 0.00 | 0.01 | 0.34 |
| Financial impact | 25.89 | 0.000 | 0.00 | 0.13 | 0.01 | 0.00 |
| Concerns life stability | 35.65 | 0.000 | 0.00 | 0.00 | 0.00 | 0.01 |
| Lonely | 18.13 | 0.000 | 0.00 | 0.00 | 0.56 | 0.28 |
| Negative Thoughts | 13.93 | 0.002 | 0.00 | 0.01 | 0.99 | 0.41 |
| Stressful social relationship changes | 62.25 | 0.000 | 0.00 | 0.00 | 0.68 | 0.89 |
-
p: significance value; SPQ: Schizotypal Personality Questionnaire.
Table 3
Overview of the model fit indices separated by exogeneous latent variable and survey.
| Exact model fit | Relative model fit | |||||
|---|---|---|---|---|---|---|
| Test statistic | df | X2 | CFI | RMSEA | ||
| Predictor | Survey | |||||
| COVID-19 related life concerns | 1 - April/May 20 | 480.16 | 135 | 0.000 | 0.836 | 0.073 |
| 2 - Sept./ Oct. 20 | 440.01 | 135 | 0.000 | 0.862 | 0.072 | |
| 3 - Jan. /Feb. 21 | 426.43 | 135 | 0.000 | 0.883 | 0.066 | |
| 4 - May 21 | 413.53 | 135 | 0.000 | 0.867 | 0.068 | |
| Social adversity | 1 - April/May 20 | 492.39 | 135 | 0.000 | 0.853 | 0.074 |
| 2 - Sept./ Oct. 20 | 481.87 | 135 | 0.000 | 0.857 | 0.078 | |
| 3 - Jan. /Feb. 21 | 498.07 | 135 | 0.000 | 0.866 | 0.074 | |
| 4 - May 21 | 448.08 | 135 | 0.000 | 0.866 | 0.073 |
-
df: degree of freedom; X2: Chi squared test; CFI: comparative fit index; RMSEA: root mean square error of approximation.
Table 4
Overview of all results of the structural equation model with ‘COVID-19 related life concerns’ as exogeneous latent variable for mental health endogenous variables mediated by harmful and healthy behaviours.
The results are separated by endogenous variable (schizotypal traits, depressive symptoms, anxiety symptoms), mediators (excessive media use, drug consumption, alcohol consumption, units of exercise per week, hours of sleep per night during weeks) and samples at the four time points, showing indirect, direct, and total effects, as well as individual pathways.
| Outcome | Mediators | Sample time point | Indirect effect | Total effect | a | b | c | |||||
|---|---|---|---|---|---|---|---|---|---|---|---|---|
| estimate | p | estimate | p | estimate | p | estimate | p | estimate | p | |||
| SPQ | Excessive Media use | 1 | 0.01 | 0.181 | 0.01 | 0.915 | 0.05 | 0.078 | 0.23 | .020 | 0.00 | 0.950 |
| 2 | 0.00 | 0.201 | 0.23 | 0.001 | 0.01 | 0.828 | 0.26 | 0.011 | 0.23 | 0.001 | ||
| 3 | 0.03 | .015 | 0.12 | .040 | 0.10 | .000 | 0.31 | .001 | 0.09 | .131 | ||
| 4 | 0.00 | 0.839 | 0.20 | 0.001 | 0.04 | 0.196 | 0.02 | 0.799 | 0.20 | 0.001 | ||
| Drug consumption | 1 | 0.00 | 0.561 | 0.00 | 0.997 | 0.03 | 0.266 | 0.15 | 0.318 | 0.00 | 0.950 | |
| 2 | 0.01 | 0.427 | 0.23 | 0.001 | 0.04 | 0.009 | 0.14 | 0.295 | 0.23 | 0.001 | ||
| 3 | 0.10 | 0.430 | 0.10 | 0.077 | 0.09 | 0.000 | 0.11 | 0.400 | 0.09 | 0.131 | ||
| 4 | 0.01 | 0.334 | 0.21 | 0.000 | 0.06 | 0.018 | 0.15 | 0.277 | 0.20 | 0.001 | ||
| Alcohol consumption | 1 | 0.00 | 0.761 | 0.00 | 0.974 | 0.20 | 0.271 | 0.01 | 0.625 | 0.00 | 0.950 | |
| 2 | 0.00 | 0.872 | 0.22 | 0.001 | –0.04 | 0.764 | 0.01 | 0.480 | 0.23 | 0.001 | ||
| 3 | 0.00 | 0.701 | 0.09 | 0.137 | 0.08 | 0.535 | –0.02 | 0.320 | 0.09 | 0.131 | ||
| 4 | –0.01 | 0.226 | 0.19 | 0.001 | 0.33 | 0.017 | –0.03 | 0.136 | 0.20 | 0.001 | ||
| Exercise (units per week) | 1 | 0.00 | 0.506 | 0.00 | 0.989 | –0.08 | 0.340 | –0.04 | 0.218 | 0.00 | 0.950 | |
| 2 | 0.00 | 0.589 | 0.22 | 0.001 | –0.10 | 0.133 | 0.03 | 0.479 | 0.23 | 0.001 | ||
| 3 | 0.00 | 0.871 | 0.09 | 0.133 | –0.11 | 0.059 | 0.01 | 0.852 | 0.09 | 0.131 | ||
| 4 | 0.00 | 0.531 | 0.20 | 0.001 | –0.10 | 0.114 | 0.04 | 0.421 | 0.20 | 0.001 | ||
| Sleep (hours per night) | 1 | 0.01 | 0.307 | 0.01 | 0.934 | –0.08 | 0.110 | –0.12 | 0.073 | 0.00 | 0.950 | |
| 2 | 0.01 | 0.369 | 0.23 | 0.000 | –0.02 | 0.332 | –0.30 | 0.015 | 0.23 | 0.001 | ||
| 3 | 0.02 | 0.081 | 0.11 | 0.042 | –0.17 | 0.000 | –0.15 | 0.057 | 0.09 | 0.131 | ||
| 4 | 0.00 | 0.909 | 0.20 | 0.000 | –0.09 | 0.002 | –0.02 | 0.906 | 0.20 | 0.001 | ||
| Anxiety | Excessive Media use | 1 | 0.01 | 0.240 | 0.07 | 0.131 | 0.05 | 0.078 | 0.10 | 0.094 | 0.07 | 0.160 |
| 2 | 0.00 | 0.844 | 0.18 | 0.000 | 0.01 | 0.828 | 0.11 | 0.052 | 0.18 | 0.000 | ||
| 3 | 0.02 | 0.008 | 0.16 | 0.000 | 0.10 | 0.000 | 0.17 | 0.001 | 0.14 | 0.000 | ||
| 4 | 0.00 | 0.266 | 0.20 | 0.000 | 0.04 | 0.196 | 0.12 | 0.021 | 0.20 | 0.000 | ||
| Drug consumption | 1 | 0.00 | 0.726 | 0.07 | 0.147 | 0.03 | 0.266 | 0.05 | 0.591 | 0.07 | 0.160 | |
| 2 | 0.00 | 0.384 | 0.19 | 0.000 | 0.04 | 0.009 | 0.11 | 0.218 | 0.18 | 0.000 | ||
| 3 | 0.01 | 0.121 | 0.16 | 0.000 | 0.09 | 0.000 | 0.14 | 0.083 | 0.14 | 0.000 | ||
| 4 | 0.00 | 0.951 | 0.20 | 0.000 | 0.06 | 0.018 | –0.01 | 0.965 | 0.20 | 0.000 | ||
| Alcohol consumption | 1 | 0.00 | 0.726 | 0.07 | 0.147 | 0.20 | 0.271 | 0.01 | 0.343 | 0.07 | 0.160 | |
| 2 | 0.00 | 0.961 | 0.18 | 0.000 | –0.04 | 0.764 | 0.00 | 0.857 | 0.18 | 0.000 | ||
| 3 | 0.00 | 0.736 | 0.14 | 0.000 | 0.08 | 0.535 | –0.01 | 0.443 | 0.14 | 0.000 | ||
| 4 | 0.00 | 0.818 | 0.20 | 0.000 | 0.33 | 0.017 | 0.00 | 0.802 | 0.20 | 0.000 | ||
| Exercise (units per week) | 1 | 0.00 | 0.696 | 0.07 | 0.167 | –0.08 | 0.340 | 0.01 | 0.607 | 0.07 | 0.160 | |
| 2 | 0.00 | 0.540 | 0.18 | 0.000 | –0.10 | 0.133 | 0.02 | 0.018 | 0.18 | 0.000 | ||
| 3 | 0.00 | 0.675 | 0.14 | 0.000 | –0.11 | 0.059 | 0.01 | 0.615 | 0.14 | 0.000 | ||
| 4 | –0.01 | 0.240 | 0.19 | 0.000 | –0.10 | 0.114 | 0.06 | 0.015 | 0.20 | 0.000 | ||
| Sleep (hours per night) | 1 | 0.01 | 0.196 | 0.08 | 0.128 | –0.08 | 0.110 | –0.09 | 0.043 | 0.07 | 0.160 | |
| 2 | 0.00 | 0.425 | 0.19 | 0.000 | –0.02 | 0.332 | –0.13 | 0.073 | 0.18 | 0.000 | ||
| 3 | 0.00 | 0.916 | 0.15 | 0.000 | –0.17 | 0.000 | –0.01 | 0.915 | 0.14 | 0.000 | ||
| 4 | 0.00 | 0.805 | 0.20 | 0.000 | –0.09 | 0.002 | –0.02 | 0.794 | 0.20 | 0.000 | ||
| Depression | Excessive Media use | 1 | 0.00 | 0.282 | 0.22 | 0.003 | 0.05 | 0.078 | 0.08 | 0.179 | 0.22 | 0.004 |
| 2 | 0.00 | 0.851 | 0.28 | 0.000 | 0.01 | 0.828 | 0.10 | 0.128 | 0.28 | 0.000 | ||
| 3 | 0.02 | 0.010 | 0.32 | 0.000 | 0.10 | 0.000 | 0.19 | 0.002 | 0.31 | 0.000 | ||
| 4 | 0.00 | 0.342 | 0.36 | 0.000 | 0.04 | 0.196 | 0.11 | 0.139 | 0.35 | 0.000 | ||
| Drug consumption | 1 | 0.00 | 0.603 | 0.22 | 0.004 | 0.03 | 0.266 | 0.08 | 0.439 | 0.22 | 0.004 | |
| 2 | 0.01 | 0.381 | 0.28 | 0.000 | 0.04 | 0.009 | 0.14 | 0.223 | 0.28 | 0.000 | ||
| 3 | 0.01 | 0.176 | 0.32 | 0.000 | 0.09 | 0.000 | 0.14 | 0.166 | 0.31 | 0.000 | ||
| 4 | 0.01 | 0.323 | 0.36 | 0.000 | 0.06 | 0.018 | 0.12 | 0.265 | 0.35 | 0.000 | ||
| Alcohol consumption | 1 | 0.01 | 0.211 | 0.23 | 0.004 | 0.20 | 0.271 | 0.04 | 0.010 | 0.22 | 0.004 | |
| 2 | 0.00 | 0.808 | 0.28 | 0.000 | –0.04 | 0.764 | 0.02 | 0.137 | 0.28 | 0.000 | ||
| 3 | 0.00 | 0.596 | 0.31 | 0.000 | 0.08 | 0.535 | 0.02 | 0.098 | 0.31 | 0.000 | ||
| 4 | 0.00 | 0.735 | 0.35 | 0.000 | 0.33 | 0.017 | 0.01 | 0.718 | 0.35 | 0.000 | ||
| Exercise (units per week) | 1 | 0.00 | 0.798 | 0.22 | 0.004 | –0.08 | 0.340 | –0.01 | 0.731 | 0.22 | 0.004 | |
| 2 | 0.00 | 0.613 | 0.28 | 0.000 | –0.10 | 0.133 | –0.02 | 0.544 | 0.28 | 0.000 | ||
| 3 | 0.00 | 0.278 | 0.31 | 0.000 | –0.11 | 0.059 | –0.03 | 0.294 | 0.31 | 0.000 | ||
| 4 | 0.00 | 0.866 | 0.35 | 0.000 | –0.10 | 0.114 | 0.01 | 0.832 | 0.35 | 0.000 | ||
| Sleep (hours per night) | 1 | 0.01 | 0.085 | 0.23 | 0.003 | –0.08 | 0.110 | –0.15 | 0.005 | 0.22 | 0.004 | |
| 2 | 0.00 | 0.392 | 0.28 | 0.000 | –0.02 | 0.332 | –0.19 | 0.023 | 0.28 | 0.000 | ||
| 3 | 0.01 | 0.371 | 0.31 | 0.000 | –0.17 | 0.000 | –0.05 | 0.350 | 0.31 | 0.000 | ||
| 4 | 0.01 | 0.303 | 0.36 | 0.000 | –0.09 | 0.002 | –0.10 | 0.278 | 0.35 | 0.000 | ||
-
a: pathway estimate between exogeneous latent variable and mediator; b: pathway estimate between mediator and endogenous variable; c: pathway estimate between exogeneous latent variable and endogenous variable.
Table 5
Overview of all results of the structural equation model with ‘social adversity’ as an exogeneous latent variable for mental health endogenous variables with a mediation by harmful and healthy behaviours.
The results are separated by endogenous variable (schizotypal traits, depressive symptoms, and anxiety symptoms), mediators (excessive media use, drug consumption, alcohol consumption, units of exercise per week, and hours of sleep per night during weeks) and samples at the four time points, showing indirect, direct, and total effects, as well as individual pathways.
| Outcome | Mediators | Sample time point | Indirect effect | Total effect | a | b | c | |||||
|---|---|---|---|---|---|---|---|---|---|---|---|---|
| estimate | p | estimate | p | estimate | p | estimate | p | estimate | p | |||
| SPQ | Excessive Media use | 1 | 0.01 | 0.156 | 0.13 | 0.027 | 0.05 | 0.062 | 0.21 | 0.022 | 0.12 | 0.043 |
| 2 | 0.01 | 0.219 | 0.25 | 0.000 | 0.04 | 0.122 | 0.25 | 0.015 | 0.24 | 0.001 | ||
| 3 | 0.03 | 0.017 | 0.26 | 0.000 | 0.11 | 0.000 | 0.25 | 0.004 | 0.23 | 0.000 | ||
| 4 | 0.00 | 0.989 | 0.33 | 0.000 | 0.05 | 0.056 | 0.00 | 0.987 | 0.33 | 0.000 | ||
| Drug consumption | 1 | 0.01 | 0.383 | 0.13 | 0.029 | 0.07 | 0.001 | 0.13 | 0.352 | 0.12 | 0.043 | |
| 2 | 0.01 | 0.313 | 0.25 | 0.000 | 0.05 | 0.077 | 0.18 | 0.152 | 0.24 | 0.001 | ||
| 3 | 0.01 | 0.700 | 0.24 | 0.000 | 0.10 | 0.000 | 0.05 | 0.699 | 0.23 | 0.000 | ||
| 4 | 0.01 | 0.455 | 0.33 | 0.000 | 0.06 | 0.017 | 0.11 | 0.403 | 0.33 | 0.000 | ||
| Alcohol consumption | 1 | 0.00 | 0.903 | 0.12 | 0.038 | 0.50 | 0.000 | 0.13 | 0.352 | 0.12 | .043 | |
| 2 | 0.00 | 0.805 | 0.24 | 0.001 | –0.08 | 0.570 | 0.01 | 0.577 | 0.24 | .001 | ||
| 3 | 0.00 | 0.477 | 0.23 | 0.000 | 0.16 | 0.209 | –0.02 | 0.288 | 0.23 | .000 | ||
| 4 | 0.00 | 0.810 | 0.33 | 0.000 | 0.05 | 0.693 | –0.02 | 0.385 | 0.33 | .000 | ||
| Exercise (units per week) | 1 | 0.00 | 0.785 | 0.12 | 0.047 | 0.03 | 0.715 | –0.04 | 0.202 | 0.12 | .043 | |
| 2 | 0.00 | 0.971 | 0.24 | 0.001 | –0.06 | 0.454 | 0.00 | 0.951 | 0.24 | .001 | ||
| 3 | 0.00 | 0.968 | 0.23 | 0.000 | –0.03 | 0.587 | 0.00 | 0.934 | 0.23 | .000 | ||
| 4 | 0.00 | 0.606 | 0.33 | 0.000 | –0.05 | 0.434 | 0.05 | 0.279 | 0.33 | .000 | ||
| Sleep (hours per night) | 1 | 0.01 | 0.257 | 0.13 | 0.020 | –0.16 | 0.000 | –0.09 | 0.217 | 0.12 | .043 | |
| 2 | 0.02 | 0.131 | 0.26 | 0.000 | –0.11 | 0.000 | –0.23 | 0.115 | 0.24 | .001 | ||
| 3 | 0.01 | 0.223 | 0.25 | 0.000 | –0.13 | 0.001 | –0.10 | 0.196 | 0.23 | .000 | ||
| 4 | –0.01 | 0.736 | 0.32 | 0.000 | –0.10 | 0.000 | 0.05 | 0.717 | 0.33 | .000 | ||
| Anxiety | Excessive Media use | 1 | 0.00 | 0.340 | 0.26 | 0.000 | 0.05 | 0.062 | 0.06 | 0.226 | 0.25 | .000 |
| 2 | 0.00 | 0.286 | 0.27 | 0.000 | 0.04 | 0.122 | 0.09 | 0.116 | 0.27 | .000 | ||
| 3 | 0.01 | 0.021 | 0.28 | 0.000 | 0.11 | 0.000 | 0.13 | 0.012 | 0.26 | .000 | ||
| 4 | 0.00 | 0.192 | 0.29 | 0.000 | 0.05 | 0.056 | 0.09 | 0.058 | 0.29 | .000 | ||
| Drug consumption | 1 | 0.00 | 0.918 | 0.25 | 0.000 | 0.07 | 0.001 | –0.01 | 0.915 | 0.25 | .000 | |
| 2 | 0.01 | 0.404 | 0.27 | 0.000 | 0.05 | 0.077 | 0.09 | 0.247 | 0.27 | .000 | ||
| 3 | 0.01 | 0.307 | 0.27 | 0.000 | 0.10 | 0.000 | 0.08 | 0.307 | 0.26 | .000 | ||
| 4 | 0.00 | 0.795 | 0.29 | 0.000 | 0.06 | 0.017 | –0,02 | 0.777 | 0.29 | .000 | ||
| Alcohol consumption | 1 | 0.00 | 0.513 | 0.25 | 0.000 | 0.50 | 0.000 | –0.01 | 0.487 | 0.25 | .000 | |
| 2 | 0.00 | 0.936 | 0.27 | 0.000 | –0.08 | 0.570 | 0.00 | 0.861 | 0.27 | .000 | ||
| 3 | 0.00 | 0.526 | 0.26 | 0.000 | 0.16 | 0.209 | –0.01 | 0.324 | 0.26 | .000 | ||
| 4 | 0.00 | 0.842 | 0.29 | 0.000 | 0.05 | 0.693 | 0.01 | 0.511 | 0.29 | .000 | ||
| Exercise (units per week) | 1 | 0.00 | 0.982 | 0.25 | 0.000 | 0.03 | 0.715 | 0.00 | 0.951 | 0.25 | .000 | |
| 2 | 0.00 | 0.872 | 0.27 | 0.000 | –0.06 | 0.454 | –0.01 | 0.784 | 0.27 | .000 | ||
| 3 | 0.00 | 0.988 | 0.26 | 0.000 | –0.03 | 0.587 | 0.00 | 0.976 | 0.26 | .000 | ||
| 4 | 0.00 | 0.485 | 0.28 | 0.000 | –0.05 | 0.434 | 0.05 | 0.011 | 0.29 | .000 | ||
| Sleep (hours per night) | 1 | 0.00 | 0.539 | 0.26 | 0.000 | –0.16 | 0.000 | –0.02 | 0.524 | 0.25 | .000 | |
| 2 | 0.00 | 0.847 | 0.27 | 0.000 | –0.11 | 0.000 | –0.01 | 0.843 | 0.27 | .000 | ||
| 3 | 0.00 | 0.627 | 0.26 | 0.000 | –0.13 | 0.001 | 0.02 | 0.620 | 0.26 | .000 | ||
| 4 | 0.00 | 0.623 | 0.28 | 0.000 | –0.10 | 0.000 | 0.03 | 0.597 | 0.29 | .000 | ||
| Depression | Excessive Media use | 1 | 0.00 | 0.489 | 0.48 | 0.000 | 0.05 | 0.062 | 0.04 | 0.430 | 0.47 | .000 |
| 2 | 0.00 | 0.464 | 0.47 | 0.000 | 0.04 | 0.122 | 0.06 | 0.353 | 0.46 | .000 | ||
| 3 | 0.01 | 0.024 | 0.51 | 0.000 | 0.11 | 0.000 | 0.13 | 0.019 | 0.49 | .000 | ||
| 4 | 0.00 | 0.393 | 0.56 | 0.000 | 0.05 | 0.056 | 0.06 | 0.333 | 0.55 | .000 | ||
| Drug consumption | 1 | 0.00 | 0.730 | 0.47 | 0.000 | 0.07 | 0.001 | –0.03 | 0.708 | 0.47 | .000 | |
| 2 | 0.01 | 0.383 | 0.47 | 0.000 | 0.05 | 0.077 | –0.10 | 0.279 | 0.46 | .000 | ||
| 3 | 0.00 | 0.662 | 0.50 | 0.000 | 0.10 | 0.000 | 0.04 | 0.664 | 0.49 | .000 | ||
| 4 | 0.01 | 0.362 | 0.56 | 0.000 | 0.06 | 0.017 | 0.09 | 0.287 | 0.55 | .000 | ||
| Alcohol consumption | 1 | 0.00 | 0.667 | 0.48 | 0.000 | 0.50 | 0.000 | 0.01 | 0.663 | 0.47 | .000 | |
| 2 | 0.00 | 0.670 | 0.46 | 0.000 | –0.08 | 0.570 | 0.02 | 0.102 | 0.46 | .000 | ||
| 3 | 0.00 | 0.373 | 0.50 | 0.000 | 0.16 | 0.209 | 0.02 | 0.202 | 0.49 | .000 | ||
| 4 | 0.00 | 0.747 | 0.55 | 0.000 | 0.05 | 0.693 | –0.02 | 0.149 | 0.55 | .000 | ||
| Exercise (units per week) | 1 | 0.00 | 0.761 | 0.47 | 0.000 | 0.03 | 0.715 | –0.03 | 0.113 | 0.47 | .000 | |
| 2 | 0.00 | 0.571 | 0.47 | 0.000 | –0.06 | 0.454 | –0.03 | 0.212 | 0.46 | .000 | ||
| 3 | 0.00 | 0.621 | 0.50 | 0.000 | –0.03 | 0.587 | –0.04 | 0.079 | 0.49 | .000 | ||
| 4 | 0.00 | 0.876 | 0.55 | 0.000 | –0.05 | 0.434 | –0.01 | 0.795 | 0.55 | .000 | ||
| Sleep (hours per Night) | 1 | 0.01 | 0.384 | 0.48 | 0.000 | –0.16 | 0.000 | –0.03 | 0.371 | 0.47 | .000 | |
| 2 | –0.01 | 0.463 | 0.46 | 0.000 | –0.11 | 0.000 | 0.06 | 0.431 | 0.46 | .000 | ||
| 3 | 0.00 | 0.814 | 0.50 | 0.000 | –0.13 | 0.001 | –0.01 | 0.807 | 0.49 | .000 | ||
| 4 | 0.00 | 0.868 | 0.55 | 0.000 | –0.10 | 0.000 | 0.03 | 0.597 | 0.55 | .000 | ||
-
a: pathway estimate between exogeneous latent variable and mediator; b: pathway estimate between mediator and endogenous variable; c: pathway estimate between exogeneous latent variable and endogenous variable.
Table 6
Exploratory analysis: Anxiety and Depression as Mediators and Schizotypy as Outcome.
| Sample time point | Indirect effect | Total effects | a | b | c | |||||||
|---|---|---|---|---|---|---|---|---|---|---|---|---|
| Predictor | Mediators | estimate | p | estimate | p | estimate | p | estimate | p | estimate | p | |
| Co19 related life concerns | Depression | 1 | 0.00 | 0.999 | –0.03 | 0.637 | 0.24 | 0.001 | 0.00 | 0.998 | –0.03 | .738 |
| 2 | 0.02 | 0.458 | 0.08 | 0.127 | 0.29 | 0.000 | 0.07 | 0.457 | 0.06 | .299 | ||
| 3 | 0.07 | 0.070 | –0.01 | 0.895 | 0.34 | 0.000 | 0.21 | 0.013 | –0.08 | .157 | ||
| 4 | 0.07 | 0.051 | 0.03 | 0.623 | 0.37 | 0.000 | 0.18 | 0.035 | –0.04 | .558 | ||
| Anxiety | 1 | 0.05 | 0.092 | 0.03 | 0.734 | 0.08 | 0.101 | 0.68 | 0.000 | –0.03 | .738 | |
| 2 | 0.09 | 0.209 | 0.35 | 0.002 | 0.19 | 0.000 | 0.80 | 0.000 | 0.06 | .299 | ||
| 3 | 0.16 | 0.000 | 0.08 | 0.164 | 0.17 | 0.000 | 0.93 | 0.000 | –0.08 | .157 | ||
| 4 | 0.17 | 0.000 | 0.13 | 0.041 | 0.20 | 0.000 | 0.87 | 0.000 | –0.04 | .558 | ||
| Social adversity | Depression | 1 | 0.05 | 0.531 | –0.03 | 0.571 | 0.48 | 0.000 | 0.11 | 0.527 | –0.08 | .442 |
| 2 | 0.08 | 0.249 | 0.05 | 0.371 | 0.46 | 0.000 | 0.17 | 0.567 | –0.03 | .787 | ||
| 3 | 0.17 | 0.004 | 0.01 | 0.789 | 0.51 | 0.000 | 0.34 | 0.002 | –0.16 | .028 | ||
| 4 | 0.10 | 0.145 | 0.09 | 0.142 | 0.56 | 0.000 | 0.17 | 0.146 | –0.01 | .896 | ||
| Anxiety | 1 | 0.18 | 0.000 | 0.10 | 0.342 | 0.26 | 0.000 | 0.71 | 0.000 | –0.08 | .442 | |
| 2 | 0.23 | 0.000 | 0.21 | 0.049 | 0.28 | 0.000 | 0.83 | 0.000 | –0.03 | .787 | ||
| 3 | 0.26 | 0.000 | 0.10 | 0.216 | 0.28 | 0.000 | 0.94 | 0.000 | –0.16 | .028 | ||
| 4 | 0.24 | 0.000 | 0.23 | 0.012 | 0.29 | 0.000 | 0.85 | 0.000 | –0.01 | .896 | ||
-
a: pathway estimate between exogeneous latent variable and mediator; b: pathway estimate between mediator and endogenous variable; c: pathway estimate between exogeneous latent variable and endogenous variable.
Additional files
-
Supplementary file 1
Investigating the relationship of COVID-19 related stress and media consumption with schizotypy, depression, and anxiety in cross-sectional surveys repeated throughtout the pandemic in Germany and the UK - Supplementary file.
(a) Overview of the model fit indices for predictor models separated by time point. (b) Results of Generalised Estimate Equation models for the three outcome variables with survey time point as predictor. (c) Pearson’s correlation coefficient between SPQ sumscore, anxiety score (SCL-27) and depression score (SCL-27) at all four survey time points. (d) Overview of the model fit indices separated by exogeneous latent variable and survey excluding 27 subjects, who completed all four time points. (e) Complete outcome of structural equation with COVID-19 related life concerns from first survey timepoint. (f) Complete outcome of structural equation with COVID-19 related life concerns from second survey time point. (g) Complete outcome of structural equation with COVID-19 related life concerns from third survey time point. (h) Complete outcome of structural equation with COVID-19 related life concerns from fourth survey time point. (i) Complete outcome of structural equation with Social adversity as predictor from the first survey time point. (j) Complete outcome of structural equation with Social adversity as predictor from second survey time point. (k) Complete outcome of structural equation with Social adversity as predictor from third survey time point. (l) Complete outcome of structural equation with Social adversity as predictor from fourth survey time point. (m) Model fit for model with reduced complexity, one predictor, one outcome, five mediators, example for time point 1. (n) Model comparison for original and alternative model. (o) Overview of the model fit indices separated by exogeneous latent variable and time point.
- https://cdn.elifesciences.org/articles/75893/elife-75893-supp1-v1.docx
-
Transparent reporting form
- https://cdn.elifesciences.org/articles/75893/elife-75893-transrepform1-v1.pdf
Download links
A two-part list of links to download the article, or parts of the article, in various formats.
Downloads (link to download the article as PDF)
Open citations (links to open the citations from this article in various online reference manager services)
Cite this article (links to download the citations from this article in formats compatible with various reference manager tools)
Investigating the relationship of COVID-19 related stress and media consumption with schizotypy, depression, and anxiety in cross-sectional surveys repeated throughout the pandemic in Germany and the UK
eLife 11:e75893.
https://doi.org/10.7554/eLife.75893


