Human visual gamma for color stimuli
- Ernst Strüngmann Institute (ESI) for Neuroscience in Cooperation with Max Planck Society, Germany
- International Max Planck Research School for Neural Circuits, Germany
- Brain Imaging Center, Goethe University Frankfurt, Germany
- Department of Psychology, Goethe University Frankfurt, Germany
- Donders Institute for Brain, Cognition and Behaviour, Radboud University Nijmegen, Netherlands
Figures
Figure 1
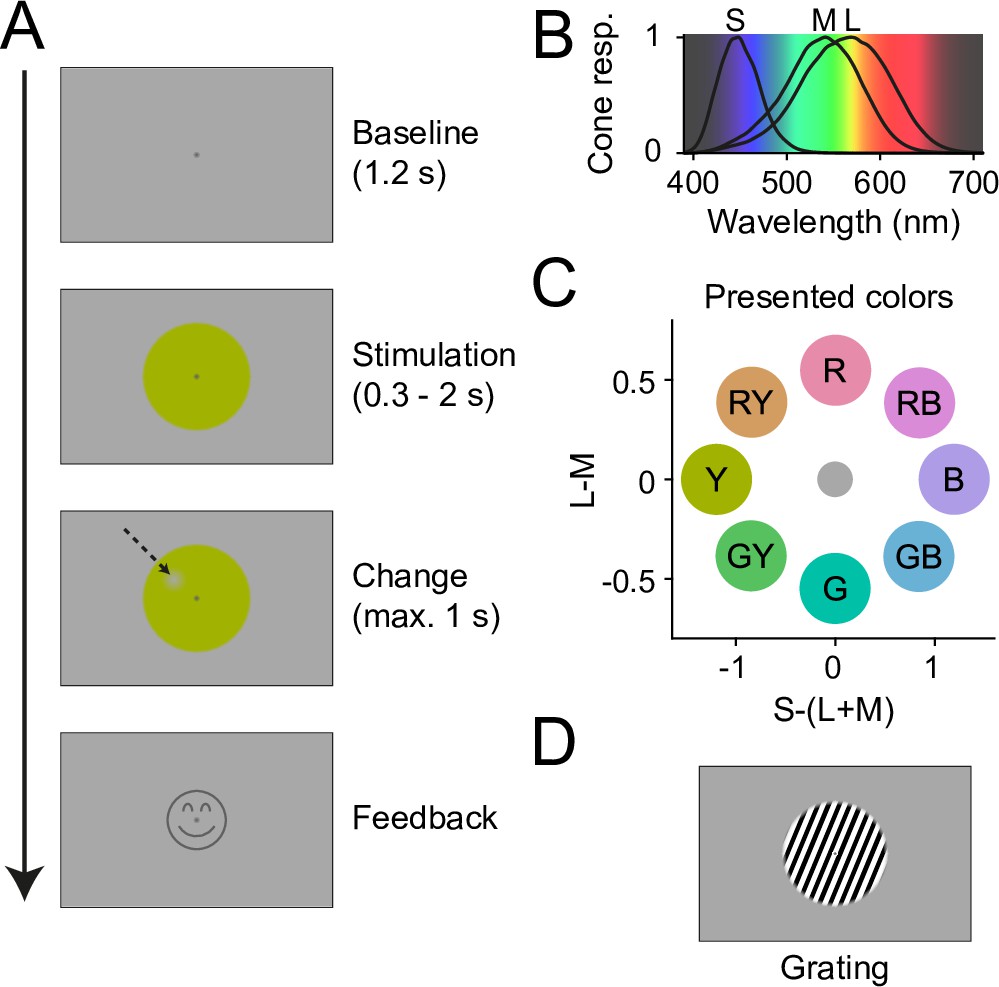
Experiment design.
(A) Temporal structure of one trial. After fixation onset, a gray baseline was shown for 1.2 s, followed by 0.3–2 s of stimulation with a stimulus disk. Then, a change spot appeared at a random position on the disk (indicated here with an arrow, not visible in the actual experiment), which the participants needed to report. Upon correct report, a smiley was shown. (B) Human cone sensitivity spectra (Stockman and Sharpe, 2000) plotted on an estimate of perceptual wavelength color. (C) DKL coordinates for all eight stimulus colors shown in this study, relative to the background. Letters indicate stimulus labels used in Results. Note that color hues of these color disks, when displayed on a noncalibrated monitor or printout, will not fully correspond to the hues shown in the study. (D) To compare the strength of induced gamma responses between color and grating stimuli, some trials showed a grating instead of a color stimulus.
-
Figure 1—source data 1
Stimulus color coordinates.
DKL- (relative to gray background), CIELAB- (relative to standard illuminant D65), and cone-contrast coordinates of the stimuli and the background shown in this study.
- https://cdn.elifesciences.org/articles/75897/elife-75897-fig1-data1-v2.xlsx
Figure 2 with 1 supplement
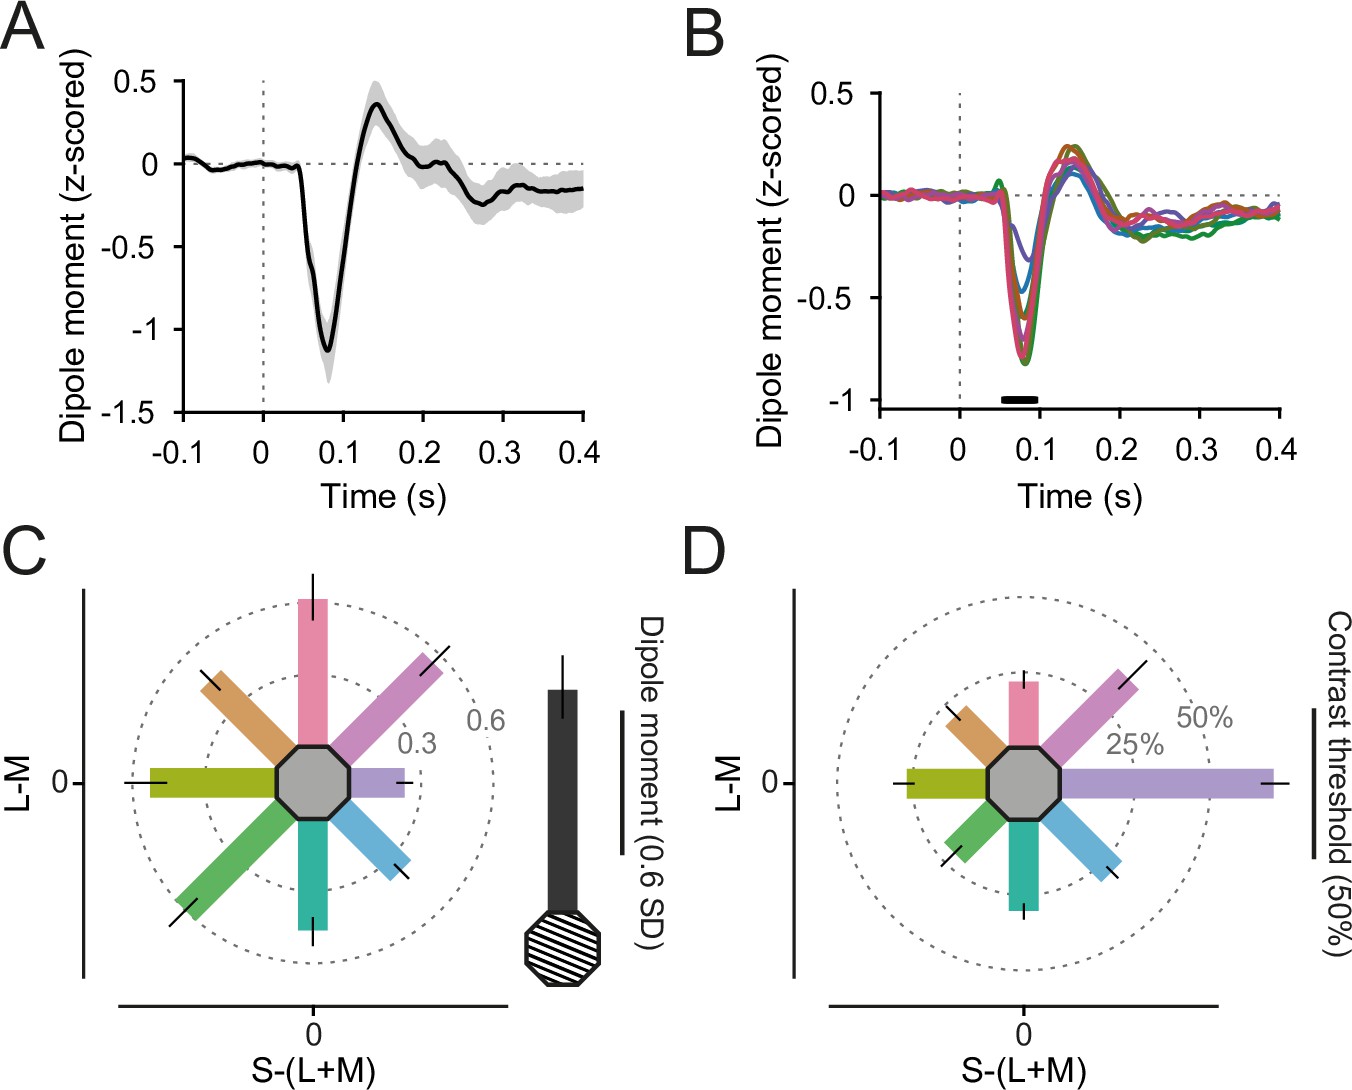
Event-related field (ERF) responses.
(A) Grating-evoked ERF, averaged over V1 dipoles and participants. Error region shows 95% CI over participants. (B) Color-evoked ERFs, averaged over V1 dipoles and participants. Black bar indicates significant differences across colors, tmax corrected for multiple comparisons. Line colors reflect stimulus colors, but have been darkened for readability. (C) ERF N70 dipole moment (relative to baseline variability), averaged over V1 dipoles and participants. Error bars represent 95% CIs over participants, bar orientation represents stimulus orientation in DKL space. In gray, the average grating-induced ERF dipole moment is shown for comparison. (D) Average relative contrast steps toward the background color needed to achieve 85% target detection accuracy for all stimuli. Error bars represent 95% CIs over participants, bar orientation represents stimulus orientation in DKL space. For C, D, the length of the scale bar corresponds to the distance from the edge of the hexagon to the outer ring.
Figure 2—figure supplement 1
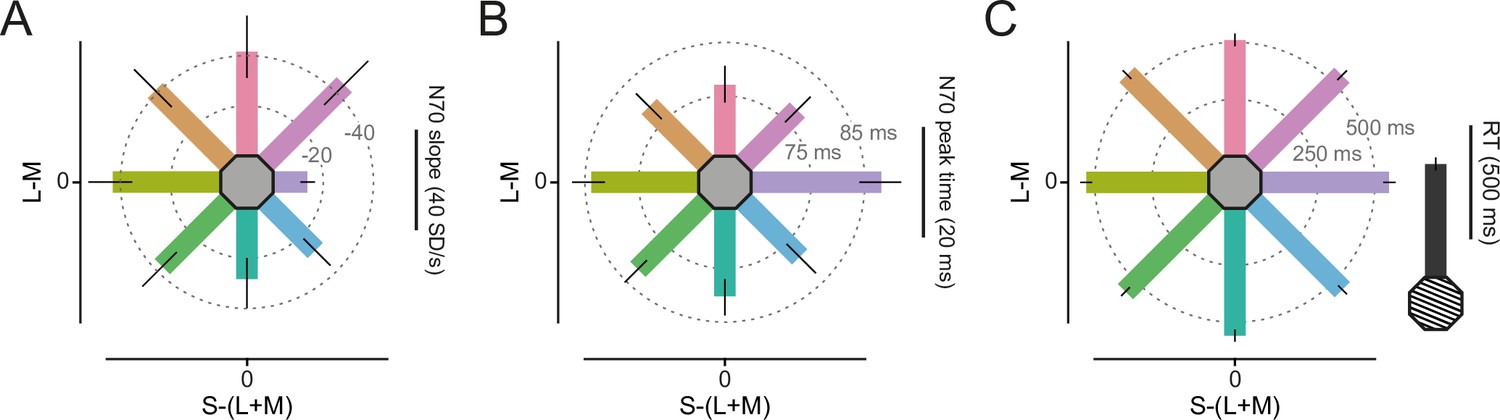
Event-related field (ERF) and reaction time results.
(A) Average prepeak slope of the N70 ERF component (extracted from 2 to 12 ms before per-color, per-participant peak time) for all colors. (B) Average peak time of the N70 ERF component for all colors. (C) Average reaction times for all stimuli. For panels A–C, error bars represent 95% CIs over participants, bar orientation represents stimulus orientation in DKL space. The length of the scale bar corresponds to the distance from the edge of the hexagon to the outer ring.
Figure 3 with 3 supplements

Gamma-band responses.
(A) Stimulus-induced power changes over baseline for one example participant that showed strong gamma-band responses (averaged over V1 dipoles). Top: grating-induced power changes. Error region shows 95% CI over trials. Bottom: color-induced power changes. (B) Same as A, but averaged over participants. Error region shows 95% CI over participants. (C) Same as B, but peak-aligned before averaging. For A–C, line colors reflect stimulus colors, but have been darkened for readability. (D) Average stimulus-induced power change in V1 as a function of time and frequency. Top: for grating stimuli. Bottom: for green stimuli. (E) Average stimulus-induced gamma-power change (individual gamma peak ±10 Hz) for all stimuli. Error bars represent 95% CIs over participants, bar orientation represents stimulus orientation in DKL space. In gray, the average grating-induced gamma-power strength is shown for comparison. The length of the scale bar corresponds to the distance from the edge of the hexagon to the outer ring. (F) Gamma-peak frequencies of the first and second gamma peak for all participant–color combinations in which a first and a second gamma peak was found. Dot color corresponds to stimulus color. Dotted line indicates the expected frequency relationship, if first and second peak frequencies were harmonics of each other. (G) The inflated template brain. Black-to-white shading indicates areas V1, V2, V3, and V4. (H) Average stimulus-induced gamma-power change (individual gamma peak ±10 Hz), source projected to all cortical dipoles. Values are significance masked using false discovery rate control (Benjamini and Yekutieli, 2001), black-to-white shading indicates areas V1, V2, V3, and V4. All panels show power change 0.3–1.3 s after stimulus onset, relative to baseline.
Figure 3—figure supplement 1
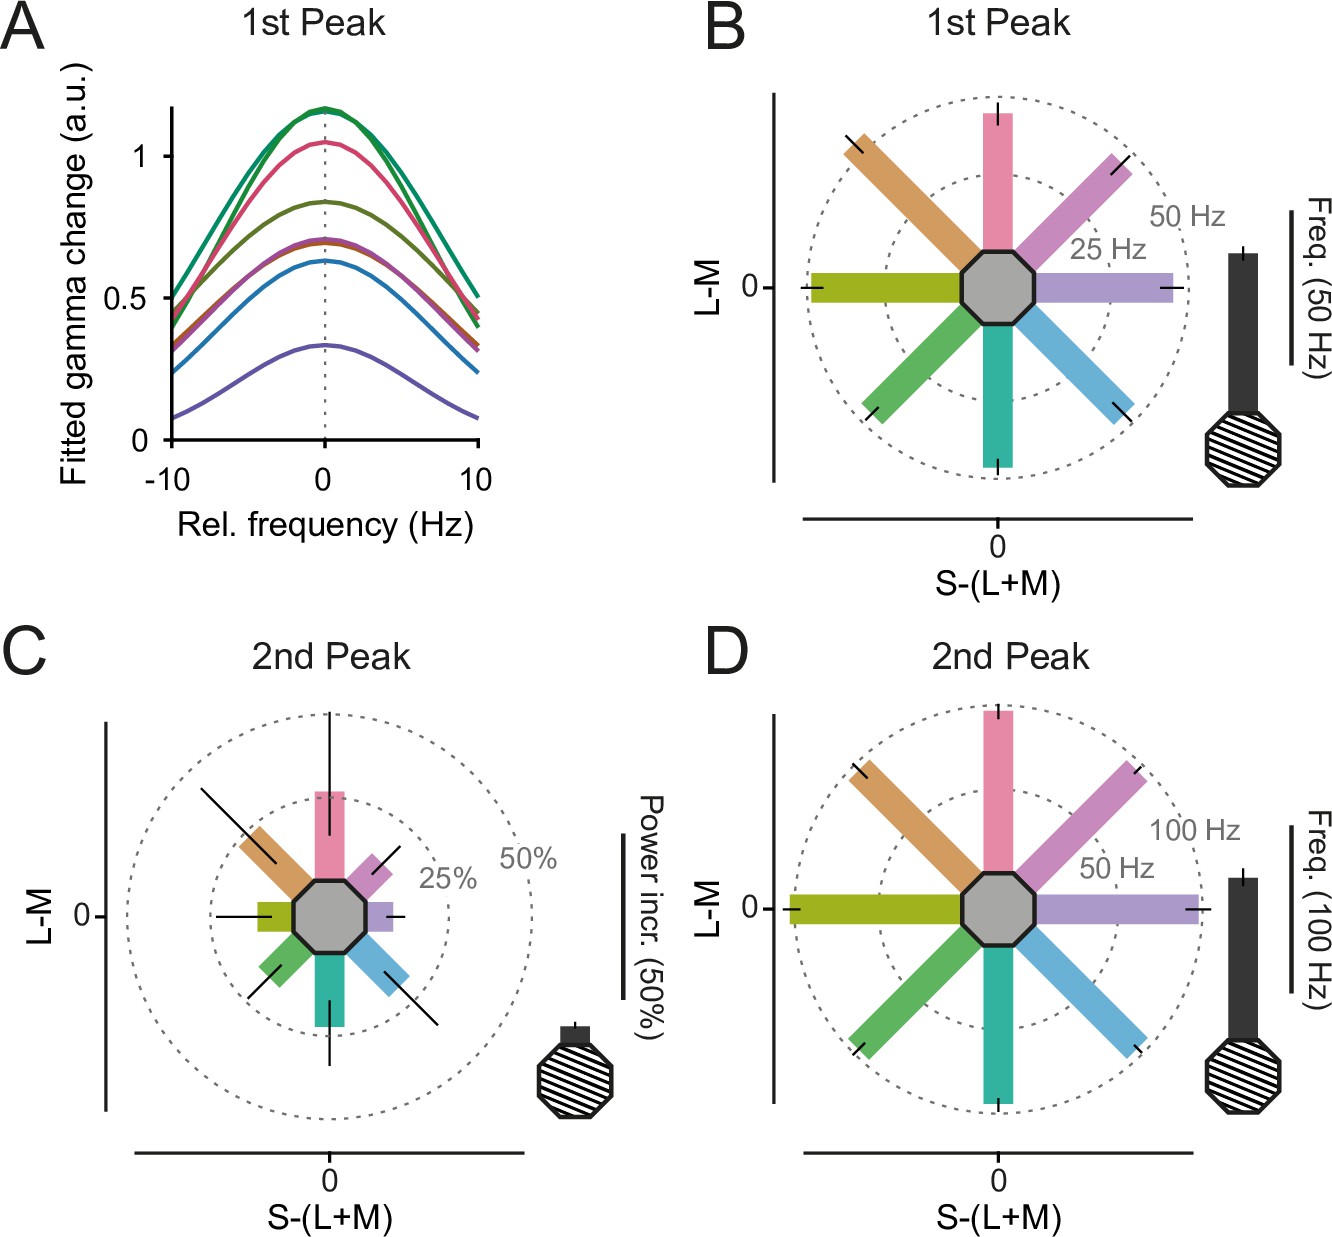
Spectral measures.
(A) Per participant, per color, the induced gamma-power change peak in dB was fitted with a Gaussian added to an offset (for full description, see Methods). Plotted is the resulting Gaussian, with peak power and variance averaged over participants. (B) Average induced gamma-peak frequency of the lower gamma peak for all stimuli. Bar orientation represents stimulus orientation in DKL space. In gray, the same is shown for the grating stimulus. (C) Same as B, but for stimulus-induced power at the upper gamma-peak frequency. (D) Same as B, but for the upper gamma-peak frequency. In panels B–D, error bars represent 95% CIs over participants and the length of the scale bar corresponds to the distance from the edge of the hexagon to the outer ring.
Figure 3—figure supplement 2
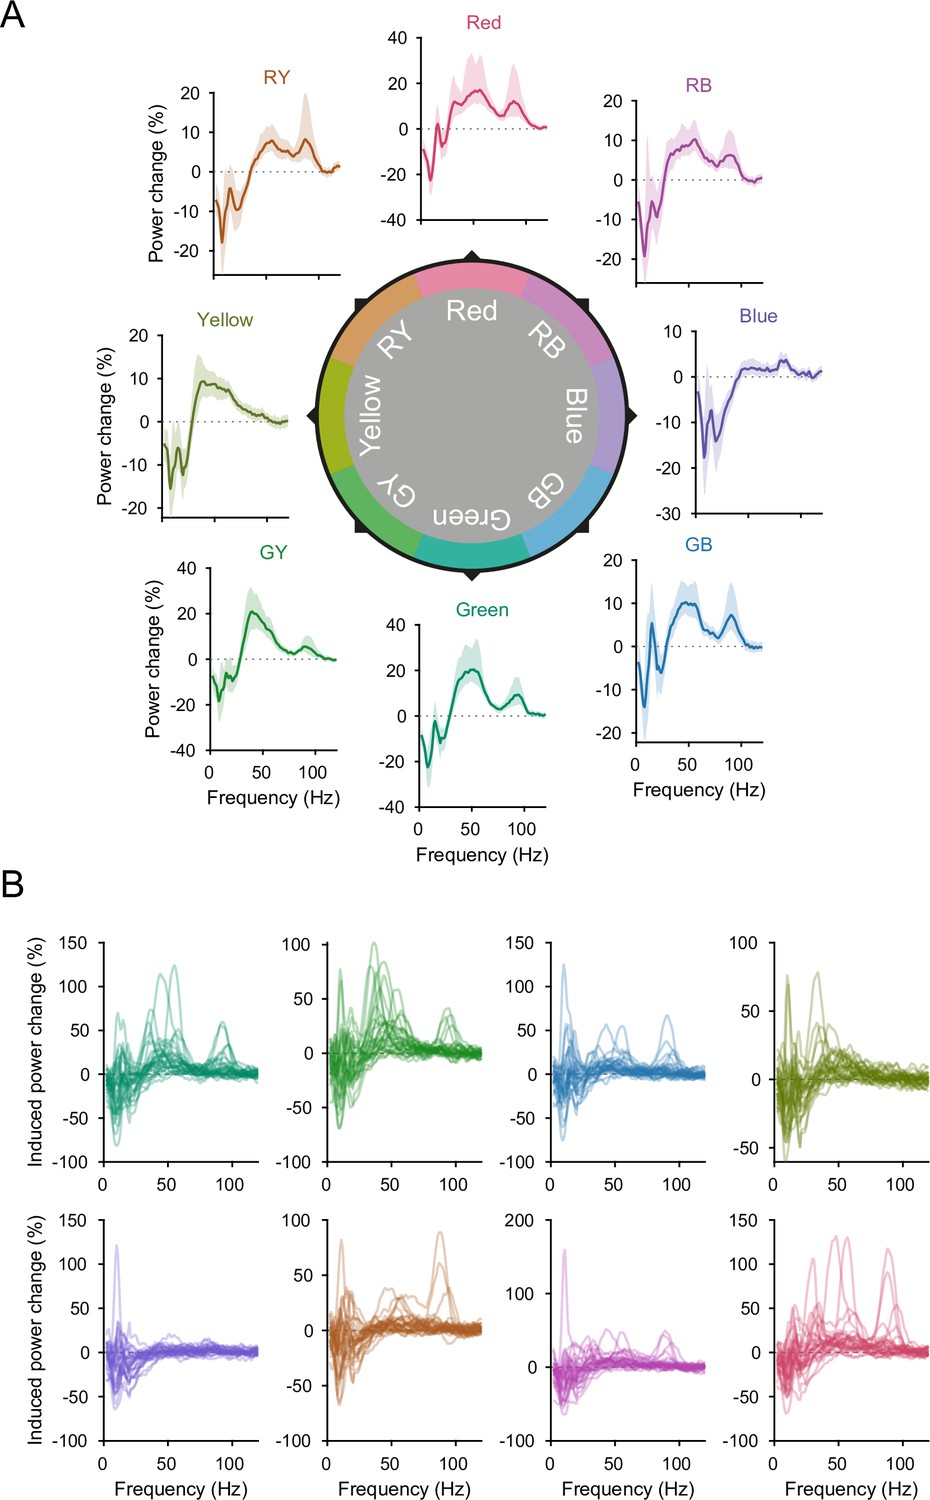
Individual spectra.
(A) Per-color average induced power-change spectra. Banding shows 95% confidence intervals over participants. Note that the y-axis varies between colors. (B) Stimulus-induced power changes over baseline (averaged over V1 dipoles) for all 30 participants and the eight presented colors.
Figure 3—figure supplement 3
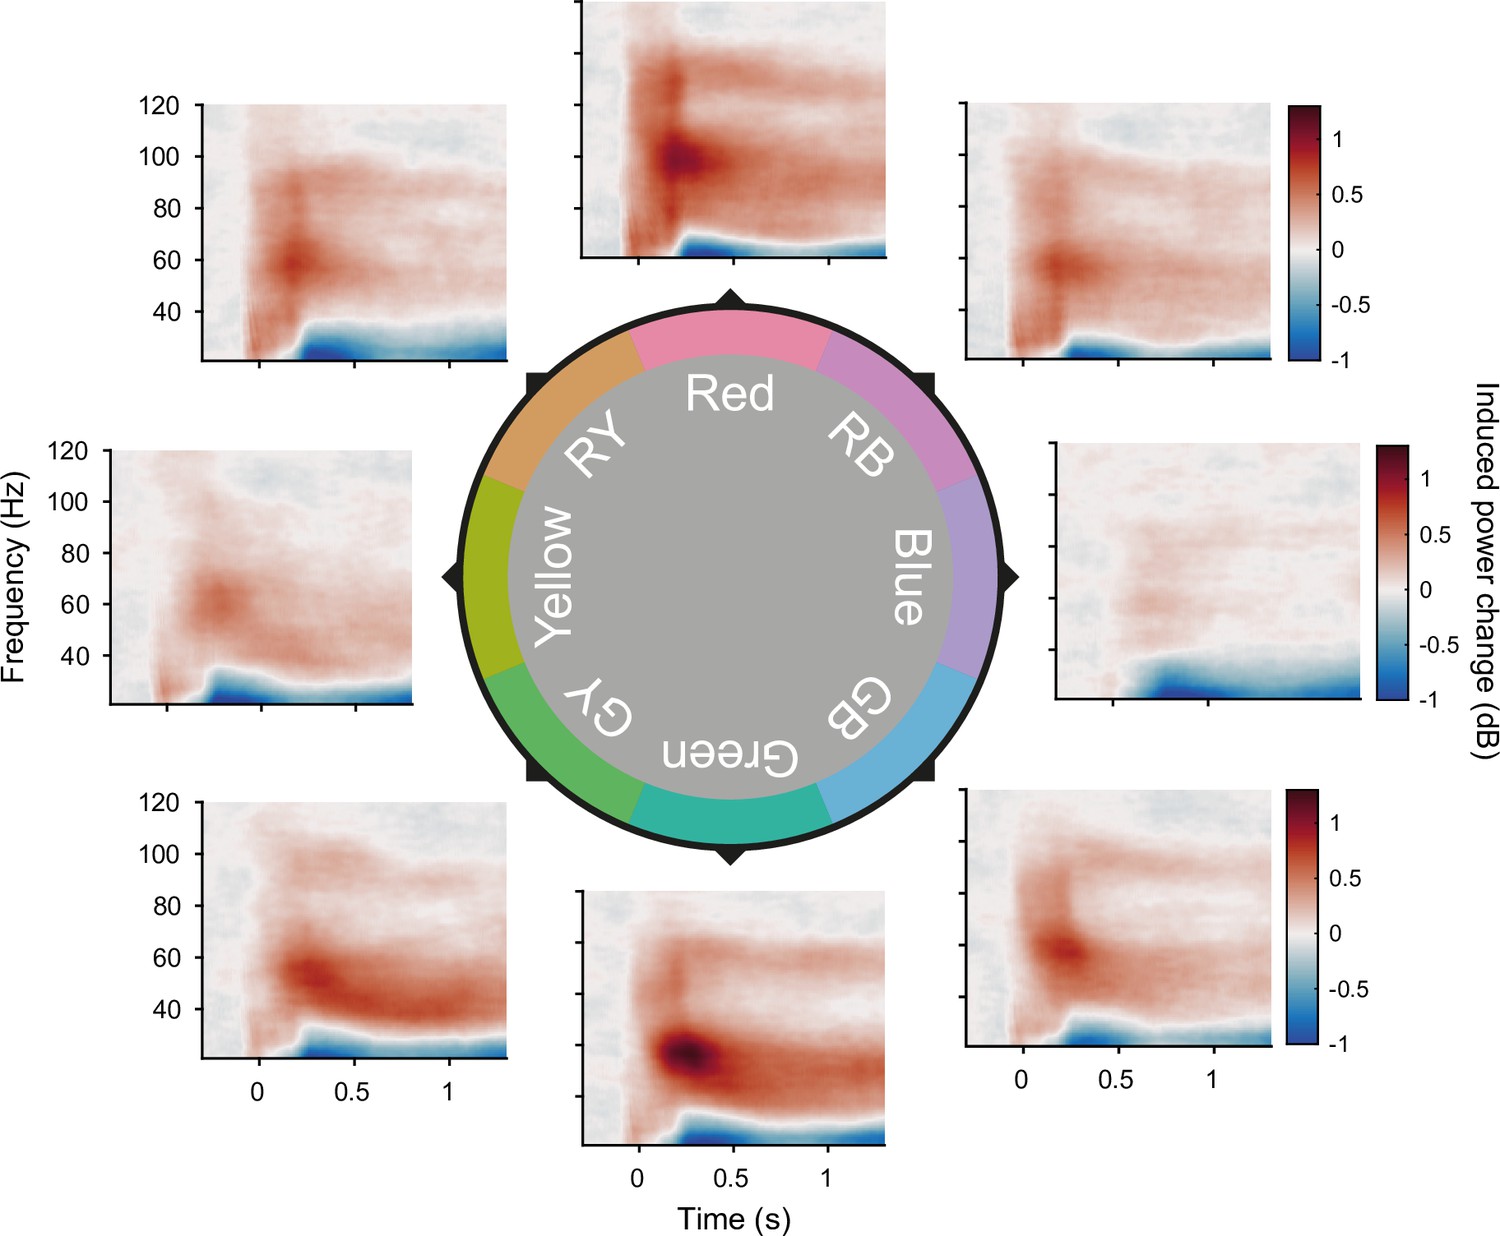
Per-color time–frequency responses.
Average stimulus-induced power change in V1 as a function of time and frequency, plotted for each color.
Figure 4

Correlations between event-related field (ERF), induced power spectra, and performance.
(A) Per-timepoint correlation, across colors, between V1 ERF dipole moment (averaged over trials and dipoles) and 85% accuracy threshold. The correlation was first calculated per participant and then averaged over participants. Error bands represent 95% CIs over participants. In gray, the average ERF dipole moment timecourse over color stimuli is shown for comparison. Horizontal blue bar represents significant correlation values (multiple comparison-corrected using tmax correction). (B) Same as A, but for the stimulus-induced V1 power change spectra instead of the ERFs. (C) Correlation, across colors, between V1 ERF dipole moment and V1 stimulus-induced power change, as a function of ERF time and spectral frequencies. The correlation was first calculated per participant and then averaged over participants. Significant correlation values (multiple comparison corrected using tmax correction) are indicated by green dots.
Additional files
Download links
A two-part list of links to download the article, or parts of the article, in various formats.
Downloads (link to download the article as PDF)
Open citations (links to open the citations from this article in various online reference manager services)
Cite this article (links to download the citations from this article in formats compatible with various reference manager tools)
Human visual gamma for color stimuli
eLife 11:e75897.
https://doi.org/10.7554/eLife.75897


