Crosstalk between AML and stromal cells triggers acetate secretion through the metabolic rewiring of stromal cells
- Institute of Cancer and Genomic Sciences, University of Birmingham, United Kingdom
- Stem Cells, Ageing and Cancer Research Group, Department of Medical Biology, Faculty of Health Sciences, UiT – The Arctic University of Norway, Norway
- Department of Laboratory Medicine (hematology), Faculty of Applied Medical Sciences. Albaha University, Kingdom of Saudi Arabia, Saudi Arabia
- Centre for Computational Biology, University of Birmingham, United Kingdom
- Institute of Chemistry and Metabolomics, University of Lübeck, Germany
- Department of Medical Laboratories Technology, College of Applied Medical Sciences, Jazan University, Saudi Arabia
- Department of Experimental Hematology, University Medical Center Groningen, University of Groningen, Netherlands
- Department of Medicine, Hematology/Oncology, University Hospital Frankfurt, Goethe University Frankfurt, Germany
- Frankfurt Cancer Institute, Goethe University Frankfurt, Germany
- German Cancer Consortium (DKTK), partner site Frankfurt/Mainz, and German Cancer Research Center (DKFZ), Germany
- Centre for Clinical Haematology, University Hospitals Birmingham NHS Foundation Trust, Queen Elizabeth Hospital, Queen Elizabeth Medical Centre, United Kingdom
Figures
Figure 1 with 2 supplements
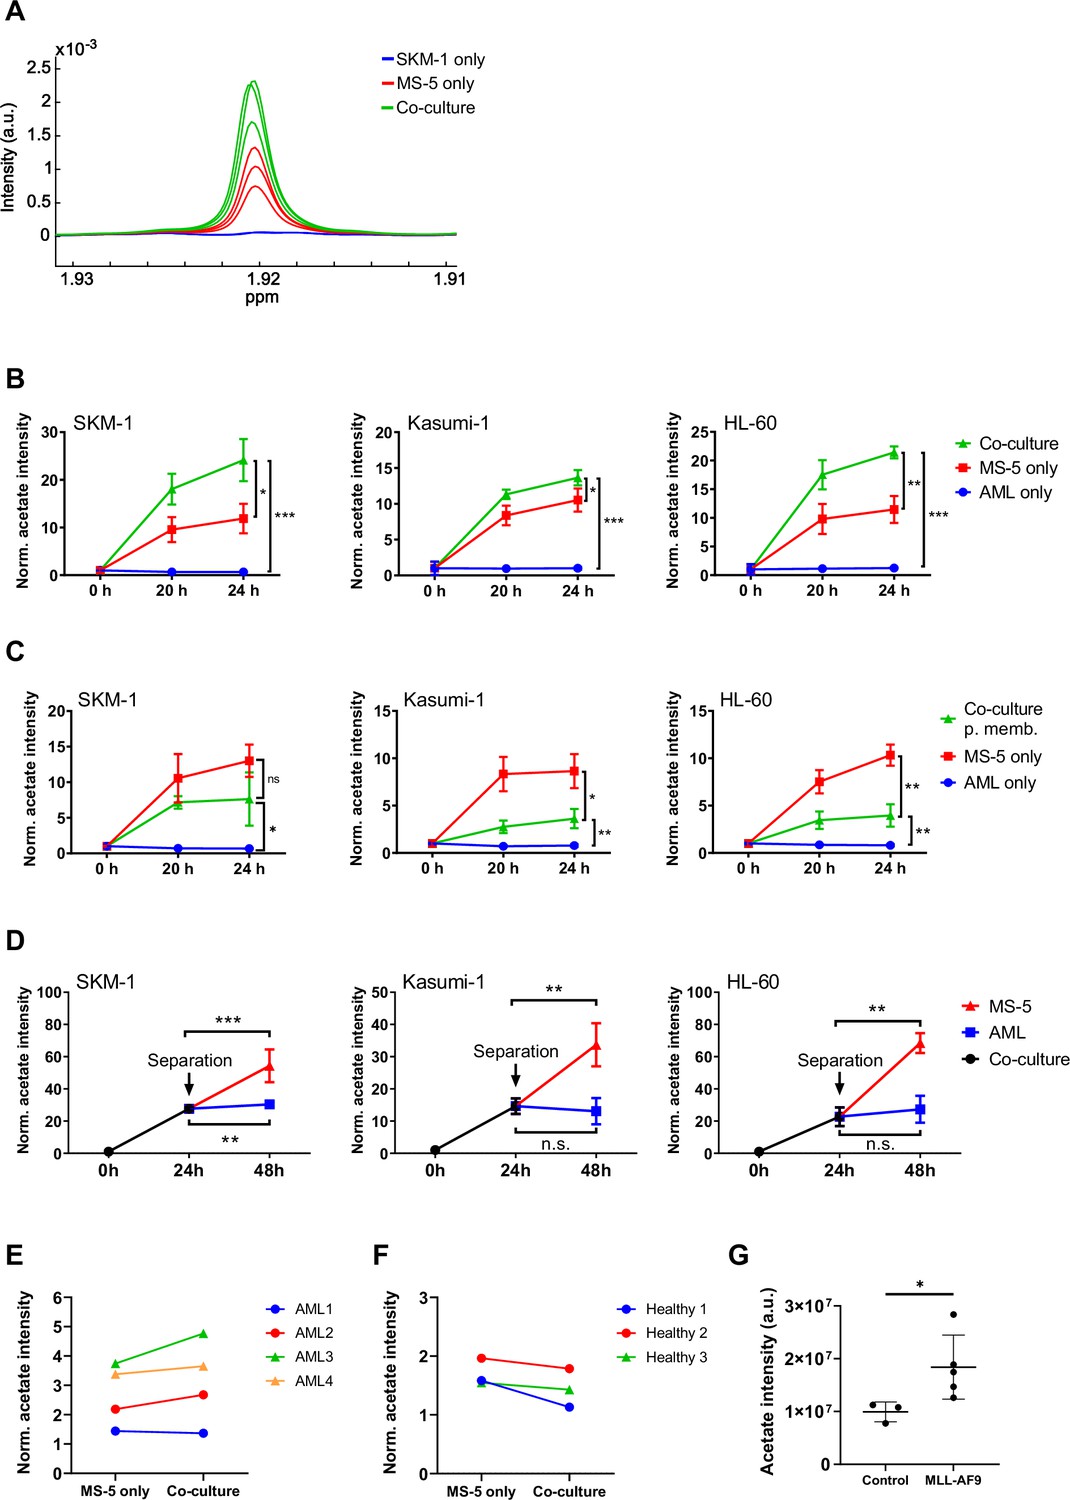
Acetate secretion by stromal cells increases in AML-stroma co-cultures of several AML cell lines and primary AML cells in direct contact.
(A) Section of 1H-NMR spectra, corresponding to the methyl group of acetate, from extracellular medium samples of SKM-1 cells cultured alone (blue), MS-5 cells cultured alone (red) and SKM-1 and MS-5 cells in co-culture (green) after 24 hours. (B) Extracellular acetate levels in AML cell lines (SKM-1, Kasumi-1 and HL-60) cultured alone (blue), MS-5 cells cultured alone (red) and AML and MS-5 cells in co-culture in direct contact (green) at 0, 20 and 24 hours of incubation. Each point represents the mean of n=3 independent experiments and error bars represent standard deviations. (C) Extracellular acetate levels in AML cell lines cultured alone (blue), MS-5 cells cultured alone (red) and AML and MS-5 cells in co-culture separated by a 0.4 µm permeable membrane (green) at 0, 20, and 24 hr of incubation. Each point represents the mean of n=3 independent experiments and error bars represent standard deviations. (D) Extracellular acetate levels in AML cell lines and MS-5 cells in co-culture (black) for 24 hr and after being separated and cultured alone in the same medium until 48 hr (blue for AML and red for MS-5). Each point represents the mean of n=3 independent experiments and error bars represent standard deviations. (E) Extracellular acetate levels in MS-5 cells cultured alone and primary patient-derived AML cells co-cultured with MS-5 cells at 48 hr. Each set of points represents an independent experiment (n=4). (F) Extracellular acetate levels in MS-5 cells cultured alone and healthy donor-derived peripheral blood mononuclear CD34+ (PBMC) cells co-cultured with MS-5 cells at 48 hr. Each set of points represents an independent experiment (n=3). For E and F, symbols (circles or triangles) indicate same cell culture medium composition was used. (G), Acetate levels in bone marrow extracellular fluid of C57BL6/J mice 6 months after transplantation with bone marrow nucleated cells isolated from control or MLL-AF9 transgenic mice. For B, C, and D unpaired Student’s t-tests were applied for each condition (black brackets) for G a Mann-Whitney test was applied (black brackets). p-values are represented by n.s. for not significant * for p-value <0.05, ** for p-value <0.01 and *** for p-value <0.001.
-
Figure 1—source data 1
Values and stats for panels included in Figure 1.
- https://cdn.elifesciences.org/articles/75908/elife-75908-fig1-data1-v4.xlsx
Figure 1—figure supplement 1
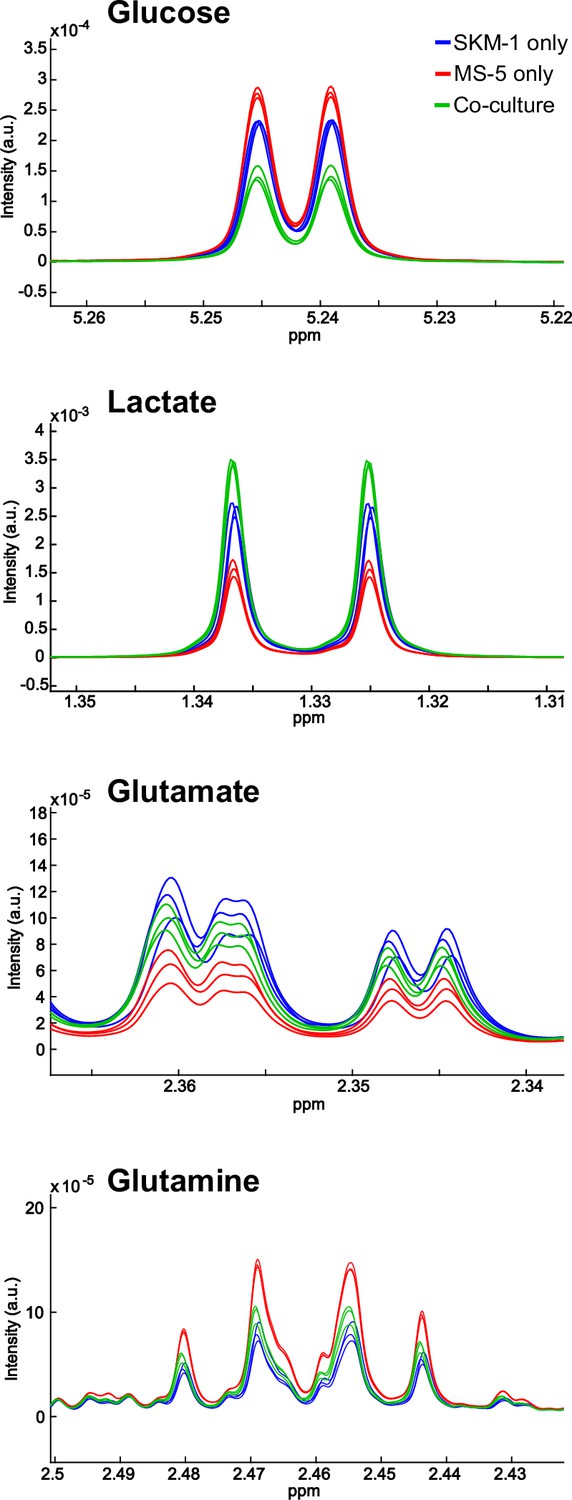
Other extracellular metabolite levels in co-cultures with SKM-1 and MS-5 cells.
Sections of 1H-NMR spectra from extracellular medium samples of SKM-1 cells cultured alone (blue), MS-5 cells cultured alone (red) and SKM-1 and MS-5 cells in co-culture (green) after 24 hr of culture, corresponding to glucose, lactate, glutamate, and glutamine.
Figure 1—figure supplement 2
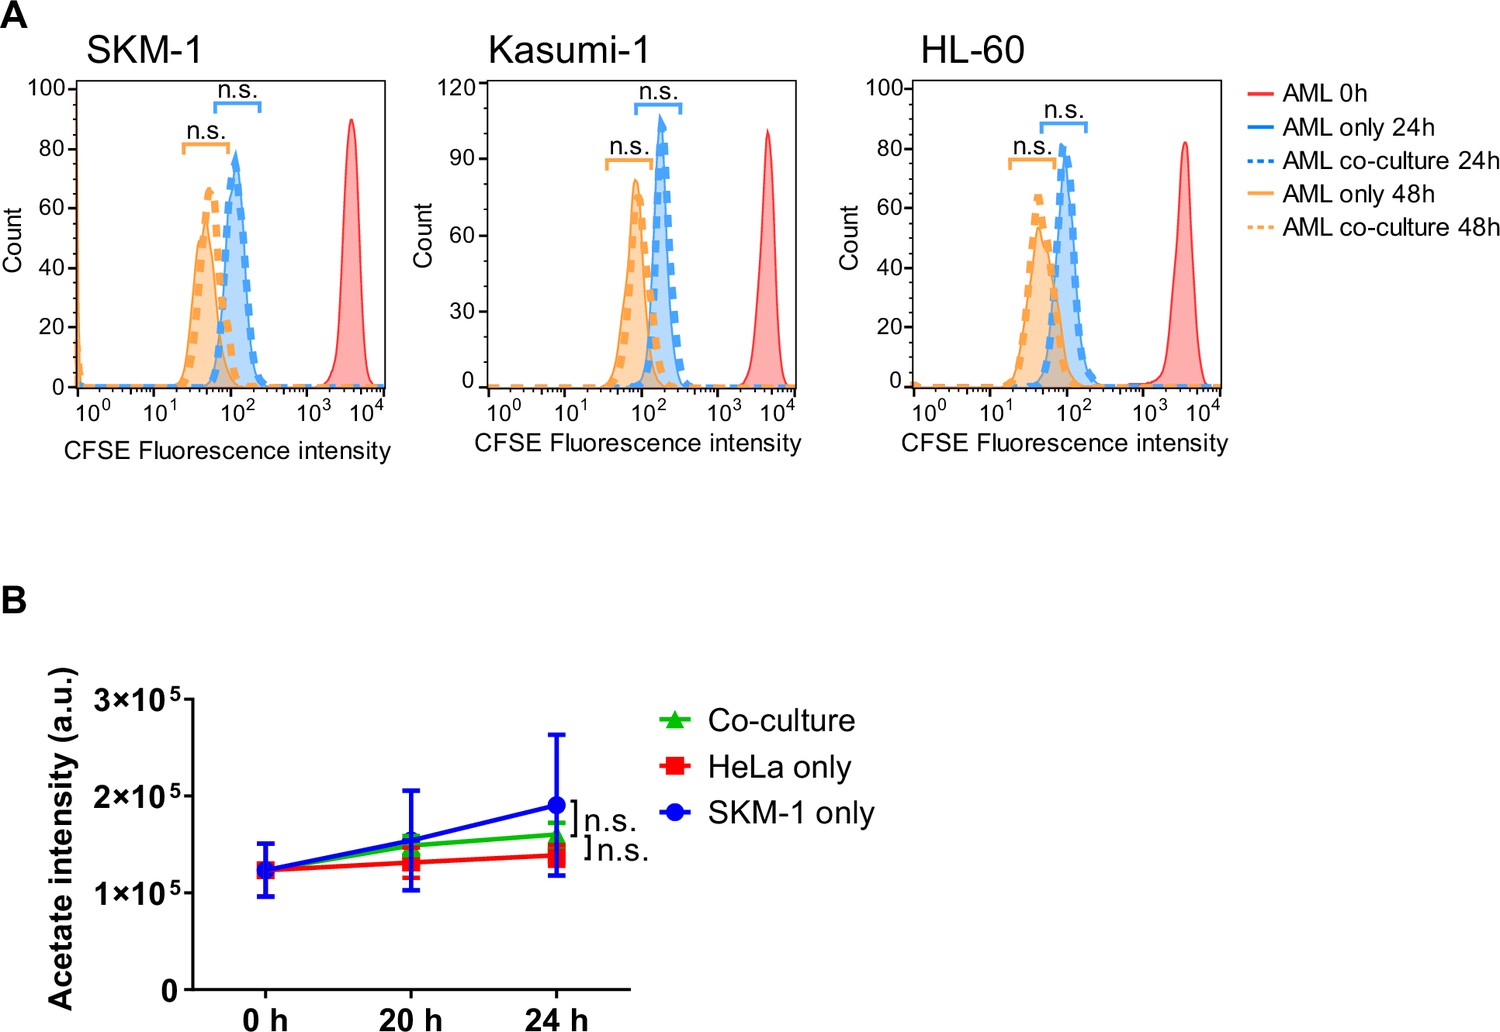
Proliferation in co-culture, co-culturing AML cells with an unrelated cell line (HeLa).
(A) CFSE cell proliferation analysis in AML cell lines alone or in co-culture with MS-5 cells. The population of living cells was gated, and 1500 cells for each condition were randomly selected and plotted. The geometric mean for each population and time point was compared between cells alone or in co-culture by performing an unpaired unpaired Student’s t-test and p-values were represented as n.s. for not significant. Each histogram is representative of n=3 independent experiments. (B), Extracellular acetate levels in SKM-1 cells cultured alone (blue), HeLa cells cultured alone (red) and AML and HeLa cells in co-culture (green) at 0, 20, and 24 hr. Each point represents the mean of n=3 independent experiments and error bars represent standard deviation. An unpaired Student’s t-test was applied for each condition (black brackets) and p-values are represented by n.s. for not significant.
-
Figure 1—figure supplement 2—source data 1
Values obtained for cell proliferation with CFSE in AML cell lines cultured alone vs in coculture (A) and raw extracellular acetate values obtained for SKM-1 grown in cocultured with HeLa cells.
- https://cdn.elifesciences.org/articles/75908/elife-75908-fig1-figsupp2-data1-v4.xlsx
Figure 2 with 5 supplements
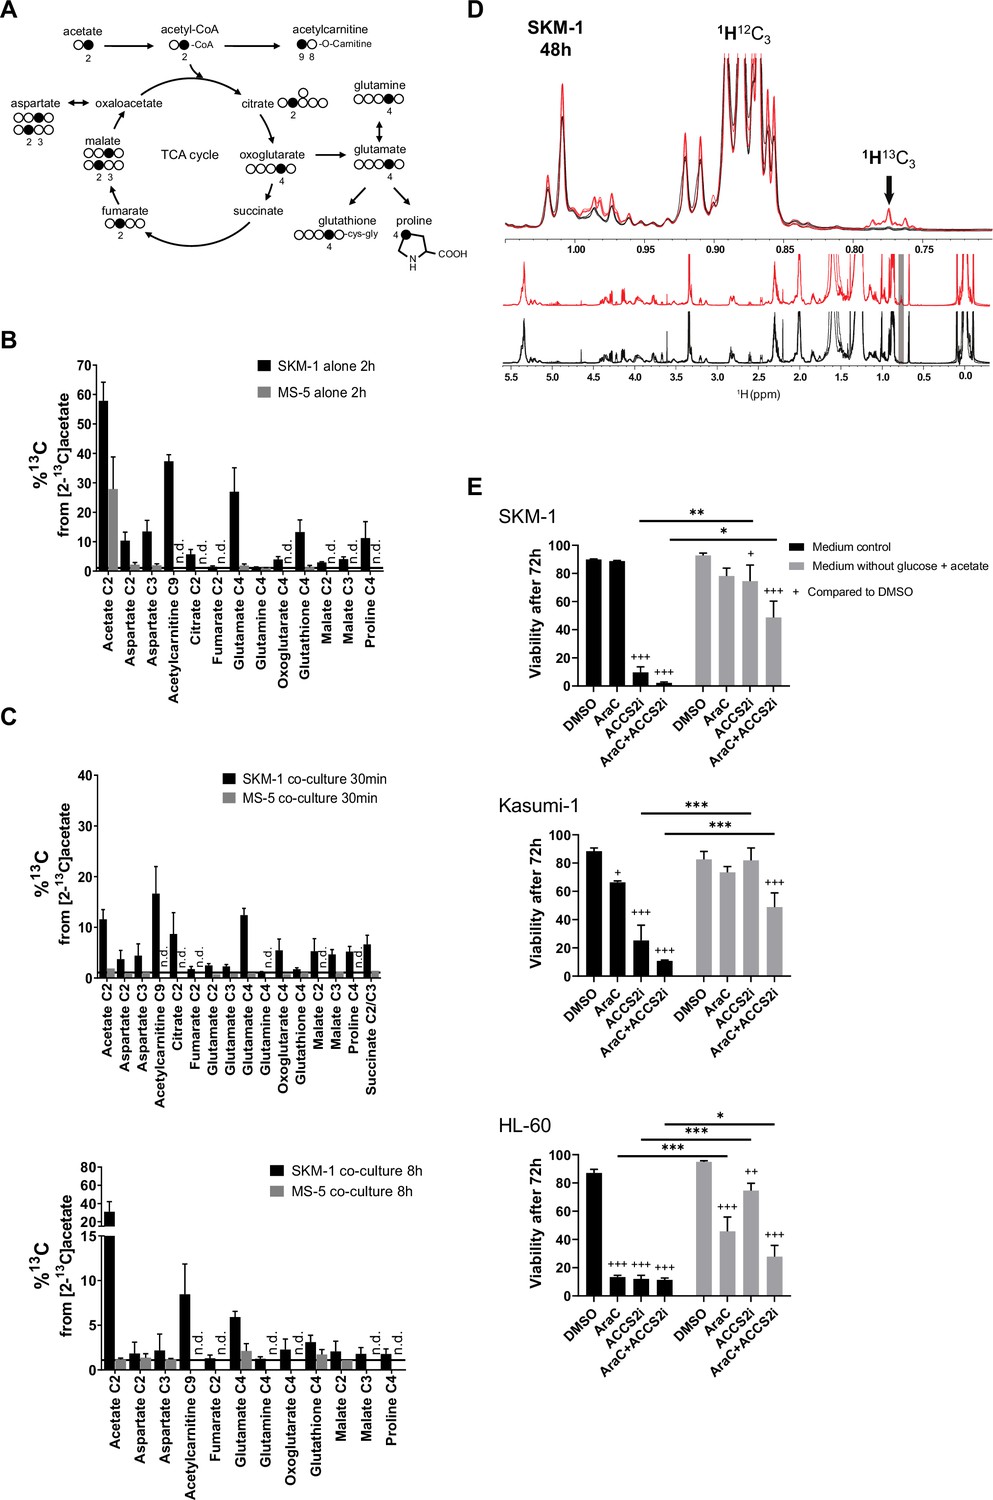
AML cells can import the secreted acetate in co-culture to use it in TCA cycle and lipid biogenesis.
(A) Schematic of label distribution arising from [2-13C]acetate in TCA cycle intermediates. Black circles correspond to positions expected to be labelled. (B) 13C percentages of label incorporation in polar metabolites from labelled acetate in SKM-1 and MS-5 cells after two hours of incubation with [2-13C]acetate (4 mM) derived from 1H-13C-HSQC NMR spectra. Bars represent the mean of the 13C percentages and error bars represent the standard deviations for n=3 independent experiments. (C) 13C percentages on polar metabolites in SKM-1 and MS-5 cells in co-culture. Cells were co-cultured for 24 hr before the addition of extra 4 mM sodium [2-13C]acetate and culture for additional 30 min (upper panel) or 8 hr (lower panel). Bars represent the mean of the 13C percentages and error bars represent the standard deviations of n=3 independent experiments. 13C natural abundance is represented as a black bar at %13C=1.1. (D) 1H 1D NMR of lipids extracted from SKM-1 cells. Cells were co-cultured with MS-5 cells for 24 hr before the addition of extra 4 mM sodium [2-13C]acetate and culture for additional 48 hr. Lower panel represents overlay of spectra (n=3) from cells grown in 12C- and 13C—labelled acetate (black and red, respectively). Upper panel is the zoomed section of the spectra show 1H13C-methyl signal multiplets at 1.05ppm to 0.7pm as indicated by an arrow (the shift of the 1H13C methyl satellite signal is caused by the scalar JCH coupling of 125–128 Hz). (E) Cell viability measured by propidium iodide staining after culturing for 72 hr in glucose-free media containing 4 mM acetate or normal media, in the presence of DMSO, AraC 1 µM, and ACSS2i 20 uM. Bars represent the mean and error bars represent the standard deviations for n=3 independent experiments. A Tukey’s multiple comparison test was performed comparing each treatment and different medium conditions and p-values are represented by n.s. for not significant * for p-value <0.05, ** for p-value <0.01 and *** for p-value <0.001.
-
Figure 2—source data 1
Data and stats for panels included in Figure 2.
- https://cdn.elifesciences.org/articles/75908/elife-75908-fig2-data1-v4.xlsx
Figure 2—figure supplement 1
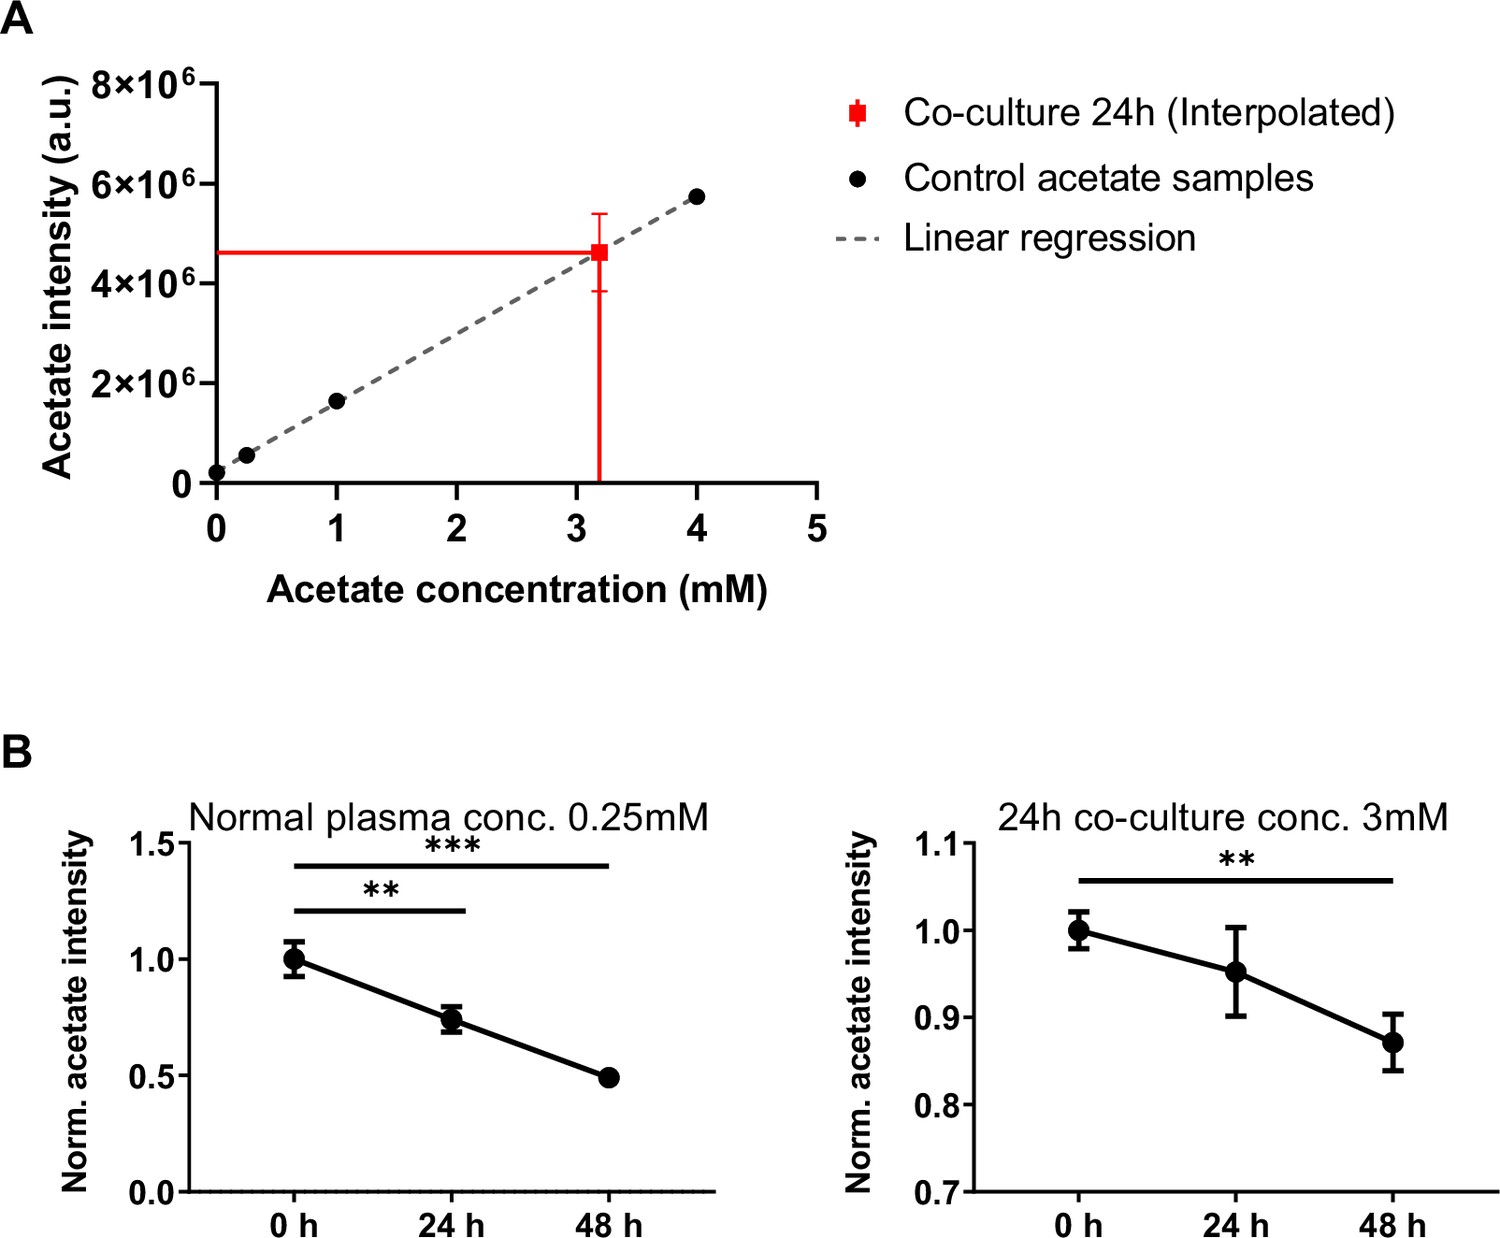
Titration of acetate concentration in co-culture and acetate consumption by AML cells.
(A) Linear regression of acetate concentrations and detected intensities in 1H-NMR spectra (Intensity = 1.38·106±1.6·104 x acetate concentration +2.27·105±3.3·104; R2=0.9987). The intensities detected in samples of co-culture were interpolated to obtain the estimate acetate concentration in co-culture (3.09 mM). Each point represents the mean of n=3 independent experiments and error bars represent standard deviation. (B) Extracellular acetate levels in SKM-1 cells cultured with 0.25 mM and 3 mM acetate medium after 0, 24, and 48 hrs. Each point represents the mean of n=3 independent experiments and error bars represent standard deviation. An unpaired Student’s t-test was applied for each condition (black brackets) and p-values are represented by * for p-value <0.05, ** for p-value <0.01 and *** for p-value <0.001.
-
Figure 2—figure supplement 1—source data 1
Raw values for acetate titration (A) and acetate consumption by SKM1 (B).
- https://cdn.elifesciences.org/articles/75908/elife-75908-fig2-figsupp1-data1-v4.xlsx
Figure 2—figure supplement 2
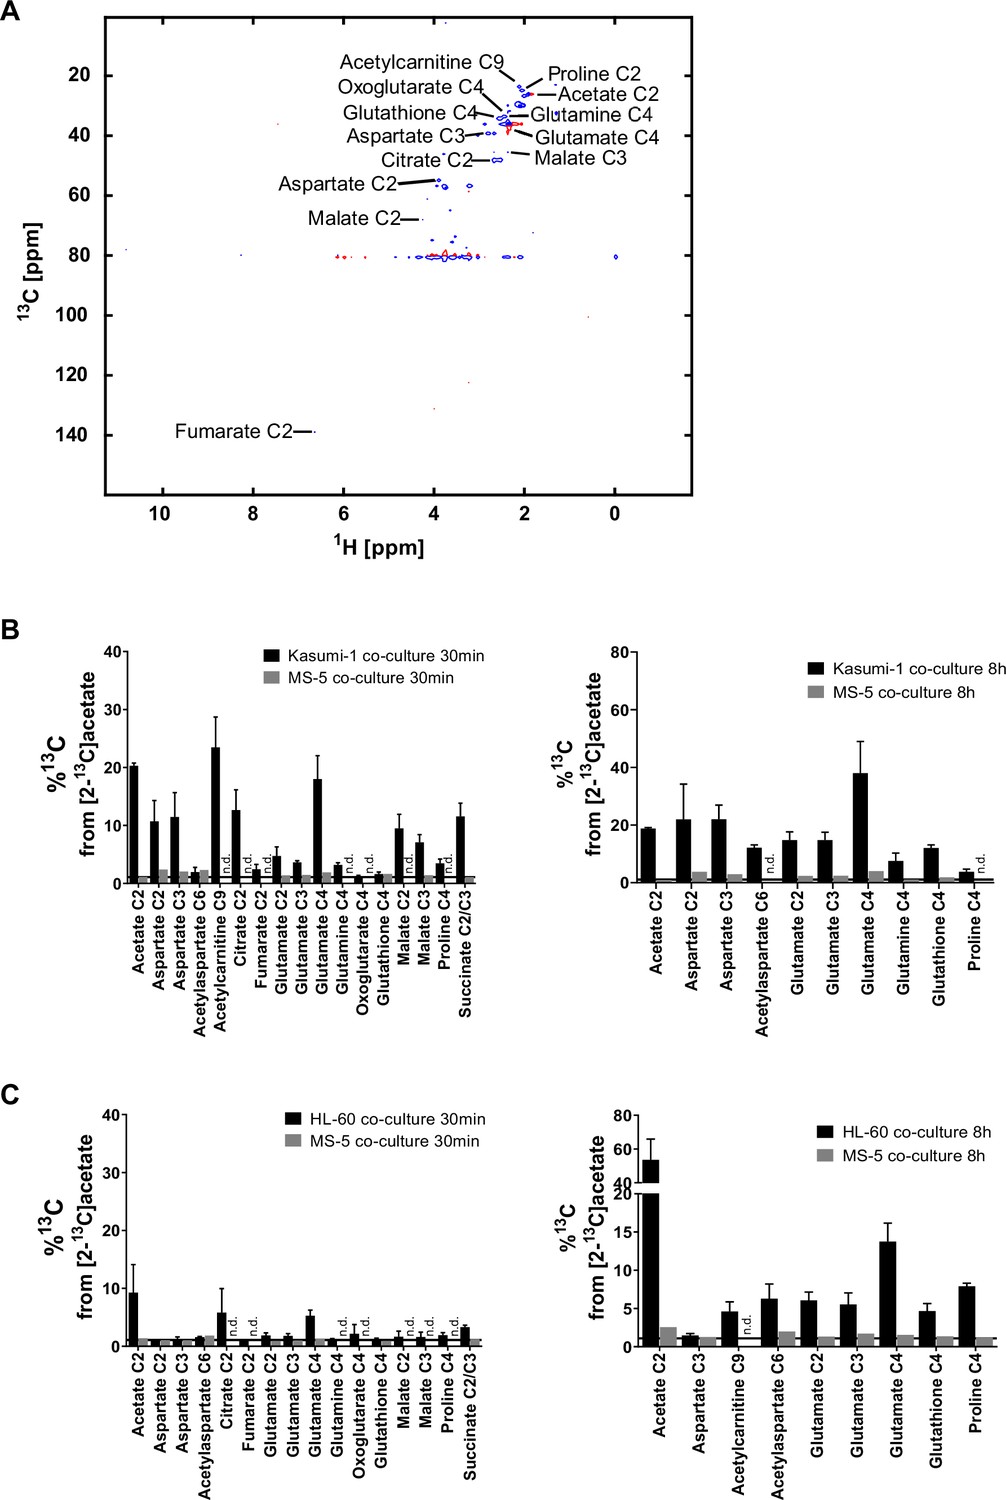
Label incorporation from [2-13C]acetate in SKM-1 and MS-5 cells cultured alone.
(A) Example of metabolites assigned in a 1H-13C-HSQC spectrum from a polar extract from SKM-1 cells cultured with [2-13C]acetate for 2 hr. 13C percentages were calculated in 13 carbons from 11 different metabolites. The exact chemical shifts for each carbon are: acetate C2, 1.91 ppm (1H) – 26.1 ppm (13C); aspartate C2, 3.89 ppm (1H) – 55.0 ppm (13C); aspartate C3, 2.82 ppm (1H) – 39.4 ppm (13C); acetylcarnitine C9, 2.15 ppm (1H) – 23.4 ppm (13C); citrate C2, 2.52 ppm (1H) – 48.2 ppm (13C); fumarate C2, 6.51 ppm (1H) – 138.2 ppm (13C); glutamate C4, 2.34 ppm (1H) – 36.1 ppm (13C); glutamine C4, 2.44 ppm (1H) –33.7 ppm (13C); oxoglutarate C4, 2.43 ppm (1H) – 33.4 ppm (13C); glutathione C4, 2.55 ppm (1H) – 34.2 ppm (13C); malate C2, 4.28 ppm (1H) – 73.2 ppm (13C); malate C3, 2.68 ppm (1H) – 45.4 ppm (13C); and proline C4, 2 ppm (1H) – 26.6 ppm (13C). (B and C), 13C percentages on polar metabolites in Kasumi-1 (B) and HL-60 (C) cells in co-culture with MS-5 cells. Cells were co-cultured for 24 hours before the addition of extra 4 mM sodium [2-13C]acetate and incubated for 30 minutes or 8 hours. Bars represent the mean of the 13C percentages and error bars represent the standard deviation of n=3 independent experiments. 13C natural abundance is represented as a black bar at %13C=1.1.
-
Figure 2—figure supplement 2—source data 1
Raw values for different metabolites showing label incorporation from acetate in coculture 30 min incubation.
- https://cdn.elifesciences.org/articles/75908/elife-75908-fig2-figsupp2-data1-v4.xlsx
Figure 2—figure supplement 3
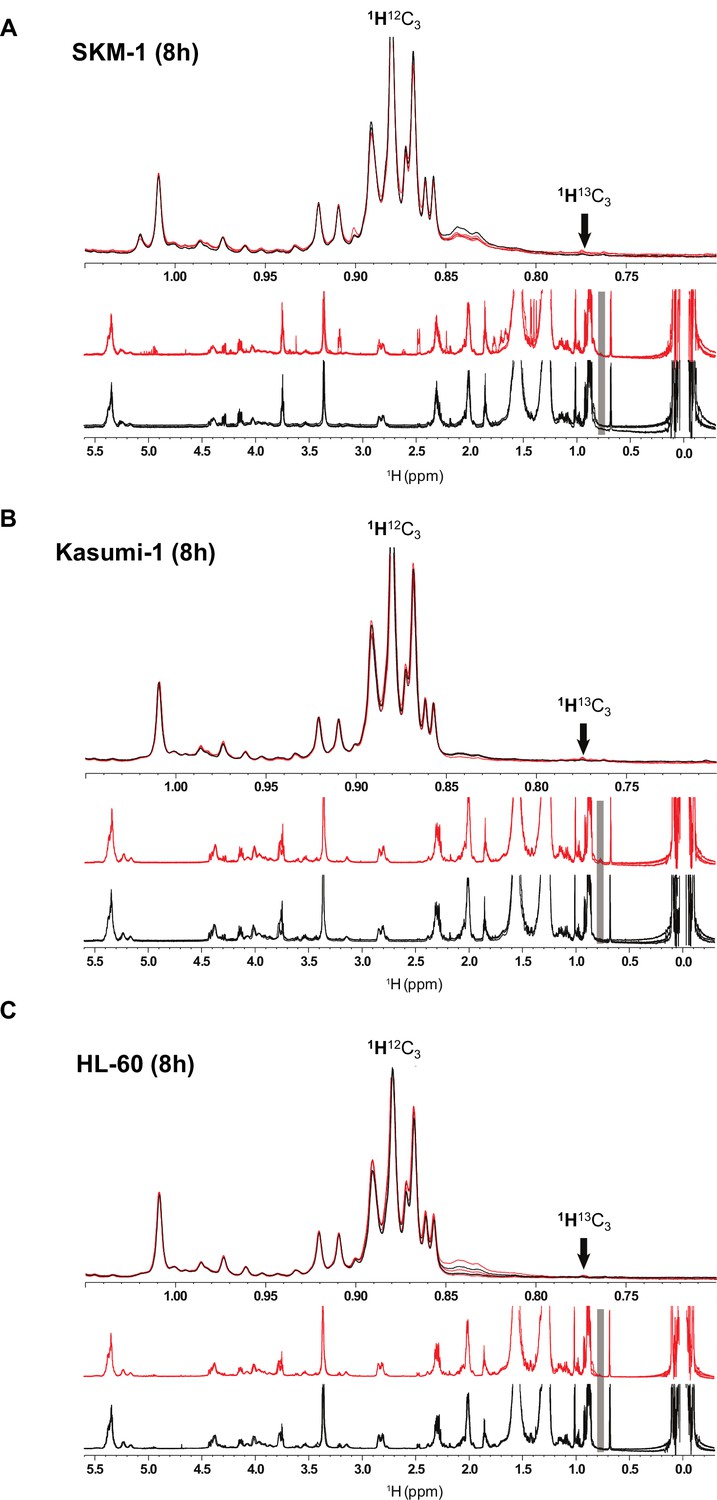
Acetate label incorporation analysis in lipids in AML cells in co-culture after 8 hr of labelling.
1H 1D NMR of lipids extracted from SKM-1 (A), Kasumi-1 (B) and HL-60 (C) cell lines after being in co-culture with MS-5 cells for 24 hr and being labelled with 4 mM acetate for extra 8 hr (n=3). Lower panel represents overlay of spectra (3 batches) from cells grown in 12C- and 13C-labelled acetate for 8 hr, respectively (‘Black’ and ‘Red’). Upper panel is the zoomed section of the spectra (1.05ppm to 0.7ppm) for the lipids extracted from AML cells showing no 1H-13C3 peaks confirming no labelling for the methyl groups.
Figure 2—figure supplement 4
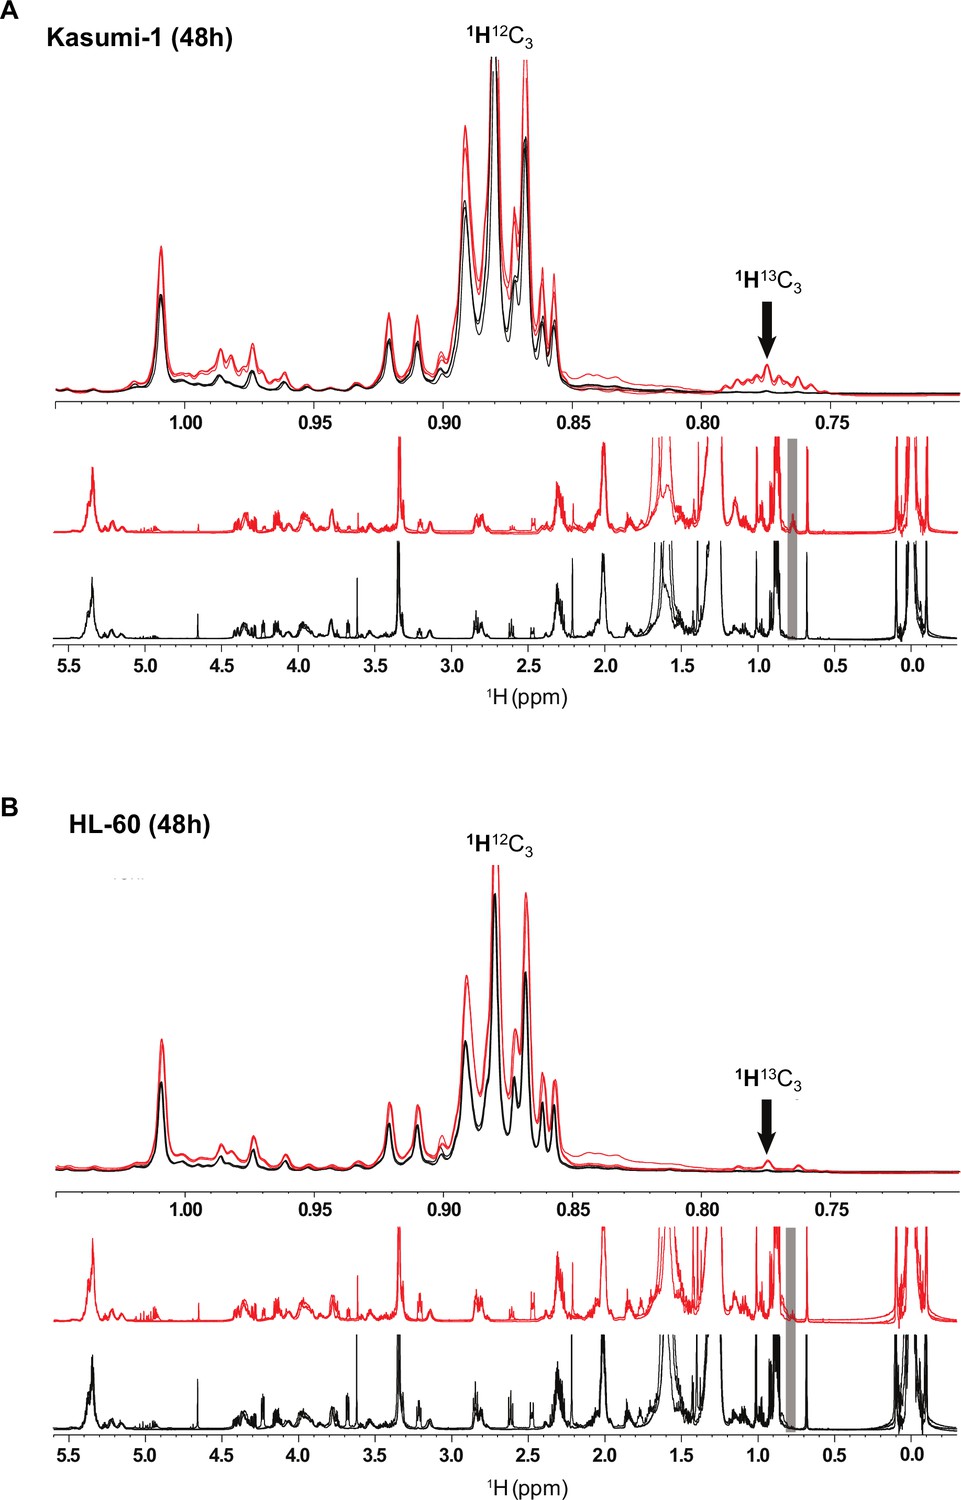
Acetate label incorporation analysis in lipids in AML cells in co-culture after 48 hr of labelling.
1H 1D NMR of lipids extracted from Kasumi-1 (A) and HL-60 (B) cell lines after being in co-culture with MS-5 cells for 24 hr and being labelled with 4 mM acetate for extra 48 hr (n=3). Lower panel represents overlay of spectra (3 batches) from cells grown in 12C- and 13C-labelled acetate for 8 hr, respectively (‘Black’ and ‘Red’). Upper panel is the zoomed section of the spectra (1.05ppm to 0.7ppm) for the lipids extracted from AML cells showing clearly 1H-13C3peaks confirming labelling for the methyl groups.
Figure 2—figure supplement 5
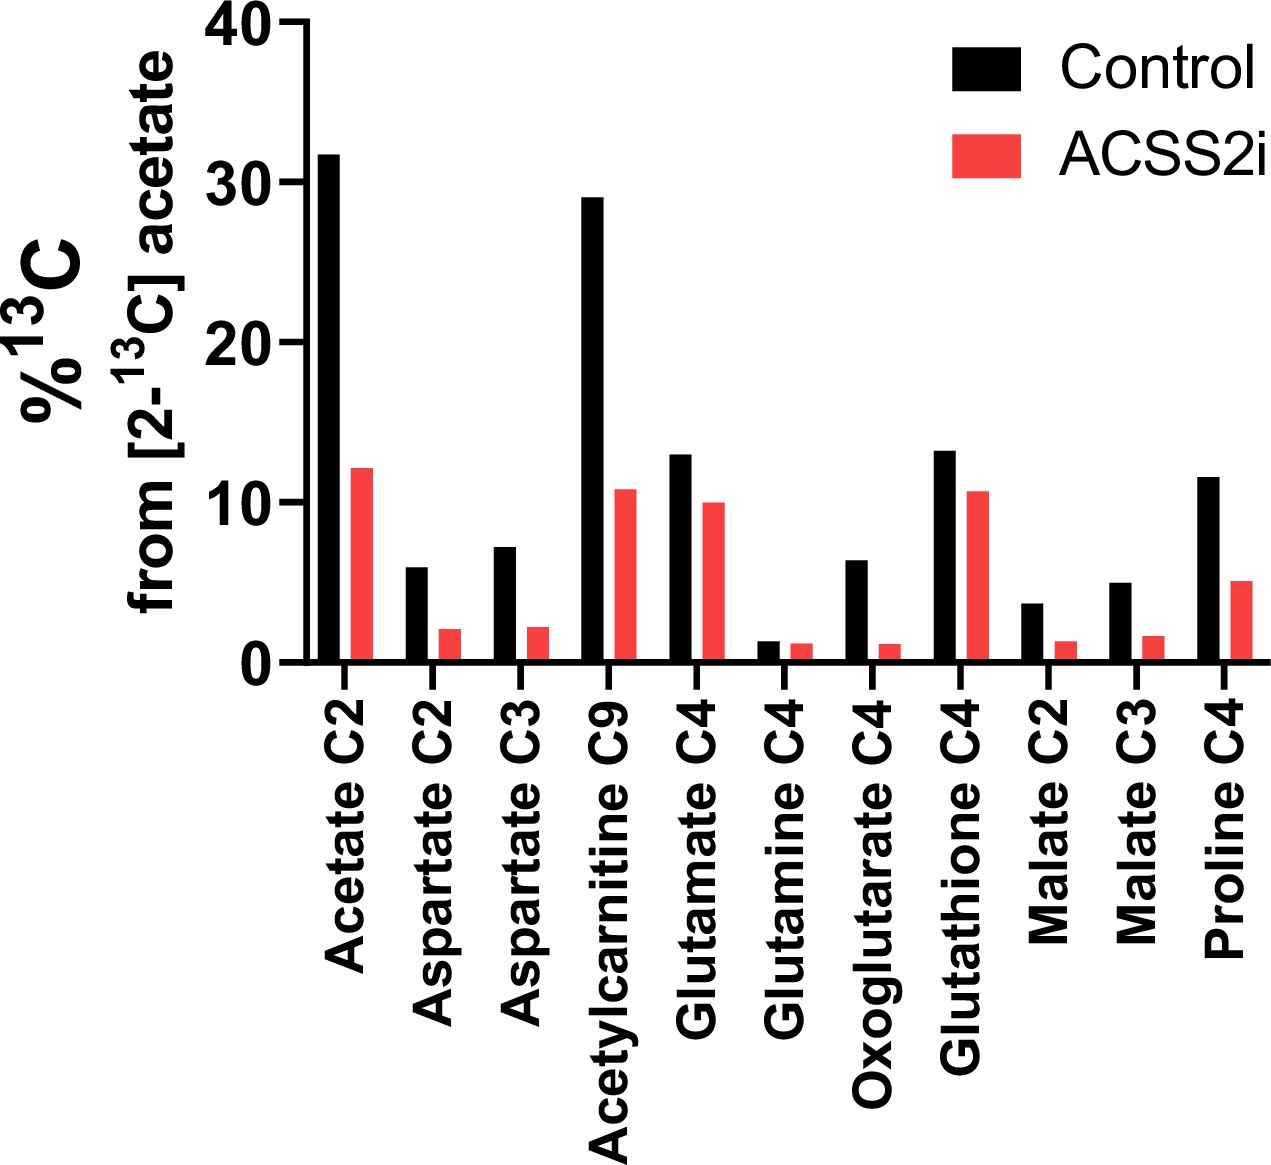
Acetate label incorporation in TCA metabolites after 24 hr of ACSS2i treatment.
13C percentages on polar metabolites in SKM-1 cells. Cells were co-cultured for 24 hr with 20 µM ACSS2i before the addition of extra 4 mM sodium [2-13C]acetate and incubated for 24 hr (n=1). Bars represent the 13C percentages. 13C natural abundance is represented as a black bar at %13C=1.1.
-
Figure 2—figure supplement 5—source data 1
Raw values of acetate labelling in SKM-1 cells +/-ACSS2 i.
- https://cdn.elifesciences.org/articles/75908/elife-75908-fig2-figsupp5-data1-v4.xlsx
Figure 3 with 1 supplement
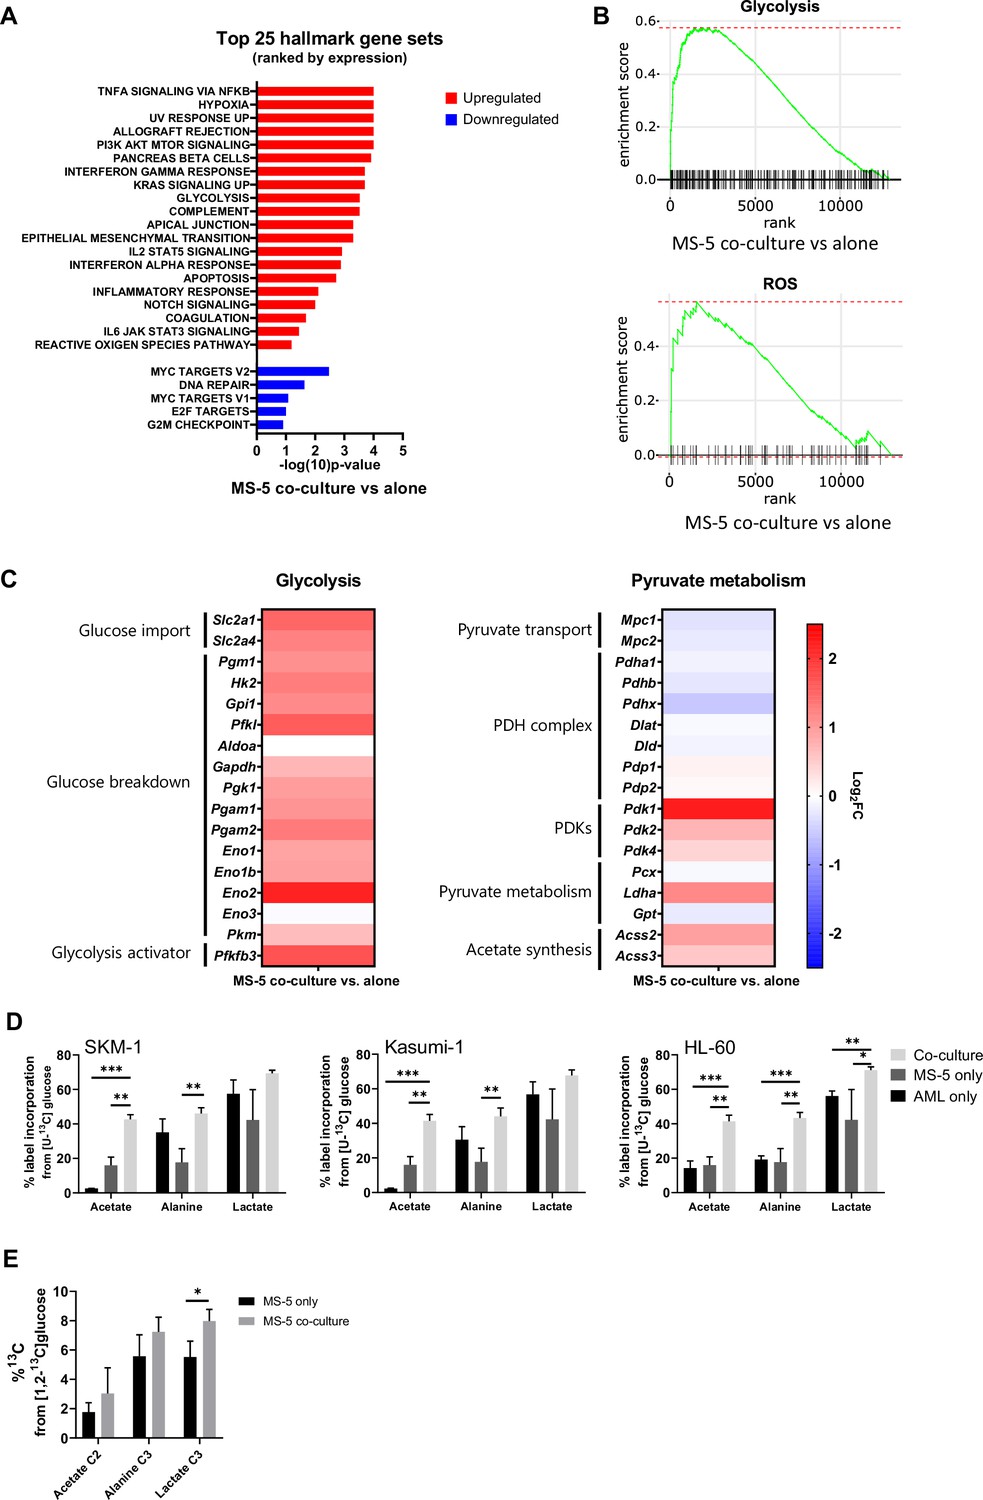
Transcriptomic data and [U-13C]glucose labelling reveal that stromal cell metabolism is shifted towards higher glycolysis and ROS upon co-culture with AML cells.
(A) Top 25 GSEA hallmark gene sets ranked by expression in MS-5 cells only vs co-culture with SKM-1 cells, analysed using the collection of hallmark gene sets from Molecular Signature Database with a false discovery rate threshold at 5%. p-Values for each pathway are presented as –log(10)p-value. (B) GSEA enrichment score plots of glycolysis and ROS generated using Sleuth 0.30.0 R statistical package. (C) Fold change values of detected gene transcripts (TPMs) related to glycolysis and pyruvate metabolism. FC values are represented as log2FC, red values indicate upregulation and blue values indicate downregulation in MS-5 cells in co-culture. (D) Label incorporation from [U-13C]glucose into extracellular metabolites in AML and MS-5 cells cultured alone or in co-culture after 24 hr. Bars represent the mean of n=3 independent experiments and error bars represent standard deviations. (E), Label incorporation from [U-13C]glucose into intracellular acetate, alanine and lactate in MS-5 cells cultured alone or in co-culture after 24 hr. Bars represent the mean of n=3 independent experiments and error bars represent standard deviations. p-Values are represented by n.s. for not significant * for p-value <0.05, ** for p-value <0.01 and *** for p-value <0.001.
-
Figure 3—source data 1
Data and stats for panels included in Figure 3.
- https://cdn.elifesciences.org/articles/75908/elife-75908-fig3-data1-v4.xlsx
Figure 3—figure supplement 1
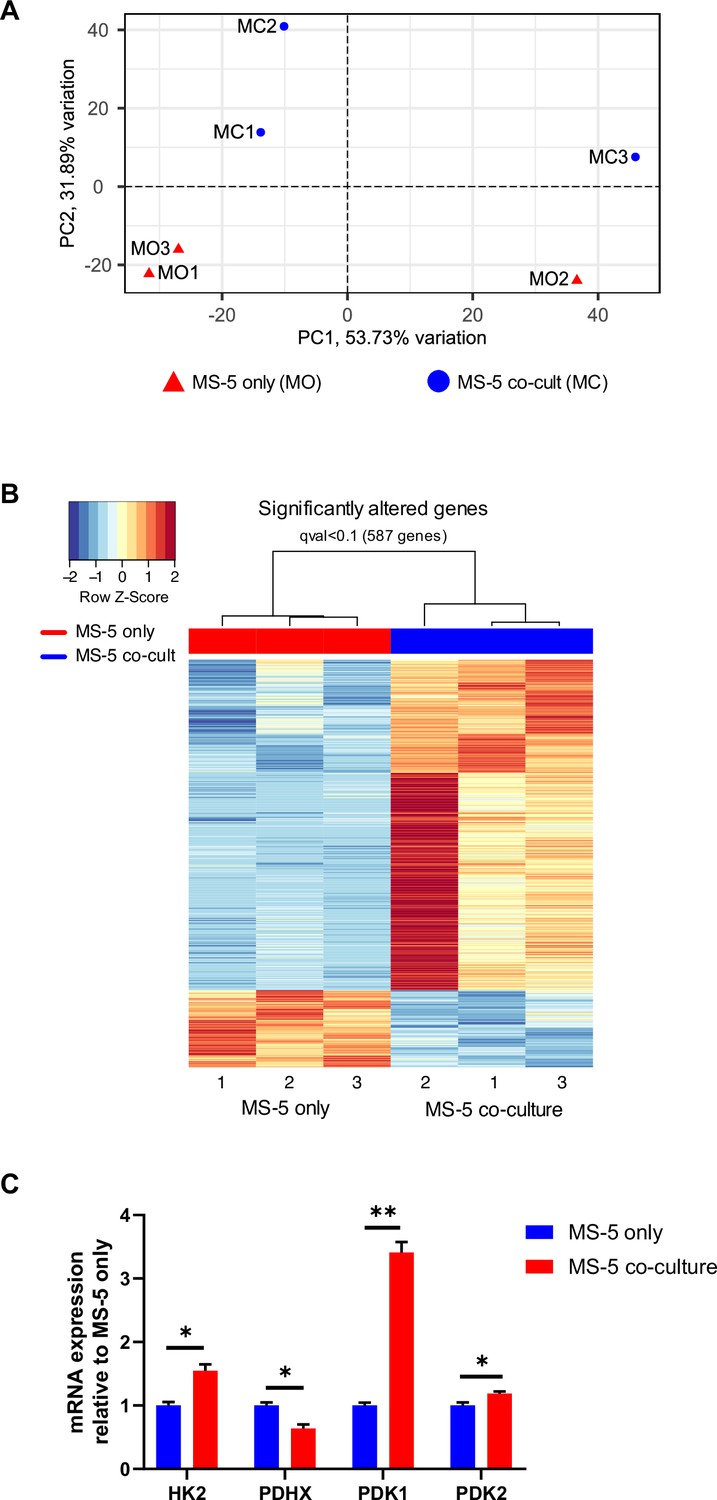
PCA component analysis, heat map of differentially expressed genes and qPCR for MS-5 cells cultured alone and in co-culture with SKM-1 cells.
(A) PCA plot showing the clustering of individual samples of MS-5 cells cultured alone (MO) and MS-5 cells in co-culture (MC). The x and y axis values represent the variation between the sample groups. Generated using Sleuth 0.30.0 R statistical package. (B) Heat map of differentially expressed genes in MS-5 only (red) vs MS-5 co-culture (blue) calculated using the Wald statistical test, correcting for multiple testing comparison employing the Benjamini-Hochberg method using a false discovery rate threshold of 1% (q-value <0.01). Generated using Sleuth 0.30.0 R statistical package. (C) Quantitative PCR mRNA expression values for RNA sequencing validation of MS-5 cells cultured alone and in co-culture with SKM-1 cells. The gene set chosen was Hk2, Pdhx, Pdk1, and Pdk2. mRNA quantification was normalized to B2m house-keeping gene. Bars represent the mean and error bars represent the SEM of three independent experiments (n=3). An unpaired Student’s t-test was applied for each gene and p-values are represented by * for p-value <0.05, ** for p-value <0.01 and *** for p-value <0.001.
-
Figure 3—figure supplement 1—source data 1
mRNA expression in MS-5 cells cocultured with SKM-1 cells relative to MS-5 alone.
- https://cdn.elifesciences.org/articles/75908/elife-75908-fig3-figsupp1-data1-v4.xlsx
Figure 4 with 1 supplement
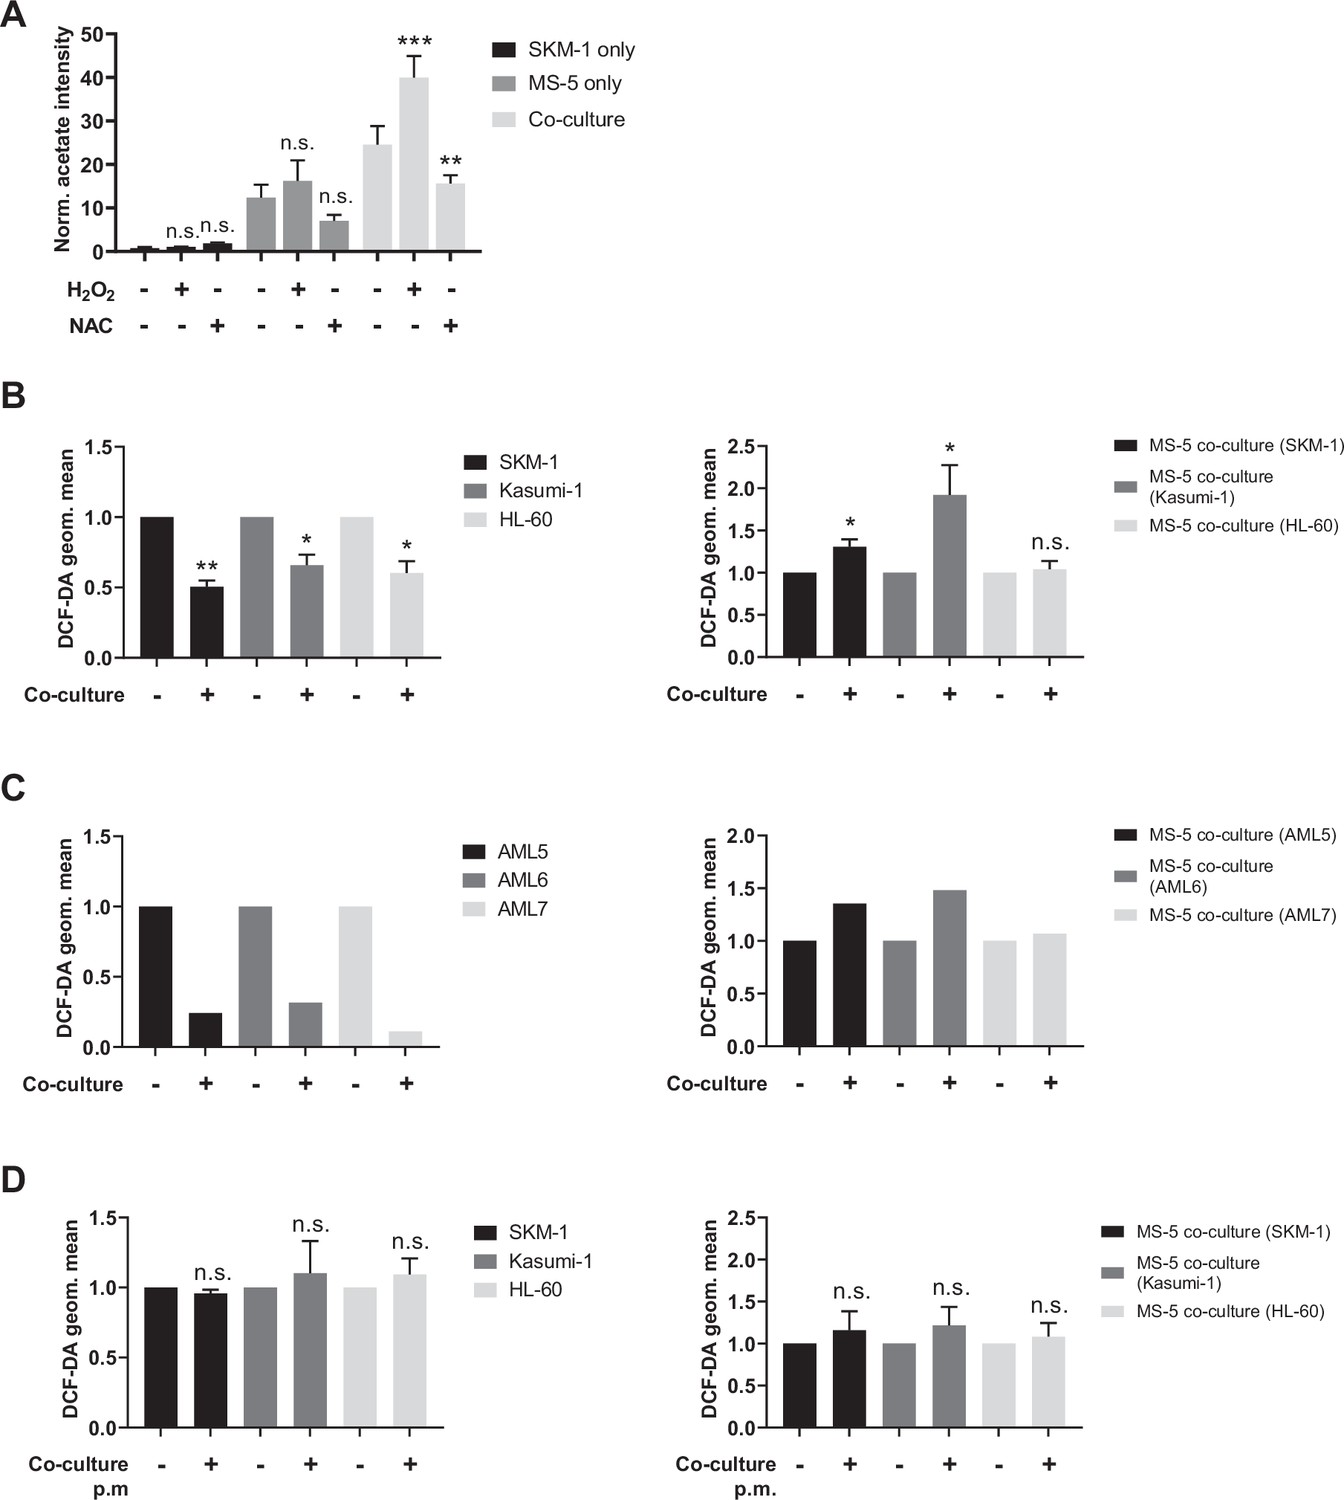
Acetate secretion is linked to ROS transfer from AML to stromal cells.
(A) Extracellular acetate levels in SKM-1 (black) and MS-5 cells cultured alone (dark grey) and in co-culture (light grey) for 24 hr in a control medium, medium with 50 µM H2O2 or medium with 5 mM NAC. (B, C and D) Intracellular ROS levels measured by H2DCFDA staining in B and D AML cells or C primary patient-derived AML cells and MS-5 cells cultured alone and in co-culture in B and C direct contact. For A, and B, bars represent the mean of n=3 independent experiments and error bars represent standard deviations. For A, a Dunnett’s multiple comparisons test was performed comparing each condition (H2O2/NAC) was compared to untreated; for B and D, an unpaired t test with Welch’s correction was applied comparing co-culture conditions to cells cultured alone. p-Values are represented by n.s. for not significant, * for p-value <0.05, and ** for p-value <0.01.
-
Figure 4—source data 1
Values and tats for panels included in Figure 4.
- https://cdn.elifesciences.org/articles/75908/elife-75908-fig4-data1-v4.xlsx
Figure 4—figure supplement 1
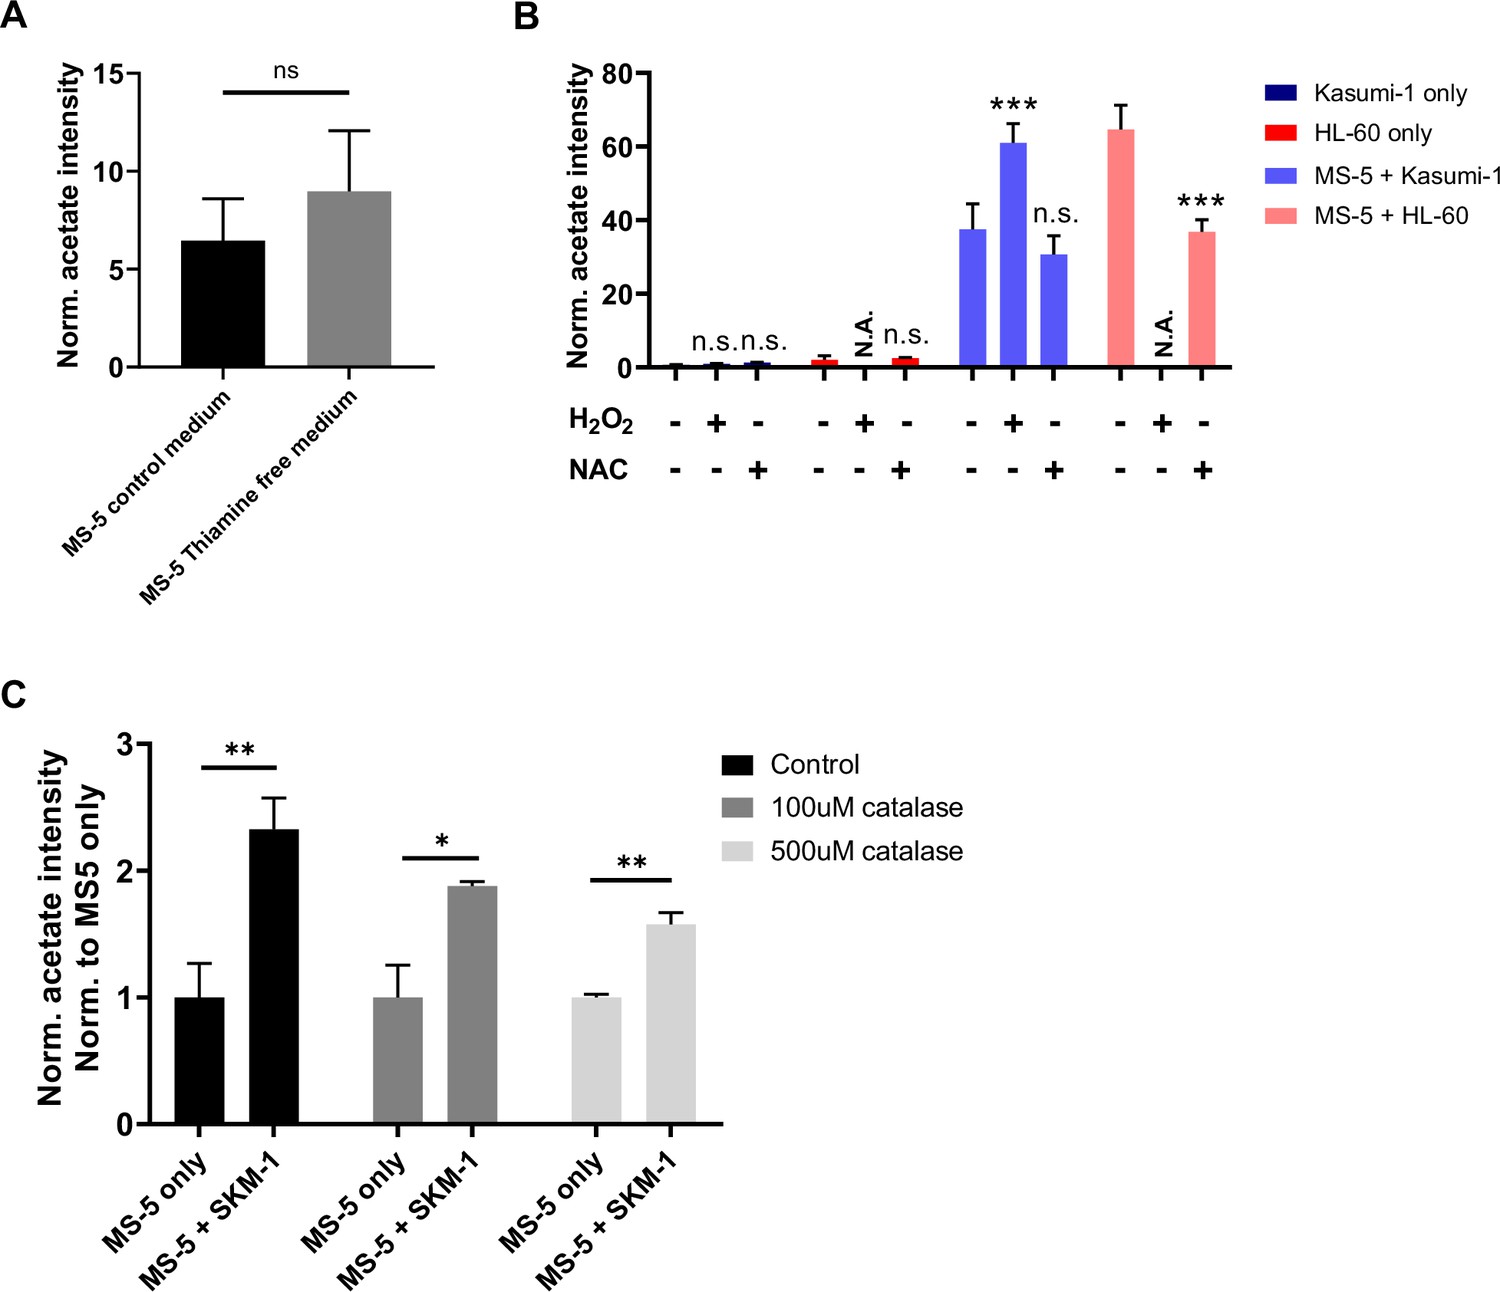
Acetate secretion in thiamine free medium and after modulating ROS levels.
(A), Extracellular acetate levels in MS-5 cells cultured in control medium (black) or in thiamine-depleted medium (grey) after 24 hr. (B), Extracellular acetate levels in Kasumi-1 (navy blue) and HL-60 (red) cultured alone and in co-culture (light blue and light red) for 24 hr in a control medium, medium with 50 µM H2O2 or medium with 5 mM NAC. Acetate levels for HL-60 cells cultured alone or under co-culture with 50 µM H2O2 are not shown as treatment 50 µM H2O2 severely impaired their viability. N.A.=not analysed. (C), Extracellular acetate levels in SKM-1 cultured alone and in co-culture for 24 hr in a control medium and medium with 100 µM or 500 µM catalase. For A and B each bar represents the mean of n=3 independent experiments and error bars represent standard deviation. For A and C, an unpaired Student’s t-test was applied for each condition. For B, a Dunnett’s multiple comparisons test was performed for Kasumi-1 and a Sidak’s multiple comparisons test was performed for HL-60. p-Values are represented by n.s. for not significant. * for p-value <0.05, ** for p-value <0.01 and *** for p-value <0.001.
-
Figure 4—figure supplement 1—source data 1
Acetate values and stats for MS5 cells in thiamine-free medium vs control (A), for Kasumi and HL-60 +/-NAC or H2O2 alone vs coculture (B), and for MS-5 cells with different concentrations of catalase (C).
- https://cdn.elifesciences.org/articles/75908/elife-75908-fig4-figsupp1-data1-v4.xlsx
Figure 5 with 1 supplement

Acetate secretion is linked to ROS transfer from AML to stromal cells via gap junctions.
(A) Fold change (FC) values of detected gene transcripts (TPMs) related to gap junctions. FC values are represented as log2FC, red values indicate upregulation and blue values indicate downregulation in MS-5 cells in co-culture. (B) Frequencies of Calcein-AM and CD33 positive AML cell lines after being in co-culture with Calcein-AM stained MS-5 cells for 3 hr . (C) Geometric mean of Calcein-AM fluorescence in CD33 positive AML cells (treated or untreated with 200 µM carbenoxolone for 24 hr) after being in co-culture with Calcein-AM stained MS-5 cells for 3 hr . (D and E) Intracellular ROS levels measured by H2DCFDA staining in D AML cells and E MS-5 cells cultured alone and in co-culture in direct contact treated or untreated with 200 µM carbenoxolone for 24 hr. (F) Extracellular acetate levels in AML cells (black) and MS-5 cells cultured alone (dark grey) and in co-culture (light grey) for 24 hr in a control medium, or medium with 200 µM CBX. (G) Survival rate of C57BL6/J mice transplanted with bone marrow nucleated cells isolated from WT control or MLL-AF9+ leukemic donors, treated with 500 µmol/kg of ROS-inducer tert-Butyl hydroxyperoxide (TBHP) alone or in combination with 30 mg/kg of gap-junction inhibitor carbenoxolone (CBX). Statistics indicate results of log-rank test for comparisons of Kaplan-Meier survival curves versus recipients of MLL-AF9+ cells treated with vehicle. (H) Number of monocytes per mL of peripheral blood (PB) at endpoint analysis, measured with Procyte hematological analyzer (IDEXX BioAnalytics). (I), Geometric mean of Calcein-AM fluorescence in CD33 positive AML cells (treated or untreated with 500 µM catalase for 24 hr) after being in co-culture with Calcein-AM stained MS-5 cells for 3 hr. For (B, C, D, E, F, H and I) bars represent the mean of n=3 independent experiments and error bars represent standard deviations. For (C, D, E, F, H and I) an unpaired Student’s t-test was applied for each condition. For G, a Gehan–Breslow–Wilcoxon test was applied. p-Values are represented by n.s. for not significant, * for p-value <0.05, ** for p-value <0.01 and *** for p-value <0.001.
-
Figure 5—source data 1
Values and stats for all panels included in Figure 5.
- https://cdn.elifesciences.org/articles/75908/elife-75908-fig5-data1-v4.xlsx
Figure 5—figure supplement 1
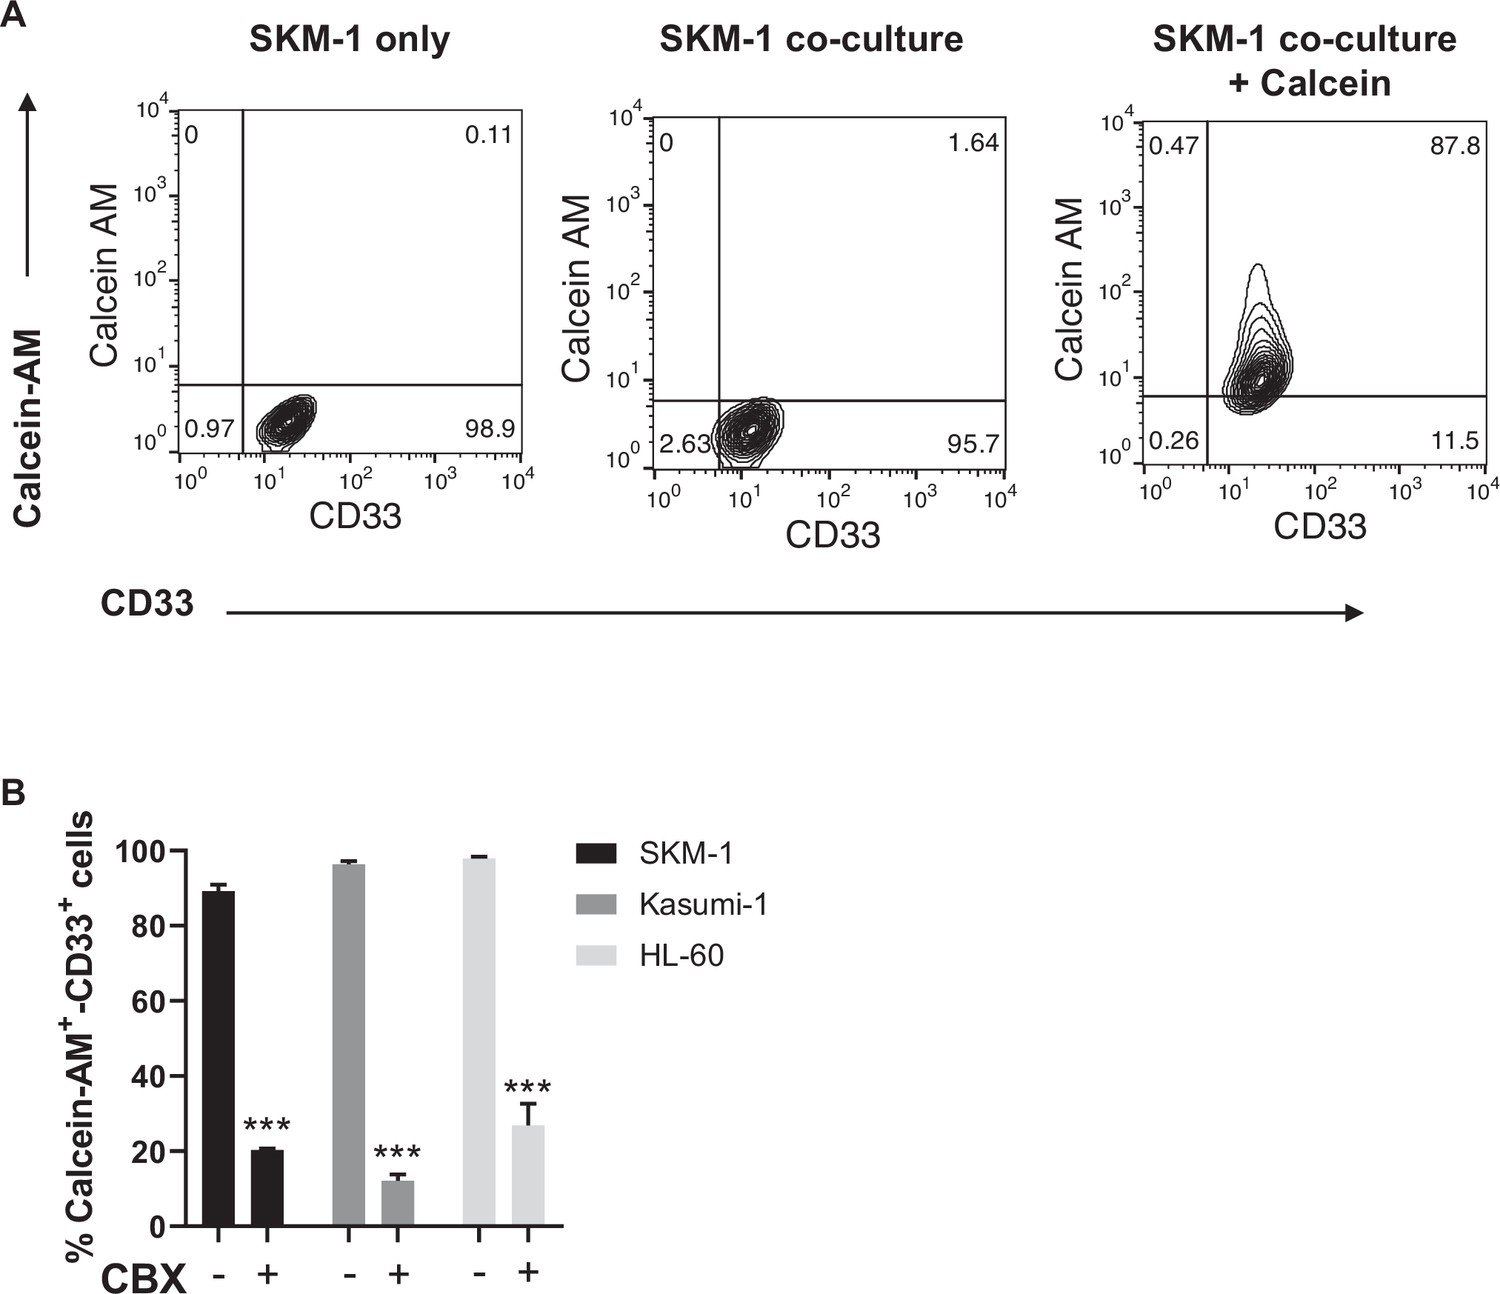
Calcein-AM and CD33 staining in SKM-1.
(A) Flow cytometry diagrams showing CD33 and calcein-AM green fluorescence in SKM-1 cells cultured alone or SKM-1 cells in co-culture with/without Calcein-AM-stained MS-5 cells after 3 hr. Frequencies of gated cell populations are indicated. (B) Frequencies of Calcein-AM and CD33 positive AML cell lines untreated or treated with 200 µM CBX 21 hr prior to being in co-culture with Calcein-AM stained MS-5 cells for 3 hr. Bars represent the mean of n=3 independent experiments and error bars represent standard deviations. (n=3). An unpaired Student’s t-test was applied for comparing treated vs. untreated cells. p-Values are represented by n.s. for not significant. * for p-value <0.05, ** for p-value <0.01 and *** for p-value <0.001.
-
Figure 5—figure supplement 1—source data 1
Percentage and stats for Calcein-AM +CD33 cells.
- https://cdn.elifesciences.org/articles/75908/elife-75908-fig5-figsupp1-data1-v4.xlsx
Figure 6
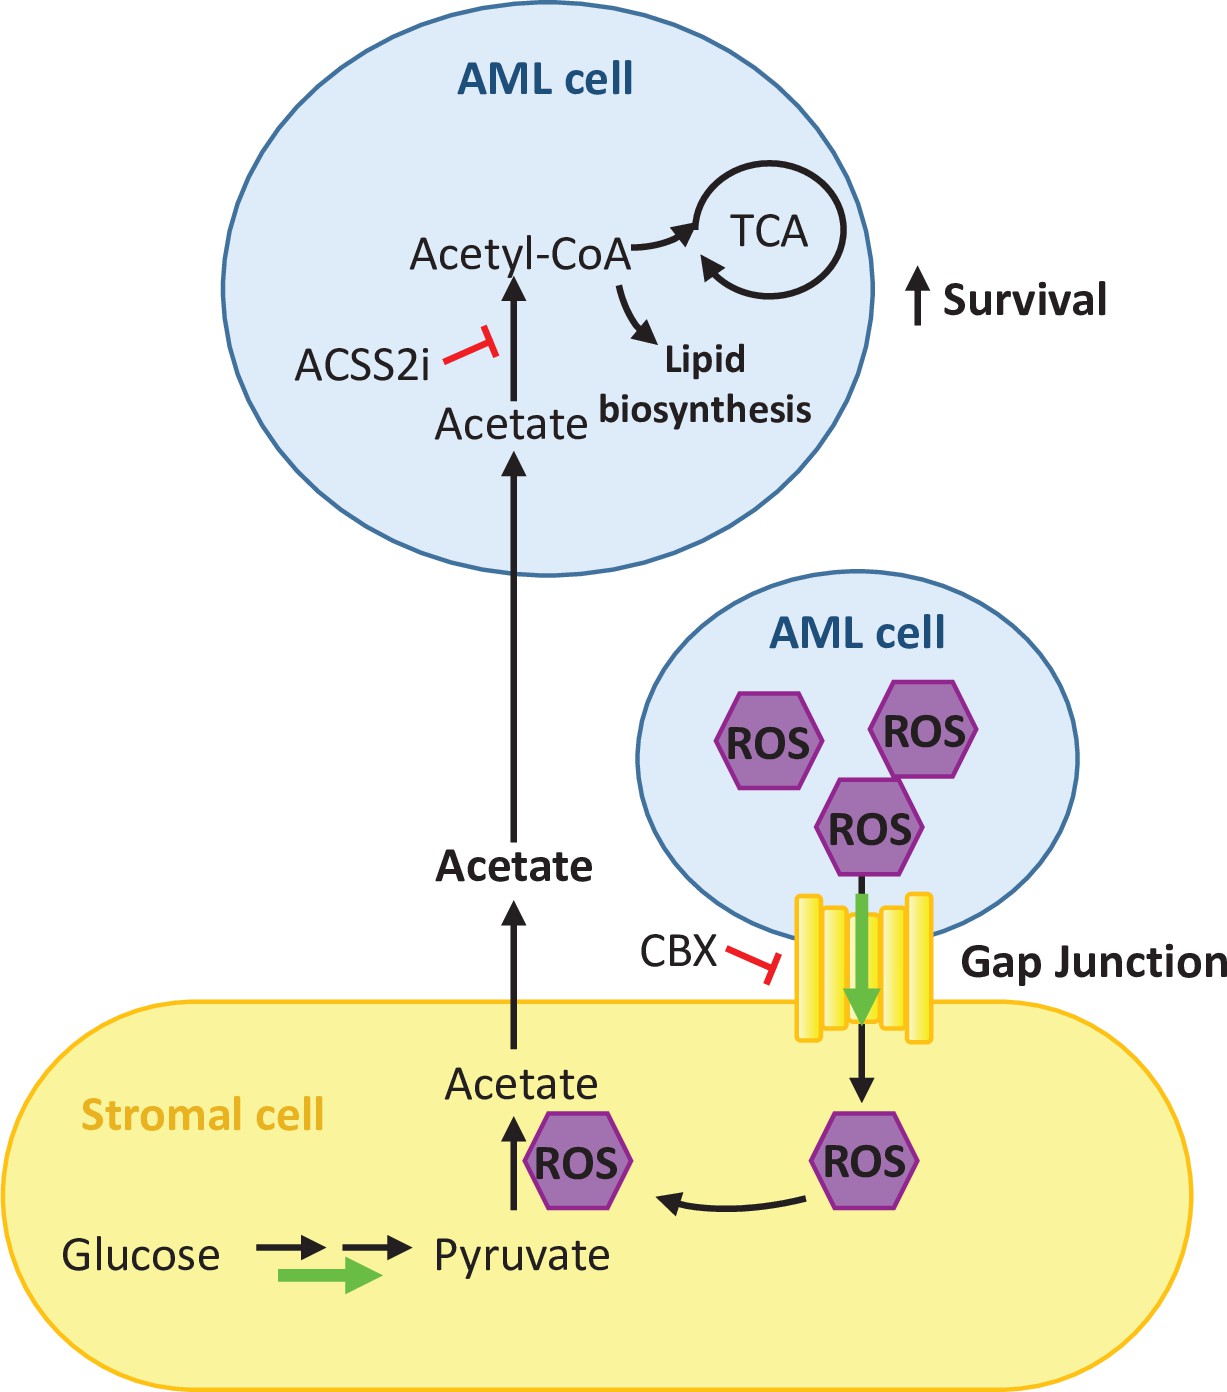
Schematic summary of our findings.
AML cells present high levels of ROS that activate the formation of gap junctions. ROS is transferred from AML cells to stromal cells through these gap junctions and it is utilised by stromal cells to convert pyruvate into acetate. Acetate is secreted from the stromal cells and uptake it by AML cells. In AML cells, imported acetate is used to feed the TCA cycle as well as for lipid biosynthesis, promoting the survival of the AML cell.
Tables
Key resources table
| Reagent type (species) or resource | Designation | Source or reference | Identifiers | Additional information |
|---|---|---|---|---|
| Strain, strain background (Mus musculus, females) | C57BL/6 J | The Jackson Laboratory | RRID:IMSR_JAX:000664 | |
| Strain, strain background (Mus musculus, males) | MLL-AF9 | The Jackson Laboratory | RRID:IMSR_JAX:009079 | Wild type littermates used as controls |
| Cell line (Homo sapiens) | SKM-1 | DMSZ | DMSZ ACC 547; RRID: CVCL_0098 | |
| Cell line (Homo sapiens) | Kasumi-1 | DMSZ and a gift from the laboratory of C.Bonifer (UoB) | DMSZ ACC 220; RRID: CVCL_0589 | |
| Cell line (Homo sapiens) | HL-60 | ATCC | ATCC CCL-240 RRID: CVCL_0002 | |
| Cell line (Mus musculus) | MS-5 | Gift from the laboratory of JJ Schuringa (Groninger University) | DMSZ ACC 441 RRID:CVCL_2128 | |
| Cell line (Homo sapiens) | HeLa | ATCC | ATCC CCL-2 RRID: CVCL_0030 | |
| Antibody | CD33 (mouse monoclonal, clone P67.6) | eBioscience | 48-0337-42 | 1:100 |
| Antibody | anti-CD34 APC (mouse monoclonal) | BD Biosciences | 560940 | 10 ul per 10 million cells |
| Antibody | anti-CD38 FITC (mouse monoclonal) | BD Biosciences | 555459 | 10 ul per 10 million cells |
| Chemical compound, drug | tert-Butyl hydroxyperoxide (TBHP) | Sigma/Merck | 478139 | |
| Chemical compound, drug | carbenoxolone (CBX) | Sigma-Aldrich | C4790 | For in vitro experiments |
| Chemical compound, drug | carbenoxolone (CBX) | Thermofisher | J63714.03 | For in vivo experiments |
| Chemical compound, drug | Catalase | Sigma-Aldrich | C100 | |
| Chemical compound, drug | 2′,7′-Dichlorofluorescin diacetate (DCFH-DA) | Sigma-Aldrich | D6883 | |
| Chemical compound, drug | H2O2 | Merck | 386790 | |
| Chemical compound, drug | N-acetylcysteine (NAC) | Merck | 106425 | |
| Chemical compound, drug | Calcein-AM green | Invitrogen | C1430 | |
| Chemical compound, drug | CellTrace carboxyfluorescein succinimidyl ester (CFSE) | Invitrogen | C34570 | |
| Chemical compound, drug | ACSS2i | Selleck | S8588 | |
| Chemical compound, drug | Cytarabine (AraC) | Sigma-Aldrich | C1768 | |
| Chemical compound, drug | [U-13C]Glucose | CortecNet | CC860P1 | |
| Chemical compound, drug | [2-13C]acetate | Sigma-Aldrich | 279315–1 G | |
| Other | CD34 magnetic microbeads | Miltenyi Biotec | 130-046-702 | Please see Materials and Methods section under Primary Patient samples |
| Other | CD117 magnetic microbeads | Miltenyi Biotec | 130-091-332 | Please see Materials and Methods section under Primary Patient samples |
| Sequence-based reagent | Hk2 q PCR primers | Sigma-Aldrich | NM_013820 | KiCqStart primers KSPQ12012 |
| Sequence-based reagent | Pdhx q PCR primers | Sigma-Aldrich | NM_175094 | KiCqStart primers KSPQ12012 |
| Sequence-based reagent | Pdk1 q PCR primers | Sigma-Aldrich | NM_172665 | KiCqStart primers KSPQ12012 |
| Sequence-based reagent | Pdk2 q PCR primers | Sigma-Aldrich | NM_133667 | KiCqStart primers KSPQ12012 |
| Sequence-based reagent | B2m qPCR primers | Thermo Fisher Scientific | NM_009735.3 | |
| Software.algorithm | Flowjo | BD-Bioscience | ||
| Software.algorithm | MetaboLab software within the MATLAB environment (MathWorks). | Ludwig and Günther, 2011 . https://doi.org/10.1186/1471-2105-12-366 | https://www.ludwiglab.org/software-development | |
| Software.algorithm | Chenomx 7.0 software (Chenomx Inc) | Chenomx Inc https://www.chenomx.com/ | ||
| Software.algorithm | FastQC 0.11.7 software | http://www.bioinformatics.babraham.ac.uk/projects/fastqc/ | ||
| Software.algorithm | Kallisto 0.43.0 software | Bray et al., 2016 | https://pachterlab.github.io/kallisto/ | |
| Software.algorithm | R statistical package Sleuth 0.30.0 | Pimentel et al., 2017 | https://github.com/pachterlab/sleuth | |
| Software.algorithm | the R statistical package fgsea 1.10.0 | http://bioconductor.org/packages/release/bioc/html/fgsea.html | ||
| Software.algorithm | R statistical package BioMart 2.40.3 | https://bioconductor.org/packages/biomaRt | ||
| Software.algorithm | GraphPad version 8 | https://www.graphpad.com/ |
Additional files
-
Supplementary file 1
Primary AML samples’ additional information.
Table shows information regarding the type of AML, karyotype and additional mutation and risk of the different AML patient samples used during this study.
- https://cdn.elifesciences.org/articles/75908/elife-75908-supp1-v4.docx
-
MDAR checklist
- https://cdn.elifesciences.org/articles/75908/elife-75908-mdarchecklist1-v4.docx
Download links
A two-part list of links to download the article, or parts of the article, in various formats.
Downloads (link to download the article as PDF)
Open citations (links to open the citations from this article in various online reference manager services)
Cite this article (links to download the citations from this article in formats compatible with various reference manager tools)
Crosstalk between AML and stromal cells triggers acetate secretion through the metabolic rewiring of stromal cells
eLife 11:e75908.
https://doi.org/10.7554/eLife.75908


