Reorganization of postmitotic neuronal chromatin accessibility for maturation of serotonergic identity
- Department of Neurosciences, Case Western Reserve University, United States
Figures
Figure 1 with 1 supplement

Unique distal enhancers and super-enhancers define the Pet1 lineage.
(a) Principal component analysis (PCA) reveals the unique accessible chromatin landscape of Pet1 neurons. Dots of the same color represent biological replicates. (b) Bar plot showing percentage of unique ATAC-seq peaks (transposase accessible chromatin [TAC] regions) from E14.5 Pet1 neurons when compared to cis-regulatory elements (CREs) annotated by ENCODE datasets (Gorkin et al., 2020) (left bar) or with transposase accessible chromatins (TACs) in E14.5 Pet1-negative (Pet1neg) cells from the same hindbrain region (right bar). (c) Emission probabilities for histone modifications in 10 ChromHMM states and the percent genomic coverage of each chromatin state for E14.5 Pet1 neuron-specific TACs and Pet1 neuron TACs shared with other tissues in ENCODE ATAC-seq datasets.(d) Distribution of H3K27ac signal across all enhancers identified in E14.5 Pet1 neurons. Enhancers with exceptionally high read counts (bracket) were designated super-enhancers. (e) Bar plot of Pet1 neuron super-enhancers that are unique to Pet1 neurons or overlap (‘shared’) with annotated enhancers from ENCODE datasets. (f) Genome browser view of the Pet1 neuron-specific super-enhancer across the Lmx1b locus defined as an extended stretch of H3K27ac and H3K4me1 enrichment.(g) Genome browser views of ATAC-seq and ChIPmentation signals at the Pet1/Fev locus. Red bar denotes the conserved Pet1 enhancer region that is sufficient to direct 5-HT neuron-specific transgene expression (Scott et al., 2005a; Scott et al., 2005b; Krueger and Deneris, 2008). (h) Gene ontology (GO) of Pet1 neuron-specific TACs (not found in other tissues in ENCODE ATAC-seq datasets). (i) Diagram of 5-HT neurotransmission. (j) Genome browser views of ATAC-seq and ChIPmentation peaks at 5-HT neurotransmission genes. Light blue shading highlights Pet1 neuron-specific TACs.
Figure 1—figure supplement 1
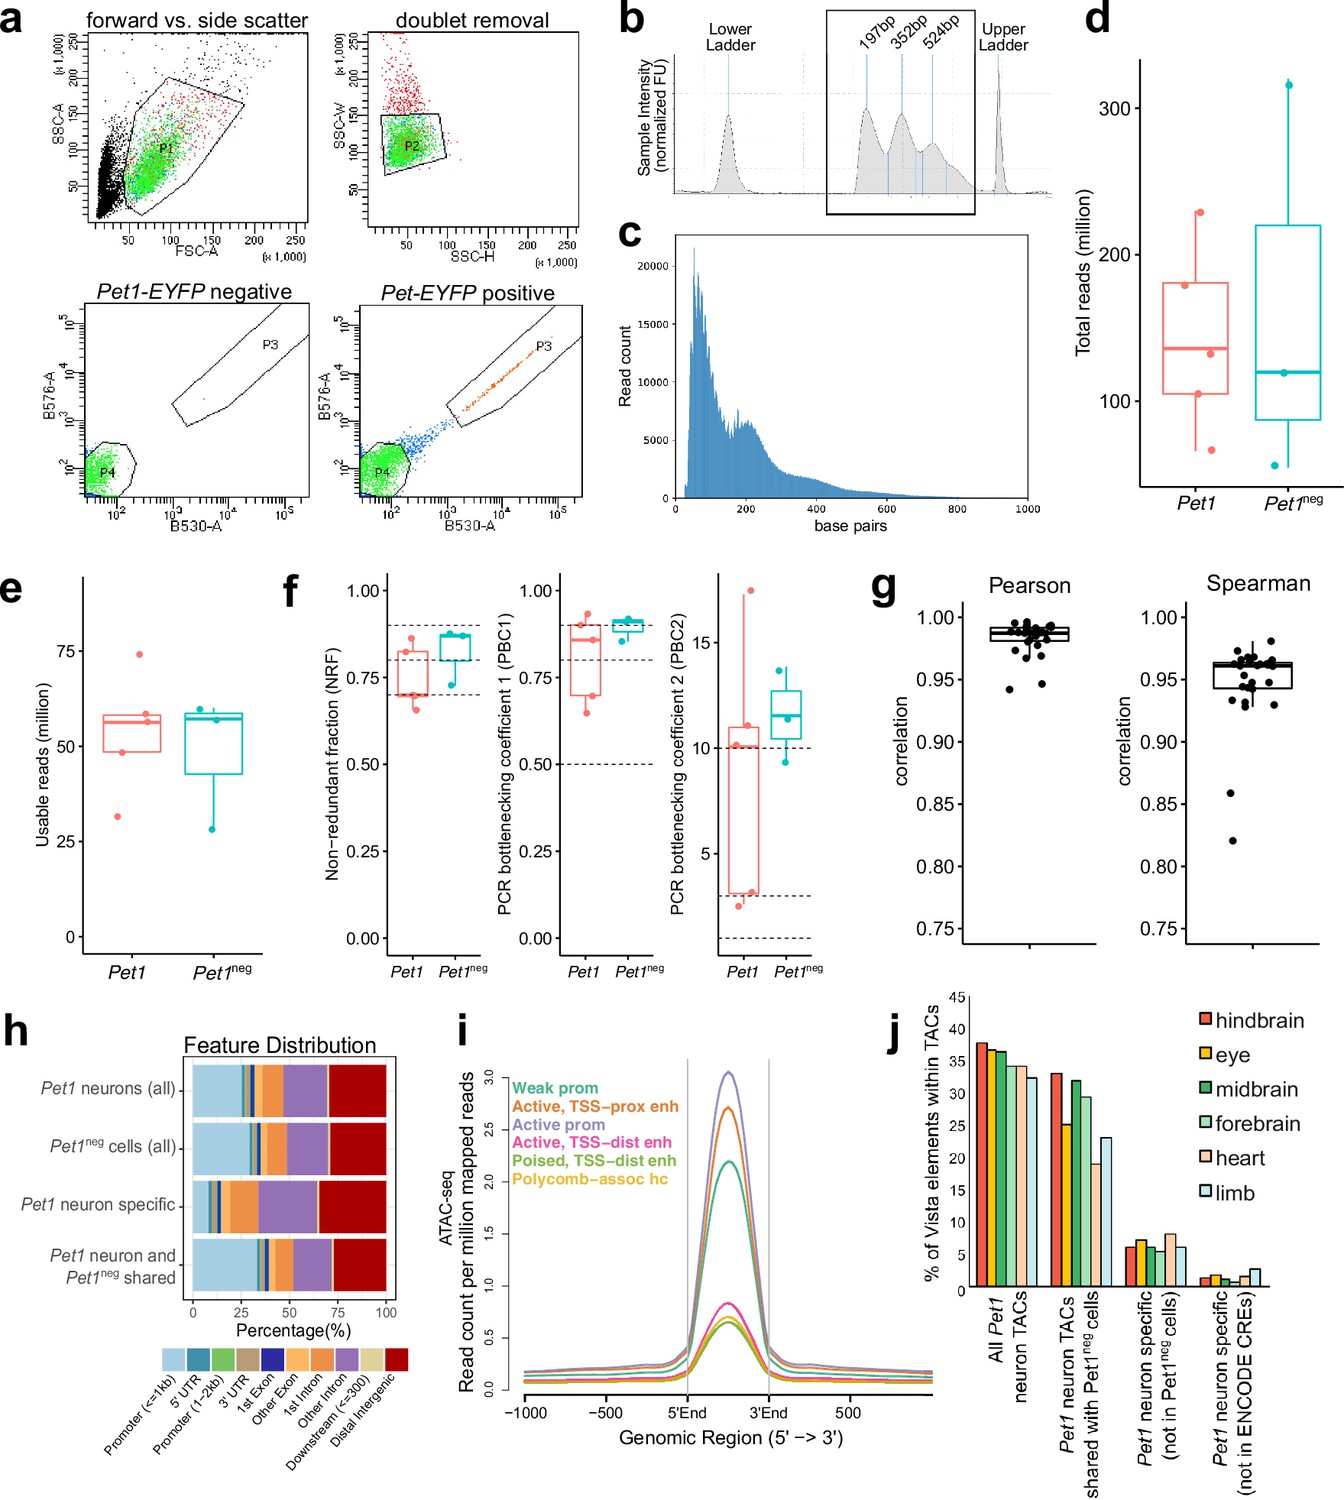
ATAC-seq quality control and analysis.
(a) FACS plots of collecting Yfp-positive neurons (Pet1 neurons) collected from dissociated E14.5 mouse hindbrain cells using forward vs. side-scattered light gating followed by removal of cell doublets. A unique population of cells appears in the hindbrain of Pet1-EYFP-positive mice compared to Pet1-EYFP-negative mice. (b) Tapestation bioanalysis showing the nucleosome laddering of a representative E14.5 ATAC-seq sample using 10,000 FACS-purified Pet1 neurons. Mono, di, and tri nucleosome sizes (sequencing adapters included) are labeled. (c) Fragment size distribution of ATAC-seq library. (d) The number of total read pairs per Pet1 (red) and Pet1neg (green) cell type. (e) ATAC-seq quality metrics showing the number of usable read pairs per cell type after filtering for mapping quality and PCR duplicates.(f) Library complexity plotted using three ENCODE data standard metrics (NRF, PBC1, PBC2) (Landt et al., 2012). Dotted lines indicate threshold cutoff for very high, high, and medium library complexity. (g) Correlation of ATAC-seq signals at replicated peaks between biological replicated based on Pearson’s correlation coefficient (left) or Spearman’s correlation coefficient (right). (h) Annotation of ATAC-seq peak genomic features for E14.5 Pet1 neurons and Pet1neg hindbrain cells. (i) Average chromatin accessibility at different chromatin states in E14.5 Pet1 neurons, validating that promoters and enhancers have strong open chromatin signals. (j) Percentage of enhancers in the VISTA database (Visel et al., 2007) that are experimentally validated in various mouse tissues and overlap with TACs identified in Pet1 neurons. Dots indicate replicates and boxes represent 75th percentile, median, and 25th percentile in all box plots.
Figure 2 with 2 supplements
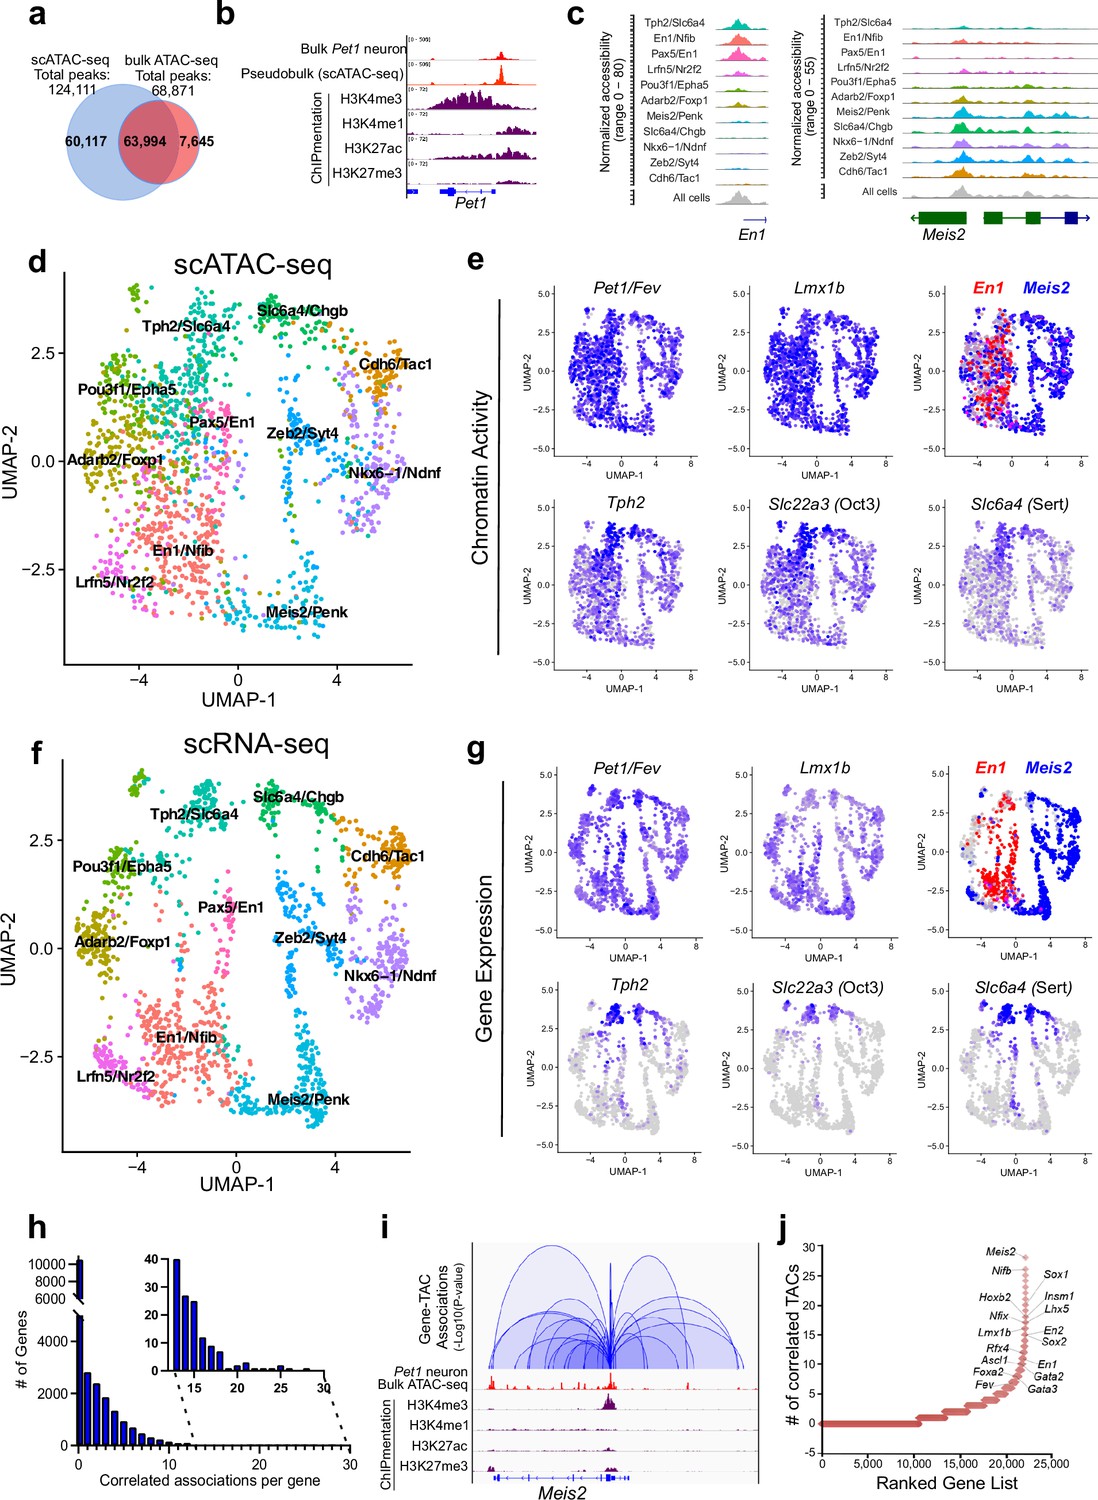
Heterogeneity in chromatin accessibility and transcriptomes reveals transcriptional programs determining Pet1 neuron subtype identities.
(a) Venn diagram showing overlap of single-cell Pet1 neuron TACs vs. bulk ATAC-seq TACs. (b) Genome browser view of Pet1 locus showing high concordance between the pseudobulk scATAC-seq and bulk FACS-purified Pet1 neuron ATAC-seq at E14.5. (c) scATAC-seq tracks showing the aggregated chromatin accessibility peaks of En1 (left) and Meis2 (right) for each cluster. (d) Uniform manifold approximation and projection (UMAP) visualization of chromatin accessibility of single E14.5 Pet1-lineage neurons. scATAC-seq is projected onto scRNA-seq UMAP space. Cells are colored by scATAC-seq cluster assignment. Genes associated with the top two marker TACs for each cluster are labeled. (e) The chromatin accessibility profiles of select genes across UMAP visualized scATAC-seq clusters. (f) UMAP visualization of single E14.5 Pet1 neurons based on gene expression. Cells are colored by scRNA-seq cluster assignment. (g) The expression profile of example 5-HT neuron identity genes across all scRNA-seq clusters in UMAP. (h) Number of TAC-gene associations for all genes. (i) Representative gene with high number of associated TACs. Loops represent statistically significant TAC-gene association. Loop height represents the p-value of TAC-gene correlation. (j) Number of significantly correlated TACs for each gene. Genes are ranked by the numbers of associated peaks. Select TFs with known or potential functions in the Pet1 lineage are labeled.
Figure 2—figure supplement 1
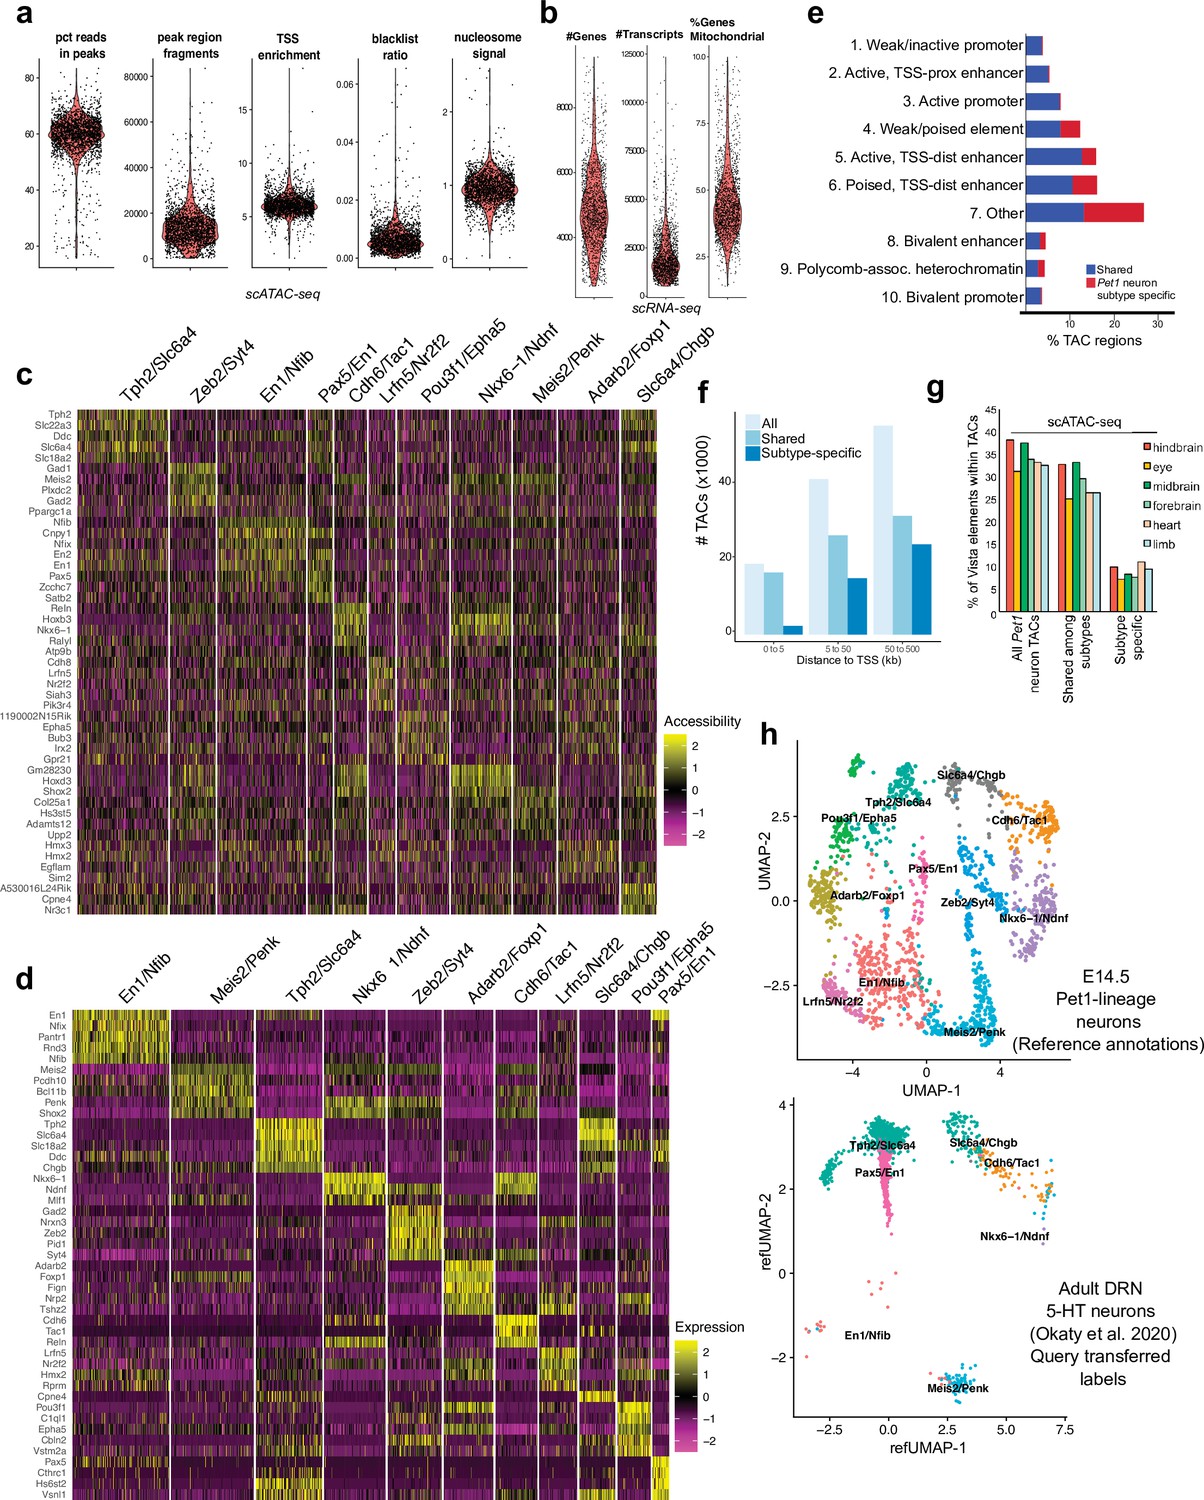
Identification of Pet1 neuron subtype-specific TACs.
(a) scATAC-seq quality metrics showing the distribution of percent of reads in peaks, number of fragments, transcriptional start site enrichment, blacklist ratio, and nucleosome signal per cell. (b) scRNA-seq quality control metrics showing the distribution of the number of genes, number of reads, and mitochondrial gene fraction per cell. (c) Heatmap showing the chromatin accessibility level surrounding the TSS for marker genes that distinguish each Pet1 neuron cluster. (d) Heatmap showing the expression of the top marker genes for each cluster. (e) Genomic coverage of ChromHMM chromatin states for scATAC-seq TACs that are specific to a single E14.5 Pet1 subtype/cluster (red) vs. shared among multiple subtypes (blue). (f) scATAC-seq peaks (TACs) sorted by distance to TSS for all TACs, TACs shared by multiple clusters, and TACs that are unique to an individual cluster. A greater fraction of subtype-specific TACs are 50–500 kb from the TSS than shared TACs. (g) Percentage of enhancers in the VISTA database (Visel et al., 2007) that are experimentally validated in various mouse tissues and overlap with either Pet1 neuron subtype-specific TACs or TACs shared among multiple subtypes at E14.5. (h) Unimodal uniform manifold approximation and projection (UMAP) of adult DRN 5-HT neuron scRNA-seq data (Okaty et al., 2020) onto the E14.5 Pet1 neuron scRNA-seq UMAP structure.
Figure 2—figure supplement 2
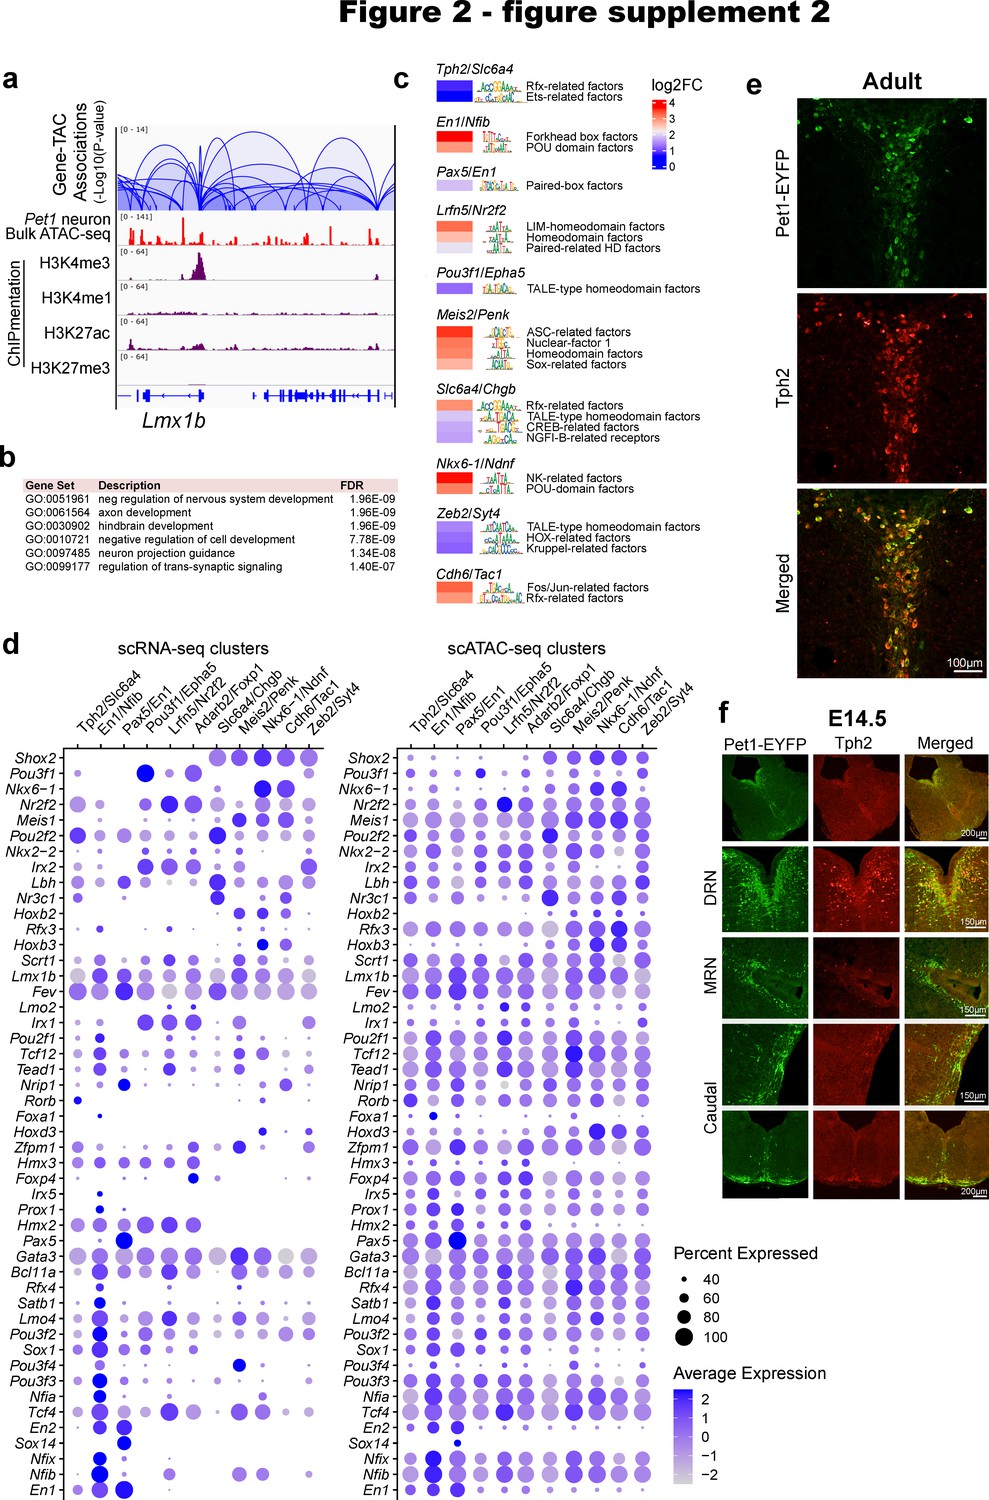
Pet1 neuron subtype-specific TF activity, expression, and accessibility.
(a) Transposase accessible chromatins (TACs) associated with Lmx1b. Loops represent statistically significant TAC-gene association. Loop height represents the p-value of TAC-gene correlation. (b) Top biological functions gene ontology terms for the 1500 genes with the highest number of associated TACs. (c) Inferred TF activity (binding) within Pet1 neuron subtype-specific TACs as determined by ChromVAR (Schep et al., 2017). (d) Dot plots of gene expression and chromatin accessibility profiles of TFs across Pet1 neuron subtypes showing a correlation between TF expression and accessibility. Dot size indicates the percentage of cells expressing the gene (left) or exhibiting promoter-proximal chromatin accessibility (right) at the indicated TF. Color saturation represents the average normalized expression or accessibility level. TFs were selected by their high cluster-dependent variance in expression. (e) Tph2 immunohistochemistry in adult Pet1-EYFP mouse brain showing Tph2 and Yfp overlap in dorsal raphe. (f) Tph2 immunohistochemistry in E14.5 Pet1-EYFP mouse brain showing partial overlap of Tph2 and Yfp in the dorsal raphe and minimal Tph2 protein levels in the median raphe and within the caudal Pet1 neurons.
Figure 3 with 1 supplement
Gene regulatory dynamics in maturing Pet1 neurons.
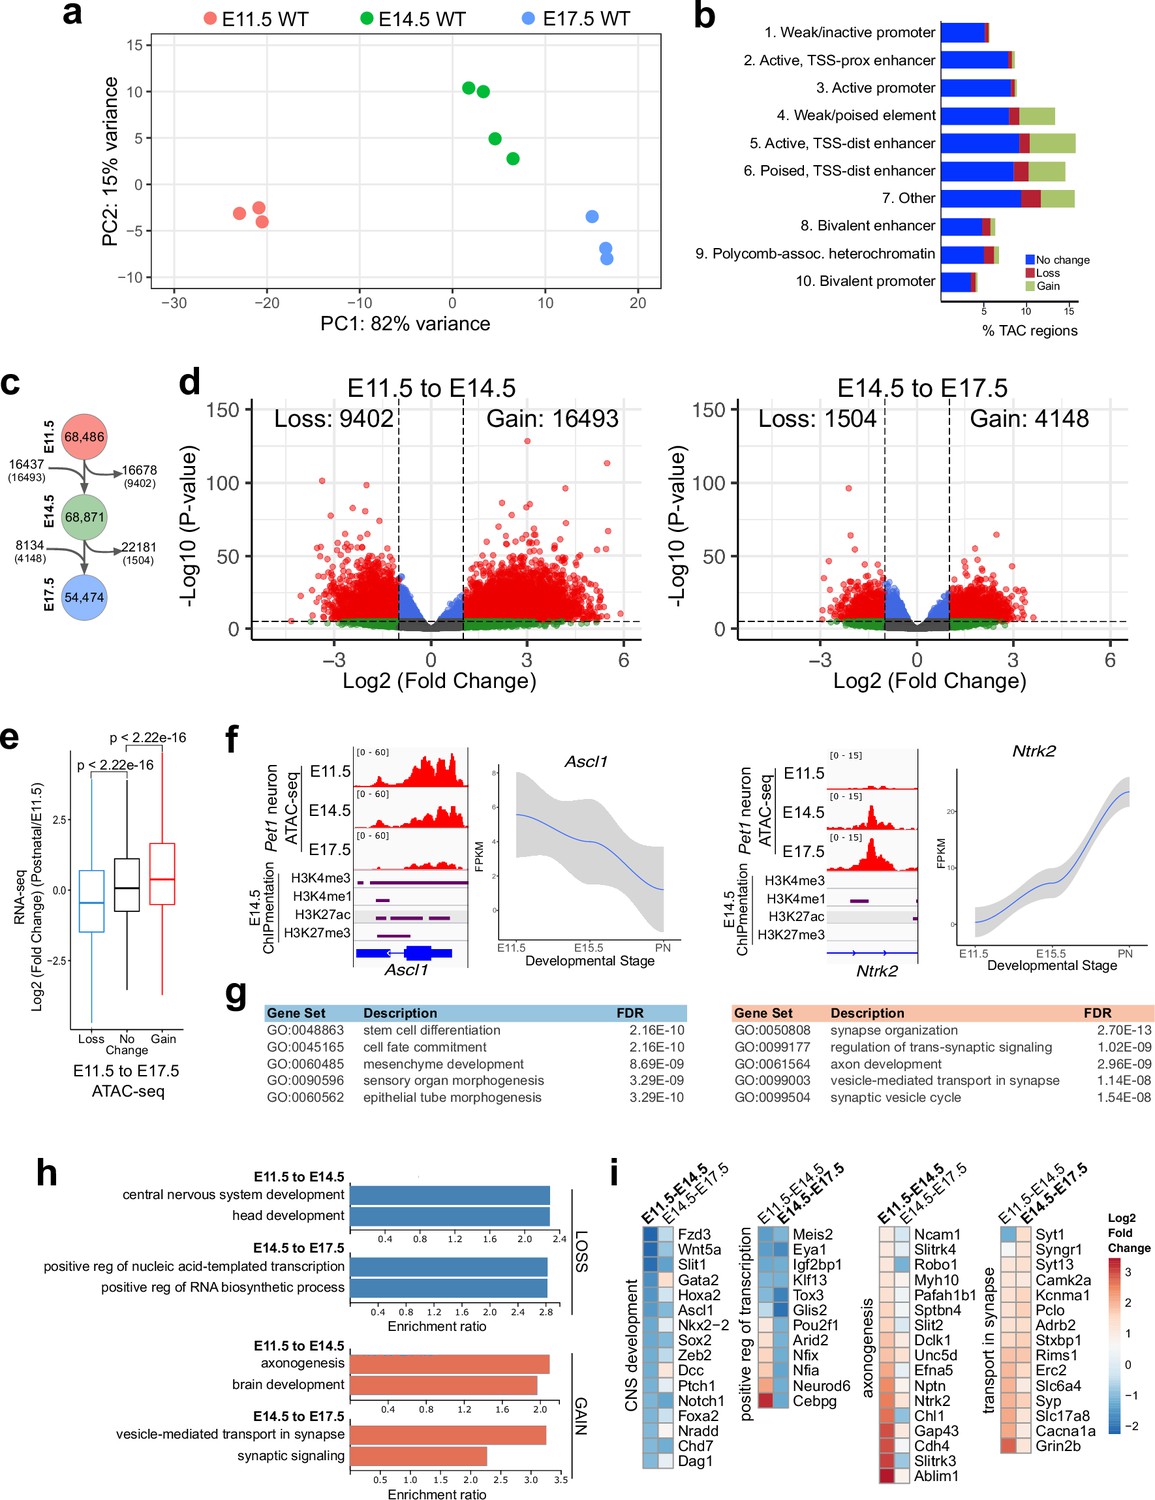
(a) PCA showing the distribution of Pet1 neuron ATAC-seq data over two principal components. (b) Distribution of chromatin states that exhibit gain (green), loss (red), or no change (blue) in chromatin accessibility from E11.5 to E17.5. (c) Number of TACs detected at each developmental time point (circles) and the number of TACs that are gained, lost, or propagated to the next time point (arrows). In parenthesis are the numbers of TACs that gain or lose >2-fold accessibility with FDR < 0.01. (d) Volcano plots showing the differential chromatin accessibility of TACs between consecutive time points, with fold change cutoff of 2-fold and significance cutoff of FDR < 0.01. Each dot represents one ATAC-seq peak (TAC). (e) Box plots showing the distribution of the log2 expression values of the linked genes for TACs that exhibit loss (blue), no change (black), or gain (red) in accessibility between E11.5 and E17.5. Significance of accessibility to gene expression correlation is calculated by Wilcoxon rank sum test. (f) Genome browser view of ATAC-seq and E14.5 ChIPmentation signals at representative genes that decrease (e.g. Ascl1) or increase (e.g. Ntrk2) in accessibility between E11.5 and E17.5. Parallel trends are seen in gene expression trajectories (panels on the right of tracks). (g) Top five GO biological process enrichment terms for genes linked to TACs that lose (left) or gain (right) accessibility from E11.5 to E17.5. (h) Bar graphs showing the enrichment ratio of the top gene ontology biological process enrichment terms for genes linked to TACs that lose (blue) or gain (orange) accessibility from E11.5 to E14.5 and from E14.5 to E17.5. (i) Heatmap showing the log2 fold change in chromatin accessibility for TACs of select genes associated with the indicated GO biological process terms for each developmental stage. Representative genes in GO terms from (h) were selected for display in (i).
Figure 3—figure supplement 1
Dynamic developmental remodeling of distal cis-regulatory elements.
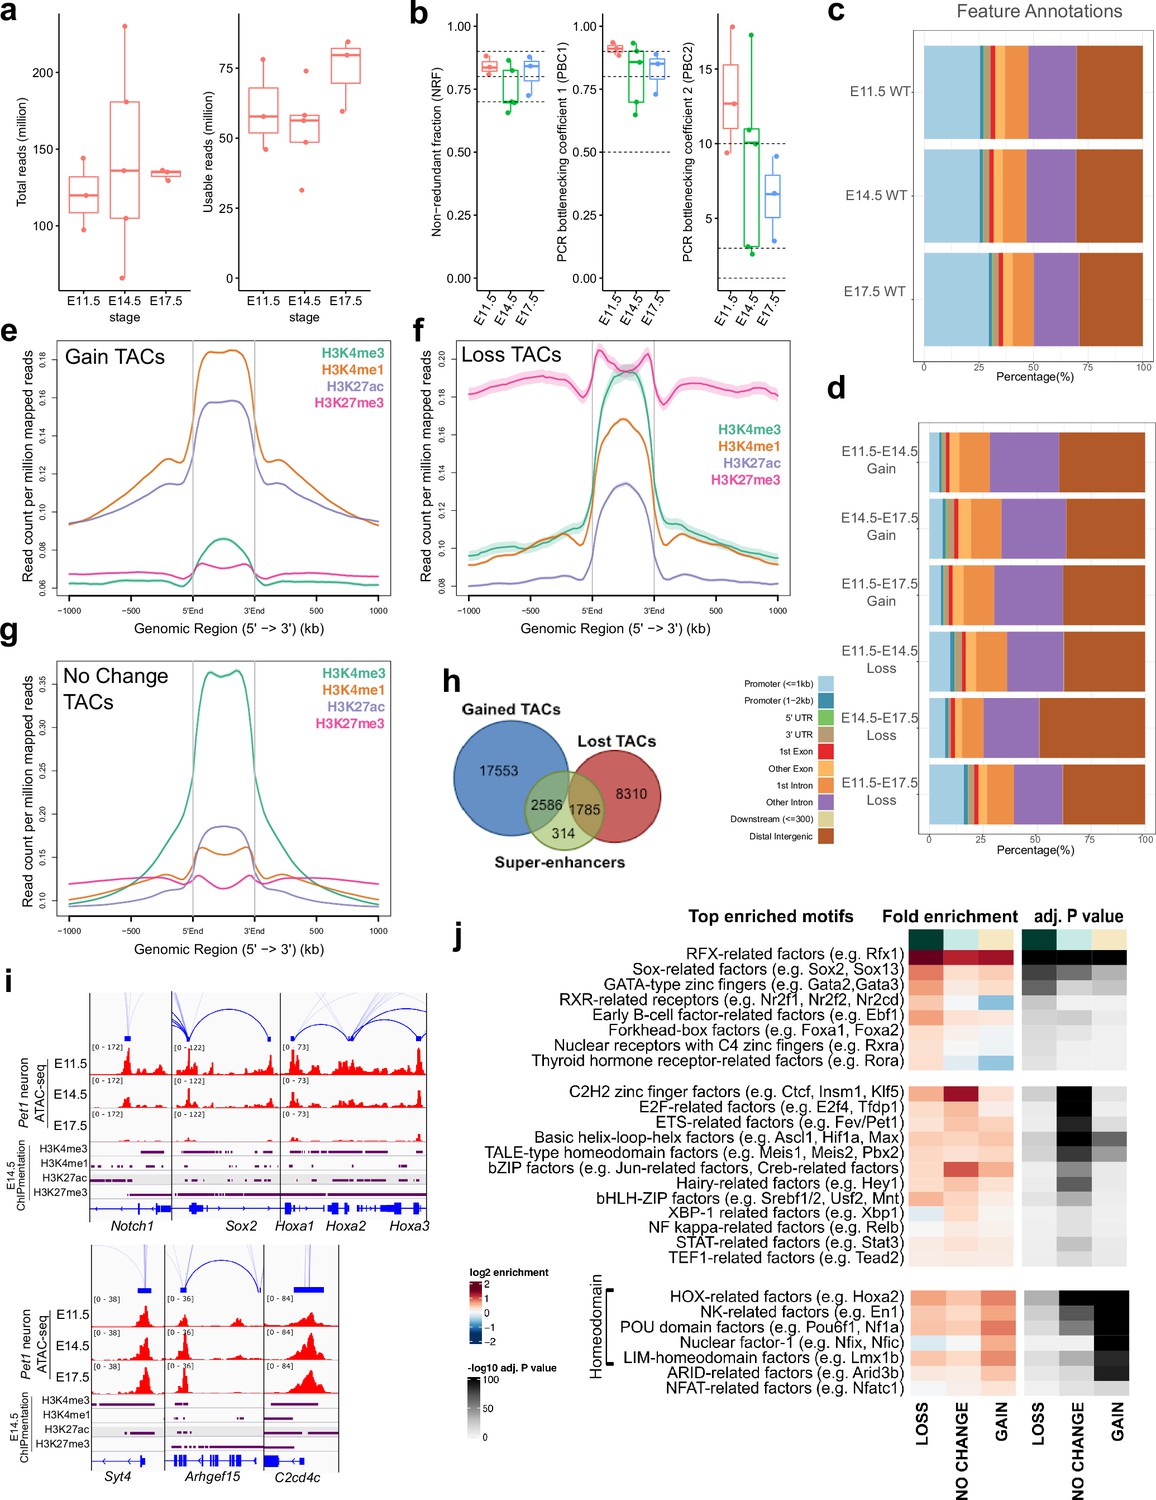
(a) ATAC-seq quality metrics showing the distribution of total reads (left) and usable reads after filtering for mapping quality and PCR duplicates (right) for each developmental time point. (b) ATAC-seq quality metrics showing library complexity plotted using three ENCODE data standards (NRF, PBC1, PBC2) for each developmental time point (Landt et al., 2012). Dotted lines indicate threshold cutoff for very high, high, and medium library complexity. (c) Distribution of gene feature annotations for all TAC regions at each developmental time point. (d) Distribution of gene feature annotations for TACs that show gain or loss in accessibility between developmental time points. (e) Histone ChIPmentation signals (E14.5) at TACs regions that show gain in chromatin accessibility from E11.5 to E17.5. (f) Histone ChIPmentation signals (E14.5) at TACs regions that show loss in chromatin accessibility from E11.5 to E17.5.(g) Histone ChIPmentation signals (E14.5) at TACs regions that show no change in chromatin accessibility from E11.5 to E17.5. (h) Overlap of all Pet1 neuron super-enhancers (green) with gained (blue) or lost (red) TACs from E11.5 to E17.5. (i) Genome browser tracks of genes showing loss (left) or gain (right) of chromatin accessibility from E11.5 to E17.5. (j) Motif enrichment within differentially accessible TACs. Highly similar motif hits are combined and assigned to their closest match of a TF class or family. TF families are sorted into three groups by whether their motifs are most significantly enriched in LOSS, NO CHANGE, or GAIN TACs. The TF families are then ranked by fold enrichment within each group. Fold enrichment and p-value are calculated and visualized by the Bioconductor package monaLisa.
Figure 4 with 1 supplement

Pet1 reorganizes postmitotic chromatin accessibility.
(a) PCA showing the distribution of ATAC-seq data for wildtype and Pet1-/- Pet1-lineage neurons (Pet1-/- neurons) over two principal components. (b) In vivo Pet1 footprints derived from Tn5 insertion frequency (ATAC-seq reads) over representative ETS-factor motifs within Pet1 neuron accessible chromatin regions. Pet1-/- neurons show reduced Pet1 footprints at E11.5 (left), E14.5 (middle), and E17.5 (right) compared to wildtype neurons for Pet1-regulated TACs. (c) Box plots showing the distribution of the log2 fold change in accessibility of the TACs that show differential accessibility between Pet1-/- vs. wildtype Pet1 neurons at three developmental time points. Pet1-/- neurons show an overall decrease in chromatin accessibility. (d) The top significantly enriched motif within Pet1 CUT&RUN peaks as determined by de novo MEME motif analysis significantly matches (p = 5.33e-06) the Pet1/FEV high-affinity binding site previously defined in vitro (Wei et al., 2010) based on analysis by the TOMTOM Motif Comparison Tool (top panel). (e) The fraction of Pet1-regulated TACs containing Pet1 CUT&RUN peaks. (f) The fraction of all Pet1 neuron TACs, Pet1 neuron TACs that are dependent on Pet1, and Pet1-dependent TACs occupied by Pet1 that are specific to Pet1/5-HT lineage or shared with Pet1neg cells. A significant fraction of Pet1-regulated TACs is unique to Pet1 neurons and absent from Pet1neg cells. (g) Volcano plot showing the differential chromatin accessibility of TACs between Pet1-/- and wildtype Pet1 neurons at E14.5, with fold change cutoff of 2-fold and significance cutoff of FDR < 0.01 (top). Highest FDR GO terms for Pet1-dependent TACs (in red) that are occupied by Pet1 show strong enrichment for serotonin biosynthesis. Select genes required for 5-HT synthesis are labeled on the volcano plot. (h) The numbers of gain and loss Pet1-/- neuron TACs that map to TACs specific to a subtype of Pet1 neurons or shared among multiple subtypes in scATAC-seq. (i–j) Genome browser tracks showing the gene-enhancer pairings and the ATAC-seq, Pet1 CUT&RUN, and histone modification ChIPmentation signals at 5-HT identity genes. Zoomed-in inserts display the changes in chromatin accessibility between wildtype (red) and Pet1-/- (green) Pet1 neurons within the highlighted (blue) regions at three developmental time points. Two TACs of the gene Slc6a4 (red dashed line box) gain accessibility in wildtype 5-HT neurons from E11.5 to E17.5 but fail to open to the same extent in Pet1-/- neurons. Asterisks denote FDR < 0.01 and fold change >2 relative to wildtype at the same time point.
Figure 4—figure supplement 1

Related to Figures 4 and 5: Pet1 is required for chromatin accessibility at Pet1 neuron-specific TACs.
(a) Motif enrichment within Pet1 neuron-specific TACs using the Bioconductor package monaLisa. Similar motif hits are combined and assigned to their closest match of a TF class or family. (b) ATAC-seq quality metrics showing the distribution of total reads (left) and usable reads after filtering for mapping quality and PCR duplicates (right) for Pet1-/- neurons at E11.5, E14.5, and E17.5. (c) ATAC-seq quality metrics showing library complexity plotted using three ENCODE data standards (NRF, PBC1, PBC2) (Landt et al., 2012) for Pet1-/- neurons assayed at E11.5, E14.5, and E17.5. Dotted lines indicate threshold cutoff for very high, high, and medium library complexity. (d) Principal component analysis (PCA) at E14.5 with Pet1neg cells, wildtype Pet1 neurons, and Pet1-/- neurons. (e) The ChromHMM chromatin states genomic coverage for TACs that lose accessibility in Pet1-/- neurons at E11.5, E14.5, or E17.5. (f) Genome browser tracks of Pet1 CUT&RUN and previously published ChIP-seq using myc-Pet1 (Wyler et al., 2016) showing the similarity of Pet1 occupancy peaks at Pet1-regulated genes. (g) GO terms for Pet1-occupied differentially accessible TACs between Pet1-/- and wildtype Pet1 neurons at E11.5 (top) and E17.5 (bottom) show enrichment for serotonin biosynthesis. (h) The fraction of TACs that require Pet1 for chromatin opening from E11.5 to E17.5 that contains Pet1 CUT&RUN peaks (top). Gene ontology analysis on TACs that require Pet1 for initial chromatin accessibility shows enrichment of synapse-related terms (bottom). (i) Representative genome browser tracks of TACs that require Pet1 for euchromatin formation. (j) Schematic of conditional Pet1 targeting and labeling using Pet1-Cre transgene followed by FACS collection of TdTomato-positive neurons for ATAC-seq. (k) ATAC-seq quality metrics showing the distribution of total reads (left) and usable reads after filtering for mapping quality and PCR duplicates (right) for Pet1-cKO 5-HT precursors at E14.5. (l) ATAC-seq quality metrics showing library complexity plotted using three ENCODE data standards (NRF, PBC1, PBC2) (Landt et al., 2012) for Pet1-cKO neurons at E14.5. (m) Fraction of differentially accessible TACs in Pet1-cKO containing Pet1 CUT&RUN peaks.
Figure 5
Sustained Pet1 input is required for chromatin accessibility.
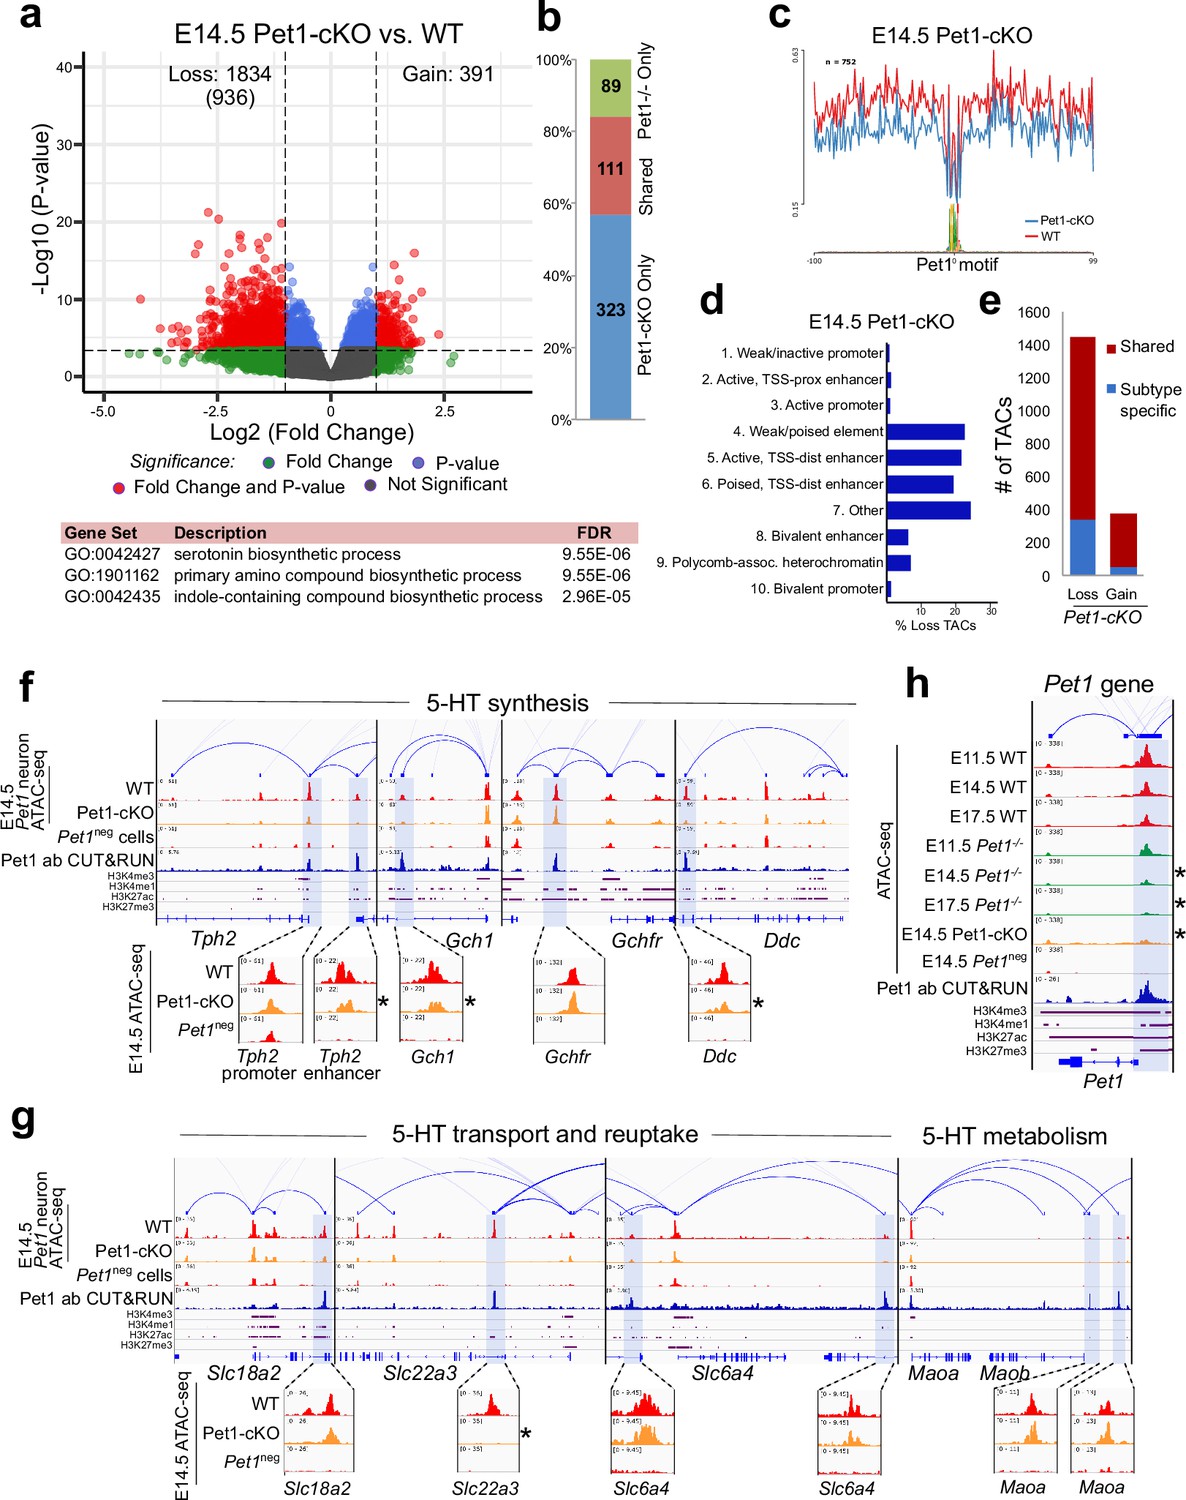
(a) Top: Volcano plot showing the differential chromatin accessibility of TACs between Pet1-cKO and wildtype Pet1 neurons, with fold change cutoff of 2-fold and significance cutoff of FDR < 0.01 (in red). 936 TACs (in parenthesis) show no change in accessibility in wildtype Pet1 neurons between E11.5 and E14.5 but show loss of accessibility in Pet1-cKO. Bottom: Highest FDR GO terms for the Pet1-regulated TACs (in red) that are occupied by Pet1 show enrichment for 5-HT biosynthesis. (b) Overlap between differential TACs in Pet1-/- and Pet1-cKO 5-HT neurons. (c) Comparison of in vivo Pet1 footprints over representative ETS-factor motif between Pet1-cKO and wildtype Pet1 neurons within all differentially accessible chromatin regions. (d) The ChromHMM chromatin states genomic coverage for TACs that are maintained by Pet1 at E14.5. (e) The numbers of gain and loss Pet1-cKO Pet1 neuron TACs that map to TACs specific to a subtype of Pet1 neurons or shared among multiple subtypes in scATAC-seq data. (f–g) Genome browser tracks of gene-enhancer pairings, ATAC-seq, Pet1 CUT&RUN, and histone modification ChIPmentation signals at 5-HT identity genes. Zoomed-in inserts display the changes in chromatin accessibility between wildtype (red) and Pet1-cKO (orange) 5-HT precursors within the highlighted (blue) regions at E14.5. Asterisks denote FDR < 0.01 and fold change >2 compared to wildtype. (h) Genome browser tracks showing the ATAC-seq, Pet1 CUT&RUN, and histone modification ChIPmentation signals at the Pet1 locus.
Figure 6 with 1 supplement

Lmx1b co-regulates chromatin accessibility with Pet1 at 5-HT neurotransmission genes but has broader impact on accessibility landscape.
(a) PCA showing the distribution of wildtype, Pet1-/-, Pet1-cKO, Lmx1b-cKO, and DKO neuron ATAC-seq data over two principal components. (b) Comparison of in vivo Lmx1b footprints over representative LIM-HD motif, between Lmx1b-cKO and wildtype Pet1 neurons within differentially accessible chromatin regions. (c) Top: Volcano plot showing the differential chromatin accessibility of TACs between Lmx1b-cKO and wildtype Pet1 neurons, with fold change cutoff of 2-fold and significance cutoff of FDR < 0.01 (in red). 1228 TACs (in parenthesis) show no change in accessibility in wildtype Pet1 neurons between E11.5 and E14.5 but show loss of accessibility in Lmx1b-cKO. Bottom: Highest FDR GO terms for Lmx1b-regulated TACs (in red) that are occupied by Lmx1b show enrichment of 5-HT biosynthesis. (d) The topmost significantly enriched motif within Pet1 CUT&RUN peaks as determined by de novo MEME motif analysis matches (p = 4.03E-02) the Lmx1b LIM-HD binding site previously defined in vitro (Jolma et al., 2013) based on analysis by the TOMTOM Motif Comparison Tool (left panel). Fraction of Lmx1b-maintained TACs containing Lmx1b CUT&RUN peaks (right panel). (e) The ChromHMM chromatin states genomic coverage for TACs that lose accessibility in Lmx1b-cKO (blue) and DKO (red) in E14.5 Pet1 neurons. (f) The numbers of gain and loss Lmx1b-cKO Pet1 neuron TACs that map to TACs specific to a subtype of Pet1 neurons or shared among multiple subtypes in scATAC-seq data. (g) Comparison of the in vivo Pet1 (top) and Lmx1b (bottom) footprints between DKO and wildtype Pet1 neurons within differentially accessible chromatin regions. (h) Top: Volcano plot showing the differential chromatin accessibility of TACs between DKO and wildtype Pet1 neurons, with fold change cutoff of 2-fold and significance cutoff of FDR < 0.01 (in red). 815 TACs (in parenthesis) show no change in accessibility in wildtype Pet1 neurons between E11.5 and E14.5 but show loss of accessibility in DKO. Bottom: Highest FDR GO terms for Pet1- and Lmx1b-regulated TACs (in red) that are occupied by the two TFs show enrichment for serotonin biosynthesis. (i) The fraction of Pet1-cKO, Lmx1b-cKO, and DKO differentially accessible TACs that is specific to Pet1 lineage. A significant fraction of the Pet1- and Lmx1b-regulated TACs is unique to Pet1 neurons and absent from Pet1neg cells. (j–k) Genome browser tracks of gene-enhancer pairings, ATAC-seq, Pet1 CUT&RUN, and histone modification ChIPmentation signals at 5-HT identity genes. Display data ranges for the zoomed-out panels are scaled to the peak in the blue highlighted regions. Zoomed-in inserts display the changes in chromatin accessibility between wildtype (red), Lmx1b-cKO (orange), and DKO (orange) 5-HT precursors within the highlighted (blue) regions at E14.5. Asterisks denote FDR < 0.01 and fold change >2 compared to wildtype.
Figure 6—figure supplement 1
Pet1 and Lmx1b control the global landscape of TF binding sites.
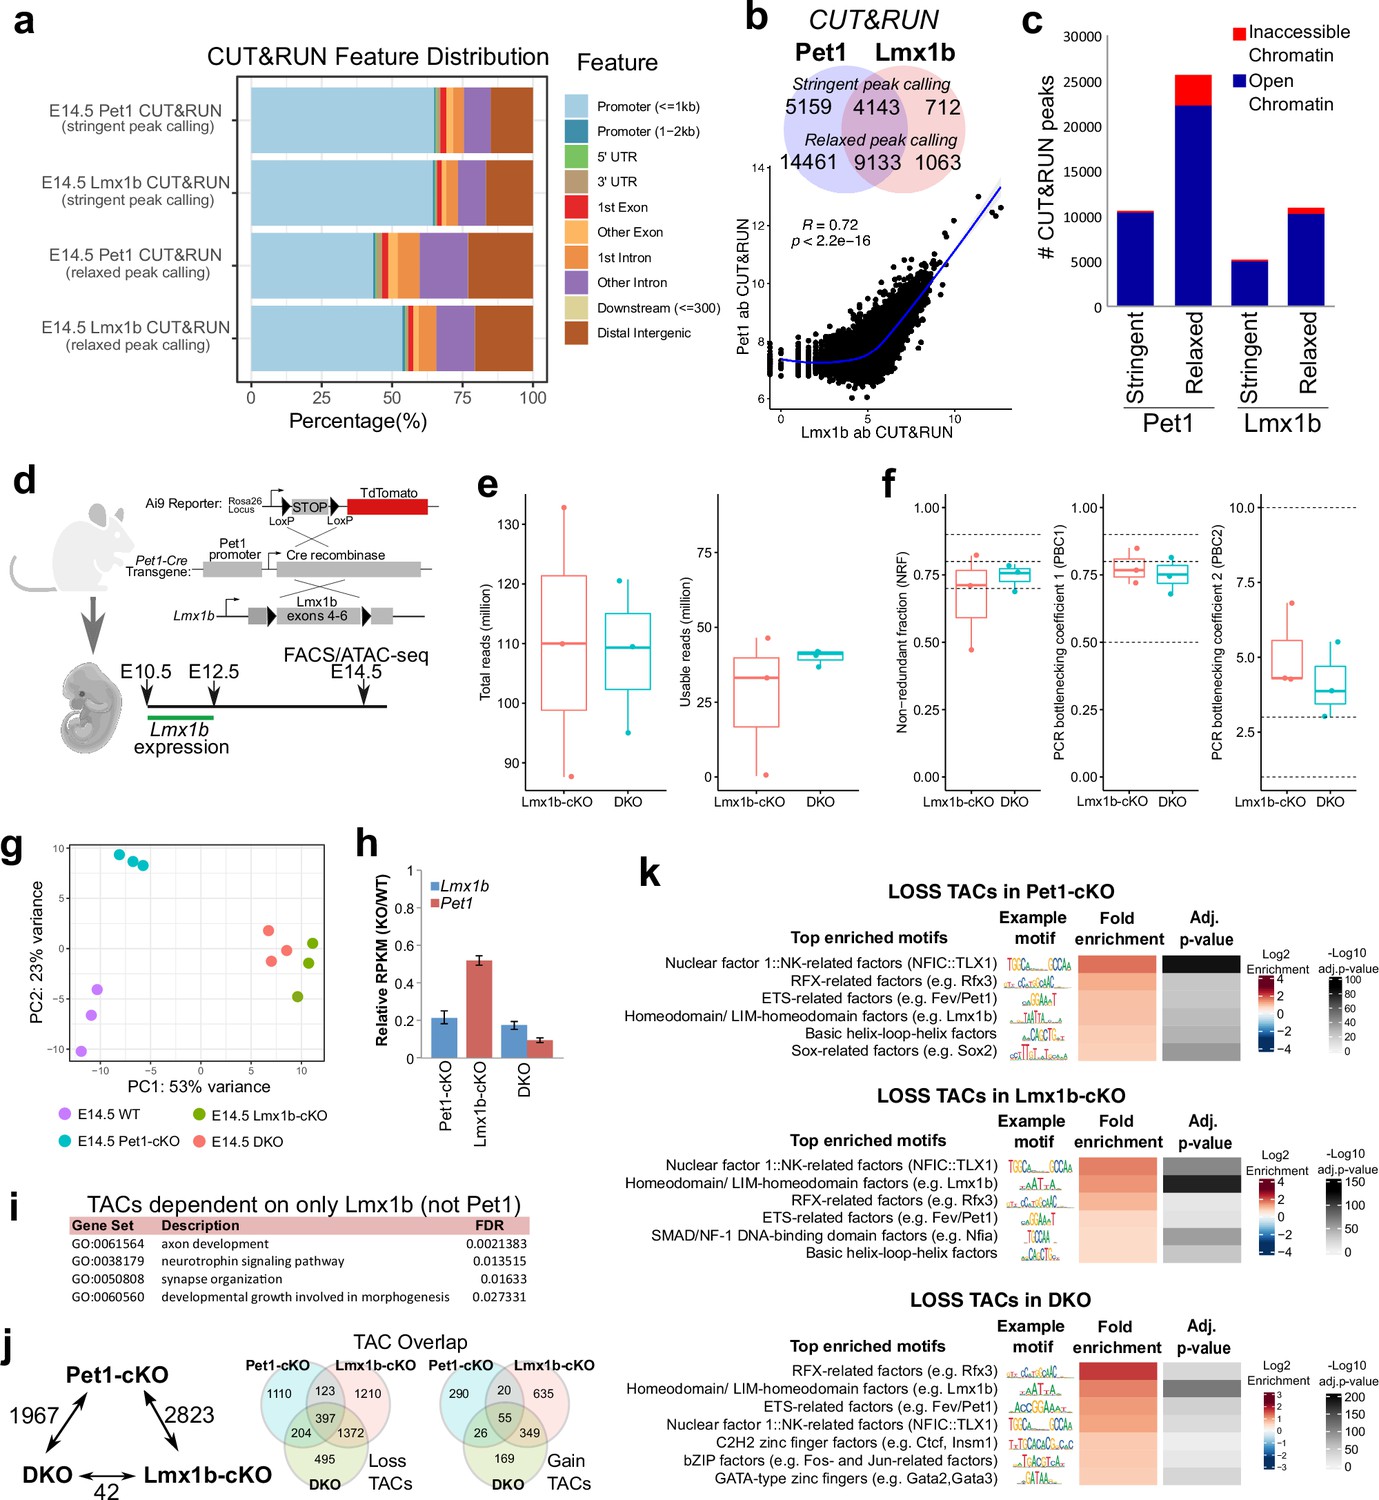
(a) Distribution of gene features for E14.5 Pet1 and Lmx1b CUT&RUN peaks using either ‘stringent’ or ‘relaxed’ peak calling parameters (Meers et al., 2019).(b) Top: overlap of Pet1 and Lmx1b CUT&RUN binding sites defined by either ‘stringent’ or ‘relaxed’ peak selection mode (Meers et al., 2019). Bottom: scatter plot showing the correlation of Pet1 and Lmx1b CUT&RUN signals across binding sites indicates co-occupancy (Spearman’s correlation). (c) Overlap of ‘stringent’ and ‘relaxed’ E14.5 Pet1 and Lmx1b CUT&RUN peaks with E14.5 ATAC-seq TACs showing that Pet1 and Lmx1b mostly occupy open chromatin. (d) Schematic of conditional Lmx1b targeting and labeling using Pet1-Cre transgene followed by FACS collection of TdTomato-positive neurons for ATAC-seq. (e) ATAC-seq quality metrics showing the distribution of total reads (left) and usable reads after filtering for mapping quality and PCR duplicates (right) for Lmx1b-cKO and DKO at E14.5. (f) ATAC-seq quality metrics showing library complexity plotted using three ENCODE data standards (NRF, PBC1, PBC2) (Landt et al., 2012) for Lmx1b-cKO and DKO 5-HT precursors assayed at E14.5. (g) PCA showing the distribution of E14.5 wildtype, Pet1-cKO, Lmx1b-cKO, and DKO neuron ATAC-seq data over two principal components. (h) Pet1 and Lmx1b mRNA levels in Pet1-cKO, Lmx1b-cKO, and DKO Pet1 neurons at E17.5. (i) Significant GO terms for the LOSS TACs in Lmx1b-cKO that are not significantly decreased in accessibility in Pet1-cKO. (j) The number of TACs that are differentially accessible between Pet1-cKO, Lmx1b-cKO, and DKO neurons by fold change >2, FDR < 0.01 (left). Overlap of TACs showing loss (middle) or gain (right) of chromatin accessibility in Pet1-cKO, Lmx1b-cKO, and DKO Pet1 neurons relative to wildtype.(k) Top enriched motifs within TACs showing loss of accessibility in Pet1-cKO (top), Lmx1b-cKO (middle), or DKO (bottom) neurons relative to wildtype. Highly similar motif hits are combined and assigned to their closest match of a TF class or family. The TF families are then ranked by fold enrichment. Fold enrichment and p-value are calculated and visualized by the Bioconductor package monaLisa.
Figure 7 with 1 supplement

Loss of Pet1 and Lmx1b alters chromatin accessibility at synaptic gene enhancers and disrupts 5-HT neuron connectivity.
(a) GO analysis of all Pet1- and/or Lmx1b-maintained TACs identified from E14.5 DKO ATAC-seq datasets, depicted as volcano plot of enrichment (x-axis) vs. FDR statistical significance (y-axis), showing many synapse and axon biological processes among the top enriched annotations. (b) Percent of Pet1- and/or Lmx1b-regulated TACs that gain or lose accessibility (blue) or gain accessibility (red) in wildtype Pet1 neurons from E11.5 to E17.5. For example, 33% of all TACs are dynamic and 22% gain accessibility. In contrast, 62% of Lmx1b-regulated TACs are dynamic and 50% gain accessibility. (c) Genome browser tracks of gene-enhancer pairings, ATAC-seq, Pet1 and Lmx1b CUT&RUN, and histone modification ChIPmentation signals at synaptic genes Syt1 and Slc17a8. Tracks show the changes in chromatin accessibility between wildtype (red), Pet1-cKO (yellow), Lmx1b-cKO (yellow), and DKO (yellow) Pet1 neurons within the highlighted (blue) regions at E14.5. Display data ranges for the zoomed-out panels are optimized based on the blue highlighted regions. (d) Relative expression (FPKMs) of Syt1 and Slc17a8 in rostral Pet1-cKO, Lmx1b-cKO, and DKO neurons at E17.5. Data presented as mean ± SEM. *, FDR<.05. (e) Differential expression (from E11.5 to E17.5) of the genes associated with Pet1-occupied TACs in Pet1-cKO vs. wildtype 5-HT neurons (left), genes associated with Pet1-occupied TACs in Lmx1b-cKO vs. wildtype 5-HT neurons (middle), and genes associated with Pet1 and Lmx1b co-occupied TACs in DKO vs. wildtype 5-HT neurons (right). (f) TdTomato (red) and DAPI (blue) co-staining of pericellular baskets in the medial septum of P15 Pet1-Cre; Rosa26Ai9 wildtype, Pet1-cKO, Lmx1b-cKO, and DKO mice. (g) Diagram showing the analyzed brain area and quantification of TdTomato axons (pixels/μm2) (two-way ANOVA; n = 3 animals per genotype and 2 quantified brain sections per animal) (bottom panels). Images were generated through automatic stitching of individual 20× images. (h) Representative immunohistochemistry images of Syt1, TdTomato, and DAPI in the dorsolateral septum of P15 Pet1-Cre; Rosa26Ai9 mice showing the decreased overlap of Syt1 (green) and TdTomato (red) signals in KO animals compared to wildtype. Images were generated through automatic stitching of individual 63× images. (i) Representative immunohistochemistry images of vGlut3 (Slc17a8), TdTomato, and DAPI in the medial septum of adult Pet1-Cre; Rosa26Ai9 mice showing the decreased overlap of vGlut3 (green) and TdTomato (red) signals in KO animals compared to wildtype. Images were generated through automatic stitching of individual 63× images. (j) Quantification of Syt1 (left) and vGlut3 (right) co-localization with TdTomato in the medial septum as a percentage of the total TdTomato signal (two-way ANOVA; n = 2 animals per genotype and 3–4 quantified images per animal). *, P<.05; **, P<.01; ***, P<.001; ****, P<.0001 in panels e, g, j.
Figure 7—figure supplement 1
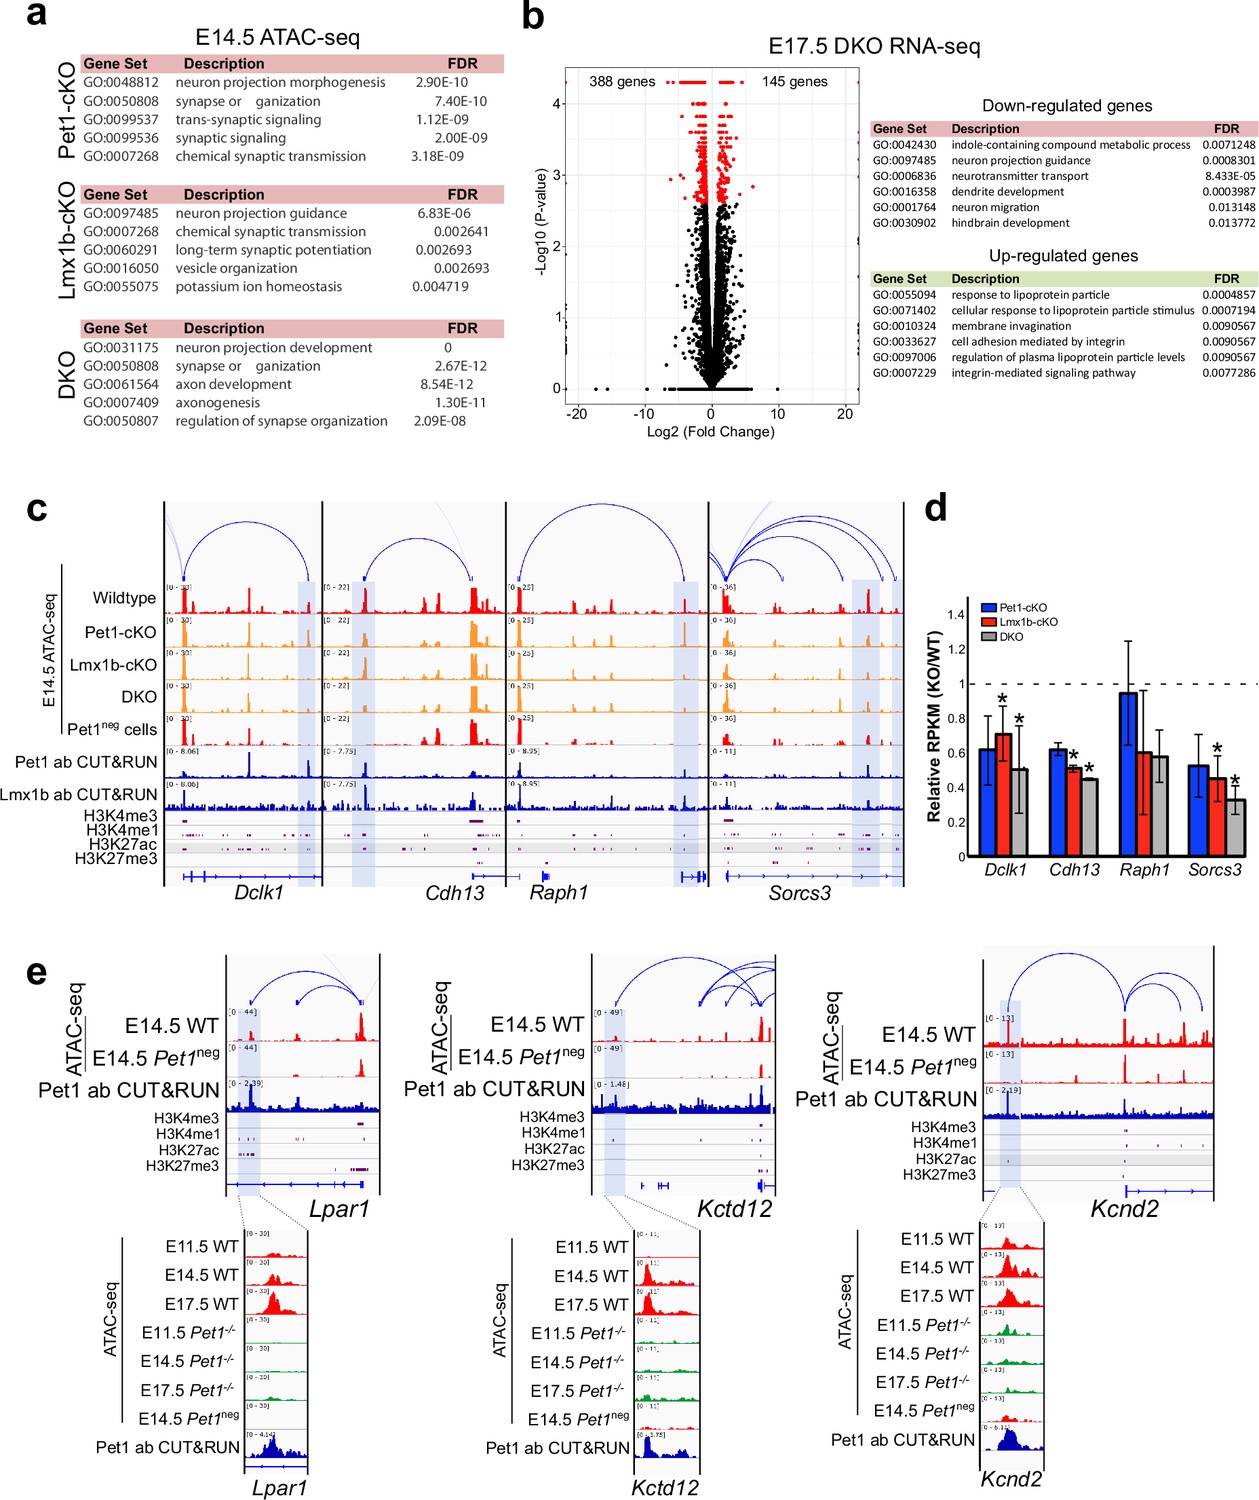
Pet1 and Lmx1b control chromatin access to synapse and axon gene linked TACs.
(a) Top gene ontology terms for the differentially accessible TACs in Pet1-cKO (top), Lmx1b-cKO (middle), and DKO Pet1 neurons (bottom) ranked by fold enrichment. (b) Left: volcano plot for E17.5 rostral Lmx1b-cKO vs. control differential gene expression. Significantly altered genes are in red with ≥log2(1.5×) and FDR ≥ 0.05. Right: biological process GO term enrichment of Lmx1b-regulated genes with the top enrichment ratios. (c) Genome browser tracks showing the gene-enhancer pairings and the ATAC-seq, Pet1 and Lmx1b CUT&RUN, and histone modification ChIPmentation signals at select axon-related genes Dclk1, Cdh13, Raph1, and Sorcs3. Display data ranges are scaled to the peaks in the blue highlighted regions. (d) Relative expression (FPKMs) of Dclk1, Cdh13, Raph1, and Sorces 3 in rostral Pet1-cKO, Lmx1b-cKO, and DKO neurons at E17.5. Data presented as mean ± SEM. (e) Genome browser tracks showing the gene-enhancer pairings and the ATAC-seq, Pet1 CUT&RUN, and histone modification ChIPmentation signals at synaptic genes that require Pet1 for chromatin opening. Zoomed-in displays show changes in chromatin accessibility between wildtype (red) and Pet1-/- (green) 5-HT precursors within the highlighted (blue) regions across developmental time points. Display data ranges for the top zoomed-out panels are scaled to the peak in the blue highlighted regions. *, FDR<.05.
Author response image 1

Additional files
-
Transparent reporting form
- https://cdn.elifesciences.org/articles/75970/elife-75970-transrepform1-v2.docx
-
Source data 1
TAC-gene predictions.
- https://cdn.elifesciences.org/articles/75970/elife-75970-data1-v2.csv
Download links
A two-part list of links to download the article, or parts of the article, in various formats.
Downloads (link to download the article as PDF)
Open citations (links to open the citations from this article in various online reference manager services)
Cite this article (links to download the citations from this article in formats compatible with various reference manager tools)
Reorganization of postmitotic neuronal chromatin accessibility for maturation of serotonergic identity
eLife 11:e75970.
https://doi.org/10.7554/eLife.75970


