Age-dependent aggregation of ribosomal RNA-binding proteins links deterioration in chromatin stability with challenges to proteostasis
- Department of Molecular Biology, Division of Biological Sciences, University of California, San Diego, United States
- Department of Bioengineering, University of California, San Diego, United States
- Department of Chemistry and Biochemistry, University of California, San Diego, United States
- Synthetic Biology Institute, University of California, San Diego, United States
- UCSD Moores Cancer Center, University of California San, Diego, United States
Figures
Figure 1 with 6 supplements
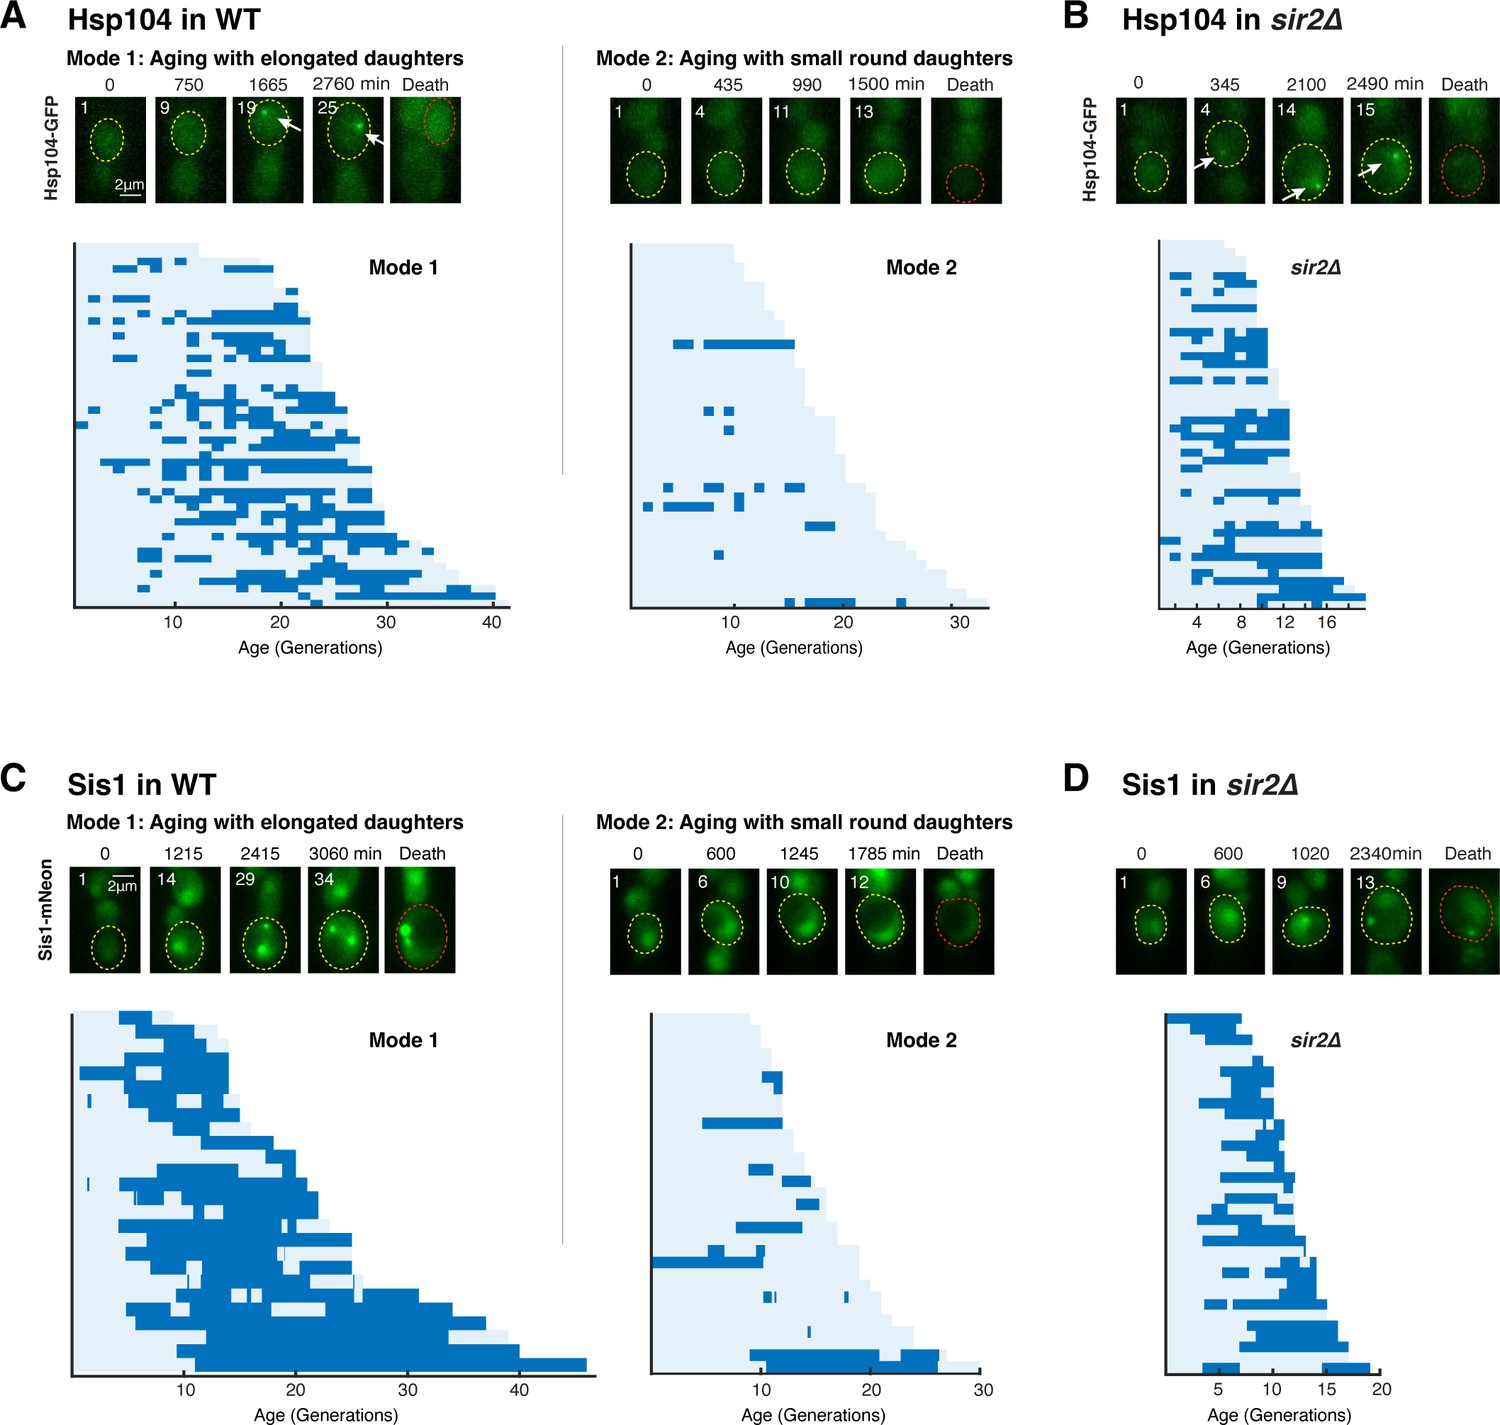
A challenge to proteostasis occurs specifically in aging cells that undergo loss of rDNA stability.
(A) Hsp104 foci formation during aging of WT cells. Top: representative time-lapse images of Hsp104-GFP in WT Mode 1 and Mode 2 aging processes. Replicative age of mother cell is shown at the top-left corner of each image. For phase images, aging and dead mothers are marked by yellow and red arrows, respectively. In fluorescence images, aging and dead mother cells are circled in yellow and red, respectively. White arrows point to fluorescence foci of Hsp104-GFP. Mode 1 and Mode 2 cells were classified based on their age-dependent changes in their daughter morphologies (Li et al., 2020). Bottom: single-cell color map trajectories of Hsp104-GFP foci formation in WT Mode 1 and Mode 2 cells. Each row represents the time trace of a single cell throughout its lifespan. Color represents the absence (light blue) or presence (dark blue) of foci within a given cell cycle. Cells are sorted based on their lifespans. Single-cell color map trajectories of iRFP fluorescence and cell cycle length from the same cells are shown in Figure 1—figure supplement 1 to confirm the classification of Mode 1 and Mode 2. (B) Hsp104 foci formation during aging of sir2∆ cells. Top: representative time-lapse images of Hsp104-GFP in sir2∆ cells during aging. Bottom: single-cell color map trajectories of Hsp104-GFP foci formation in sir2∆ cells. (C) Sis1 foci formation during aging of WT cells. Top: representative time-lapse images of Sis1-mNeon in WT Mode 1 and Mode 2 aging processes. Note that the expression level of Sis1 in young cells is relatively uniform and does not correlate with the cell’s future aging path, Mode 1 vs. Mode 2. Bottom: single-cell color map trajectories of Sis1-mNeon foci formation in WT Mode 1 and Mode 2 cells. (D) Sis1 foci formation during aging of sir2∆ cells. Top: representative time-lapse images of Sis1-mNeon in sir2∆ cells during aging. Bottom: single-cell color map trajectories of Sis1-mNeon foci formation in sir2∆ cells.
Figure 1—figure supplement 1
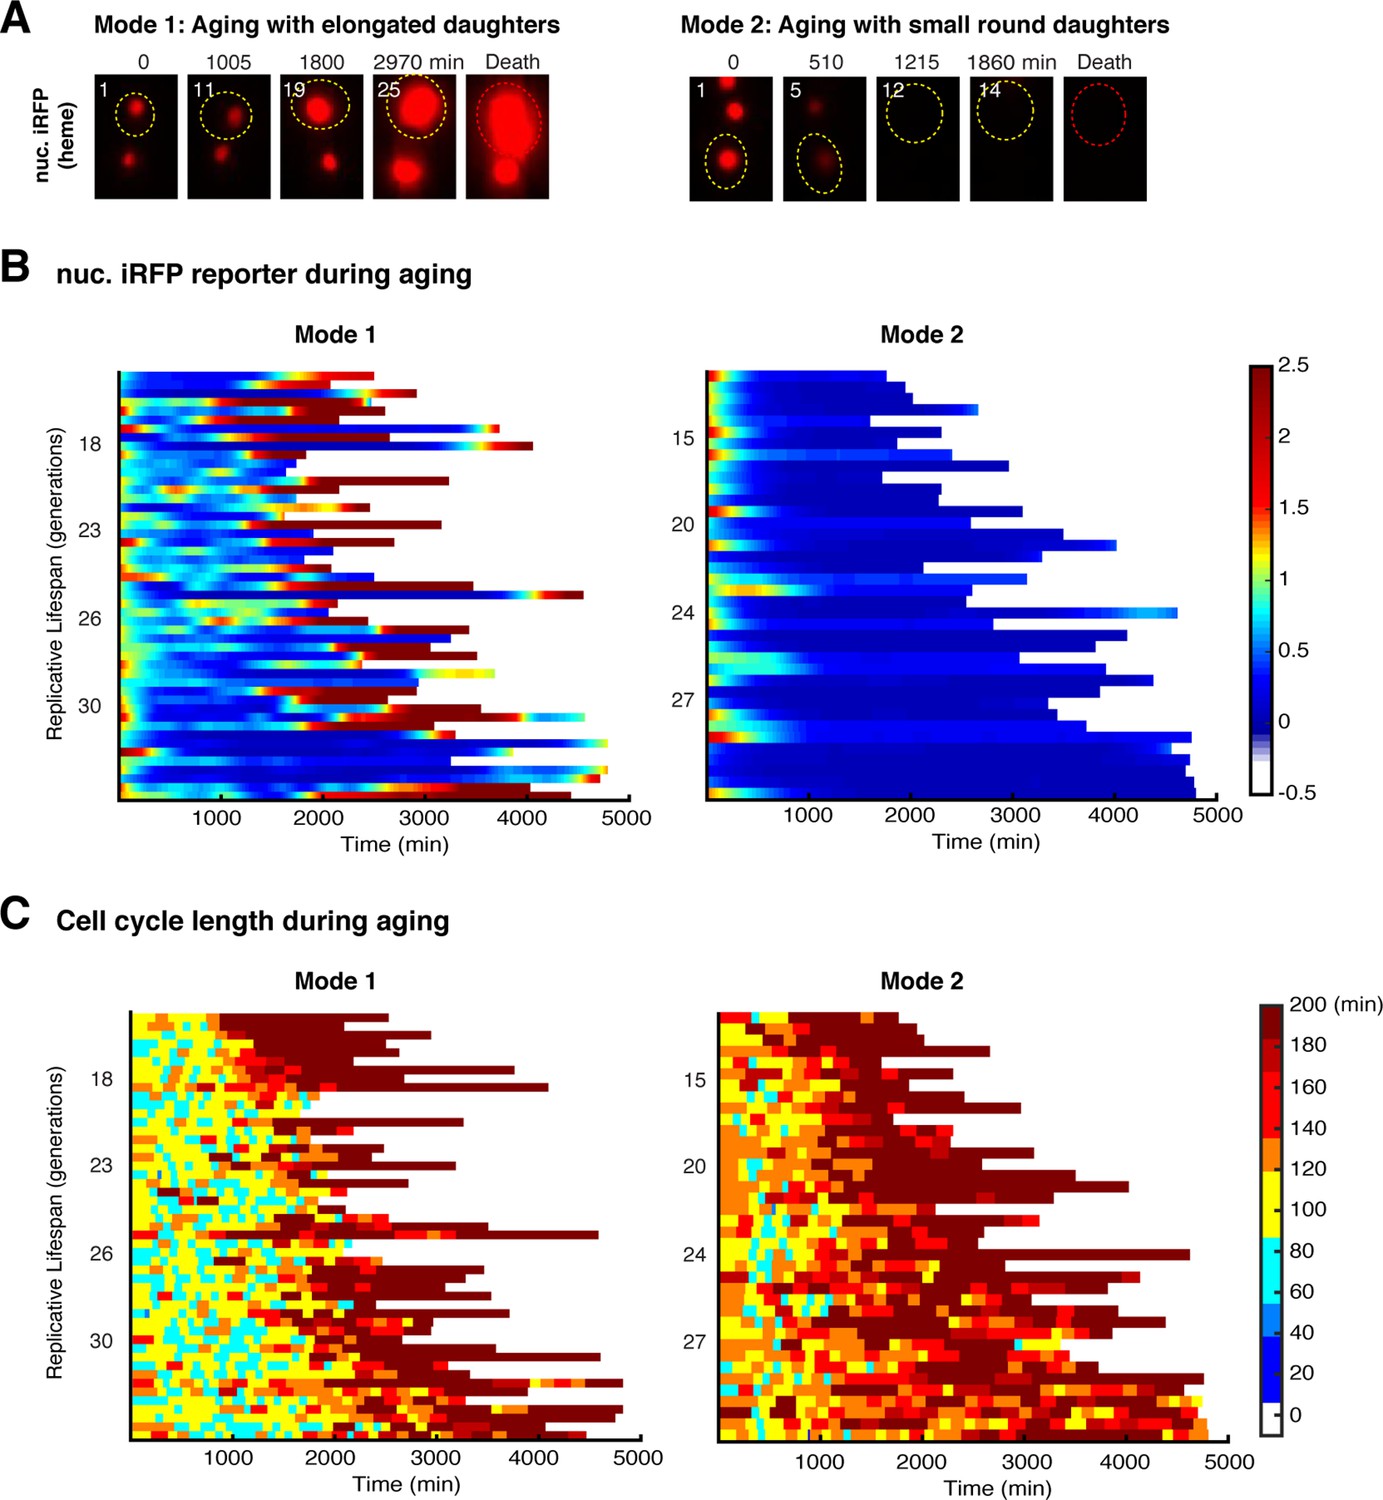
Age-dependent dynamics of iRFP fluorescence and cell cycle length used to confirm the classification of Mode 1 and Mode 2 cells.
(A) Representative time-lapse images of iRFP fluorescence during WT Mode 1 and Mode 2 aging processes. Replicative age of mother cell is shown at the top-left corner of each image. Aging and dead mother cells are circled in yellow and red, respectively. Single-cell color map trajectories of (B) iRFP fluorescence and (C) cell cycle length for WT Mode 1 (left) and Mode 2 (right) aging cells. Each row represents the time trace of a single cell throughout its lifespan. Color represents fluorescence intensity as indicated in the color bar. Cells are sorted based on their lifespans. Data in (B) and (C) are from the same cells in Figure 1B and are shown to confirm the classification of Mode 1 and Mode 2 aging cells (Li et al., 2020).
Figure 1—figure supplement 2
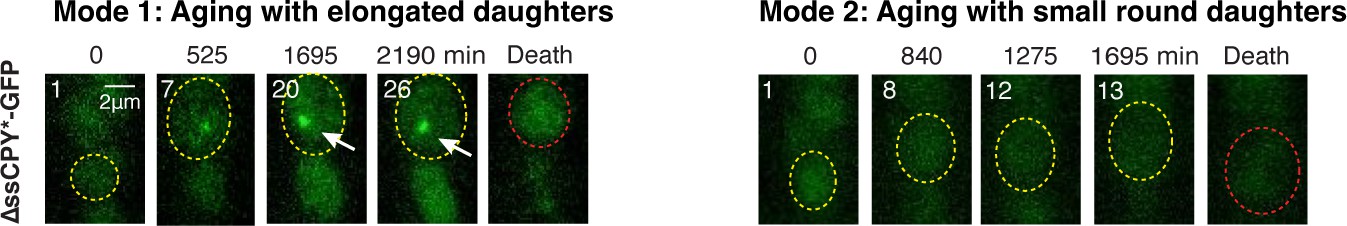
∆ssCPY*-GFP forms aggregates specifically in Mode 1 aging cells.
Representative time-lapse images of ∆ssCPY*-GFP during WT Mode 1 and Mode 2 aging processes. Time-lapse images are representative of all Mode 1 and Mode 2 cells measured in this study. Replicative age of mother cell is shown in white at the top-left corner of each image. Aging and dead mother cells are circled in yellow and red, respectively.
Figure 1—figure supplement 3
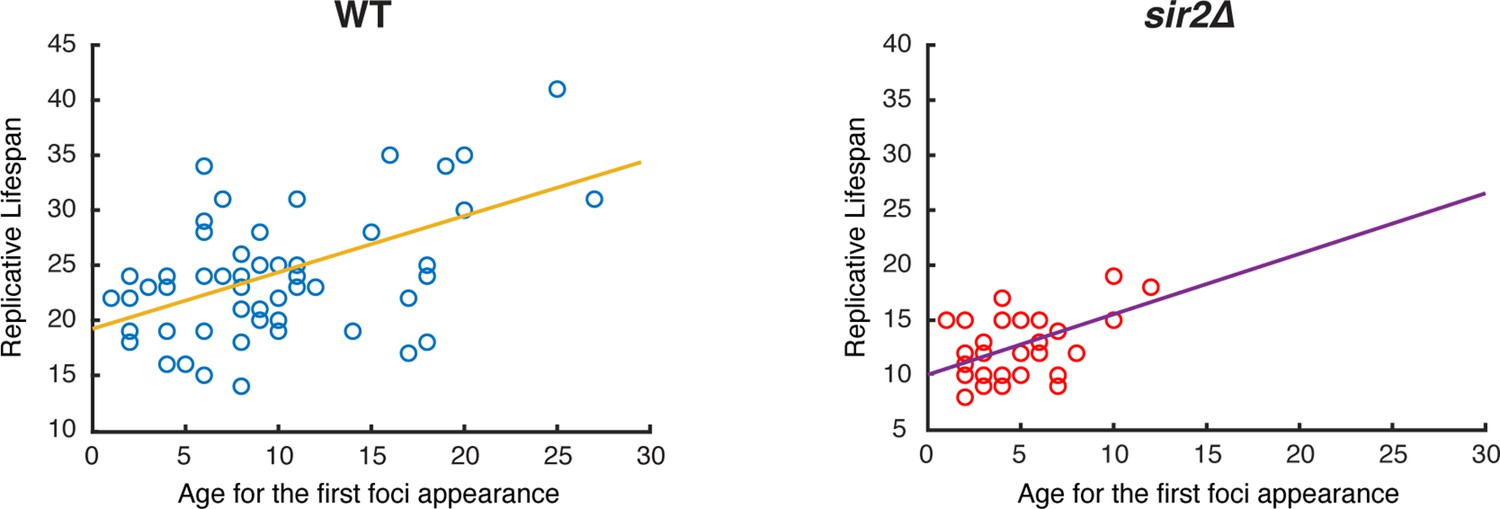
Relationship between the age at first Hsp104 foci appearance and final lifespan in single cells.
Each circle represents a single aging cell. Blue circles denote WT cells, and red circles denote sir2∆ cells. Single-cell data are from Figure 1B and D. The yellow and purple trend lines represent the lines of best fit for all points.
Figure 1—figure supplement 4
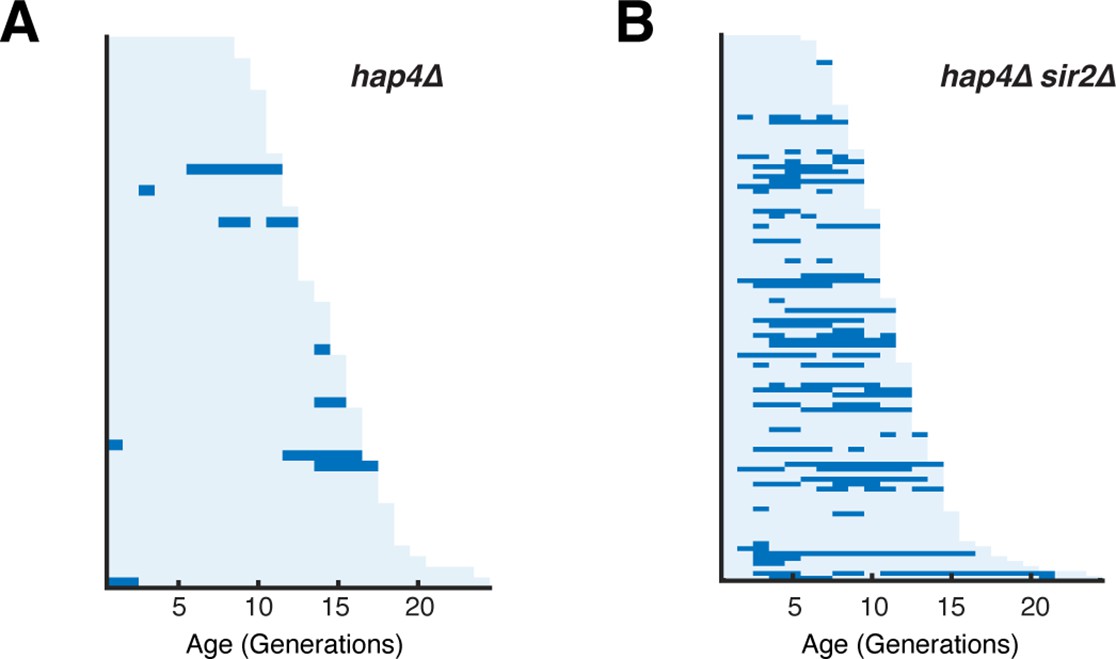
Hsp104 foci formation in hap4Δ and hap4Δ sir2Δ.
(A) Single-cell color map trajectories of Hsp104-GFP foci formation in hap4Δ cells. Each row represents the time trace of a single cell throughout its lifespan. Color represents the absence (light blue) or presence (dark blue) of foci within a given cell-cycle. Cells are sorted based on their lifespans. (B) Single-cell color map trajectories of Hsp104-GFP foci formation in hap4Δ sir2Δ cells.
Figure 1—video 1
Tracking Hsp104-GFP during aging of a representative WT Mode 1 cells.
White arrow points to the mother cell undergoing Mode 1 aging.
Figure 1—video 2
Tracking Hsp104-GFP during aging of a representative WT Mode 2 cells.
White arrow points to the mother cell undergoing Mode 2 aging.
Figure 2 with 2 supplements

A screen identifies 27 RNA-binding proteins (RBPs) that aggregate in response to loss of Sir2 activity.
(A) Schematic of the yTRAP synthetic genetic system that functions by coupling aggregation states of proteins to the expression of a fluorescent reporter. (A) has been adapted and modified from Figure 1A in Newby et al., 2017. (B) Representative images of yeast cells following 5 mM nicotinamide (NAM) treatment. Top: phase images; bottom: fluorescence images of rDNA GFP. (C) Representative time-lapse images of Hsp104-GFP cells treated with NAM during aging. (D) Representative time traces of fluorescence changes for a ‘non-responder’ sensor strain (top) and ‘responder’ sensor strains (middle, bottom). NAM induction time shown on graph in gray. Purple shades represent standard deviations of the traces. The time traces show raw fluorescence without normalization. (E) Functional categories of RBPs tested (left), the responders with more than 50% decrease in normalized fluorescence signal upon NAM (middle), and the responders with more than 75% decrease in normalized fluorescence signal upon NAM (right). Complete lists of RBPs tested and responder RBPs are included in Figure 2—figure supplement 1.
-
Figure 2—source data 1
Time traces of normalized fluorescence signals for each of the 170 RBPs tested in yTRAP library.
- https://cdn.elifesciences.org/articles/75978/elife-75978-fig2-data1-v2.csv
Figure 2—figure supplement 1
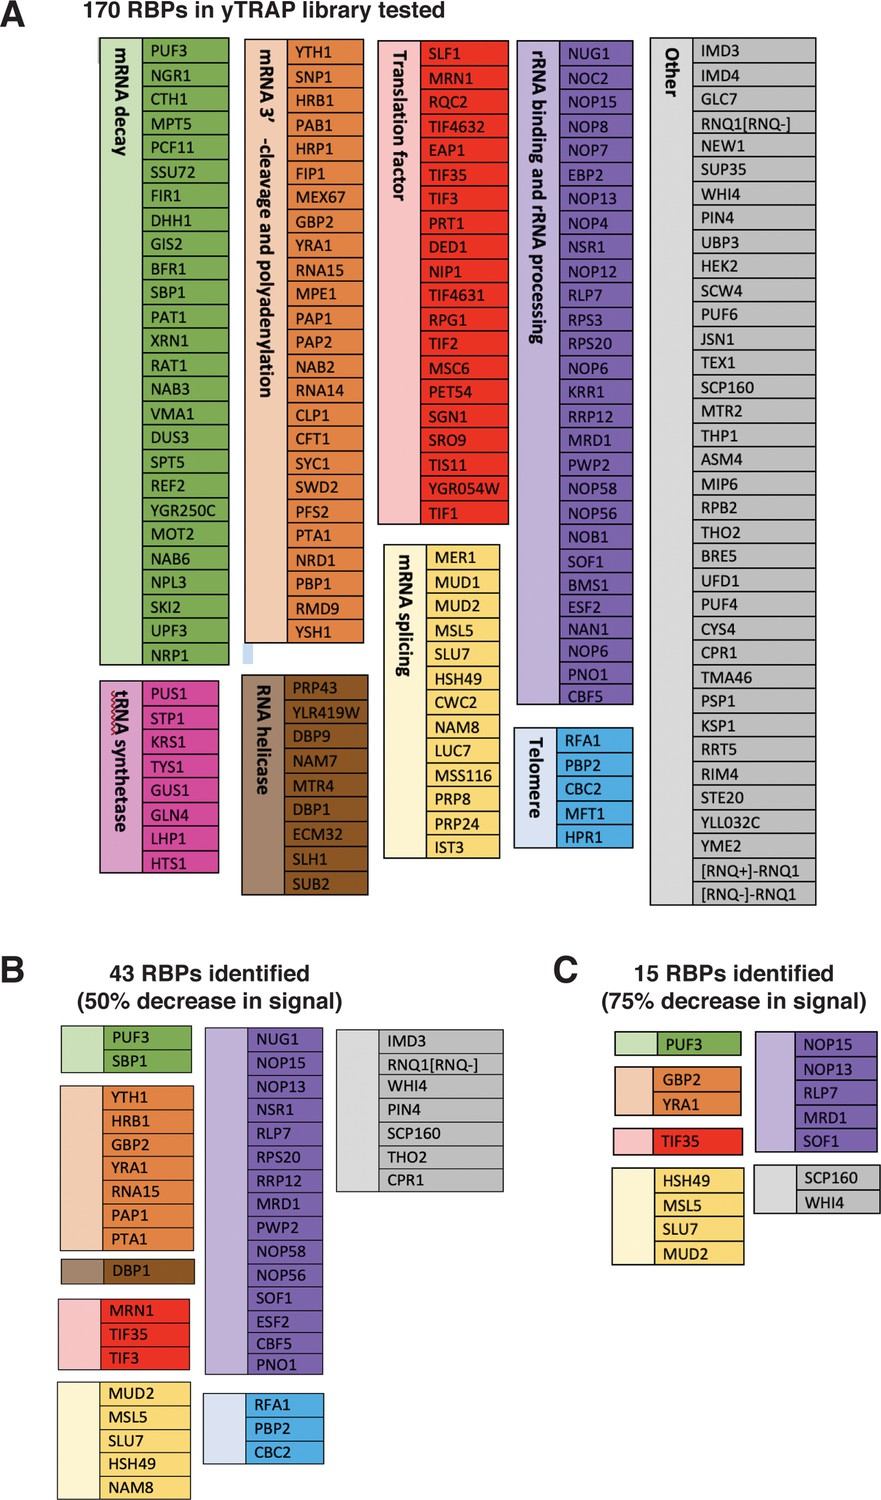
Lists of RNA-binding proteins (RBPs) in the yTRAP library tested and those identified as ‘Responders’ in the screen.
(A) The 170 RBPs in the yTRAP library tested in the screen and their functional categories. The colors of boxes correspond to the colors in the pie chart in Fig. 2E. Note that there were a few strains without detectable signals and hence were not tested in our screen. (B) The 43 RBPs identified from the screen displayed at least a 50% decrease in the normalized fluorescence signal. (C) The 15 RBPs identified from the screen showed a more than 75% decrease in the normalized fluorescence signal. These RBPs are considered “Responders” in our screen.
Figure 2—figure supplement 2
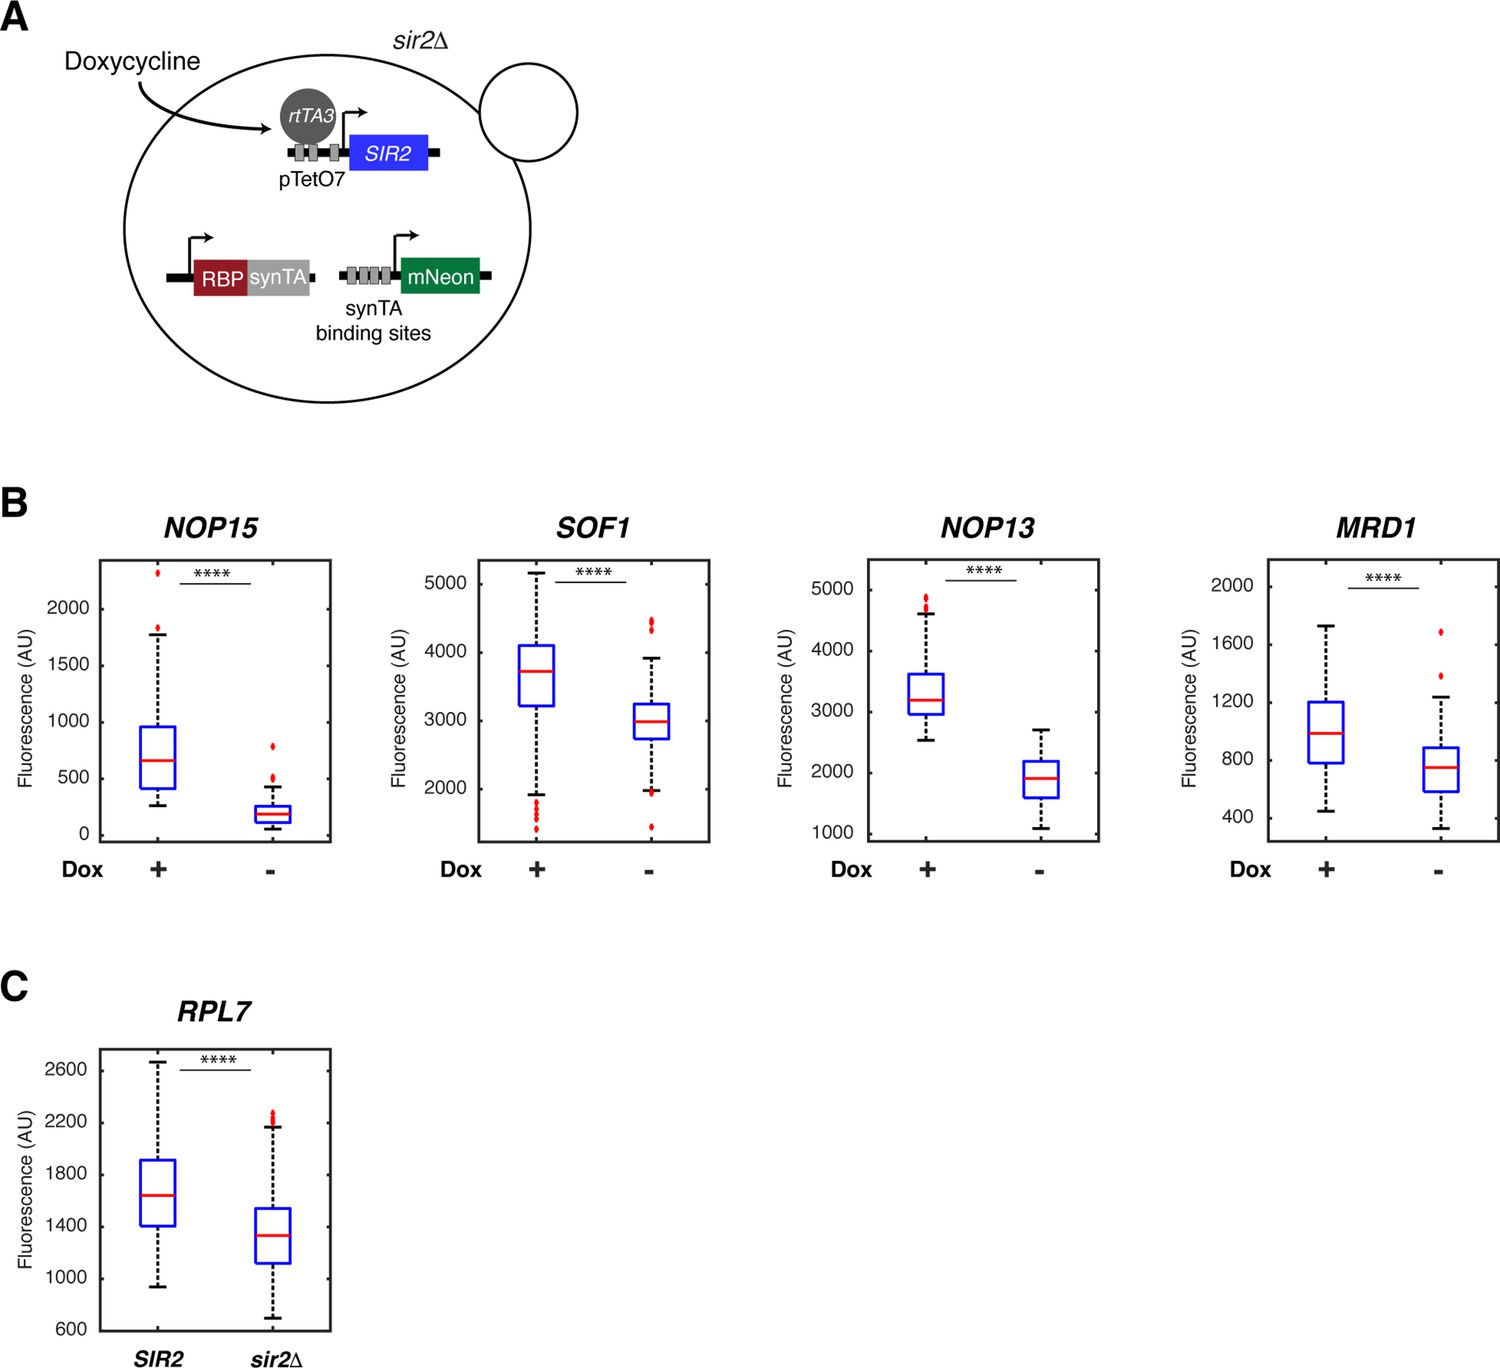
Confirmation of dependence on Sir2 for the top five rRNA-binding protein responders from the screen.
(A) Schematic of the strain construction that enables chemically controllable expression of Sir2 in the yTRAP sensor strains. The endogenous copy of SIR2 is deleted. Sir2 expression depends on the presence of doxycycline in the medium. (B) Boxplots show the single-cell fluorescence changes of yTRAP sensor strains for rRNA-binding protein responders in the presence (100 nM) or absence of doxycycline, as indicated. ****p<0.0001. Doxycycline itself (without the Sir2 expression system) does not affect the fluorescence of the yTRAP sensor cells (results not shown). (C) The RPL7 sensor strain showed considerable leakiness in the doxycycline-controlled expression system. Therefore, deletion of SIR2 was examined instead. Results in (B) and (C) demonstrated that rRNA-binding protein responders undergo aggregation (indicated by decreased sensor fluorescence) when Sir2 is repressed or deleted, confirming that aggregation of these rRNA-binding proteins is mediated specifically by Sir2.
Figure 3 with 2 supplements
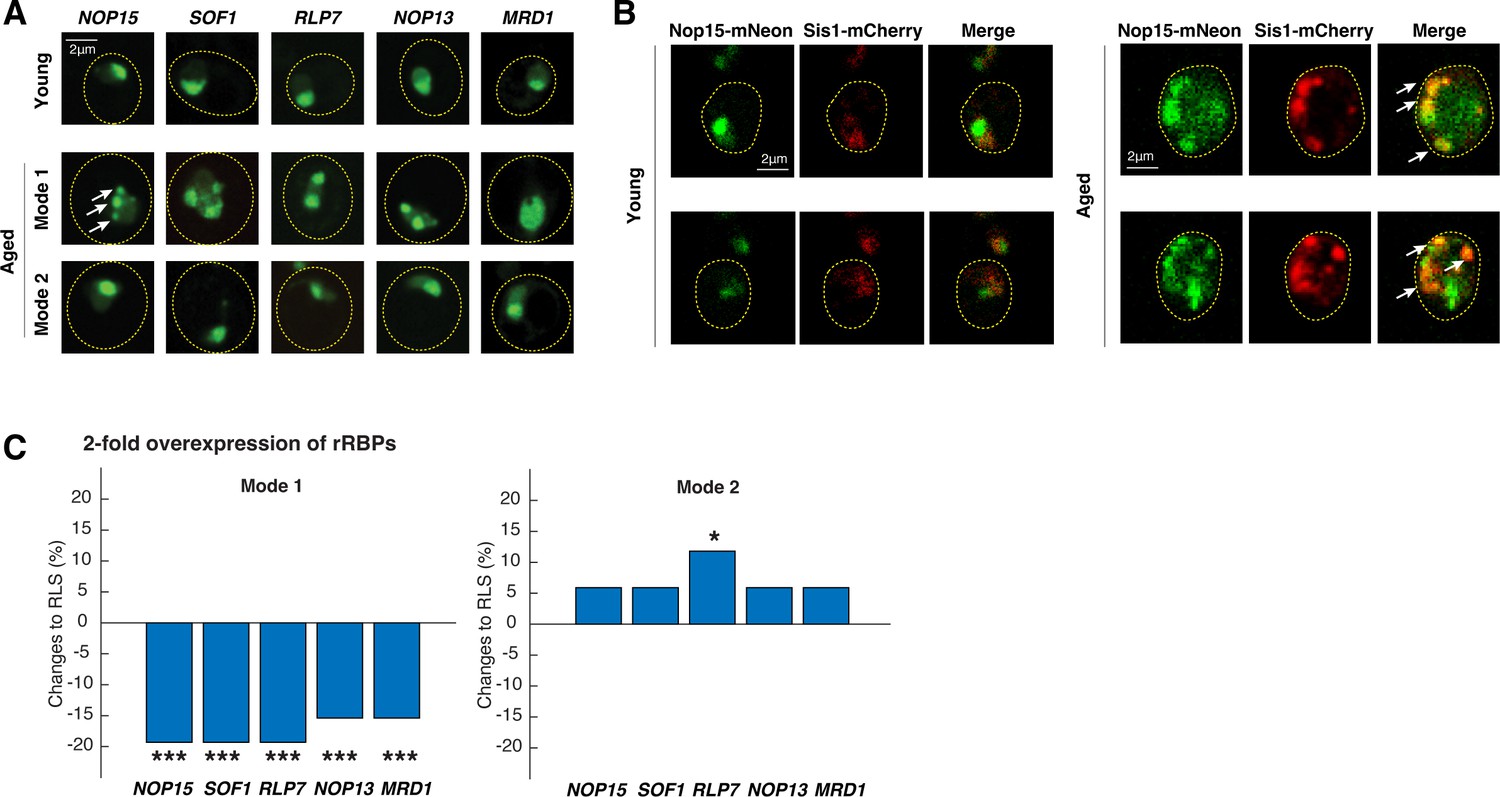
Age-dependent aggregation of rRNA-binding proteins and their effects on cellular lifespan.
(A) Representative confocal images of rRNA-binding proteins in young cells, Mode 1 aged, and Mode 2 aged cells. Young cells and aged mother cells are circled in yellow. White arrows point to the aggregates. (B) Representative confocal images of Nop15-mNeon and Sis1-mCherry in young (left) and aged Mode 1 (right) cells. Young cells and aged mother cells are circled in yellow. White arrows point to the colocalized aggregates. (C) The effects of twofold overexpression of each rRNA-binding protein on the lifespans of Mode 1 (left) and Mode 2 (right) cells. The percentage changes of the mean replicative lifespan (RLS) relative to that of WT have been shown in the bar graphs. Asterisk indicates the significance of the changes: ***p<0.001; *p<0.05. The complete RLS curves and p-values are shown in Figure 3—figure supplement 2.
Figure 3—figure supplement 1
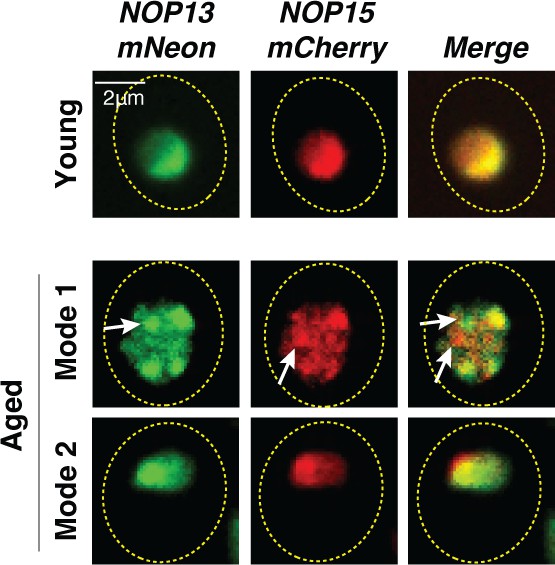
Partial loss of colocalization of Nop13 and Nop15 upon aggregation in Mode 1 aged cells.
Representative confocal images of Nop13-mNeon and Nop15-mCherry in young (top row), Mode 1 aged (middle row), and Mode 2 aged (bottom row) cells. White arrows point to Nop13 and Nop15 aggregates that are not colocalized in Mode 1 aged cells. Nop13 and Nop15, in the nonaggregated form, are colocalized in the nucleolus of young and Mode 2 aged cells.
Figure 3—figure supplement 2
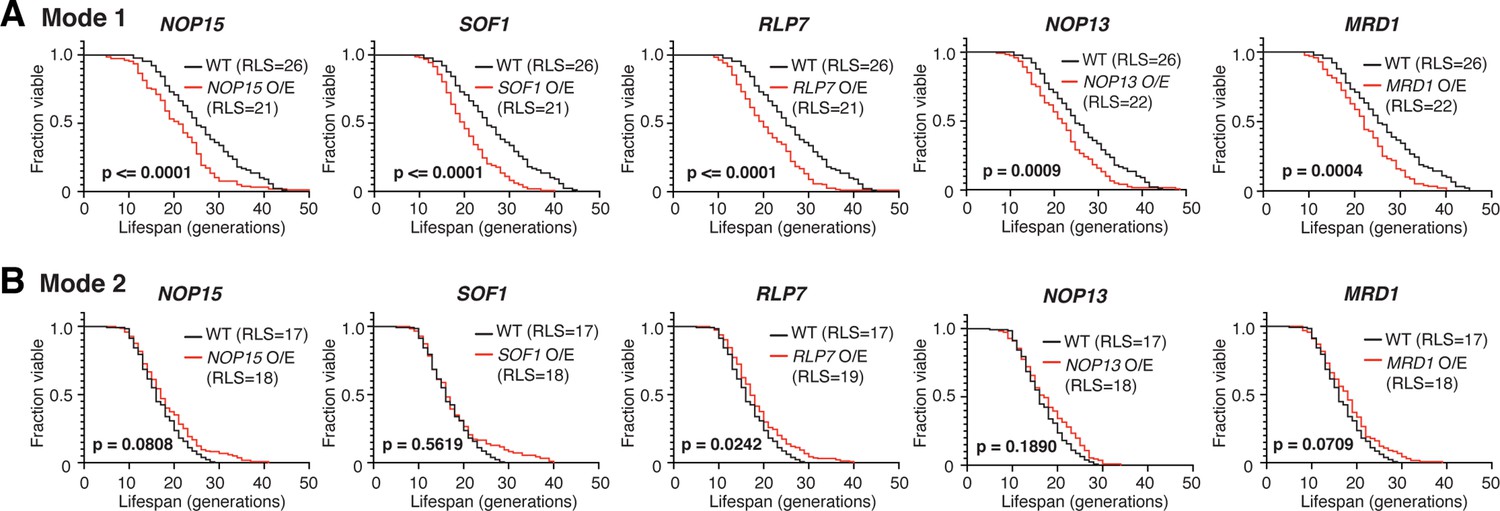
Replicative lifespans (RLSs) of Mode 1 and Mode 2 cells upon twofold overexpression of rRNA-binding proteins.
(A) RLS curves for Mode 1 cells in WT (n = 89), NOP15 twofold overexpression (O/E) (n = 156), SOF1 twofold O/E (n = 163), RLP7 twofold O/E (n = 190), NOP13 twofold O/E (n = 225), and MRD1 twofold O/E (n = 165). The mean RLSs for WT (blue) and each O/E mutant (red) are indicated. p-Values were calculated using the Gehan–Breslow–Wilcoxon method. (B) RLS curves for Mode 2 cells in WT (n = 127), NOP15 twofold O/E (n = 219), SOF1 twofold O/E (n = 180), RLP7 twofold O/E (n = 224), NOP13 twofold O/E (n = 111), and MRD1 twofold O/E (n = 230). Note that, in WT, Mode 1 cells have a longer RLS (RLS = 26) than that of Mode 2 cells (RLS = 17), as reported previously (Li et al., 2020).
Figure 4 with 2 supplements
Age-dependent aggregation of Nop15 in various mutants.
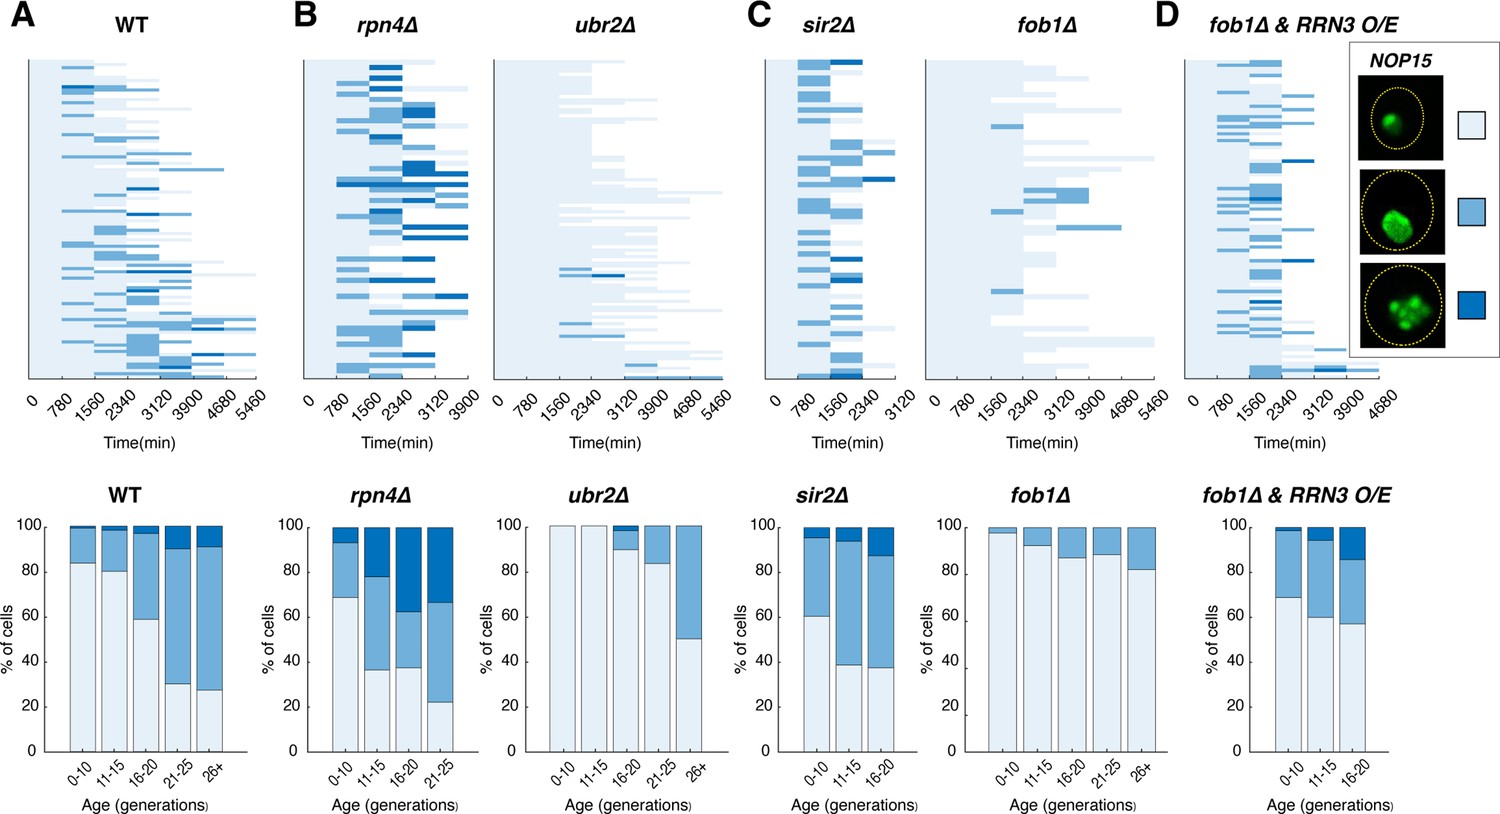
Single-cell color map trajectories indicate the timing and extent of age-dependent Nop15 aggregation in (A) WT, (B, left) rpn4∆, (B, right) ubr2∆, (C, left) sir2∆, (C, right) fob1∆, and (D) fob1∆ + RRN3 overexpression (O/E). Each row tracks the aggregation state of a single aging cell. Confocal images were acquired at indicated time points during aging experiments. As indicated in the legend on the right, the aggregation state of Nop15 in each aging cell was classified as ‘no aggregation’ – evenly distributed fluorescence with a normal crescent shape (light blue), ‘moderate aggregation’ – unevenly distributed fluorescent patches with irregular shapes (blue), or ‘severe aggregation’ – multiple distinct fluorescent foci (dark blue). Bottom panels: bar charts show the percentage of cells in each aggregation state as a function of age, quantified from the data in corresponding top panels. For RRN3 O/E, a TetO-inducible RRN3 construct was integrated into the fob1∆ strain. Upon loading into the device, cells were exposed to 2 μM doxycycline to induce RRN3 overexpression throughout the aging experiment. As a control, fob1∆ cells without the inducible RRN3 construct were exposed to doxycycline to exclude the possibility that the drug treatment itself causes enhanced aggregation (Figure 4—figure supplement 2).
Figure 4—figure supplement 1

Nop15 aggregation tracks the age-induced changes in rDNA copy numbers.
(A) Representative time-lapse images of rDNA-LacI-GFP during aging. Replicative age of the mother cell is shown at the top-right corner of each image. The aging mother cell is circled in yellow. To monitor changes in rDNA copy numbers during aging, we used a strain in which 50× lacO elements were inserted into each rDNA repeat within the rDNA region (Miyazaki and Kobayashi, 2011). The strain also contains a constitutively expressed GFP-LacI reporter, which binds to the lacO elements in rDNA and the nuclear fluorescence of which correlates with the rDNA copy number (Morlot et al., 2019). (B) Quantified GFP-LacI nuclear fluorescence as a function of age. The age-dependent trace is overlaid with a bar chart showing the percentage of cells in each Nop15 aggregation state as a function of age, from Figure 4A. The aggregation states are illustrated in the legend on the right.
Figure 4—figure supplement 2
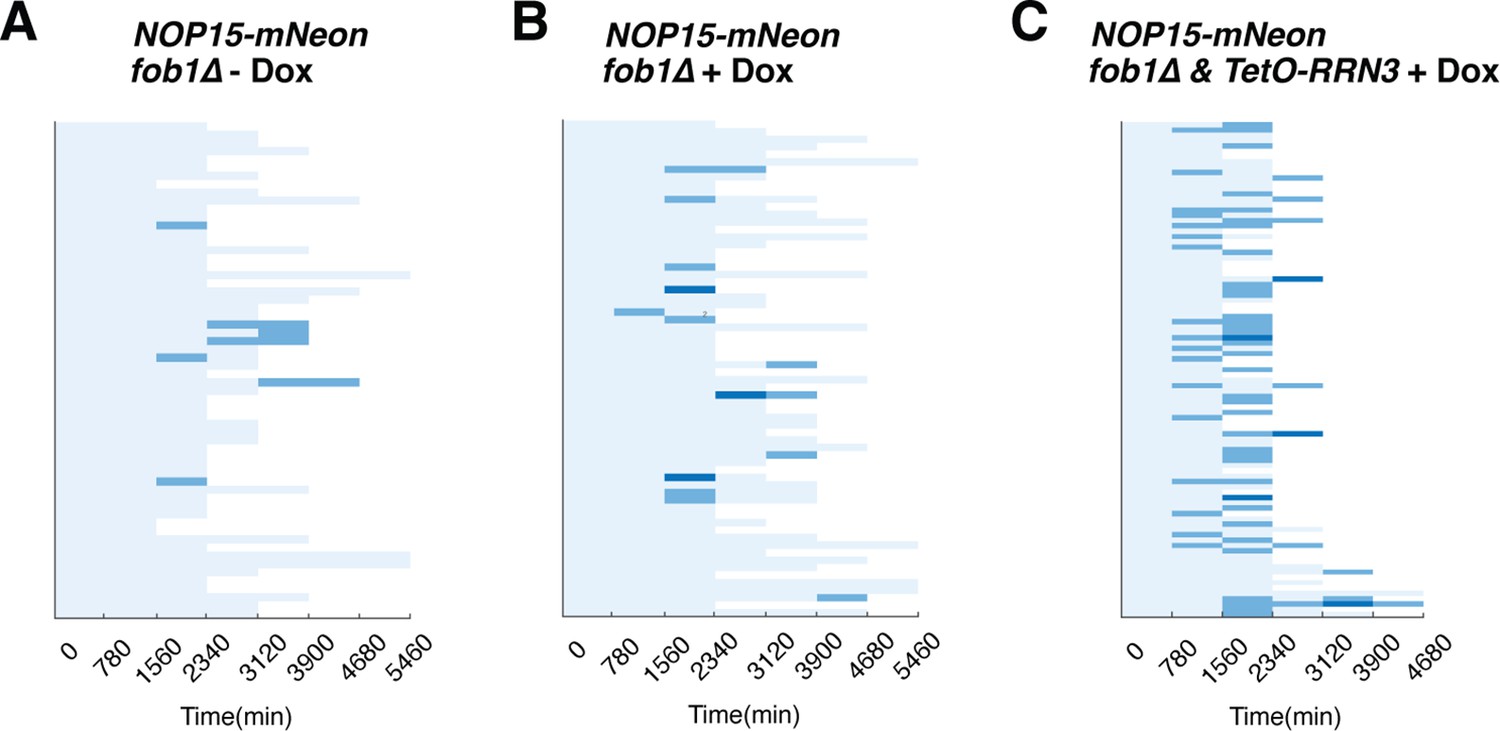
The effect of doxycycline on Nop15 aggregation.
Single-cell color map trajectories indicate the timing and extent of age-dependent Nop15 aggregation in fob1∆, (A) without doxycycline, (B) with 2 μM doxycycline, and (C) fob1∆ + TetO-inducible RRN3 with 2 μM doxycycline. Each row tracks the aggregation state of a single aging cell. Confocal images were acquired at indicated time points during the aging experiments. The aggregation state in each aging cell was classified as ‘no aggregation’ – evenly distributed fluorescence with a normal crescent shape (light blue), ‘moderate aggregation’ – unevenly distributed fluorescent patches with irregular shapes (blue), or ‘severe aggregation’ – multiple distinct fluorescent foci (dark blue), similar to that in Figure 4. Panels (A) and (C) are the same as Figure 4C, right, and Figure 4D, respectively. Panel (B) is the control in the same set of experiments to exclude the possibility that doxycycline itself, but not induced RRN3 overexpression, causes enhanced aggregation.
Figure 5 with 3 supplements

Elevated rRNA-binding protein aggregation promotes Hsp104-GFP foci formation during aging.
(A) Single-cell color map trajectories of Nop15-mNeon aggregation (green), Hsp104-mCherry foci (red), and co-presence of both aggregates (yellow) in WT Mode 1 and Mode 2 cells. Each row represents the time trace of a single cell throughout its lifespan. Cells are sorted based on their lifespans. (B) Boxplots show the distributions of percentage of lifespan with Hsp104-GFP foci appearance in single aging cells for WT (n = 87), sir2∆ (n = 46), fob1∆ (n = 60), fob1∆ + RRN3 overexpression (n = 117), and fob1∆ + NOP15 overexpression (n = 130). In the plot, the bottom and top of the box are first (the 25th percentile of the data, q1) and third quartiles (the 75th percentile of the data, q3); the red band inside the box is the median; the whiskers cover the range between q1-1.5x(q3-q1) and q3 + 1.5x (q3–q1). The RRN3 O/E and NOP15 O/E experiments were conducted as in Figure 4D.
Figure 5—figure supplement 1
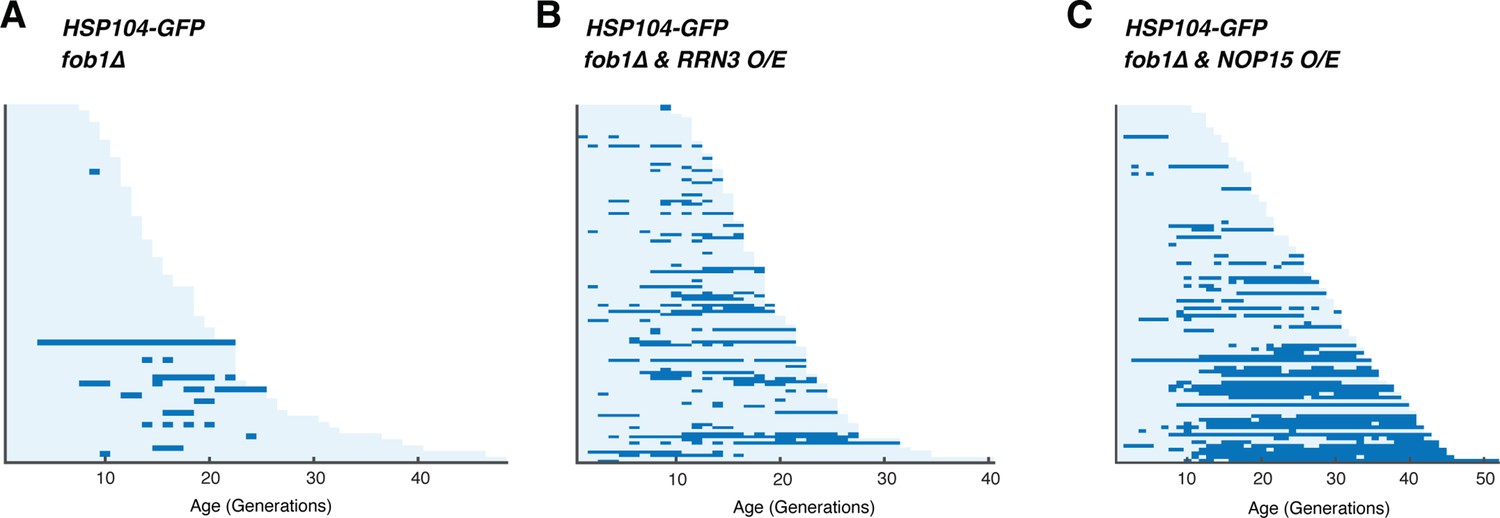
Single-cell color map trajectories for Hsp104 foci formation in (A) fob1∆, (B) fob1∆ + RRN3 o/e, and (C) fob1∆ + NOP15 ole.
Each row represents the time trace of a single cell throughout its lifespan. Color represents the absence (light blue) or presence (dark blue) of foci within a given cell cycle.
Figure 5—video 1
Visualizing Hsp104-mCherry and Nop15-mNeon during aging of a representative Mode 1 cell.
Figure 5—video 2
Visualizing Hsp104-mCherry and Nop15-mNeon during aging of a representative Mode 2 cell.
Figure 6
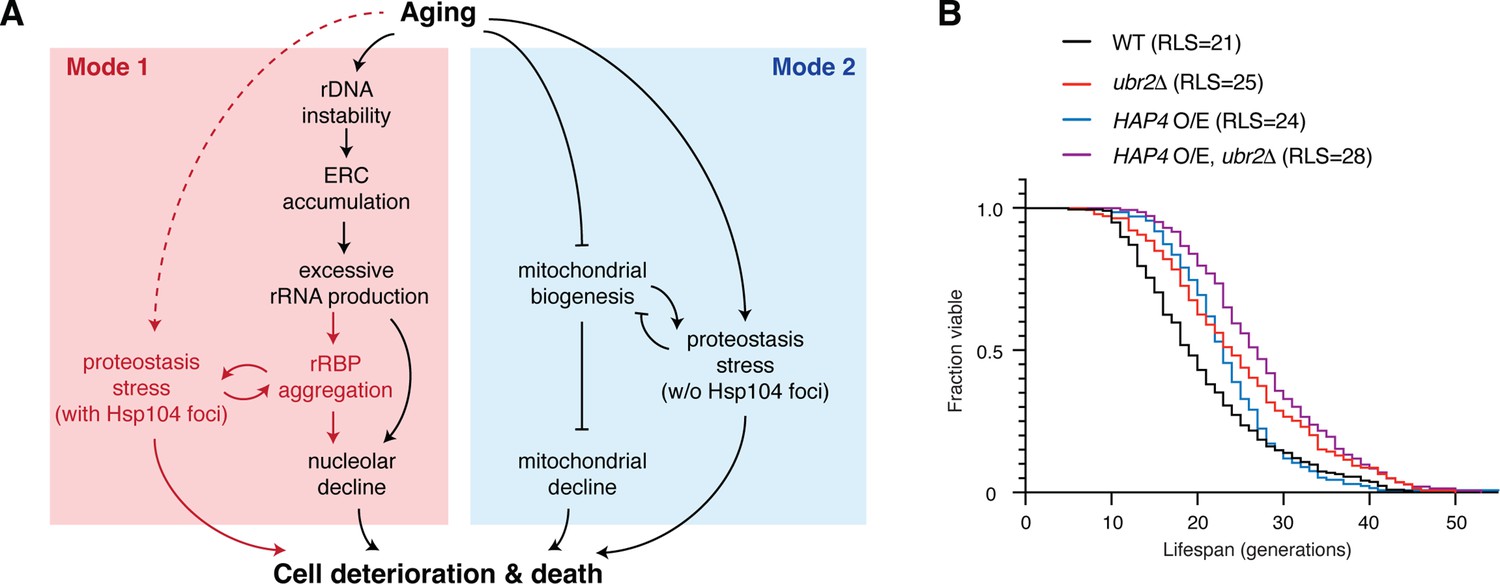
Challenges to proteostasis interact with the rDNA instability pathway and contribute to Mode 1 aging.
(A) A schematic depicts a working model for the divergent pathways underlying single-cell aging in yeast. Red portions highlight newly identified processes and interactions in this study. (B) Replicative lifespans (RLSs) for WT (n = 216), ubr2Δ (n = 139), HAP4 O/E (n = 134), and HAP4 O/E, ubr2Δ (n = 143). RLSs shown indicate the mean lifespans.
Tables
Key resources table
| Reagent type (species) or resource | Designation | Source or reference | Identifiers | Additional information |
|---|---|---|---|---|
| Recombinant DNA reagent | pRS306-PNOP15-NOP15-mNeon-TADH1 | This study | NHB0904 | See ‘Strain and plasmid construction’ for details |
| Recombinant DNA reagent | pRS306-PNOP15-NOP15-TADH1 | This study | NHB0902 | See ‘Strain and plasmid construction’ for details |
| Recombinant DNA reagent | pRS306-PSOF1-SOF1-mNeon-TADH1 | This study | NHB0892 | See ‘Strain and plasmid construction’ for details |
| Recombinant DNA reagent | pRS306-PSOF1-SOF1-TADH1 | This study | NHB0901 | See ‘Strain and plasmid construction’ for details |
| Recombinant DNA reagent | pRS306-PRLP7-RLP7-TADH1 | This study | NHB0896 | See ‘Strain and plasmid construction’ for details |
| Recombinant DNA reagent | pRS306-PNOP13-NOP13-mNeon-TADH1 | This study | NHB0893 | See ‘Strain and plasmid construction’ for details |
| Recombinant DNA reagent | pRS306-PNOP13-NOP13-TADH1 | This study | NHB0903 | See ‘Strain and plasmid construction’ for details |
| Recombinant DNA reagent | pRS306-PMRD1-MRD1-mNeon-TADH1 | This study | NHB0927 | See ‘Strain and plasmid construction’ for details |
| Recombinant DNA reagent | pRS306-PMRD1-MRD1-mNeon-TADH1 | This study | NHB0895 | See ‘Strain and plasmid construction’ for details |
| Recombinant DNA reagent | PRPL18B-rtTA3-TADH1-TetO7-PLEU2m-RRN3-mRuby2-TENO2-LEU2 | This study | NHB1148 | See ‘Strain and plasmid construction’ for details |
| Recombinant DNA reagent | PRPL18B-rtTA3-TADH1-TetO7-PLEU2m-NOP15-TENO2-LEU2 | This study | NHB1150 | See ‘Strain and plasmid construction’ for details |
| Strain, strain background (Saccharomyces cerevisiae) | BY4741 MATa his3∆1 leu2∆0 met15∆0 ura3∆0, NHP6a-iRFP-kanMX, HSP104-GFP-HIS3 | This study | NHGFP0068 | See ‘Strain and plasmid construction’ for details |
| Strain, strain background (S. cerevisiae) | BY4741 MATa his3∆1 leu2∆0 met15∆0 ura3∆0, NHP6a-iRFP-kanMX, HSP104-GFP-HIS3, sir2::CgURA3 | This study | NH0761 | See ‘Strain and plasmid construction’ for details |
| Strain, strain background (S. cerevisiae) | BY4741 MATa his3∆1 leu2∆0 met15∆0 ura3∆0, NHP6a-iRFP-kanMX, HSP104-GFP-HIS3, fob1::CgURA3 | This study | NH0778 | See ‘Strain and plasmid construction’ for details |
| Strain, strain background (S. cerevisiae) | BY4741 MATa his3∆1 leu2∆0 met15∆0 ura3∆0, NHP6a-iRFP-kanMX, SIS1-mNeon-URA3 | This study | NH1324 | See ‘Strain and plasmid construction’ for details |
| Strain, strain background (S. cerevisiae) | BY4741 MATa his3∆1 leu2-1 met15∆0 ura3-1, NHP6a-iRFP-kanMX, ura3-1::PPRC1-∆ssCPY*-GFP-URA3 | This study | NH1036 | See ‘Strain and plasmid construction’ for details |
| Strain, strain background (S. cerevisiae) | BY4741 MATa his3∆1 leu2∆0 met15∆0 ura3∆0, NHP6a-iRFP-kanMX, NOP15::PNOP15-NOP15-mNeon-TADH1-URA3 | This study | NH1212 | See ‘Strain and plasmid construction’ for details |
| Strain, strain background (S. cerevisiae) | BY4741 MATa his3∆1 leu2∆0 met15∆0 ura3∆0, NHP6a-iRFP-kanMX, SOF1::PSOF1-SOF1-mNeon-TADH1-URA3 | This study | NH1213 | See ‘Strain and plasmid construction’ for details |
| Strain, strain background (S. cerevisiae) | BY4741 MATa his3∆1 leu2∆0 met15∆0 ura3∆0, NHP6a-iRFP-kanMX, RLP7::PRLP7-RLP7-mNeon-TADH1-URA3 | This study | NH1187 | See ‘Strain and plasmid construction’ for details |
| Strain, strain background (S. cerevisiae) | BY4741 MATa his3∆1 leu2∆0 met15∆0 ura3∆0, NHP6a-iRFP-kanMX, NOP13::PNOP13-NOP13-mNeon-TADH1-URA3 | This study | NH1186 | See ‘Strain and plasmid construction’ for details |
| Strain, strain background (S. cerevisiae) | BY4741 MATa his3∆1 leu2∆0 met15∆0 ura3∆0, NHP6a-iRFP-kanMX, MRD1::PMRD1-MRD1-mNeon-TADH1-URA3 | This study | NH1251 | See ‘Strain and plasmid construction’ for details |
| Strain, strain background (S. cerevisiae) | BY4741 MATa his3∆1 leu2∆0 met15∆0 ura3∆0, NHP6a-iRFP-kanMX, NOP15::PNOP15-NOP15-TADH1-URA3 | This study | NH1218 | See ‘Strain and plasmid construction’ for details |
| Strain, strain background (S. cerevisiae) | BY4741 MATa his3∆1 leu2∆0 met15∆0 ura3∆0, NHP6a-iRFP-kanMX, SOF1::PSOF1-SOF1-TADH1-URA3 | This study | NH1216 | See ‘Strain and plasmid construction’ for details |
| Strain, strain background (S. cerevisiae) | BY4741 MATa his3∆1 leu2∆0 met15∆0 ura3∆0, NHP6a-iRFP-kanMX, RLP7::PRLP7-RLP7-TADH1-URA3 | This study | NH1211 | See ‘Strain and plasmid construction’ for details |
| Strain, strain background (S. cerevisiae) | BY4741 MATa his3∆1 leu2∆0 met15∆0 ura3∆0, NHP6a-iRFP-kanMX, NOP13::PNOP13-NOP13-TADH1-URA3 | This study | NH1219 | See ‘Strain and plasmid construction’ for details |
| Strain, strain background (S. cerevisiae) | BY4741 MATa his3∆1 leu2∆0 met15∆0 ura3∆0, NHP6a-iRFP-kanMX, MRD1::PMRD1-MRD1-TADH1-URA3 | This study | NH1215 | See ‘Strain and plasmid construction’ for details |
| Strain, strain background (S. cerevisiae) | BY4741 MATa his3∆1 leu2∆0 met15∆0 ura3∆0, NHP6a-iRFP-kanMX, NOP15::PNOP15-NOP15-mNeon-TADH1-URA3, sir2::CgHIS3 | This study | NH1477 | See ‘Strain and plasmid construction’ for details |
| Strain, strain background (S. cerevisiae) | BY4741 MATa his3∆1 leu2∆0 met15∆0 ura3∆0, NHP6a-iRFP-kanMX, NOP15::PNOP15-NOP15-mNeon-TADH1-URA3, rpn4::CgHIS3 | This study | NH1478 | See ‘Strain and plasmid construction’ for details |
| Strain, strain background (S. cerevisiae) | BY4741 MATa his3∆1 leu2∆0 met15∆0 ura3∆0, NHP6a-iRFP-kanMX, NOP15::PNOP15-NOP15-mNeon-TADH1-URA3, fob1::CgHIS3 | This study | NH1479 | See ‘Strain and plasmid construction’ for details |
| Strain, strain background (S. cerevisiae) | BY4741 MATa his3∆1 leu2∆0 met15∆0 ura3∆0, NHP6a-iRFP-kanMX, NOP15::PNOP15-NOP15-mNeon-TADH1-URA3, ubr2::CgHIS3 | This study | NH1630 | See ‘Strain and plasmid construction’ for details |
| Strain, strain background (S. cerevisiae) | BY4741 MATa his3∆1 leu2∆0 met15∆0 ura3∆0, NHP6a-iRFP-kanMX, NOP15::PNOP15-NOP15-mNeon-TADH1-URA3, leu2∆0:: PRPL18B-rtTA3-TADH1-TetO7-PLEU2m-RRN3-mRuby2-TENO2-LEU2, fob1::CgHIS3 | This study | NH1507 | See ‘Strain and plasmid construction’ for details |
| Strain, strain background (S. cerevisiae) | BY4741 MATa his3∆1 leu2∆0 met15∆0 ura3∆0, NHP6a-iRFP-kanMX, RDN1::NTS1-PTDH3-GFP-URA3, ubr2::CgHIS3 | This study | NH1408 | See ‘Strain and plasmid construction’ for details |
| Strain, strain background (S. cerevisiae) | BY4741 MATa his3∆1 leu2∆0 met15∆0 ura3∆0, NHP6a-iRFP-kanMX, RDN1::NTS1-PTDH3-GFP-URA3, HAP4::PTDH3-HAP4-LEU2, ubr2::CgHIS3 | This study | NH1642 | See ‘Strain and plasmid construction’ for details |
| Strain, strain background (S. cerevisiae) | BY4741 MATa his3∆1 leu2∆0 met15∆0 ura3∆0, NHP6a-iRFP-kanMX, HSP104-GFP-HIS3, fob1::CgURA3, leu2∆0:: PRPL18B-rtTA3-TADH1-TetO7-PLEU2m-RRN3-mRuby2-TENO2-LEU2, | This study | NH1666 | See ‘Strain and plasmid construction’ for details |
| Strain, strain background (S. cerevisiae) | BY4741 MATa his3∆1 leu2∆0 met15∆0 ura3∆0, NHP6a-iRFP-kanMX, HSP104-GFP-HIS3, fob1::CgURA3, leu2∆0:: PRPL18B-rtTA3-TADH1-TetO7-PLEU2m-NOP15-TENO2-LEU2 | This study | NH1685 | See ‘Strain and plasmid construction’ for details |
| Strain, strain background (S. cerevisiae) | BY4741 MATa his3∆1 leu2∆0 met15∆0 ura3∆0, NHP6a-iRFP-kanMX, HSP104-GFP-HIS3, hap4::CgURA3 | This study | NH0815 | See ‘Strain and plasmid construction’ for details |
| Strain, strain background (S. cerevisiae) | BY4741 MATa his3∆1 leu2∆0 met15∆0 ura3∆0, NHP6a-iRFP-kanMX, HSP104-GFP-HIS3, sir2::CgURA3, hap4::CgLEU2 | This study | NH1096 | See ‘Strain and plasmid construction’ for details |
| Strain, strain background (S. cerevisiae) | yTRAP-NOP15, PRPL18B-rtTA3-TADH1-TetO7-PLEU2m-SIR2-mCherry-TENO2-LEU2, sir2::CgHIS3 | This study | NH1788 | See ‘Strain and plasmid construction’ for details |
| Strain, strain background (S. cerevisiae) | yTRAP-SOF1, PRPL18B-rtTA3-TADH1-TetO7-PLEU2m-SIR2-mCherry-TENO2-LEU2, sir2::CgHIS3 | This study | NH1789 | See ‘Strain and plasmid construction’ for details |
| Strain, strain background (S. cerevisiae) | yTRAP-NOP13, PRPL18B-rtTA3-TADH1-TetO7-PLEU2m-SIR2-mCherry-TENO2-LEU2, sir2::CgHIS3 | This study | NH1790 | See ‘Strain and plasmid construction’ for details |
| Strain, strain background (S. cerevisiae) | yTRAP-MRD1, PRPL18B-rtTA3-TADH1-TetO7-PLEU2m-SIR2-mCherry-TENO2-LEU2, sir2::CgHIS3 | This study | NH1804 | See ‘Strain and plasmid construction’ for details |
| Strain, strain background (S. cerevisiae) | yTRAP-RLP7, sir2::CgHIS3 | This study | NH1763 | See ‘Strain and plasmid construction’ for details |
| Strain, strain background (S. cerevisiae) | BY4741 MATa his3∆1 leu2∆0 met15∆0 ura3∆0, NHP6a-iRFP-kanMX, NOP15::PNOP15-NOP15-mNeon-TADH1-URA3, SIS1-mCherry-HIS3 | This study | NH1752 | See ‘Strain and plasmid construction’ for details |
| Strain, strain background (S. cerevisiae) | BY4741 MATa his3∆1 leu2∆0 met15∆0 ura3∆0, NHP6a-iRFP-kanMX, NOP15::PNOP15-NOP15-mNeon-TADH1-URA3, HSP104-mCherry-HIS | This study | NH1751 | See ‘Strain and plasmid construction’ for details |
| Strain, strain background (S. cerevisiae) | TMY3 MATa leu2-3,112 trp1-1 can1-100 ura3-1 ade2-1::LacI-GFP his3-11 rDNA::pTM-lacO50-URA3 | Miyazaki and Kobayashi, 2011 | TMY3 |
Additional files
Download links
A two-part list of links to download the article, or parts of the article, in various formats.
Downloads (link to download the article as PDF)
Open citations (links to open the citations from this article in various online reference manager services)
Cite this article (links to download the citations from this article in formats compatible with various reference manager tools)
Age-dependent aggregation of ribosomal RNA-binding proteins links deterioration in chromatin stability with challenges to proteostasis
eLife 11:e75978.
https://doi.org/10.7554/eLife.75978


