Creation of photocyclic vertebrate rhodopsin by single amino acid substitution
- Department of Biophysics, Graduate School of Science, Kyoto University, Japan
- Research Organization for Science and technology, Ritsumeikan University, Japan
Figures
Figure 1 with 5 supplements
Thermal recovery of bovine rhodopsin G188C mutant after yellow light irradiation.
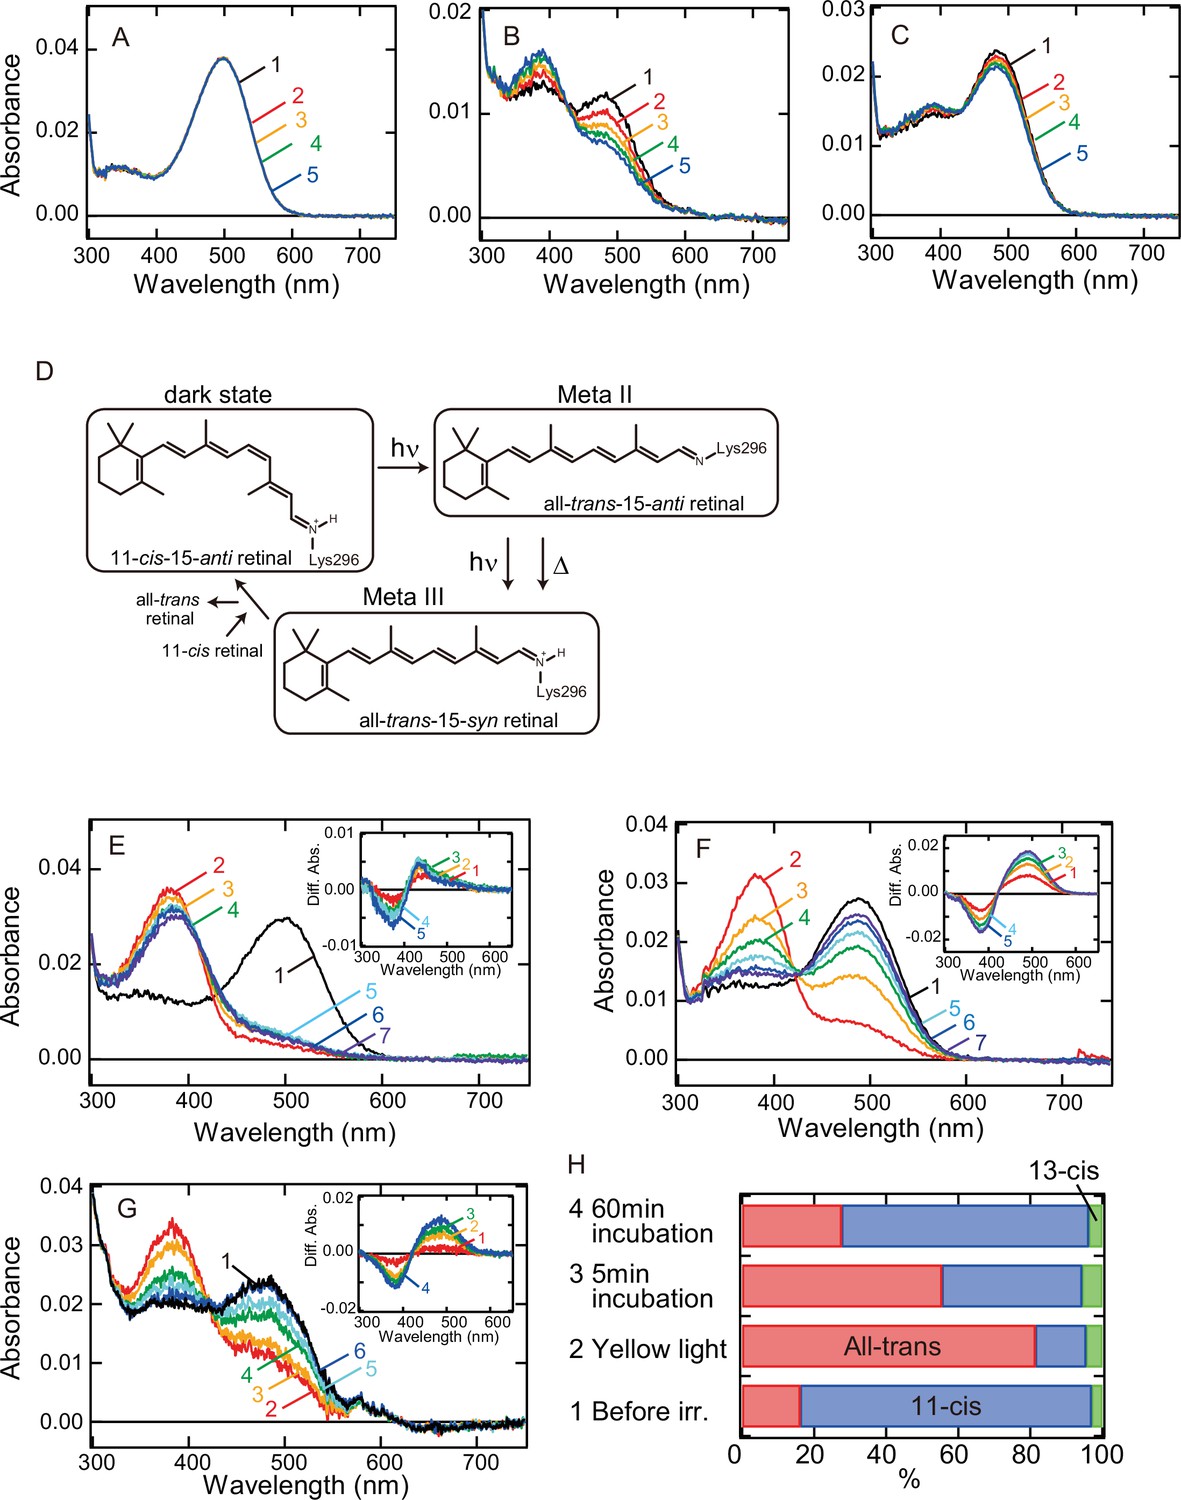
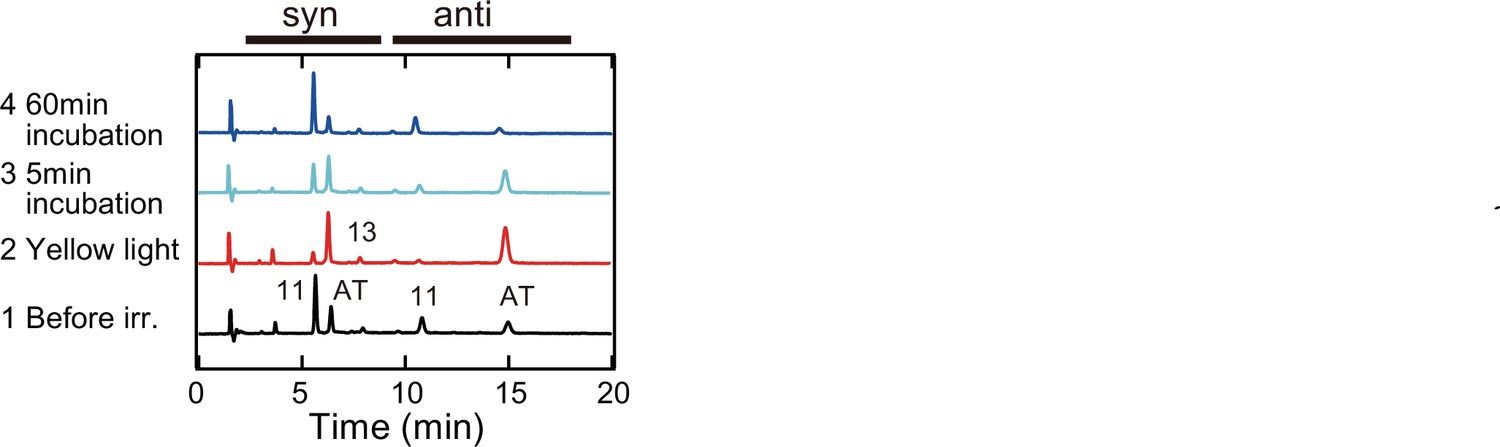
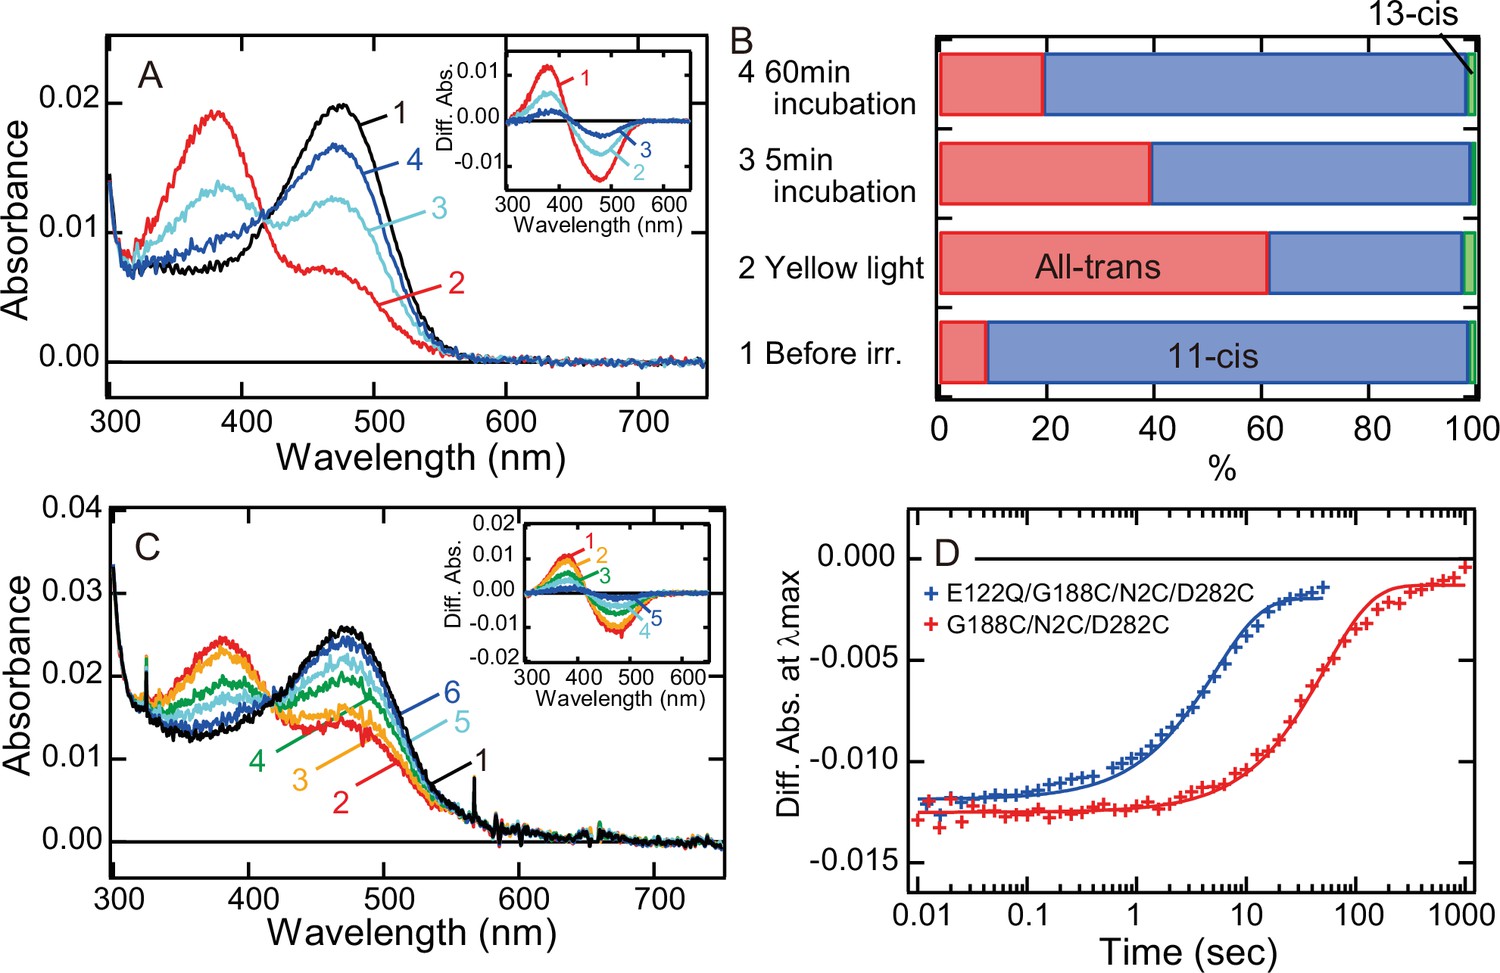
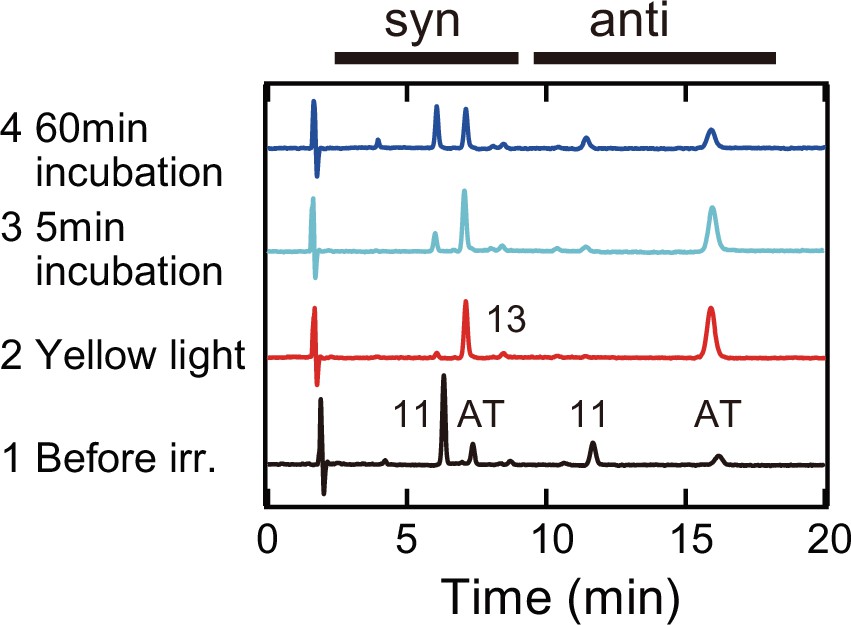
Thermal stability of wild-type (A) and G188C (B) and G188C/N2C/D282C (C) mutants of bovine rhodopsin purified after the incubation with 11-cis retinal. Absorption spectra were recorded after 0, 5, 10, 15, and 20 min incubation (curves 1–5, respectively) in the dark at 37°C. (D) The schematic presentation of the retinal configuration change of wild-type bovine rhodopsin. The dark state, meta II, and meta III contain 11-cis-15-anti retinal, all-trans-15-anti retinal and all-trans-15-syn retinal, respectively (Ritter et al., 2008). Absorption spectra of N2C/D282C (E) and G188C/N2C/D282C (F) mutants of bovine rhodopsin purified after the incubation with 11-cis retinal. Spectra were recorded in the dark (curve 1) and 0, 5, 15, 30, 60, and 120 min after yellow light irradiation (curves 2–7, respectively) at 20°C. (Inset) Difference spectra obtained by subtracting the spectrum just after irradiation (curve 2 in (E) and (F)) from the spectra measured after irradiation (curves 3–7 in (E) and (F)) (curves 1–5, respectively). (G) Absorption spectra of G188C/N2C/D282C mutant measured at 37°C. Spectra were recorded in the dark (curve 1) and 0.1, 10, 50, 100, and 1000s after yellow flash light irradiation (curves 2–6, respectively). (Inset) Difference spectra obtained by subtracting the spectrum just after irradiation (curve 2 in (G)) from the spectra measured after irradiation (curves 3–6 in (G)) (curves 1–4, respectively). (H) Isomeric compositions of retinal of G188C/N2C/D282C mutant. The retinal configurations were analyzed by high-performance liquid chromatography (HPLC) after extraction of the chromophore from the samples before light irradiation and 0, 5, and 60 min after yellow light irradiation at 20°C as shown in Figure 1—figure supplement 4.
Figure 1—figure supplement 1
Characterization of the amino acid residue at position 188 of opsins.
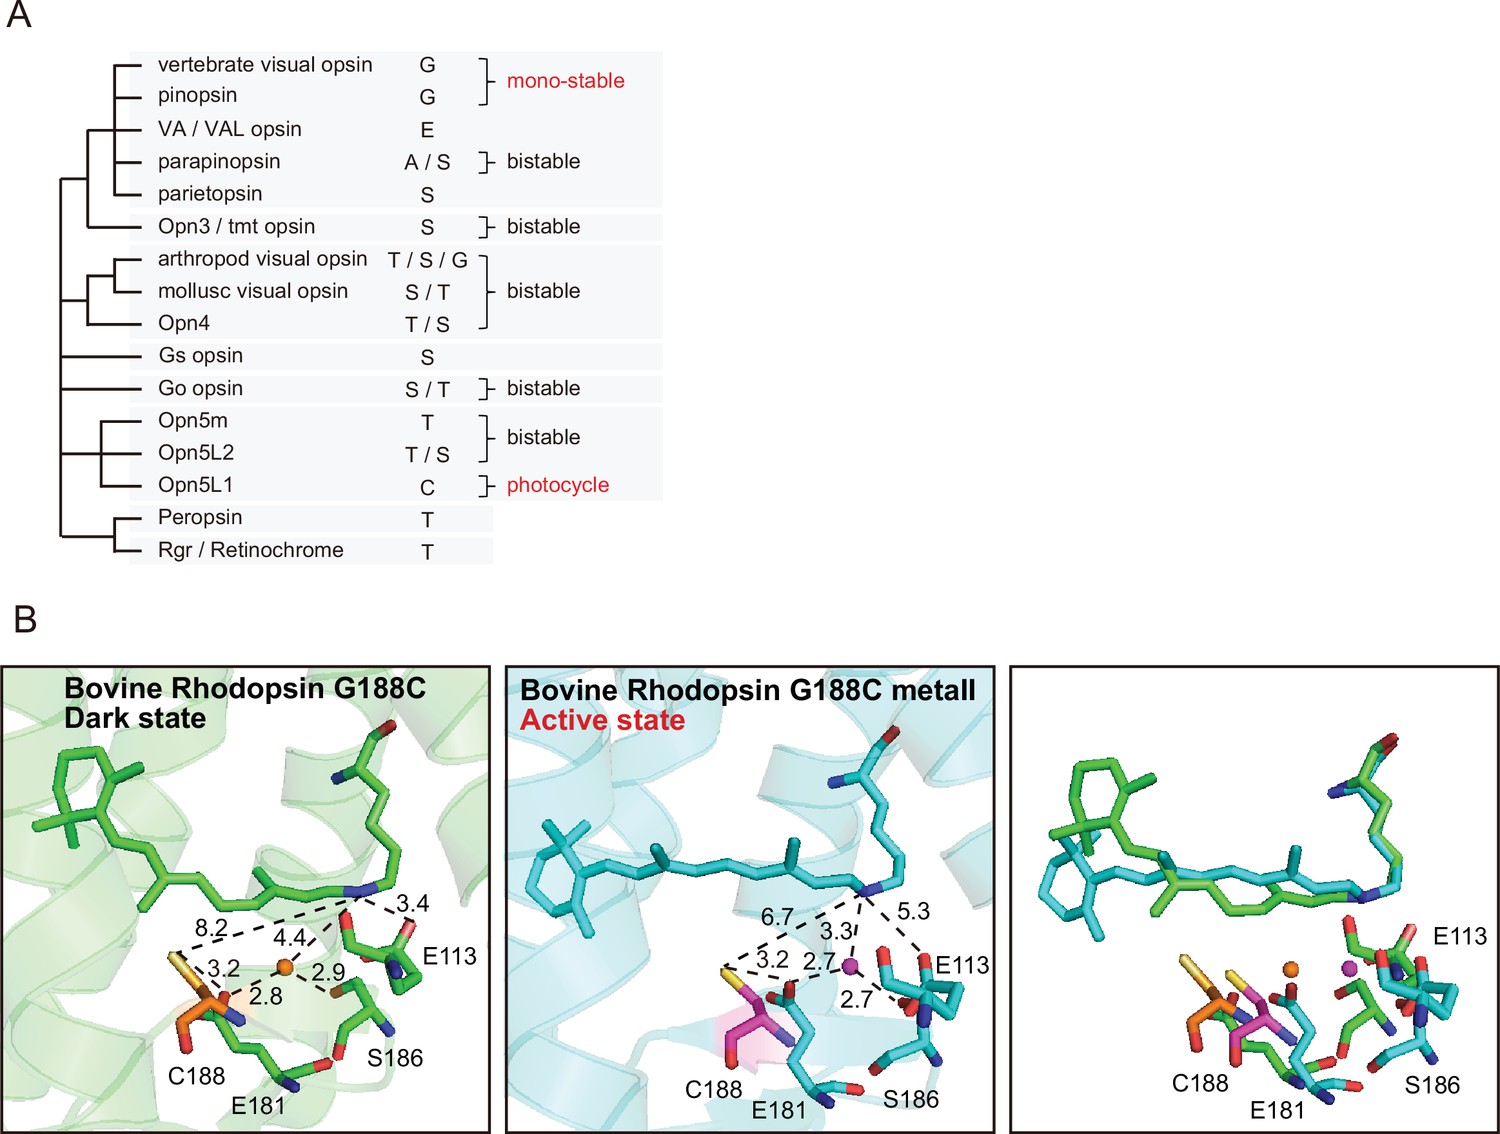
(A) Comparison of the amino acid residue at position 188 of opsins with their phylogenetic relationship. Opn5L1 is characterized as a photocyclic opsin and uniquely has a cysteine residue at position 188. By contrast, vertebrate visual pigments and pinopsin are characterized as monostable opsins and share a glycine residue at position 188. (B) Predicted structural models around position 188 of the dark state and meta II of G188C mutant. The structural models of the dark state (left panel) and meta II (middle panel) of G188C mutant were constructed based on the 3D structures of the dark state (PDB: 1U19) (Okada et al., 2004) and meta II (PDB: 3PQR) (Choe et al., 2011) of wild-type using PyMOL. The numbers show the distances in Å. The previous mutational analysis revealed that Glu113 and Glu181 work as counterions to stabilize the protonation of the Schiff base in the dark state (Sakmar et al., 1989; Zhukovsky and Oprian, 1989; Nathans, 1990) and meta I (Yan et al., 2003; Lüdeke et al., 2005), a precursor of meta II, respectively. In these structural models, Cys188 can be located in the vicinity of the C11 = C12 position of the retinal and Glu181. The structural superposition of the two models (right panel) shows that, during the process of the formation of meta II, Cys188, Glu181, and the adjacent water molecule approach the Schiff base, whereas Glu113 and Ser186 move apart from the Schiff base (Choe et al., 2011).
Figure 1—figure supplement 2
Thermal reaction of bovine rhodopsin wild-type and G188C mutant after yellow light irradiation.
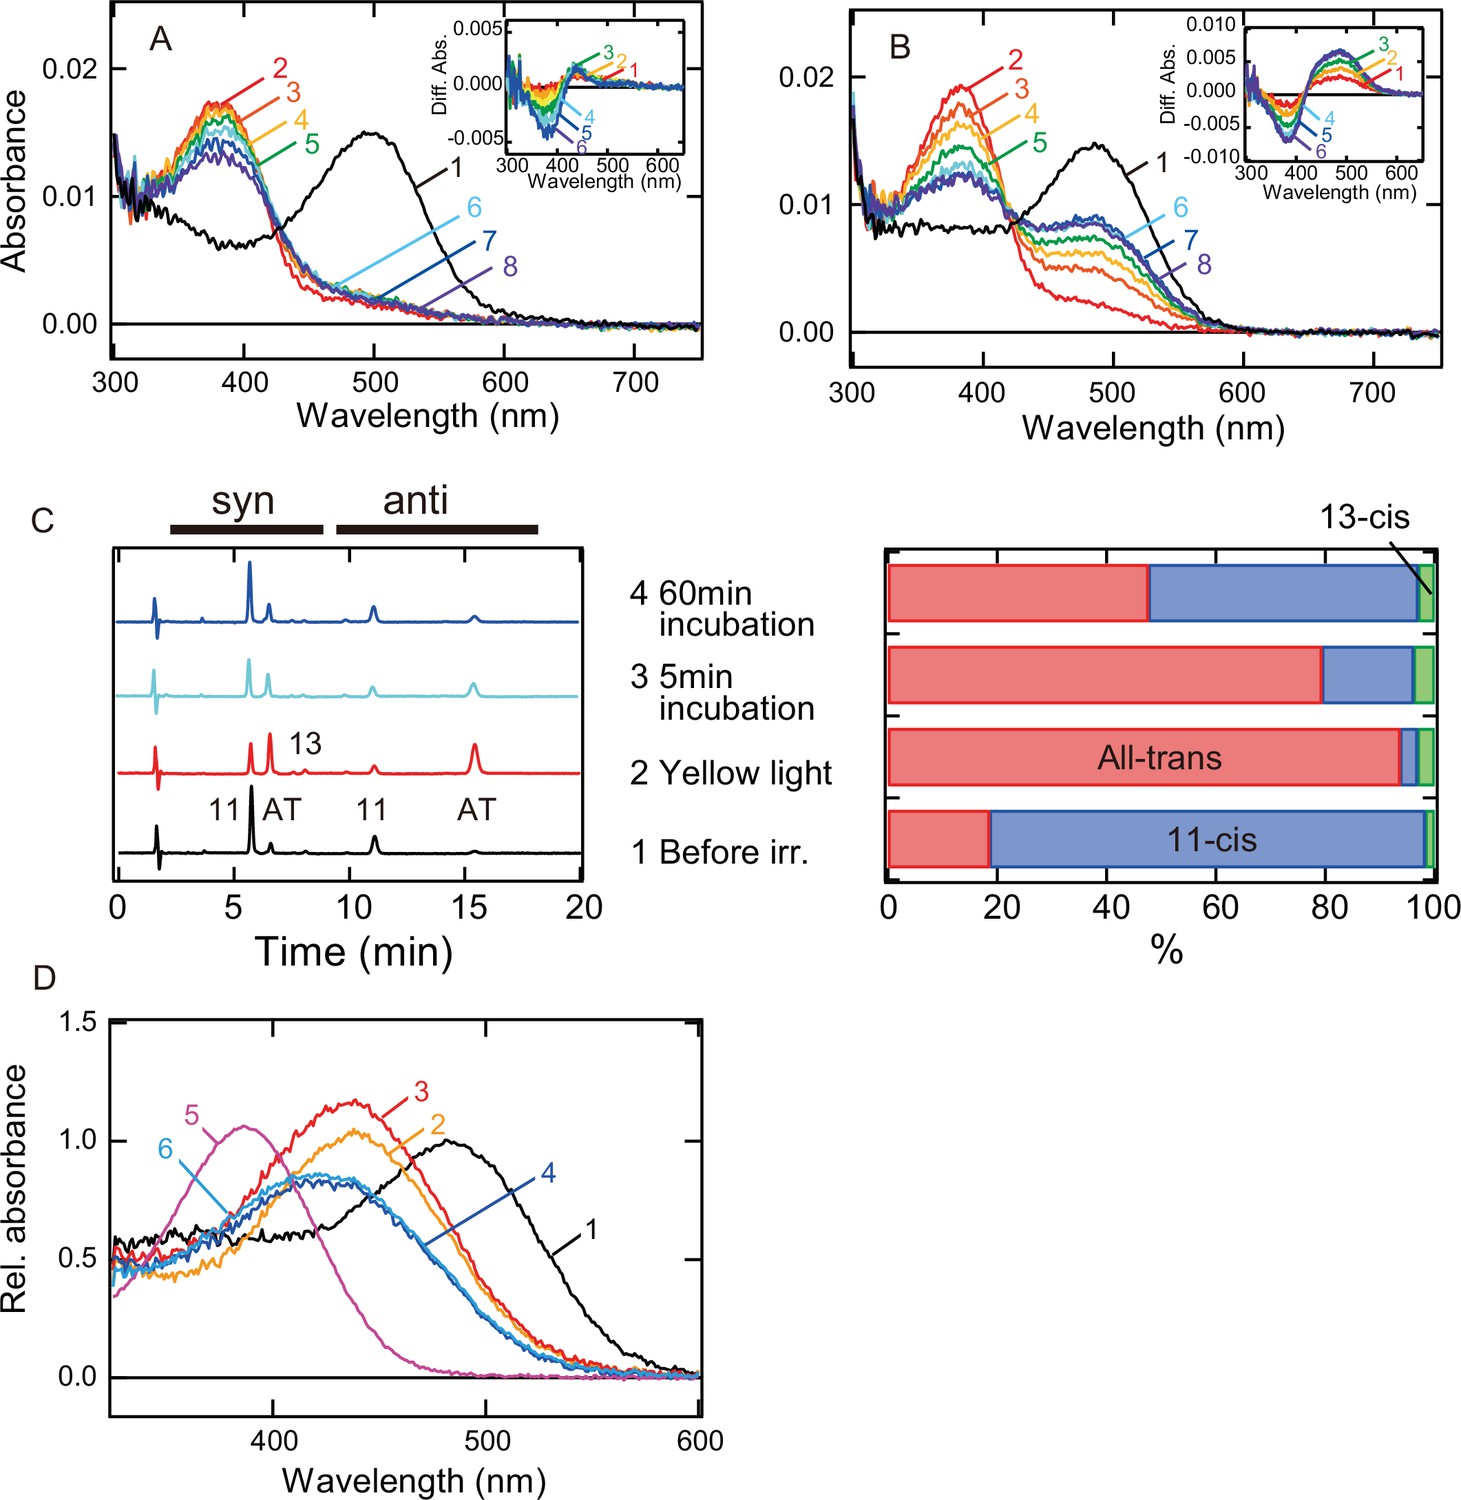
Absorption spectra of wild-type (A) and G188C mutant (B) measured at 20°C. Spectra were recorded in the dark (curve 1) and 0, 5, 10, 20, 40, 80, and 160 min after yellow light (>500 nm) irradiation (curves 2–8, respectively). (Inset) Difference spectra obtained by subtracting the spectrum just after irradiation (curve 2 in (A) and (B)) from the spectra measured after irradiation (curves 3–8 in (A) and (B)) (curves 1–6, respectively). (C) Isomeric compositions of retinal of G188C mutant. The retinal configurations were analyzed by high-performance liquid chromatography (HPLC) after extraction of the chromophore from the samples before light irradiation and 0, 5, and 60 min after yellow light irradiation at 20°C. We observed a smaller amount of thermal recovery in G188C mutant ((B) and (C)) than in G188C/N2C/D282C mutant (Figure 1F, H). This was probably because meta II of G188C mutant is thermally unstable and is decomposed into all-trans retinal and apo-protein in addition to reverting to the original dark state during the incubation after light irradiation, which was confirmed by the acid denaturation experiment (D). (D) Acid denaturation of G188C mutant samples in the dark and after yellow light (>500 nm) irradiation. Spectra of G188C mutant were recorded in the dark (curve 1) and after acid denaturation by the addition of HCl (final pH: 1.3 ± 0.2, curve 2). Spectrum recorded in the dark was normalized to be ~1.0 at λmax. Moreover, spectra of G188C mutant were recorded after acid denaturation by the addition of HCl to meta II formed just after yellow light irradiation (curve 3) and to the original dark state converted from meta II during 60-min incubation after yellow light irradiation (curve 4). Absorption spectrum of all-trans retinal was also recorded in Buffer A containing 0.02% dodecyl maltoside (DDM) and HCl (curve 5). Curve 6 was obtained by the assumption that the acid-denatured sample shown by curve 4 contains the acid-denatured original dark state (11-cis retinal bound state, curve 2) and free all-trans retinal (curve 5) based on the component ratio of 11-cis and all-trans retinals shown in (C). The calculated curve 6 fitted well with curve 4.
Figure 1—figure supplement 3
Thermal reaction of bovine rhodopsin Gly188 mutants after yellow light irradiation.
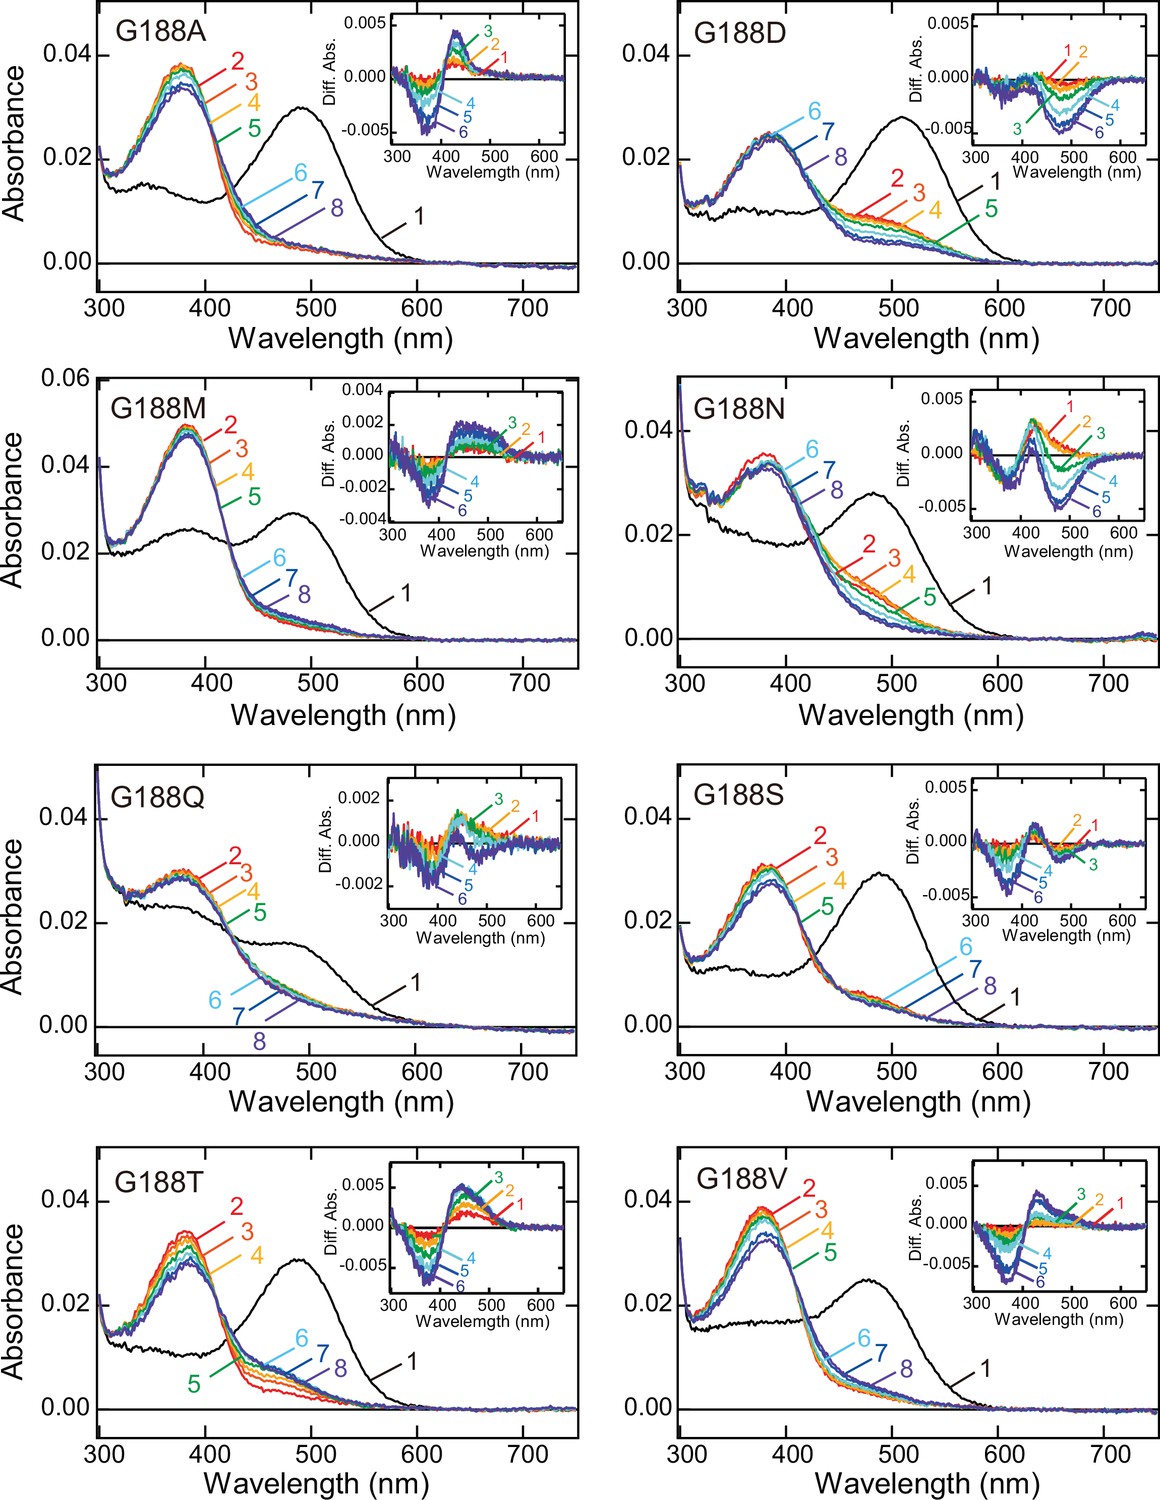
Absorption spectra of G188A, G188D, G188M, G188N, G188Q, G188S, G188T, and G188V mutants were recorded in the dark (curve 1) and 0, 5, 10, 20, 40, 80, and 120 min after yellow light (>500 nm) irradiation (curves 2–8, respectively) at 20°C. (Inset) Difference spectra obtained by subtracting the spectrum just after irradiation (curve 2 in Figure 1—figure supplement 3) from the spectra measured after irradiation (curves 3–8 in Figure 1—figure supplement 3) (curves 1–6, respectively).
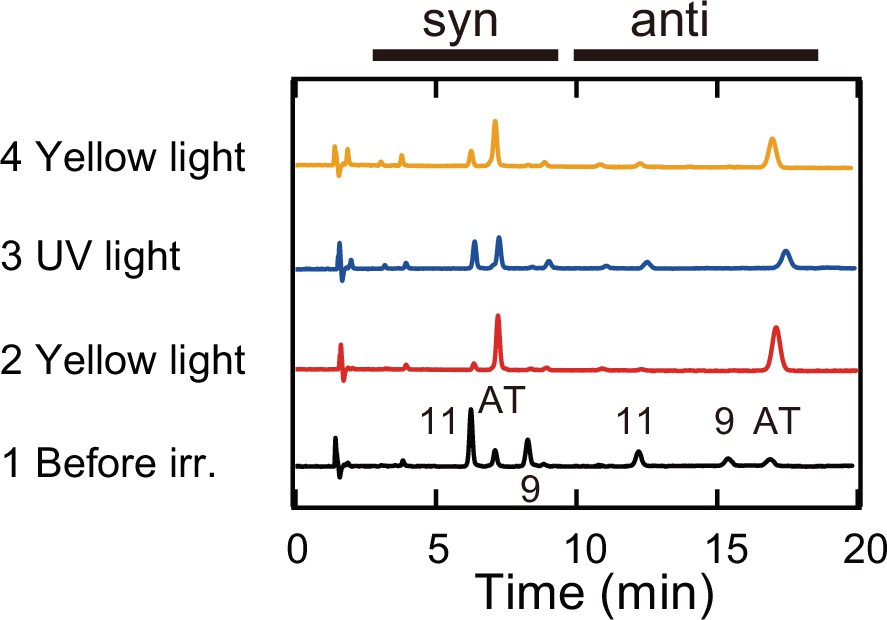
Figure 1—figure supplement 4
High-performance liquid chromatography (HPLC) analysis of retinal configuration.
Bovine rhodopsin G188C/N2C/D282C mutant was purified after incubation with 11-cis retinal and was prepared for HPLC analysis of retinal configuration (Tsutsui et al., 2007), 0, 5, and 60 min after yellow light (>500 nm) irradiation of the sample at 20°C (see Figure 1F, H).
Figure 1—figure supplement 5
Absorption spectra of Opn5L1 and bovine rhodopsin G188C mutant.
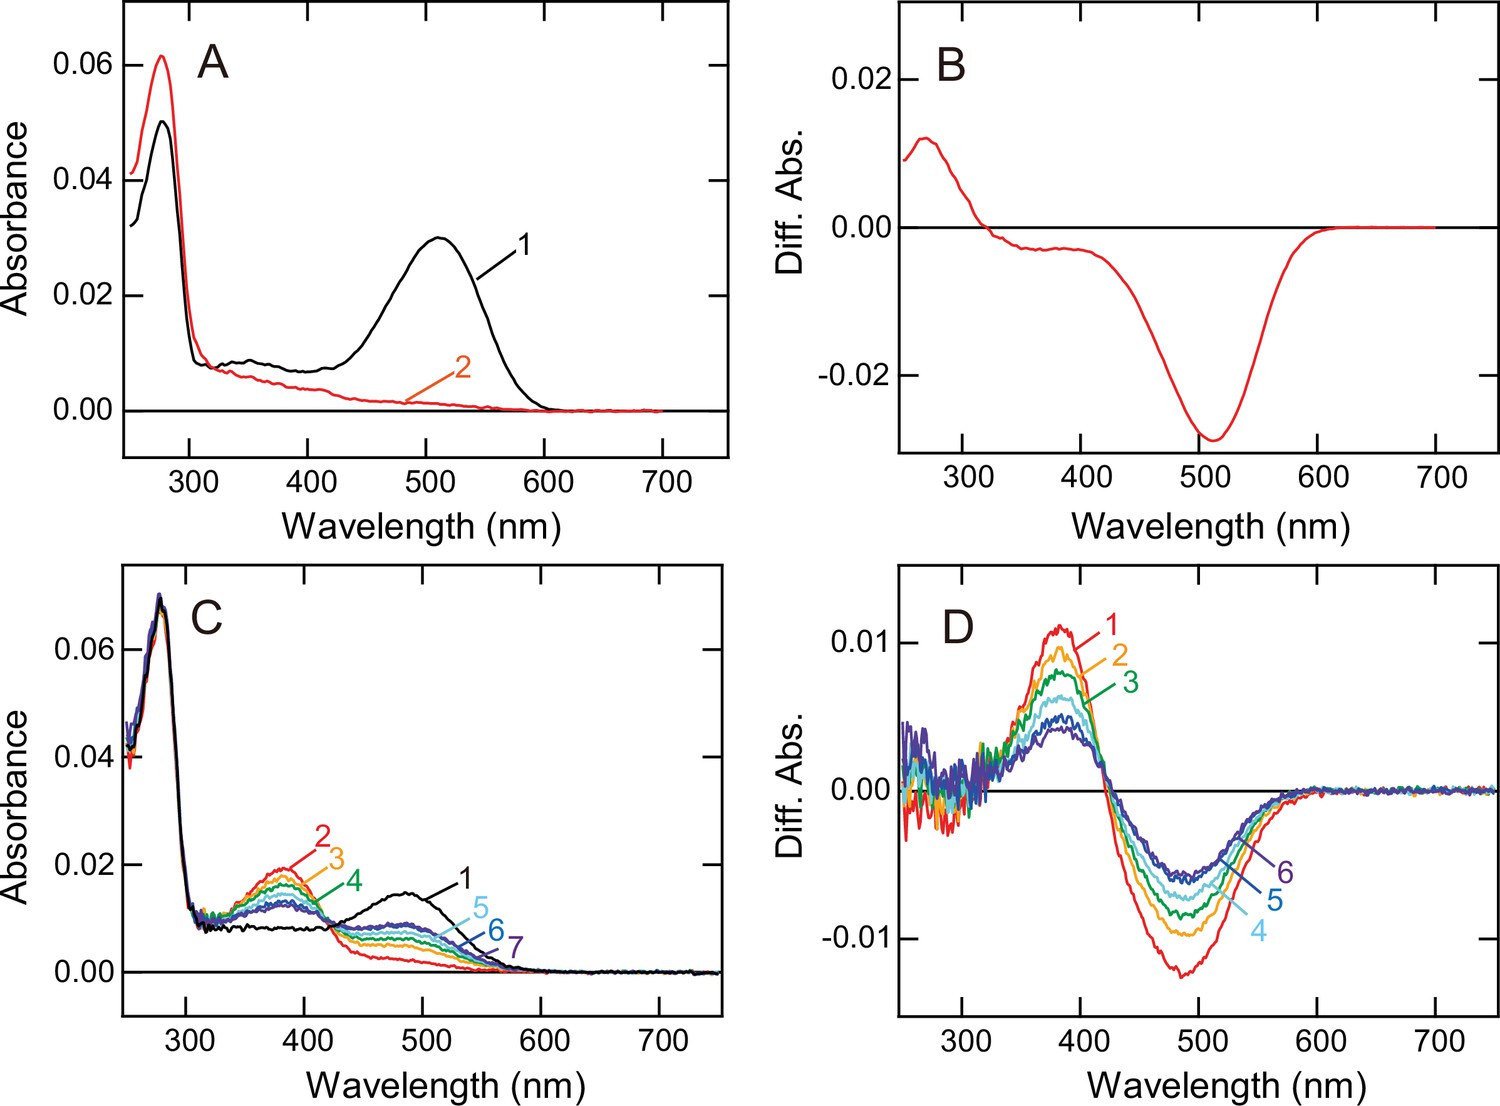
(A, B) Spectral change of chicken Opn5L1. (A) Spectra were recorded in the dark (curve 1) and after yellow light (>500 nm) irradiation (curve 2) as referred to in our previous paper (Sato et al., 2018). (B) Difference spectrum was obtained by subtracting the spectrum before irradiation (curve 1 in (A)) from the spectrum measured after irradiation (curve 2 in (A)). A light-dependent substantial increase of the absorbance was observed at around 270 nm. (C, D) Spectral changes of bovine rhodopsin G188C mutant. (C) Spectra were recorded at 20°C in the dark (curve 1) and 0, 5, 10, 20, 40, and 80 min after yellow light (>500 nm) irradiation (curves 2–7, respectively). (D) Difference spectra were obtained by subtracting the spectrum before irradiation (curve 1 in (C)) from the spectra measured after irradiation (curves 2–7 in (C)) (curves 1–6, respectively). Absorbance changes were observed in the visible and near-UV regions (350–700 nm), not at around 270 nm.
Figure 2 with 2 supplements

Photoreaction, retinal configuration, and G protein activation of bovine rhodopsin G188C mutant.
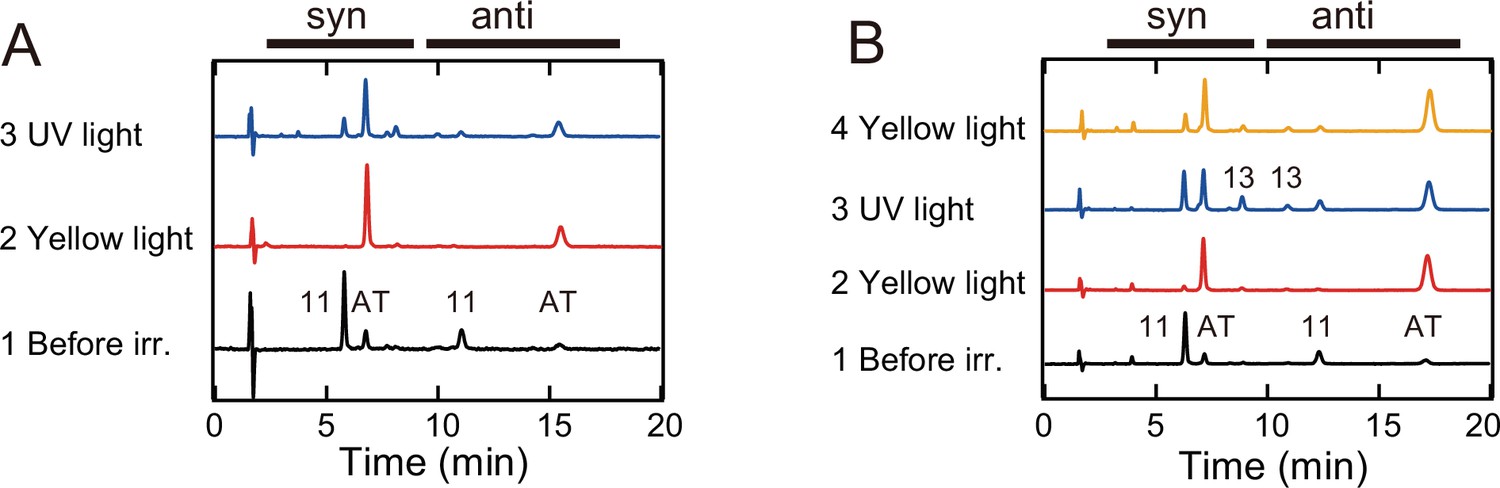
Absorption spectra of wild-type (A) or G188C mutant (B) of bovine rhodopsin purified after the incubation with 11-cis retinal at 0°C. Spectra were recorded in the dark (curve 1), after yellow light (>500 nm) irradiation (curve 2), after subsequent UV light (360 nm) irradiation (curve 3) and after yellow light reirradiation (curve 4). (Inset) Spectral changes of wild-type (A) or G188C mutant (B) induced by yellow light irradiation (curve 1), subsequent UV light (curve 2) irradiation and yellow light reirradiation (curve 3). Difference spectra were calculated based on the spectra shown in (A) and (B). Isomeric compositions of retinal of wild-type (C) and G188C mutant (D). The retinal configurations were analyzed by high-performance liquid chromatography (HPLC) after extraction of the chromophore from the samples before light irradiation, after yellow light irradiation, after subsequent UV light irradiation and after yellow light reirradiation at 0°C as shown in Figure 2—figure supplement 2. (E) Gi-type of G protein activation ability of wild-type. The activation ability was measured in the dark (closed circle) and after yellow light irradiation (open circle). (F) Gi-type of G protein activation ability of G188C mutant. The activation ability was measured in the dark (closed circles), after yellow light irradiation (open circles), after subsequent UV light irradiation (open triangles) and after yellow light reirradiation (open diamonds). Data shown in (E) and (F) were obtained at 0°C and are presented as the means ± SEM of three independent experiments. (G) Absorption spectrum of G188C/N2C/D282C mutant purified after incubation with 11-cis retinal at 0°C. Spectra were recorded in the dark (curve 1), after yellow light (>500 nm) irradiation (curve 2), after subsequent UV light (360 nm) irradiation (curve 3), after yellow light reirradiation (curve 4) and after UV light reirradiation (curve 5). (Inset) Spectral changes induced by yellow light irradiation (curve 1), subsequent UV light (curve 2) irradiation, yellow light reirradiation (curve 3), and UV light reirradiation (curve 4). Difference spectra were calculated based on the spectra shown in (G).
Figure 2—figure supplement 1
Absorption spectra of bovine rhodopsin Gly188 mutants.
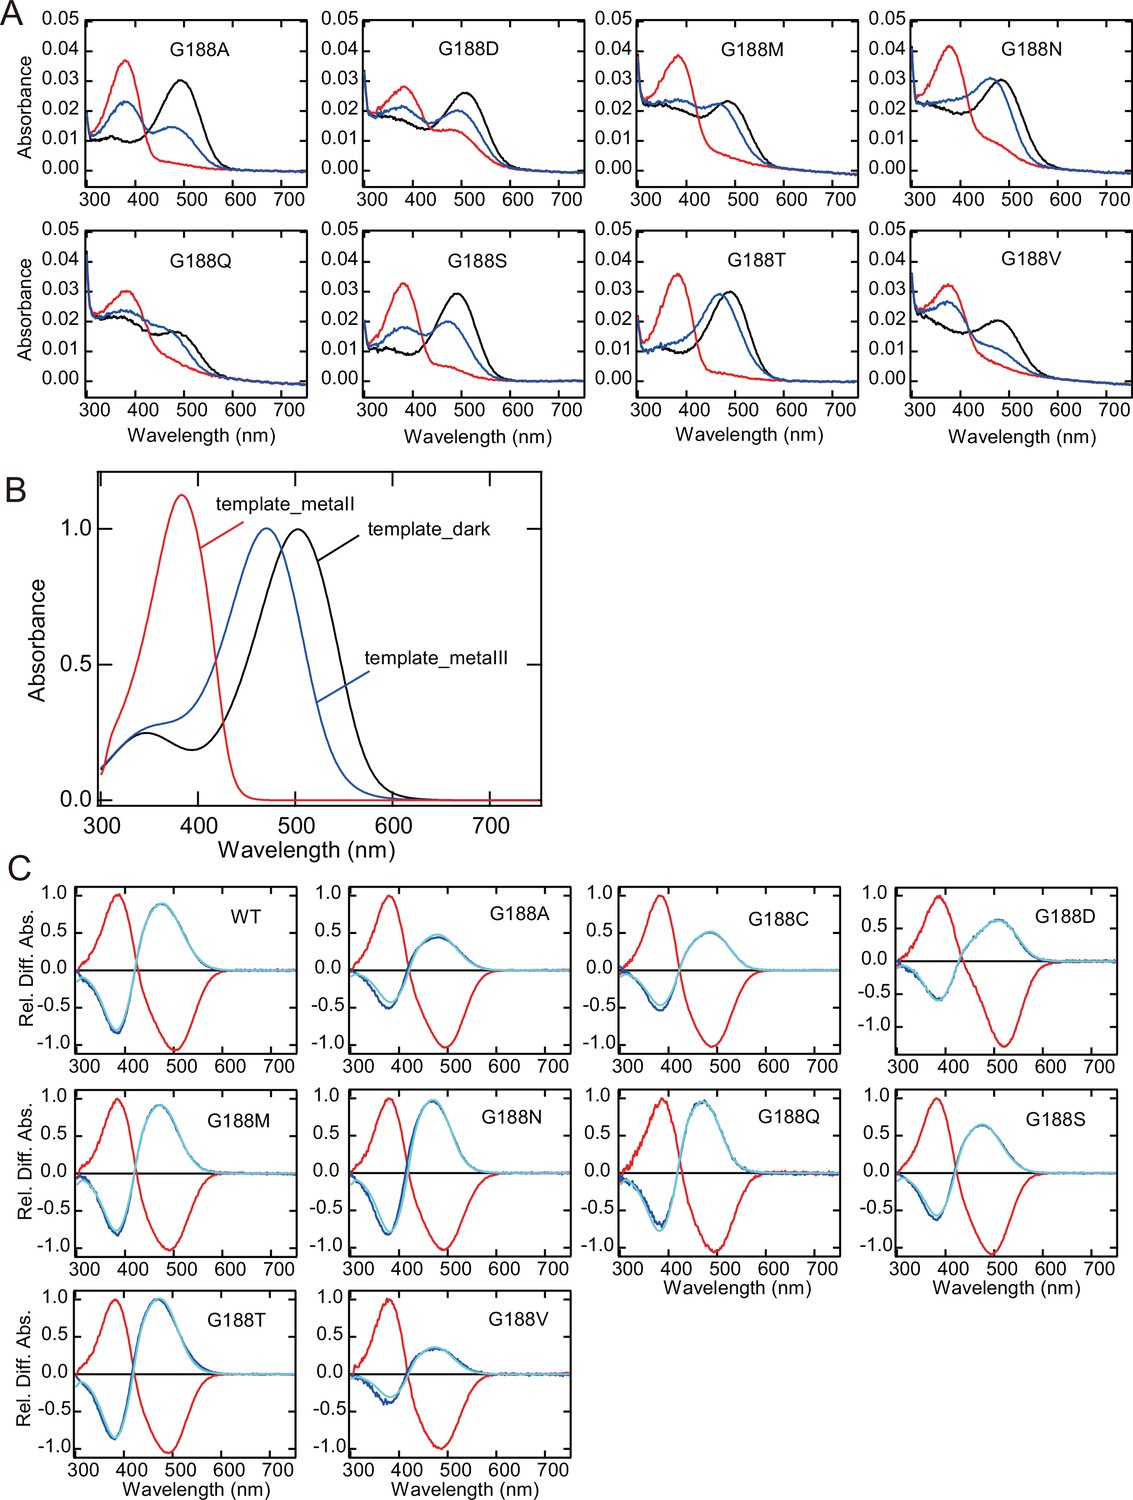
(A) Absorption spectra of G188A, G188D, G188M, G188N, G188Q, G188S, G188T, and G188V mutants of bovine rhodopsin after reconstitution with 11-cis retinal. Spectra were recorded in the dark (black curve), after yellow light (>500 nm) irradiation (red curve) and after subsequent UV light (360 nm) irradiation (blue curve) at 0°C. λmax of the mutants are shown in Table 1. (B) Template spectrum of the dark state, meta II, and meta III of bovine rhodopsin wild-type modeled by the previous method (Lamb, 1995; Govardovskii et al., 2000). The template spectra of the dark state of mutants were constructed by the same method according to λmax of each mutant shown in Figure 2—figure supplement 1. The template spectrum of meta II was constructed from the absorption spectrum of native bovine rhodopsin irradiated at low pH. The template spectrum of meta III was constructed by the modification of the model spectrum of meta I which was constructed from the absorption spectrum of native bovine rhodopsin irradiated at high pH. The molar extinction coefficients of each state were taken from a previous report (Kolesnikov et al., 2003). (C) Spectral changes of the mutants induced by yellow light (red curve) and subsequent UV light (blue curve) irradiations at 0°C. Difference spectra were calculated based on the spectra shown in (A) and were normalized to be ~1.0 at the positive maximum of the red curve. The fitted curve (cyan curve) was obtained by fitting the blue curve using the template spectra of the dark state, meta II, and meta III, and the component ratio of the dark state, meta II, and meta III after UV light irradiation was calculated (Table 1).
Figure 2—figure supplement 2
High-performance liquid chromatography (HPLC) analysis of retinal configuration.
(A) Wild-type rhodopsin was purified after incubation with 11-cis retinal and was prepared for HPLC analysis after yellow light (>500 nm) irradiation and subsequent UV light (360 nm) irradiation of the samples at 0°C (see Figure 2A, C). (B) G188C mutant was purified after incubation with 11-cis retinal and was prepared for HPLC analysis after yellow light irradiation, subsequent UV light irradiation and yellow light reirradiation of the samples at 0 °C (see Figure 2B, D).
Figure 3 with 1 supplement
Faster recovery rate of the photocycle of bovine rhodopsin G188C mutant by introducing E122Q mutation.
(A) Absorption spectra of E122Q/G188C/N2C/D282C mutant measured at 0°C. Spectra were recorded in the dark (curve 1) and 0, 5, and 60 min after yellow light (>500 nm) irradiation (curves 2–4, respectively). (Inset) Difference spectra obtained by subtracting the spectrum before irradiation (curve 1 in (A)) from the spectra measured after irradiation (curves 2–4 in (A)) (curves 1–3, respectively). (B) Isomeric compositions of retinal of E122Q/G188C/N2C/D282C mutant. The retinal configurations were analyzed by high-performance liquid chromatography (HPLC) after extraction of the chromophore from the samples before light irradiation and 0, 5, and 60 min after yellow light irradiation at 0°C as shown in Figure 3—figure supplement 1. (C) Absorption spectra of E122Q/G188C/N2C/D282C mutant measured at 37°C. Spectra were recorded in the dark (curve 1) and 0.1, 1, 5, 10, and 50 s after yellow flash light irradiation (curves 2–6, respectively). (Inset) Difference spectra obtained by subtracting the spectrum before irradiation (curve 1 in (C)) from the spectra measured after irradiation (curves 2–6 in (C)) (curves 1–5, respectively). (D) Comparison of the thermal recovery process between G188C/N2C/D282C (red) and E122Q/G188C/N2C/D282C (blue). Difference absorbance at λmax obtained by subtracting the spectrum before irradiation from the spectra measured after irradiation shown in Figure 1G and (C) was plotted against time elapsed after irradiation. The time constants of the thermal recovery to the dark state of G188C/N2C/D282C and E122Q/G188C/N2C/D282C mutants at 37°C were 57.4 and 5.1 s, respectively.
Figure 3—figure supplement 1
High-performance liquid chromatography (HPLC) analysis of retinal configuration.
E122Q/G188C/N2C/D282C mutant was purified after incubation with 11-cis retinal and was prepared for HPLC analysis 0, 5, and 60 min after yellow light (>500 nm) irradiation of the sample at 0°C (see Figure 3A, B).
Figure 4
Light-mediated suppression of intracellular cAMP level by bovine rhodopsin mutants.
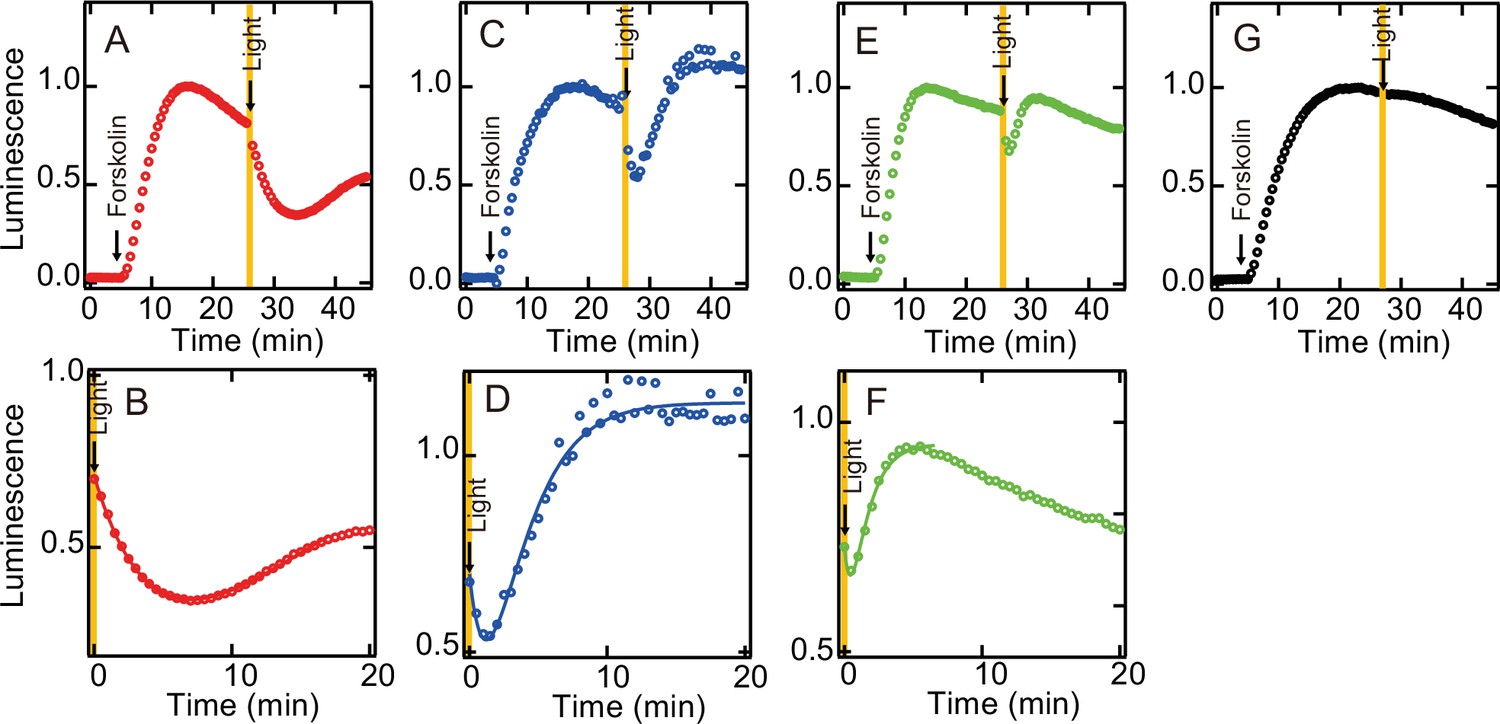
The cAMP levels in N2C/D282C- (A, B), G188C/N2C/D282C- (C, D), E122Q/G188C/N2C/D282C- (E, F), and mock- (G) transfected HEK293T cells were measured using the GloSensor cAMP assay at room temperature. The cells were incubated with 5 µM 11-cis retinal for 2 hr and subsequently treated with 2 µM forskolin prior to exposure to yellow light (>500 nm). Data were normalized to the maximum point before light irradiation. Detailed profiles of the light-dependent cAMP level changes in N2C/D282C, G188C/N2C/D282C, and E122Q/G188C/N2C/D282C are shown in (B), (D), and (F), respectively.
Figure 5 with 1 supplement
Formation of the photopigments of bovine rhodopsin G188C mutant after incubation with all-trans retinal.
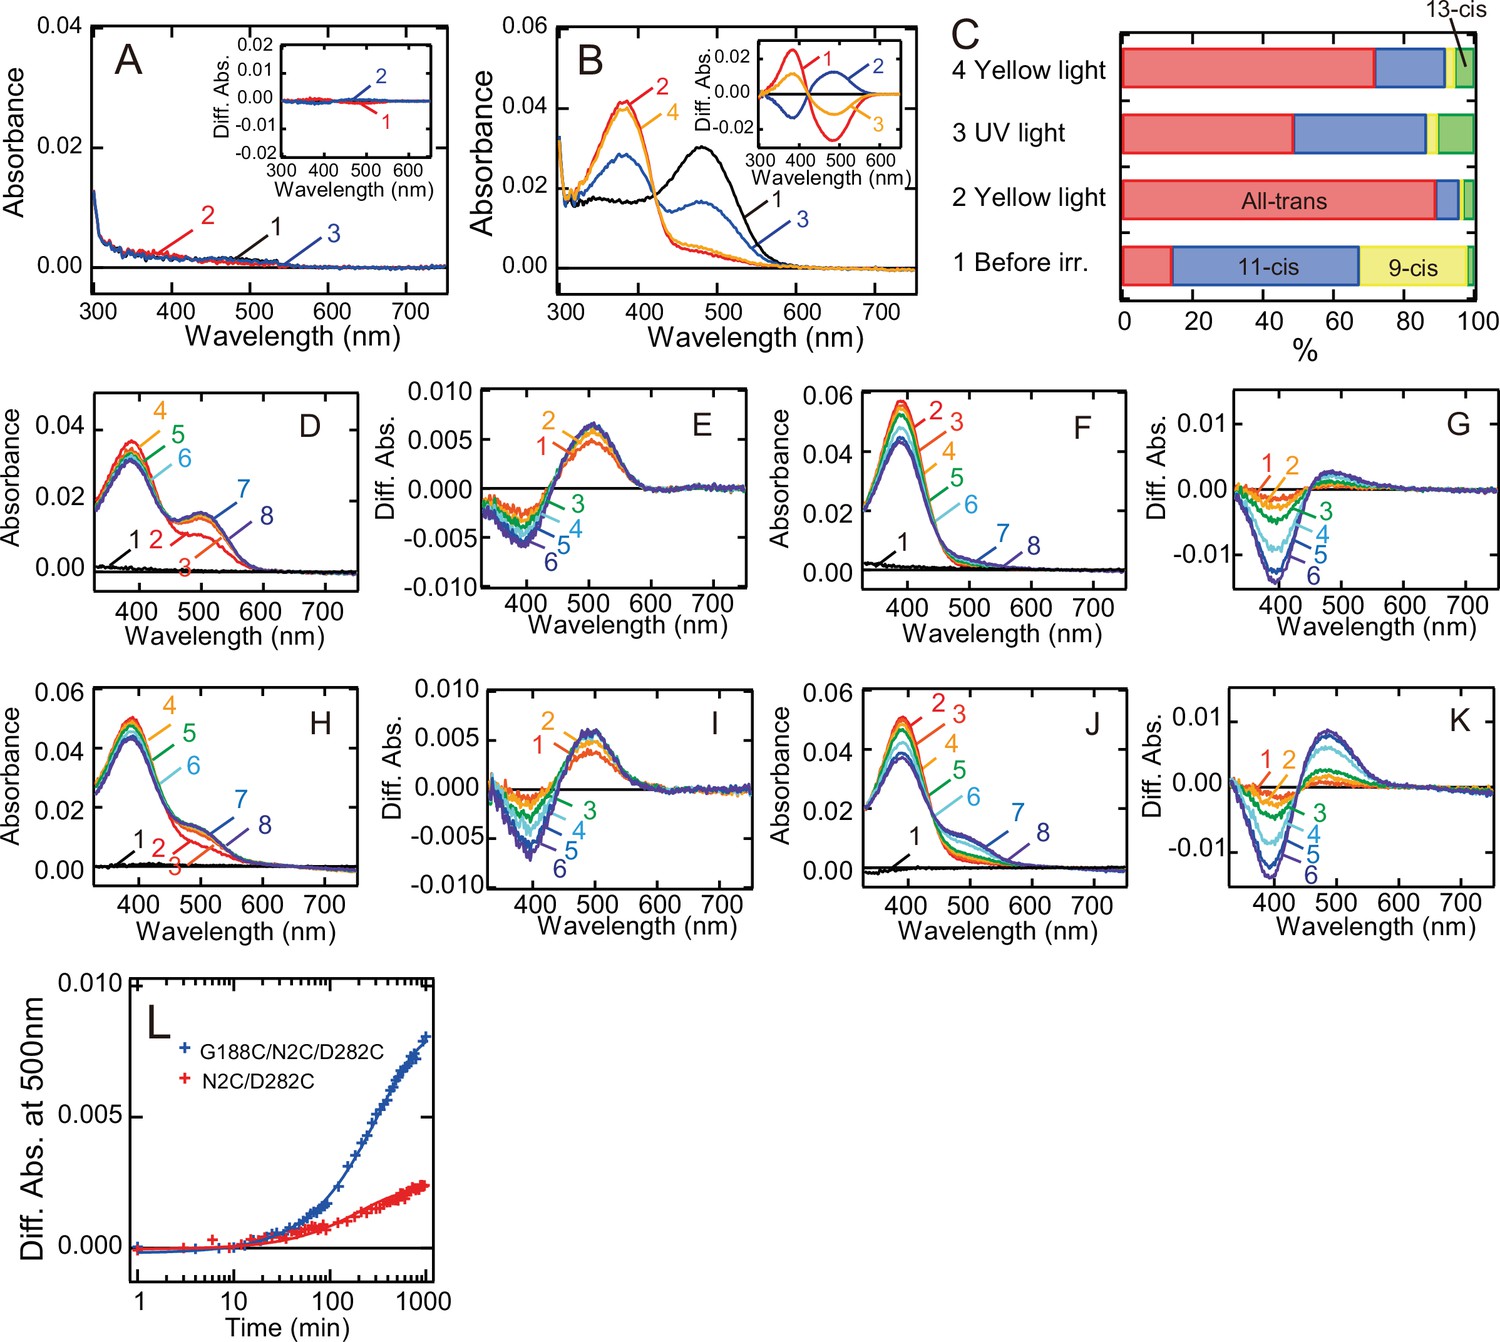
Absorption spectra of wild-type (A) or G188C mutant (B) purified after the addition of all-trans retinal to the suspension of rhodopsin-expressing cell membranes at 0°C. Spectra were measured in the dark (curve 1), after yellow light (>500 nm) irradiation (curve 2), after subsequent UV light (360 nm) irradiation (curve 3) and after yellow light reirradiation (curve 4). (Inset) Spectral change caused by yellow light irradiation (curve 1), subsequent UV light irradiation (curve 2) and yellow light reirradiation (curve 3). (C) Isomeric compositions of retinal of G188C mutant purified after the addition of all-trans retinal. The retinal configurations were analyzed by high-performance liquid chromatography (HPLC) after extraction of the chromophore from the samples before light irradiation, after yellow light irradiation, after subsequent UV light irradiation and after yellow light reirradiation shown in Figure 5—figure supplement 1. Regeneration of the photopigments by the addition of 11-cis (D, E) or all-trans (F, G) retinal to purified apo-protein of N2C/D282C. (D) Spectra were measured before (curve 1) and 0, 3, 6, 15, 30, 60, and 120 min after the addition of 1.1 μM 11-cis retinal (curves 2–8). (E) Difference spectra were calculated by subtracting the spectrum just after the addition of 11-cis retinal (curve 2 in (D)) from the spectra measured 3, 6, 15, 30, 60, and 120 min after the addition of 11-cis retinal (curves 3–8 in (D)) (curves 1–6, respectively). (F) Spectra were measured before (curve 1) and 0, 0.5, 1, 2, 6, 12, and 16 hr after the addition of 1.1 μM all-trans retinal (curves 2–8). (G) Difference spectra were calculated by subtracting the spectrum just after the addition of all-trans retinal (curve 2 in (F)) from the spectra measured 0.5, 1, 2, 6, 12, and 16 hr after the addition of all-trans retinal (curves 3–8 in (F)) (curves 1–6, respectively). Regeneration of the photopigments by the addition of 11-cis (H, I) or all-trans (J, K) retinal to purified apo-protein of G188C/N2C/D282C. (H) Spectra were measured before (curve 1) and 0, 3, 6, 15, 30, 60, and 120 min after the addition of 1.1 μM 11-cis retinal (curves 2–8). (I) Difference spectra were calculated by subtracting the spectrum just after the addition of 11-cis retinal (curve 2 in (H)) from the spectra measured 3, 6, 15, 30, 60, and 120 min after the addition of 11-cis retinal (curves 3–8 in (H)) (curves 1–6, respectively). (J) Spectra were measured before (curve 1) and 0, 0.5, 1, 2, 6, 12, and 16 hr after the addition of 1.1 μM all-trans retinal (curves 2–8). (K) Difference spectra were calculated by subtracting the spectrum just after the addition of all-trans retinal (curve 2 in (J)) from the spectra measured 0.5, 1, 2, 6, 12, and 16 hr after the addition of all-trans retinal (curves 3–8 in (J)) (curves 1–6, respectively). (L) Regeneration processes of the photopigments of N2C/D282C (red curve) and G188C/N2C/D282C (blue curve) by the addition of all-trans retinal as shown in (F) and (J) were monitored by the change of absorbance at 500 nm.
Figure 5—figure supplement 1
High-performance liquid chromatography (HPLC) analysis of retinal configuration.
G188C mutant was purified after the addition of all-trans retinal and was prepared for HPLC analysis after yellow light (>500 nm) irradiation and subsequent UV light (360 nm) irradiation of the samples (see Figure 5B, C).
Tables
Table 1
Comparison of λmax in the dark state and spectral components after UV light irradiation.
| λmax* | Dark state† (%) | Meta II† (%) | Meta III† (%) | |
|---|---|---|---|---|
| Wild-type | 500 | 21.6‡ | 13.7 | 64.7 |
| G188C | 487 | 41.2‡ | 48.5 | 10.3 |
| G188A | 494 | 18.1 | 51.7 | 30.2 |
| G188D | 509 | 30.9 | 67.7 | 1.4 |
| G188M | 491 | 9.2 | 10.0 | 80.8 |
| G188N | 492 | 0 | 0 | 100 |
| G188Q | 493 | 2.4 | 5.5 | 92.1 |
| G188S | 495 | 14.6 | 37.7 | 47.7 |
| G188T | 488 | 11.0 | 2.9 | 86.1 |
| G188V | 486 | 7.3 | 63.4 | 29.3 |
-
*
λmax was estimated from the absorption spectra shown in Figure 2 and Figure 2—figure supplement 1.
-
†
Component ratios of the dark state, meta II, and meta III were calculated based on the spectral changes induced by UV light irradiation shown in Figure 2 and Figure 2—figure supplement 1.
-
‡
Ratios of the dark state in wild-type and G188C are comparable to those of 11-cis retinal obtained by the retinal configuration analysis (24% in wild-type and 40% in G188C).
Key resources table
| Reagent type (species) or resource | Designation | Source or reference | Identifiers | Additional information |
|---|---|---|---|---|
| Commercial assay or kit | In-Fusion HD Cloning | Clontech | Clontech: 639,647 | |
| Commercial assay or kit | GloSensor cAMP AssayKit | Promega | Promega: E1290 | |
| Chemical compound, drug | Forskolin | FUJIFILM (Wako) | FUJIFILM:067-02191 | |
| Chemical compound, drug | n-Dodecyl-β-D-maltoside | DOJINDO | DOJINDO: D316 | |
| Chemical compound, drug | [35S]GTPγS | PerkinElmer | PerkinElmer: NEG030H | |
| Software, algorithm | Igor Pro Ver. 6 | https://www.wavemetrics.com/ | ||
| Software, algorithm | PyMOL Ver. 1.1 | https://pymol.org/2/ |
Additional files
Download links
A two-part list of links to download the article, or parts of the article, in various formats.
Downloads (link to download the article as PDF)
Open citations (links to open the citations from this article in various online reference manager services)
Cite this article (links to download the citations from this article in formats compatible with various reference manager tools)
Creation of photocyclic vertebrate rhodopsin by single amino acid substitution
eLife 11:e75979.
https://doi.org/10.7554/eLife.75979


