Development and evaluation of a machine learning-based in-hospital COVID-19 disease outcome predictor (CODOP): A multicontinental retrospective study
- Turku PET Centre, University of Turku and Turku University Hospital, Finland
- Max Planck Institute of Experimental Medicine, Germany
- Internal Medicine Department, Regional University Hospital of Málaga, Biomedical Research Institute of Málaga (IBIMA), University of Málaga (UMA), Spain
- Internal Medicine Department, Infanta Cristina University Hospital, Spain
- Internal Medicine Department, Gregorio Marañón University Hospital, Spain
- Internal Medicine Department, 12 de Octubre University Hospital, Spain
- Internal Medicine Department, General University Hospital of Alicante, Alicante Institute for 22 Health and Biomedical Research (ISABIAL), Spain
- Data Science Unit, Research Institute Hospital 12 de Octubre, Spain
- Internal Medicine Department, Hospital Costa del Sol, Spain
- Hospital Costa del Sol. Research Unit, Spain
- Preventive Medicine Department, Hospital Costa del Sol, Spain
- Hospital Británico of Buenos Aires, Argentina
- Internal Medicine Service, Hospital Santa Cruz - Caja Petrolera de Salud, Bolivia
- Epidemiology Unit, Hospital of San Juan de Dios, Bolivia
- Instituto Hondureno of social security, Hospital Honduras Medical Centre, Honduras
- Hospital Velez Sarsfield, Argentina
- Hospital Italiano de Buenos Aires, Argentina
- Max Planck Institute for Experimental Medicine, Germany
- Institute for Software and Systems Engineering at TU Clausthal, Germany
- Systems Biology of Pain, Division of Pharmacology & Toxicology, Department of Pharmaceutical Sciences, University of Vienna, Austria
Figures
Figure 1
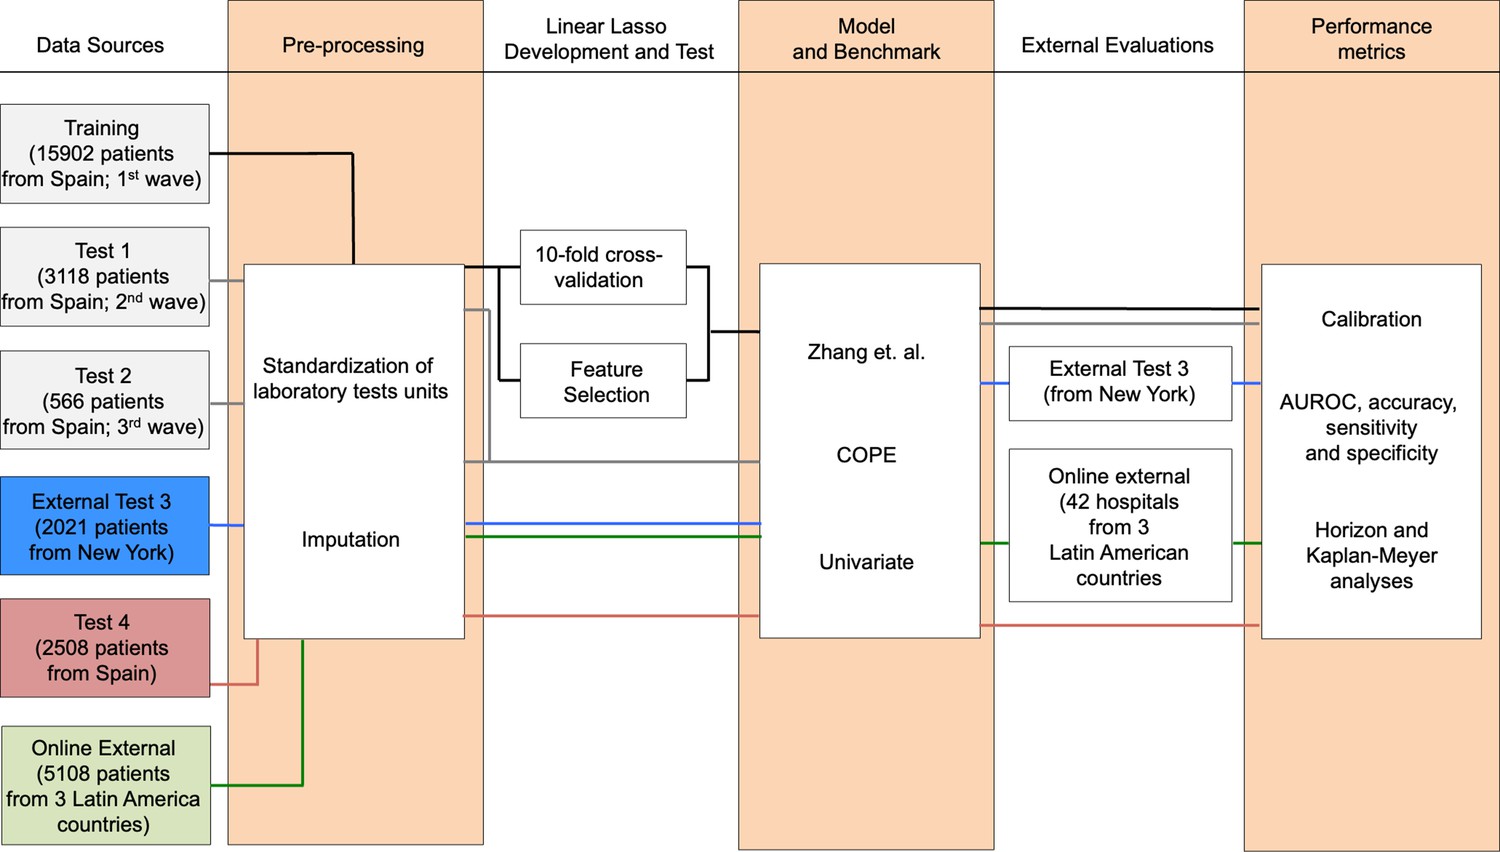
Flowchart depicting the different patient cohorts used in this study and the steps followed during the development, test, and independent evaluation of CODOP.
Figure 2 with 3 supplements
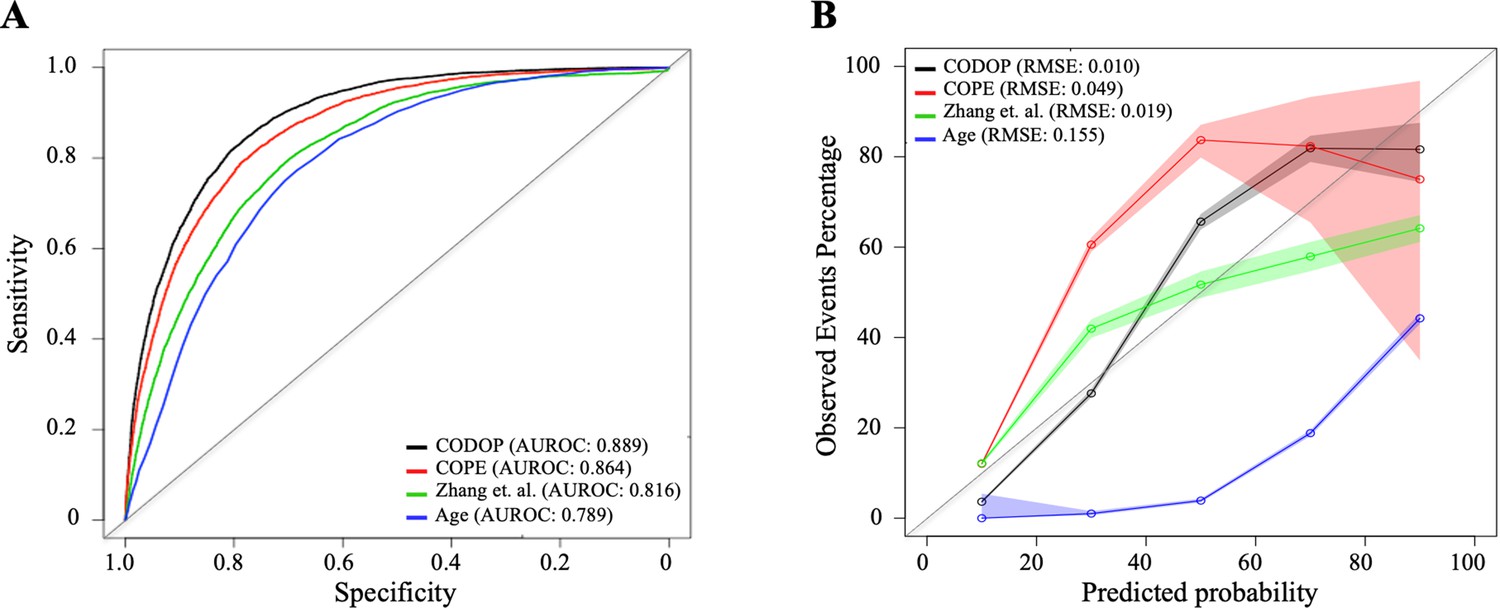
Discriminatory ability (using area under the receiver operating curves or AUROC; A) and calibration curves (B) for CODOP, COPE, Zhang et al., and Age in the training dataset.
-
Figure 2—source data 1
Prediction values for CODOP, COPE, Zhang et.
al in the training dataset.
- https://cdn.elifesciences.org/articles/75985/elife-75985-fig2-data1-v2.xlsx
Figure 2—figure supplement 1
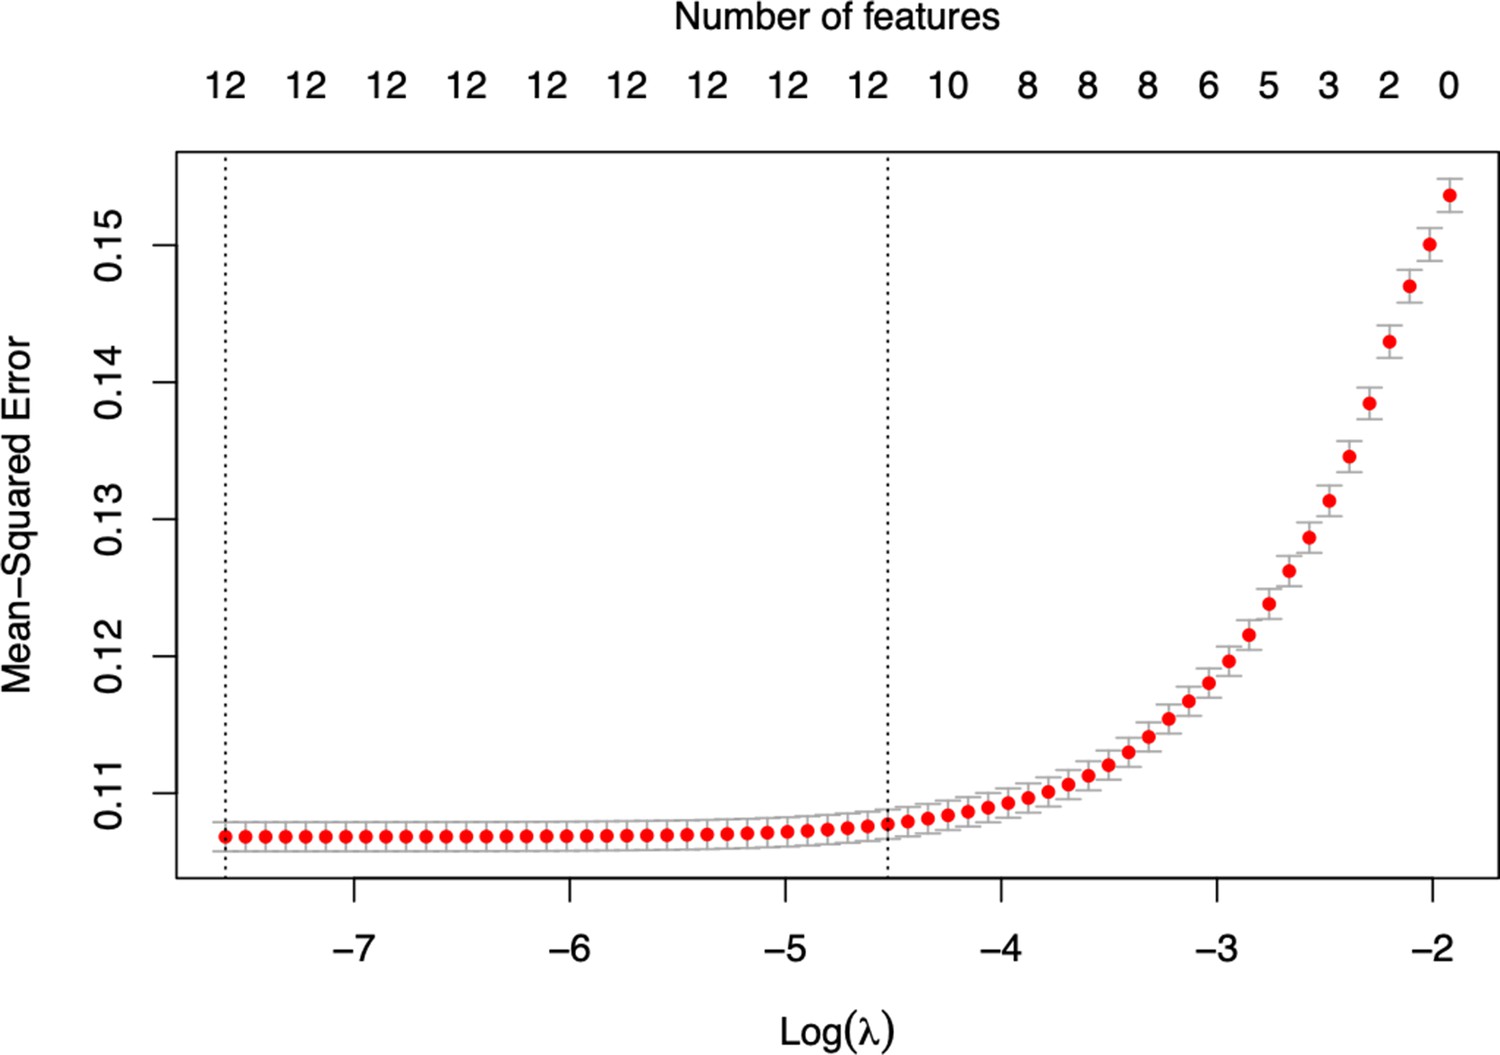
Optimisation of the final COPOD model by selecting predictors using the least absolute shrinkage and selection operator (LASSO) method.
The mean squared error is plotted versus log of the Penalty parameter (λ). Figure is produced by function cv.glmnet from R package glmnet.
-
Figure 2—figure supplement 1—source data 1
Mean squared error and the Penalty parameter (λ).
- https://cdn.elifesciences.org/articles/75985/elife-75985-fig2-figsupp1-data1-v2.xlsx
Figure 2—figure supplement 2

Discriminatory ability (using area under receiver operating curves or AUROC) (A) and calibration curves (B) for CODOP, COPE, Zhang et al., and Age in the test datasets.
-
Figure 2—figure supplement 2—source data 1
Prediction values for CODOP, COPE, Zhang et.
al. in the Test 1, Test 2, External Test 3, and Test 4 datasets.
- https://cdn.elifesciences.org/articles/75985/elife-75985-fig2-figsupp2-data1-v2.xlsx
Figure 2—figure supplement 3
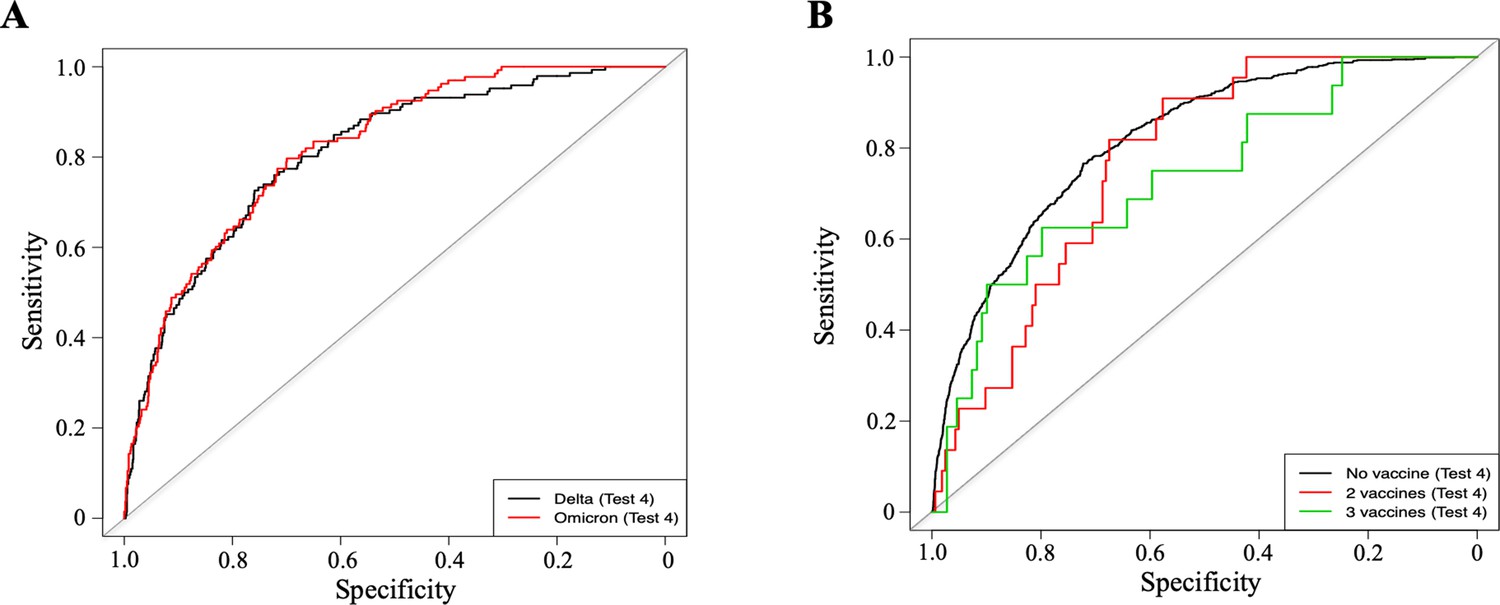
Discriminatory ability of CODOP (using area under receiver operating curves or AUROC) taking into account the Delta and Omicron VOCs (A) and the vaccination status of the patients (B) in the Test 4 dataset.
-
Figure 2—figure supplement 3—source data 1
Prediction values for CODOP in vaccinated individuals and in patients infected with the Delta or Omicron virus variants.
- https://cdn.elifesciences.org/articles/75985/elife-75985-fig2-figsupp3-data1-v2.xlsx
Figure 3 with 1 supplement
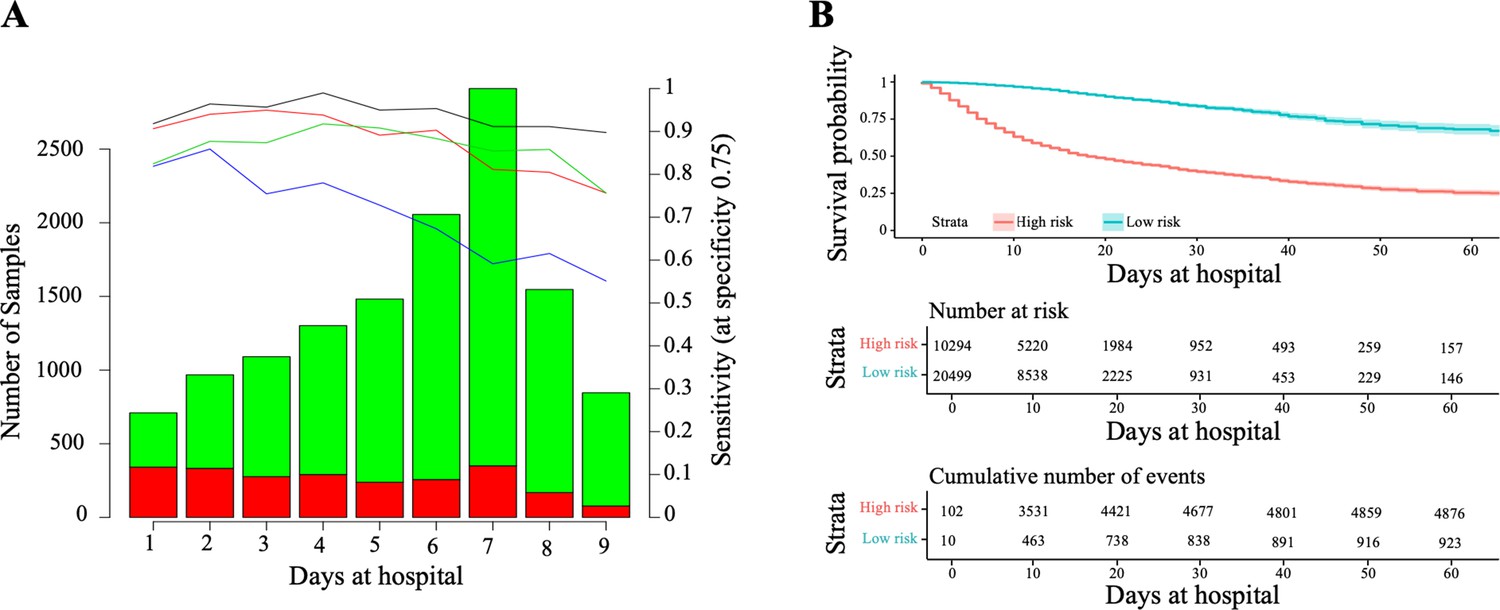
Horizon analysis (A) and survival analysis (B) in the training dataset.
In the horizon plot, x-axis represents the number of days at the hospital before clinical resolution, the bar plot is for the number of samples (the green colour is for survival and red for death), and lines are for sensitivity when the specificity was fixed at 75% in the training cohort (the black line is CODOP, the red line is COPE, the green line is Zhang et al., and the blue line is Age). In the survival analysis, the risk scores refer to the probability provided by CODOP.
-
Figure 3—source data 1
Prediction values for CODOP, COPE, Zhang et.
al. for the horizon analysis in the training dataset.
- https://cdn.elifesciences.org/articles/75985/elife-75985-fig3-data1-v2.xlsx
Figure 3—figure supplement 1
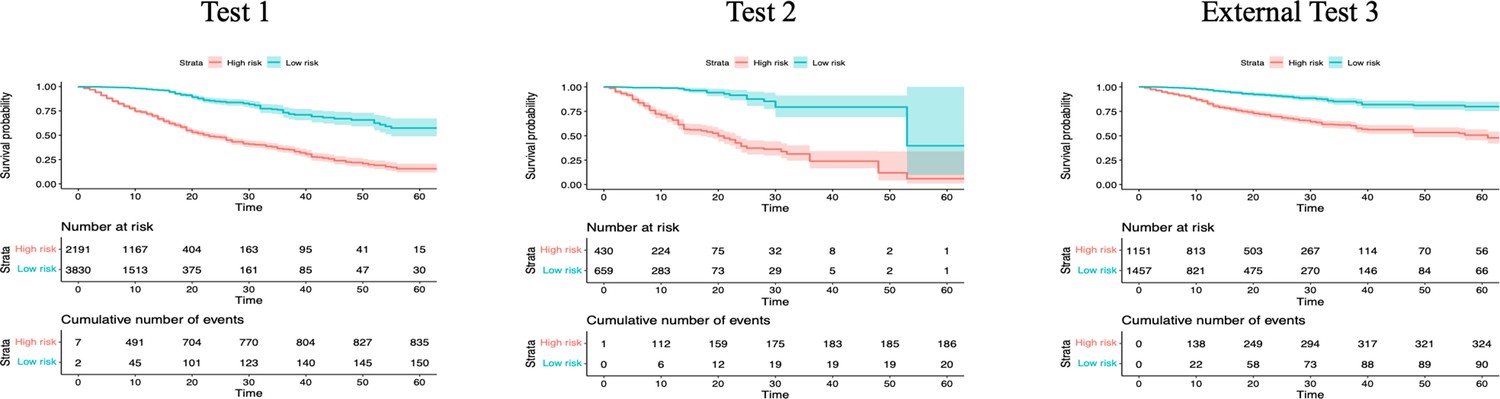
Survival analysis in the test datasets.
Shade areas indicate 95% confidence intervals. The risk scores refer to the probability provided by CODOP.
-
Figure 3—figure supplement 1—source data 1
Prediction values for CODOP, COPE, Zhang et.
al. for the risk stratification analysis in the Test 1, Test 2, and External Test 3 datasets.
- https://cdn.elifesciences.org/articles/75985/elife-75985-fig3-figsupp1-data1-v2.xlsx
Figure 4 with 1 supplement
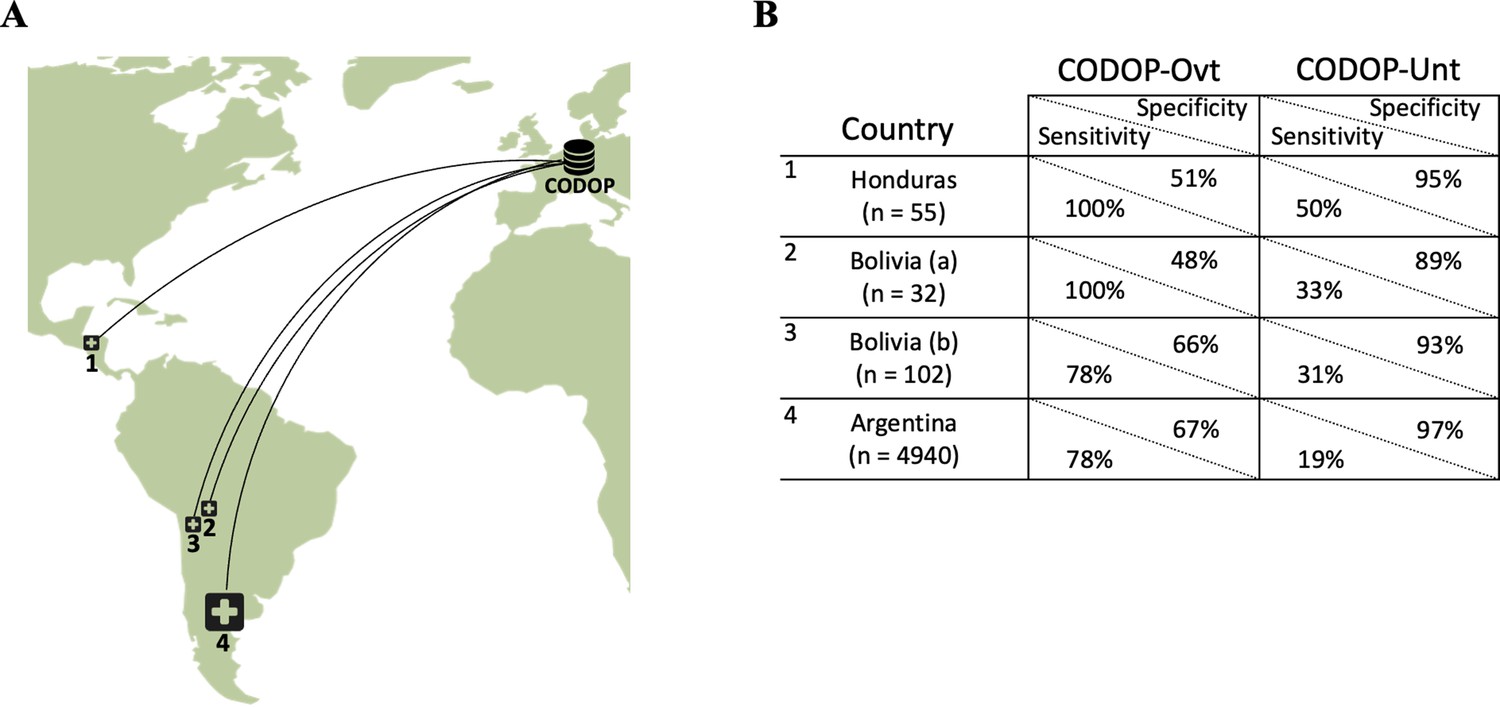
The geographical location of the external cohorts from 42 different Latin American hospitals used during the online evaluations (A) and performance of web calculators CODOP-Ovt and CODOP-Unt in these external cohorts number of patients from each institution are indicated in parenthesis; (B).
-
Figure 4—source data 1
Prediction values for CODOP in the Latin American cohort.
- https://cdn.elifesciences.org/articles/75985/elife-75985-fig4-data1-v2.xlsx
Figure 4—figure supplement 1
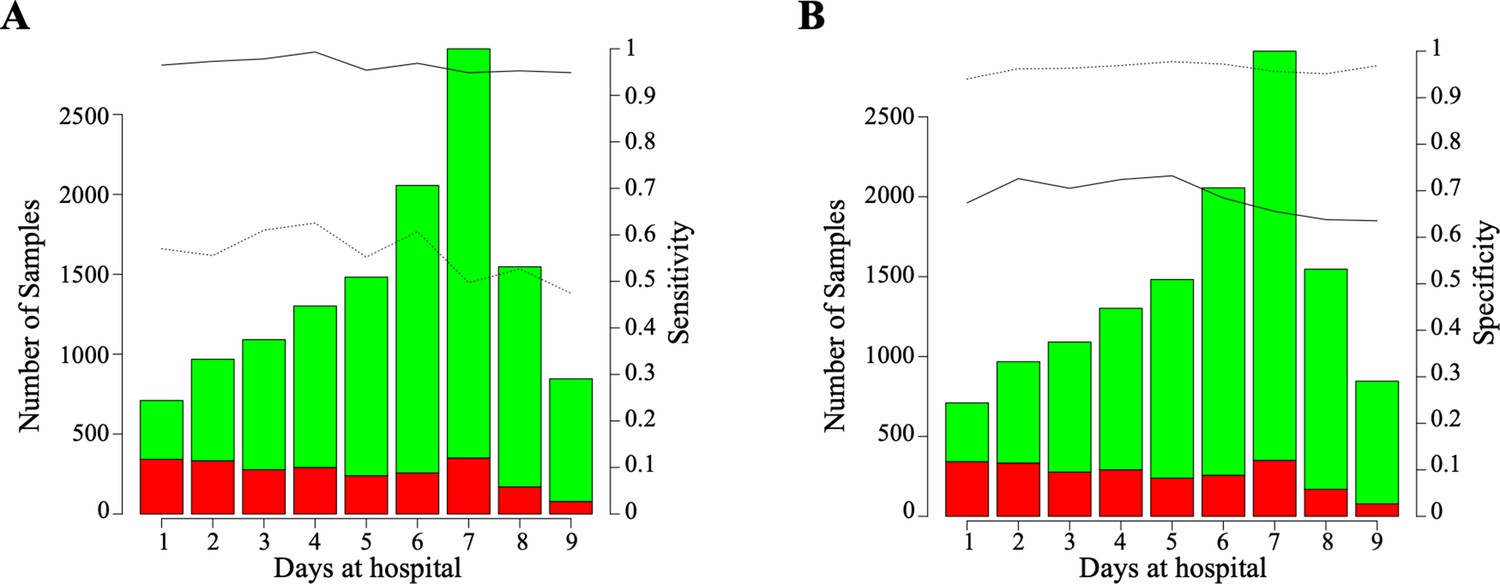
Horizon analysis in the training dataset for sensitivity (A) and specificity (B).
The black solid line is CODOP-Ovt and black dotted line is CODOP-Unt.
-
Figure 4—figure supplement 1—source data 1
Prediction values for CODOP-Ovt and CODOP-Unt for the horizon analysis in the training dataset.
- https://cdn.elifesciences.org/articles/75985/elife-75985-fig4-figsupp1-data1-v2.xlsx
Tables
Table 1
Features used during CODOP development with the training cohort, the values used for imputation, and the percentage of missing values.
Numerical variables are reported by median (Md) and interquartile range (IQR).
| Variable | Imputed value | Md (IQR) | Missing % |
|---|---|---|---|
| Age (years) | 66·67,911 | 68 (56–79) | 0·0 |
| Sex (male, female) | none | 6 775 females and 9 127 males | 0·0 |
| Hemoglobin (g/dL) | 13·33,201 | 13 (12–15) | 1·7 |
| Platelet Count (x 106 /L) | 250 097·7 | 223,000 (164 000-311 000) | 1·8 |
| Eosinophils (x 106 /L) | 63·81,817 | 10 (0–100) | 3·0 |
| Lymphocytes (x 106 /L) | 1 243·575 | 1,000 (700-1 420) | 1·9 |
| Neutrophils (x 106 /L) | 5 525·894 | 4 490 (3 090-6 800) | 2·2 |
| Monocytes (x 106 /L) | 535·8,804 | 470 (300–660) | 2·7 |
| C-Reactive Protein (mg/L) | 74·48,964 | 41 (12–108) | 4·6 |
| Creatinine (mg/dL) | 1·156,574 | 1 (1–1) | 2·0 |
| Lactate Dehydrogenase (U/L) | 363·9,083 | 306 (234–424) | 13·0 |
| Aspartate aminotransferase (U/L) | 49·27,098 | 35 (24–53) | 18·4 |
| Alanine aminotransferase (U/L) | 48·99,699 | 32 (20–54) | 7·4 |
| Total bilirrubin (mg/dL) | 0·6429202 | 1 (0–1) | 26·5 |
| Serum Sodium (mmol/L) | 138·4,268 | 138 (136–141) | 2·6 |
| Serum Potassium (mmol/L) | 4·178,441 | 4 (4–4) | 3·7 |
| Glucose (mg/dL) | 124·2,852 | 108 (92–135) | 5·2 |
| Prothrombin time (s) | 19·99,798 | 13 (12–14) | 35·8 |
| Fibrinogen (mg/dL) | 608·0043 | 601 (497–713) | 37·0 |
| Dimer (ng/mL) | 2 122·158 | 672 (370–1 320) | 21·7 |
Additional files
-
Transparent reporting form
- https://cdn.elifesciences.org/articles/75985/elife-75985-transrepform1-v2.docx
-
Supplementary file 1
Supplementary Tables.
- https://cdn.elifesciences.org/articles/75985/elife-75985-supp1-v2.docx
-
Supplementary file 2
List of Collaborators.
- https://cdn.elifesciences.org/articles/75985/elife-75985-supp2-v2.xlsx
Download links
A two-part list of links to download the article, or parts of the article, in various formats.
Downloads (link to download the article as PDF)
Open citations (links to open the citations from this article in various online reference manager services)
Cite this article (links to download the citations from this article in formats compatible with various reference manager tools)
Development and evaluation of a machine learning-based in-hospital COVID-19 disease outcome predictor (CODOP): A multicontinental retrospective study
eLife 11:e75985.
https://doi.org/10.7554/eLife.75985


