Functional profiling of long intergenic non-coding RNAs in fission yeast
- University College London, Institute of Healthy Ageing and Department of Genetics, Evolution & Environment, United Kingdom
- The Francis Crick Institute, Molecular Biology of Metabolism Laboratory, United Kingdom
- Charité Universitätsmedizin Berlin, Institute of Biochemistry, Germany
- The Francis Crick Institute, High Throughput Screening, United Kingdom
Figures
Figure 1 with 3 supplements
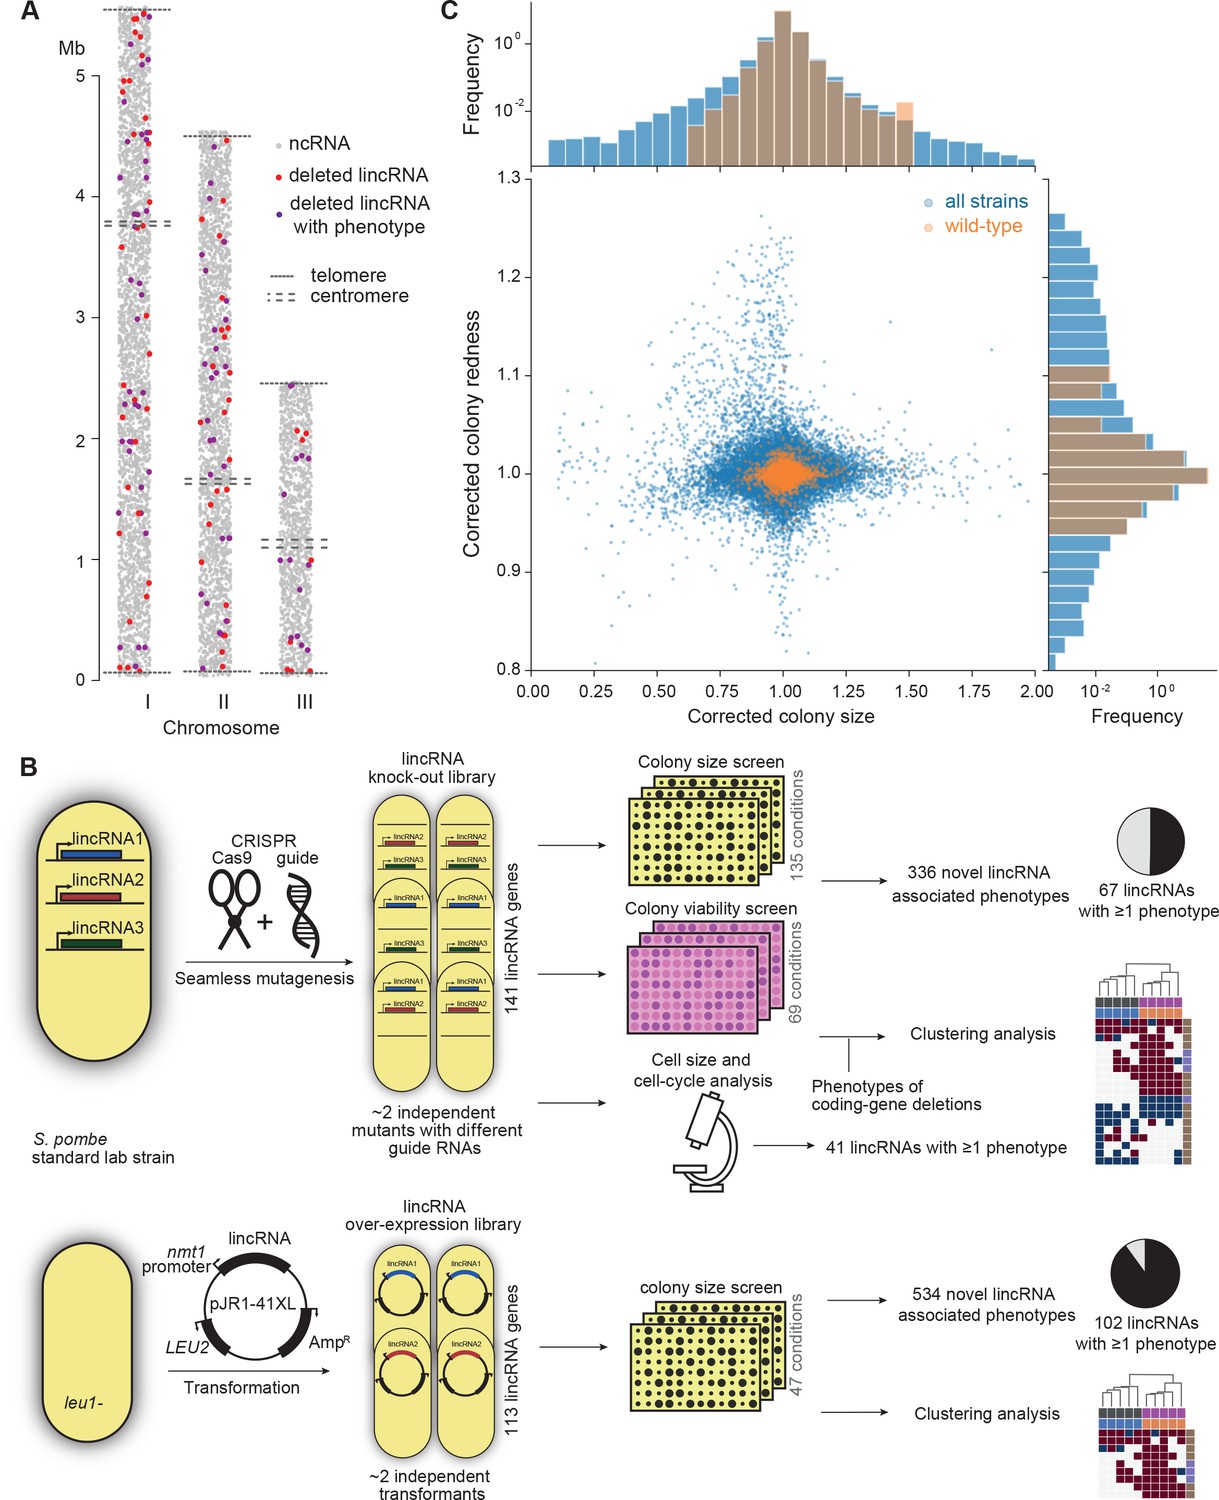
Phenomics assays of long intergenic non-coding RNA (lincRNA) mutants.
(A) Representation of all non-coding RNAs across the three S. pombe chromosomes (Atkinson et al., 2018). lincRNAs analysed in this study are shown in red (if they showed no phenotypes) or purple (if they showed phenotypes in at least one condition), with all other non-coding RNAs in grey. (B) Schematic overview of experimental design and workflow for phenotyping and data analyses. (C) Colony size (growth) and redness (viability) provide orthogonal readouts with strong biological signals. These two readouts are not correlated (rPearson = –0.022). Both methods are highly reproducible with overall coefficients of variation of 0.050 and 0.007 for size and redness, respectively (based on 3514 wild-type control colonies across all plates). The lower relative distribution spreads of control values (wild-type vs. entire dataset) indicates a strong biological signal. Fractions of unexplained variance were 0.56 for size and 0.40 for redness.
Figure 1—figure supplement 1
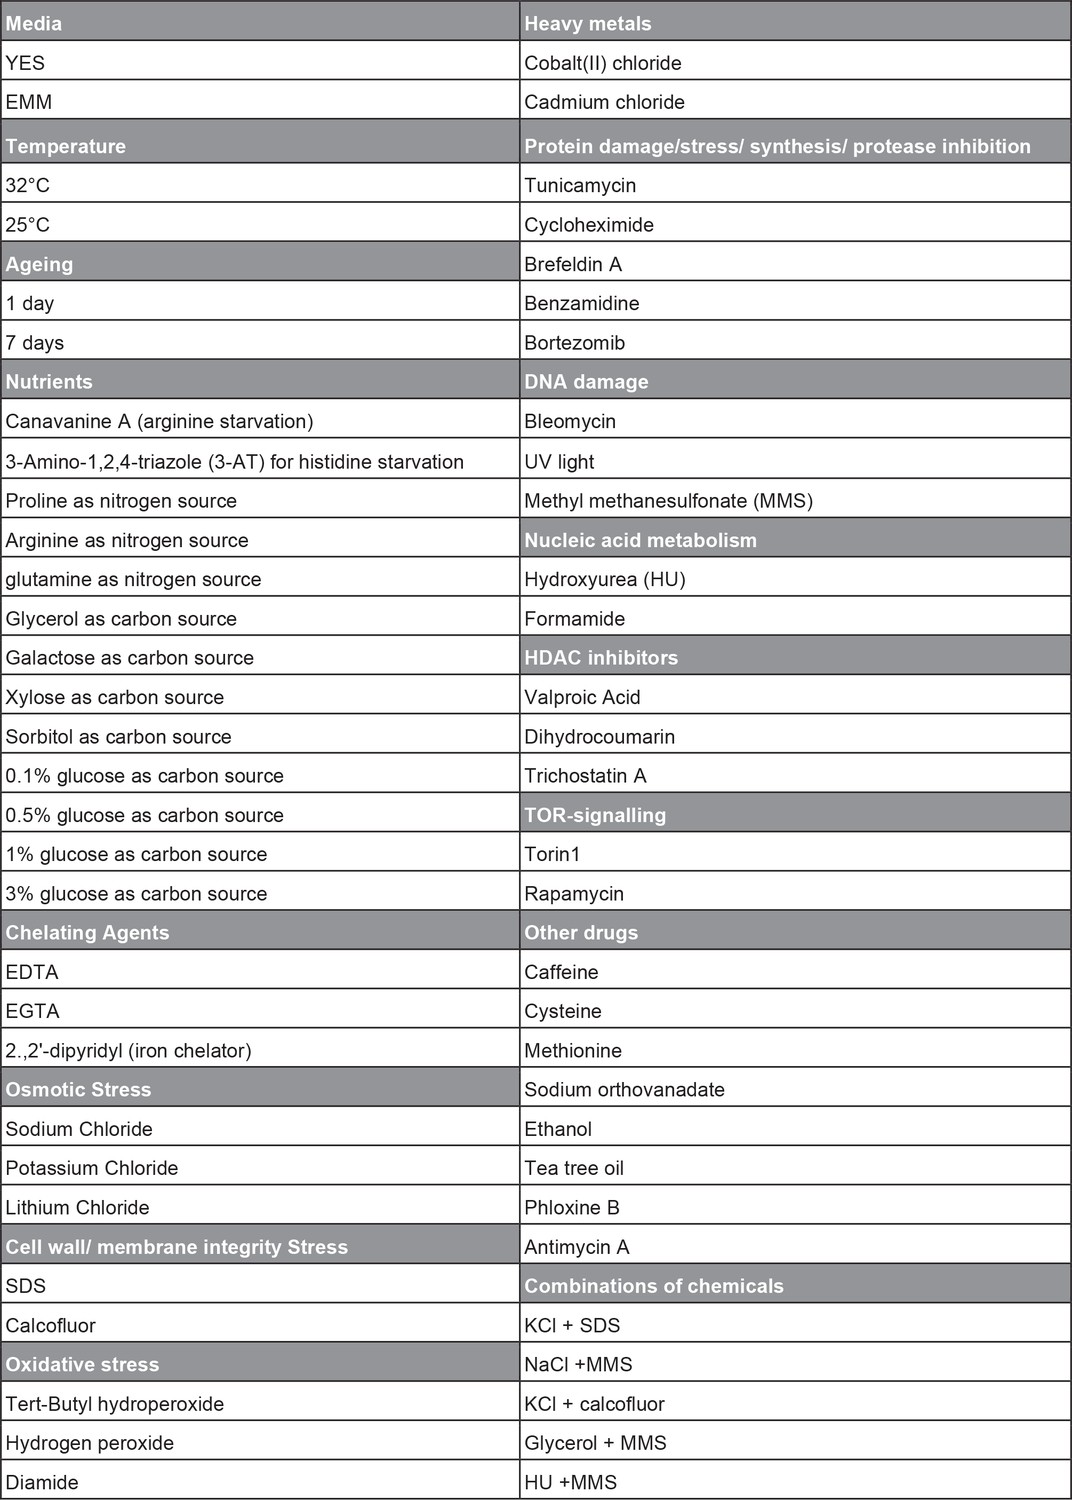
Overview of conditions used for phenotyping of long intergenic non-coding RNA (lincRNA) knock-out library.
The range of doses used for the different conditions is available in Supplementary file 1.
Figure 1—figure supplement 2
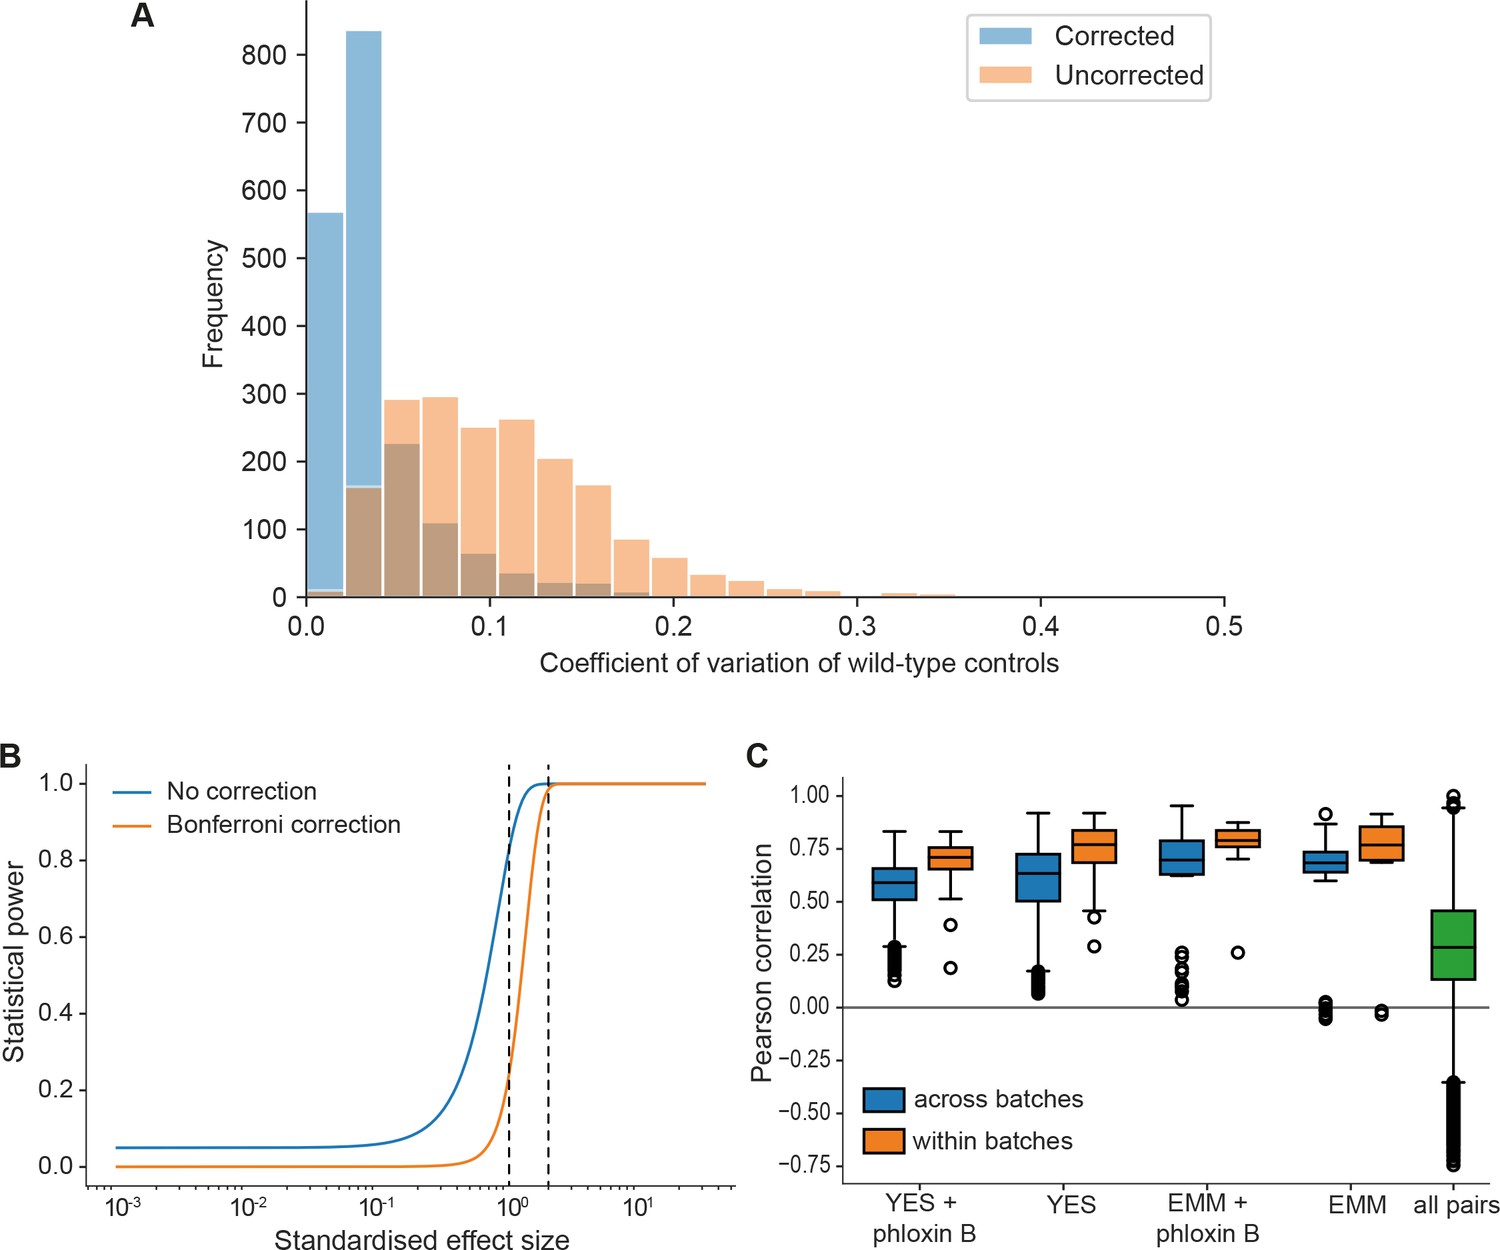
Noise, statistical power, and biological signals in phenomics assays.
(A) Grid corrections reduce noise in the data. Shown are distributions of coefficients of variation (CVs) of internal wild-type controls for 1906 plates across the dataset (coding and non-coding deletion mutants) before and after correction. The median CVs before and after correction are 0.098 and 0.027, respectively. So our normalization approach typically reduces the noise by about fourfold. (B) Plot of the statistical power (1 – chance of non-rejection of wrong null hypothesis) vs. standardized effect size (difference in means divided by standard deviation) using median number of replicates per long intergenic non-coding RNA (lincRNA) gene and condition (n = 9) and number of replicates for control conditions (rich medium, median = 173.5). The large number of replicates enables statistical detection of differential growth with low false-negative rate (type II error rate). The two curves show the statistical power before correction for multiple testing and after Bonferroni correction (which represents a worst-case scenario). A 5% difference in fitness, which is a very subtle effect and approximates the standard deviation of our method, is detected with a chance of 83% (no correction) or 24% (Bonferroni correction) (left dashed line). A stronger 10% difference in fitness is detected with ~100% power (no correction) or 98.5% power (Bonferroni) (right dashed line). Two-sided Student’s t-tests and a standard deviation of 5% were used throughput with a significance threshold of 0.05. (C) Four control conditions (rich and minimal media, each with or without phloxine B), were included in most of the ~30 batches acquired over 2 years. Boxplots of Pearson correlations for technical repeats within one batch (orange) vs. repeats of the same condition across all batches (blue). While correlation within the same batch is consistently higher, this effect is small considering the biological signal as illustrated by the distribution of pairwise correlations across all conditions (green).
Figure 1—figure supplement 3
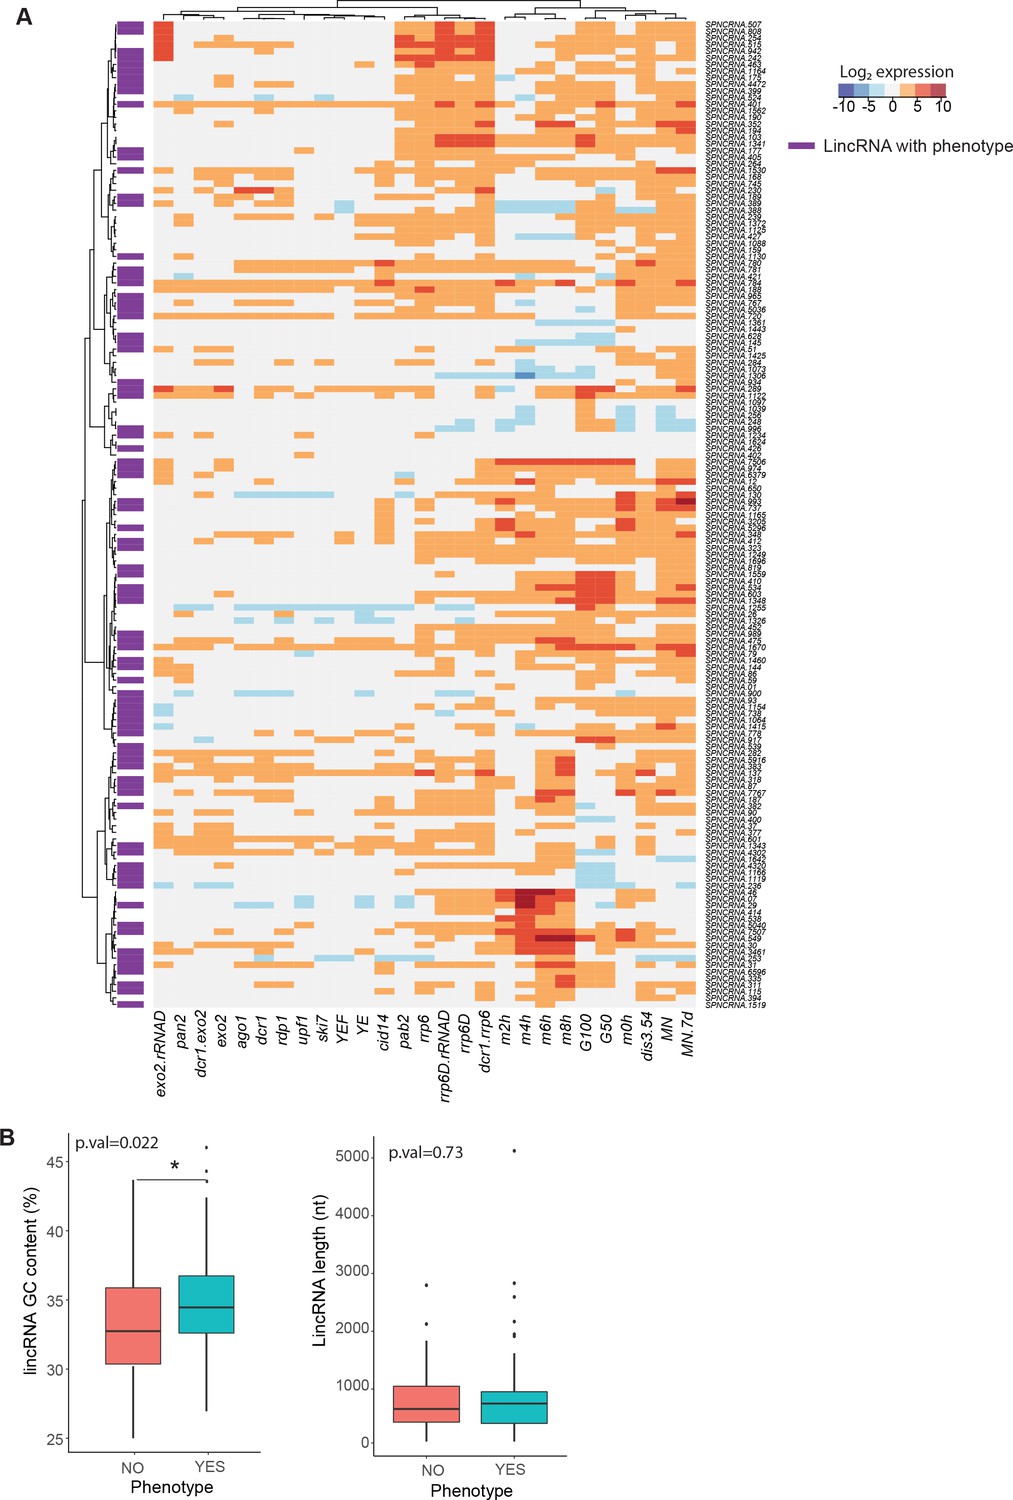
Expression patterns, GC content, and length of long intergenic non-coding RNAs (lincRNAs) studied.
(A) Expression patterns of lincRNAs in this study (data from Atkinson et al., 2018). lincRNAs that display any phenotype when deleted are marked in purple. (B) Comparison of GC content (left) and length (right) for linRNAs that display phenotype when deleted (aquamarine) vs. those that do not (coral). The p-values for significance of difference are indicated (Wilcoxon test).
Figure 2
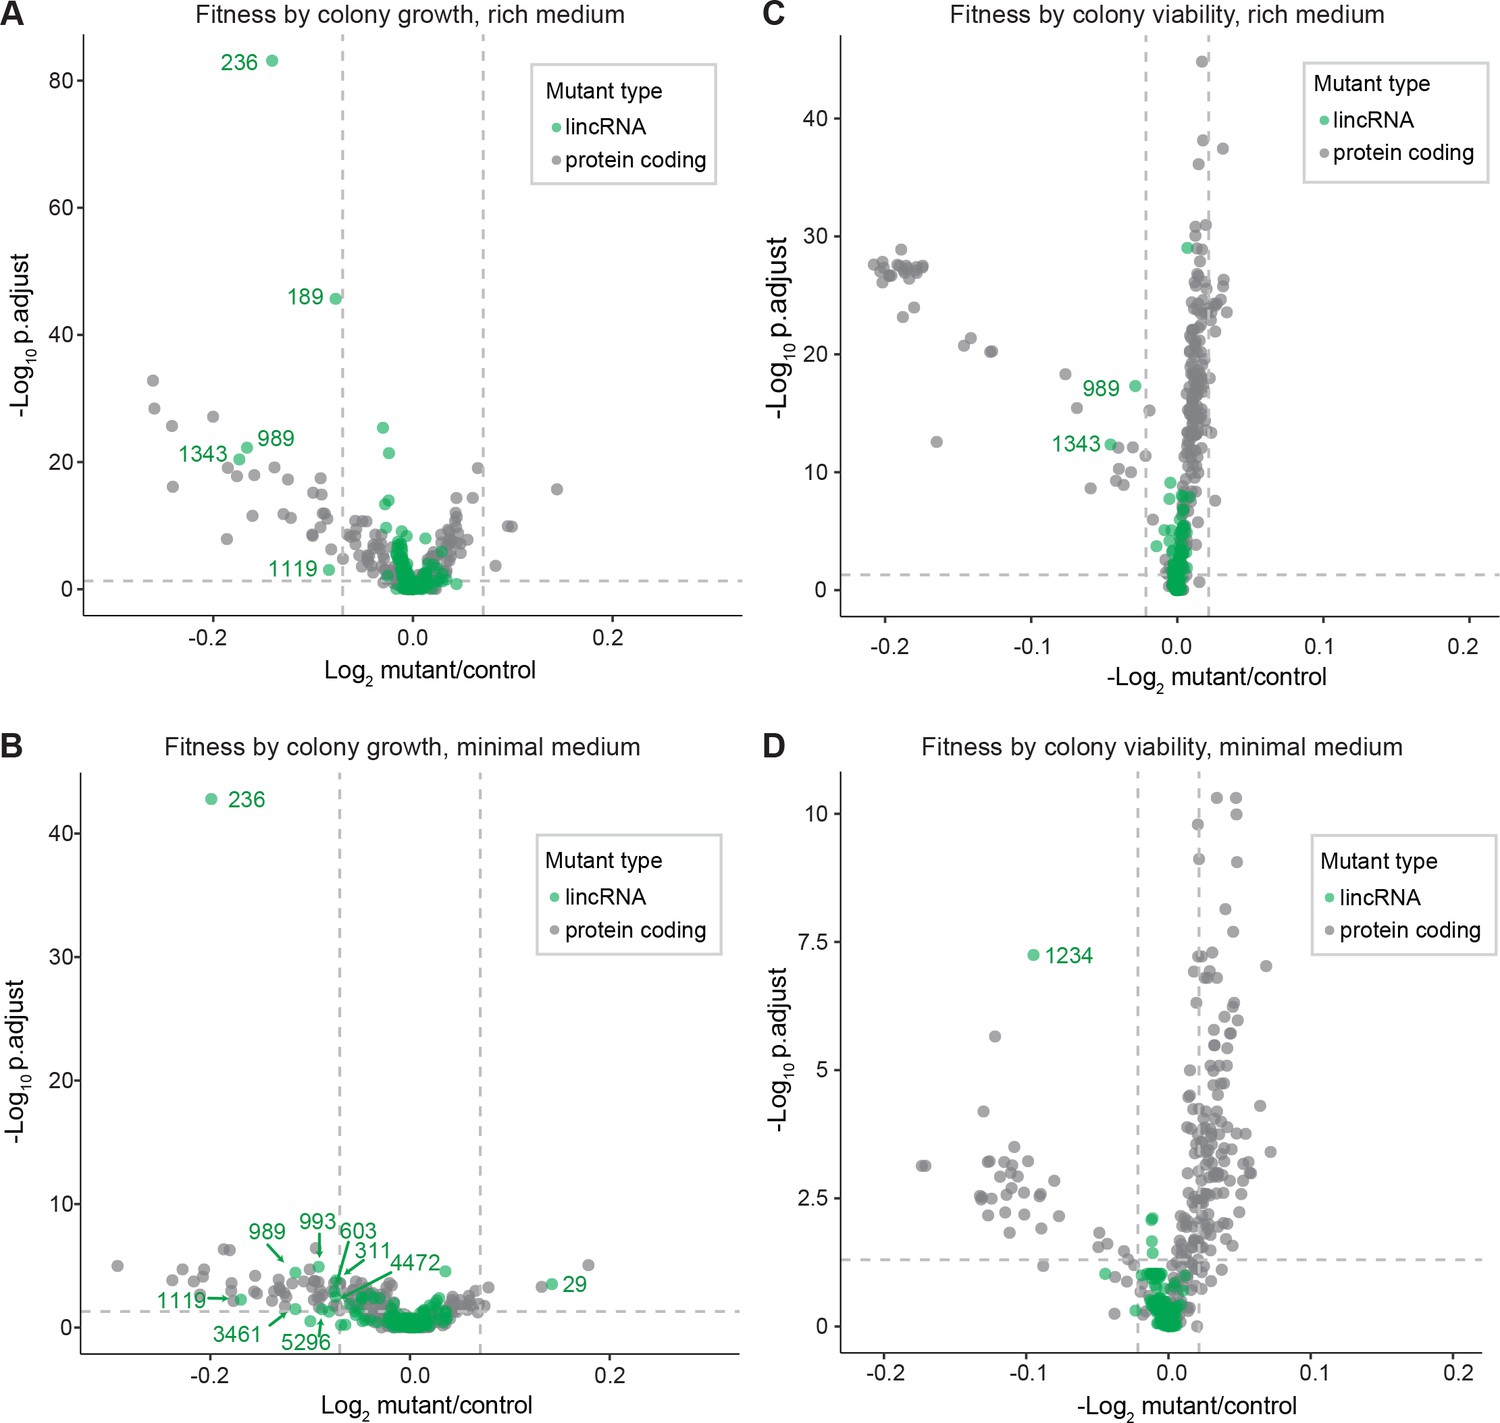
Colony growth and viability of deletion mutants in benign conditions.
(A) Volcano plot for colony size of long intergenic non-coding RNA (lincRNA) mutants (green) and coding-gene mutants (grey) growing in rich medium (top graph) and minimal medium (bottom graph). The dashed lines show the significance thresholds. Strains with lower fitness (smaller colonies) are <0 on the x-axis, and those with higher fitness are >0. We applied a significance threshold of 0.05 after Benjamini–Hochberg correction for multiple testing and a difference in fitness of abs(log2(mutant/wild type))> log2(0.05) to call hits based on colony size; this difference is similar to the median coefficient of variation (CV). (B) Volcano plot for colony viability (phloxine B redness score) of lincRNA mutants (green) and coding-gene mutants (grey) growing in rich medium (top graph) and minimal medium (bottom graph). The dashed lines show the significance thresholds. Strains showing lower fitness (redder colonies) are above zero on the x-axis, and those with higher fitness are below zero. We determined quantitative redness scores and applied a significance threshold of 0.05 after Benjamini–Hochberg correction and an effect size threshold of abs(log2(mutant/wild-type))> log2(0.015) to identify colonies that are more or less red than wild-type colonies. The labels indicate the identity of the significant lincRNA genes.
Figure 3 with 2 supplements
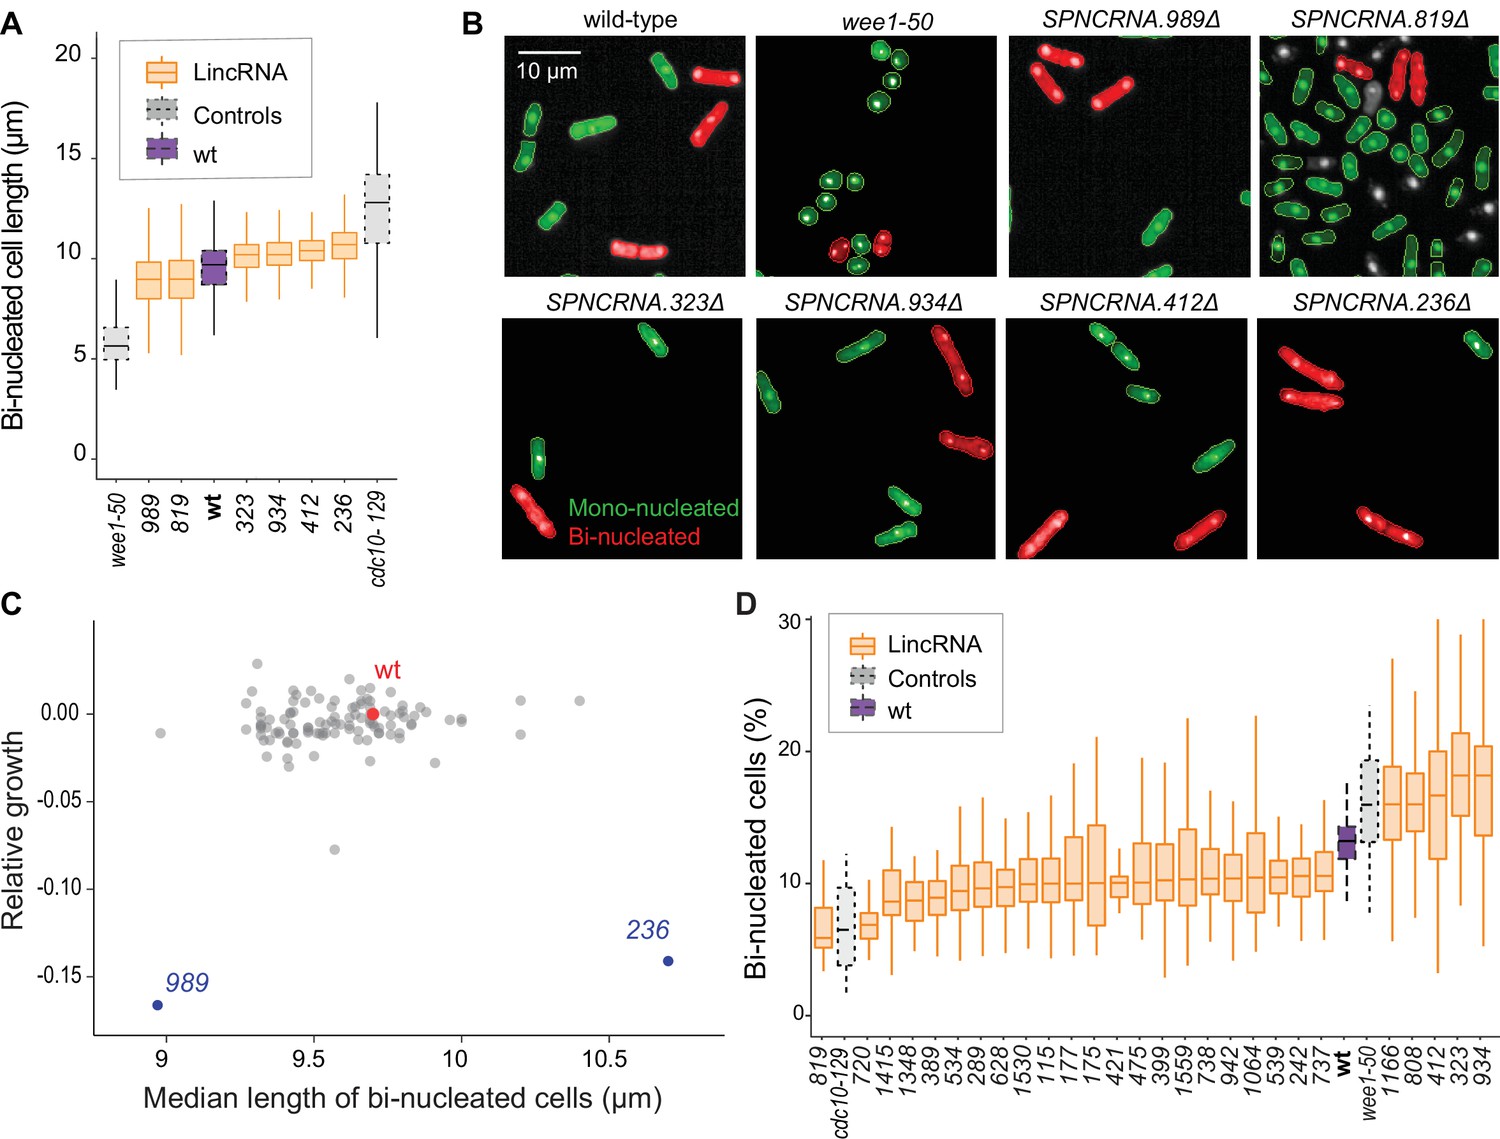
Cell-size and cell-cycle traits of long intergenic non-coding RNA (lincRNA) mutants.
(A) lincRNA deletion mutants showing ≥5% difference in median cell size (pWilcoxon<0.05), compared to wild-type (wt) cells and the conditional cell-size mutants wee1-50 and cdc10-129, captured at 60 min after release to permissive temperature. The sizes of binucleated cells were measured in 63 microscope fields using high-throughput microscopy. (B) Representative cells from (A), with binucleated cells in red. (C) Plot of cell growth vs. cell length of binucleated cells for all lincRNA mutants analysed here. The data on log2 growth of mutant relative to wild-type cells in rich medium are from the colony-based screen (Figure 2A). The length data of binucleated cells grown in rich medium are from the high-throughput microscopy (A). (D) lincRNA deletion mutants showing ≥20% difference in percentage of binucleated cells (pWilcoxon<0.05) compared to wt cells as in (A). The median proportion of binucleated cells was quantified from the proportion of binucleated cells in each microscope field, captured for each lincRNA mutant using high-throughput microscopy.
Figure 3—figure supplement 1
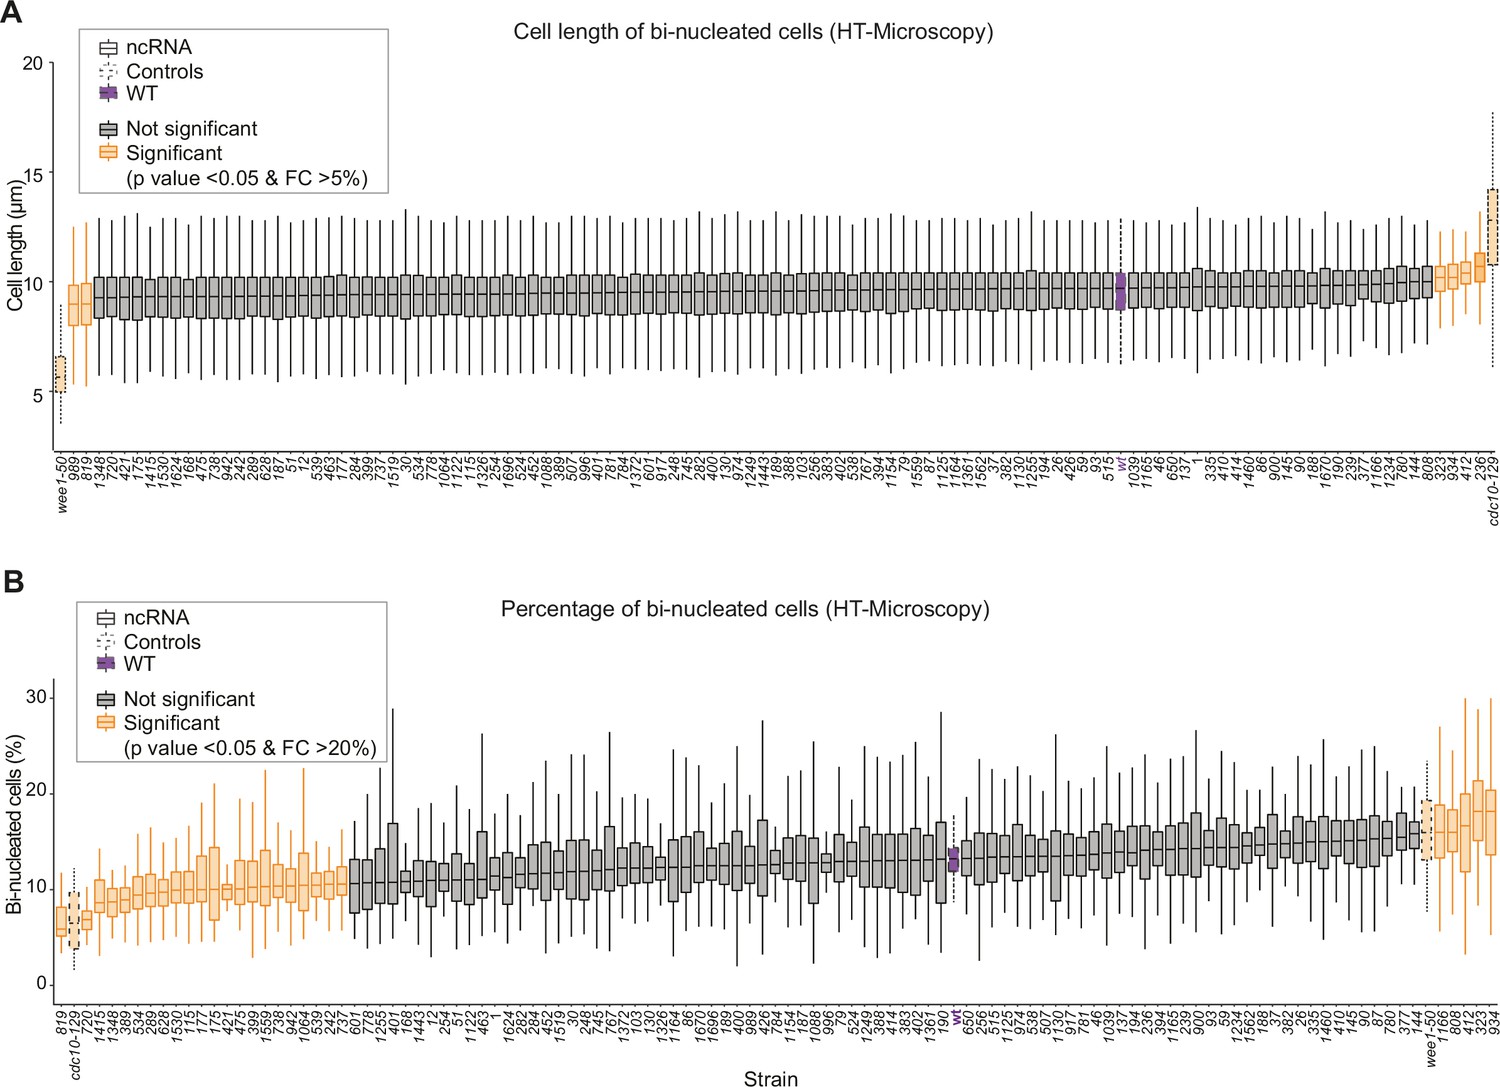
Cell length and binucleated cells for all long intergenic non-coding RNA (lincRNA) mutants.
(A) Lengths of binucleated cells growing exponentially in rich medium for different lincRNA deletion mutants. (B) Proportion of binucleated cells in the population under the same conditions as (A).
Figure 3—figure supplement 2
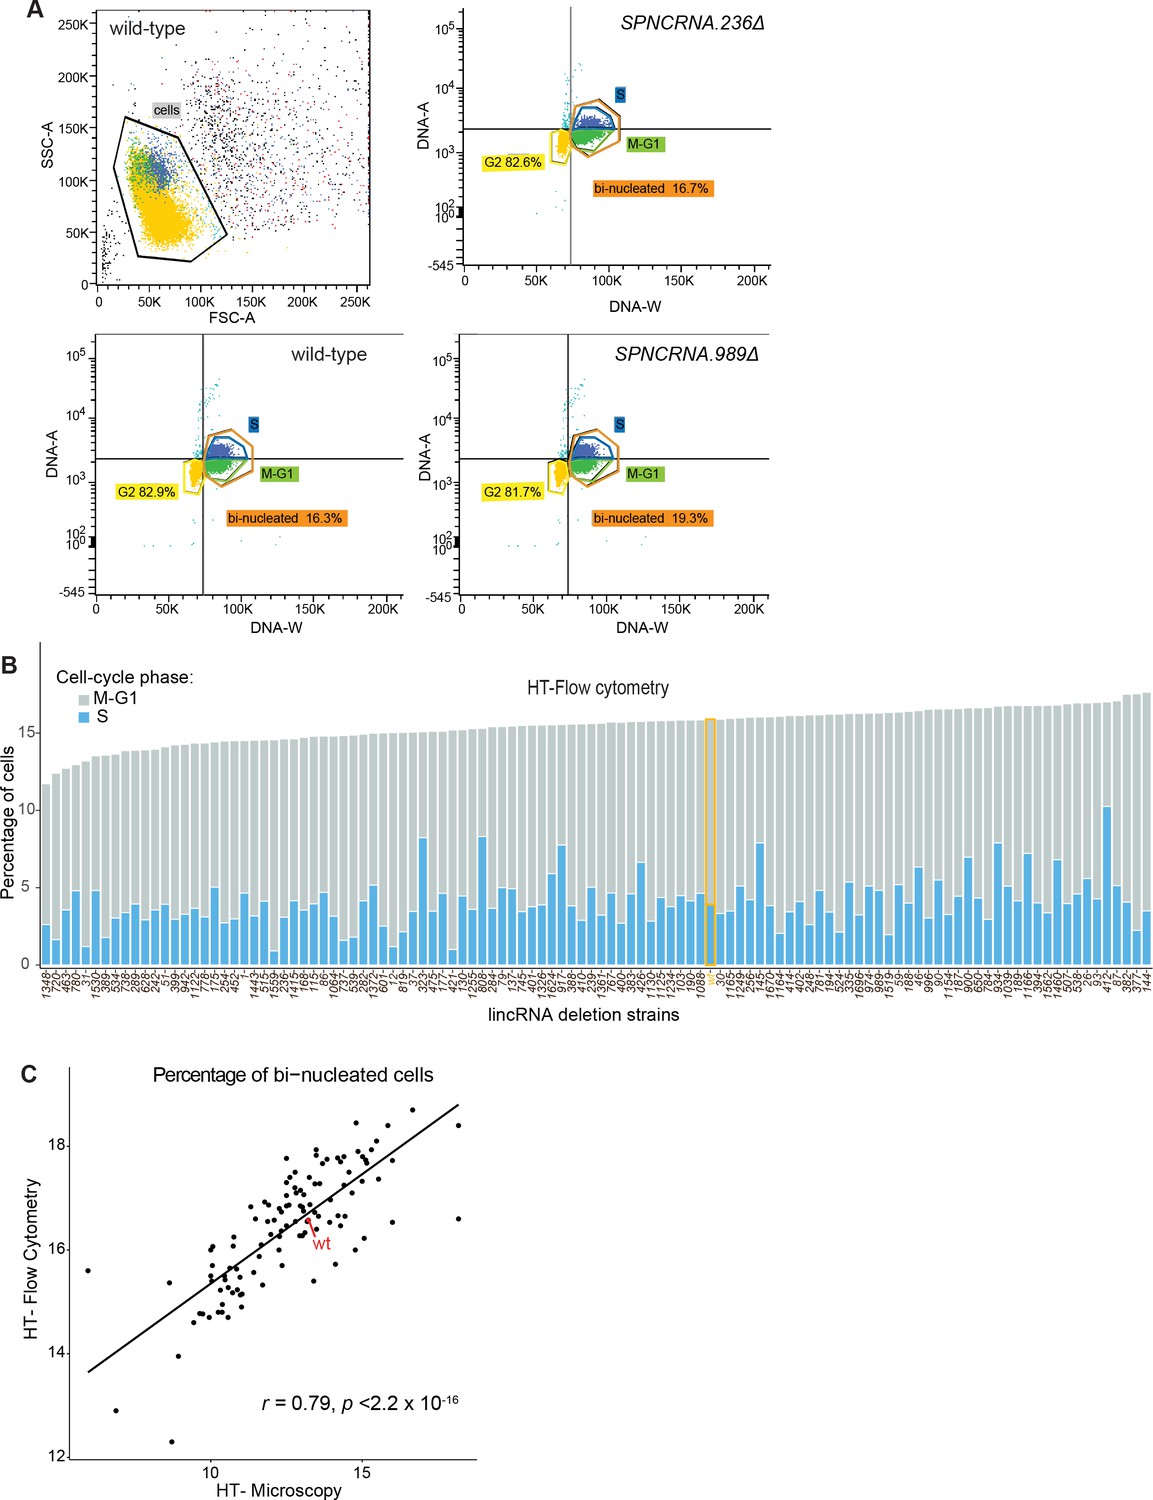
Cell-cycle phenotype analyses using high-throughput flow cytometry and high-throughput microscopy.
(A) Procedure to identify cell-cycle stages using high-throughput flow cytometry data. Cell doublets are first excluded (top left) and different stages assigned according to the DNA amount (DNA-A) and duration of pulse (DNA-W). (B) Percentage of cells in different cell-cycle stages according to high-throughput flow cytometry. These data are only semi-quantitative, however, and the proportions of cell-cycle phases are only approximate. (C) Comparison of percentage of binucleated cells calculated using high-throughput flow cytometry or high-throughput microscopy. The Pearson correlation coefficient is indicated.
Figure 4
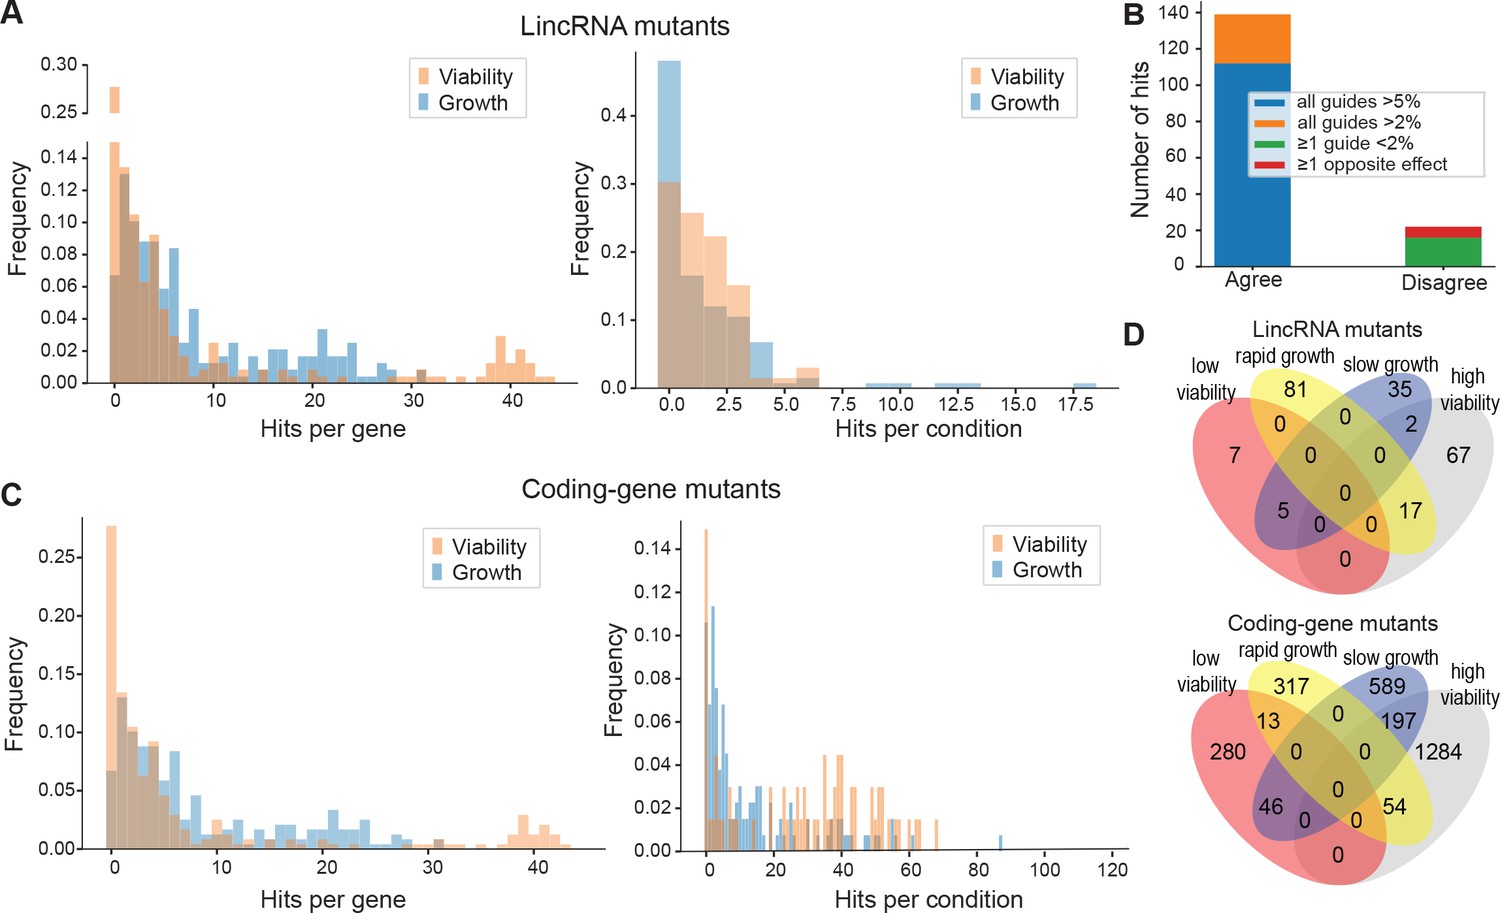
Colony growth and viability of deletion mutants in diverse conditions.
(A) Distributions of significant hits per mutant (left) or per condition (right) for long intergenic non-coding RNA (lincRNA) mutants with altered colony growth (blue) or viability (orange) compared to wild-type cells. (B) Plot showing the number of growth phenotype hits agreeing or disagreeing between independently generated lincRNA mutants. (C) Distributions of significant hits per mutant (left) or per condition (right) for coding-gene mutants with altered colony growth (blue) or viability (orange) compared to wild-type cells. (D) Top Venn diagram: numbers of lincRNA mutants that showed phenotypes for colony growth (rapid or slow) and/or viability (low or high) in 67 conditions. Bottom Venn diagram: numbers of coding-gene mutants showing a phenotype for both colony growth and viability in 67 conditions.
Figure 5 with 3 supplements

Functional signatures in long intergenic non-coding RNA (lincRNA) phenotype profiles.
(A) Hierarchical clustering of discretized data for 16 lincRNA mutants (green) and 178 coding-gene mutants (grey), as indicated above the columns. Clustering was limited to the core conditions where phenotypes for all mutants were available, including growth phenotypes (brown) and viability phenotypes (purple), as indicated to the right of rows. Only mutants with at least five hits across the 41 conditions are shown. Resistant (dark red) and sensitive (dark blue) phenotypes are indicated for corresponding mutant-condition combinations. Hierarchical clustering of both mutants and conditions was performed with the Ward method using Euclidean distances. Based on the dendrogram, the genes were divided into three clusters indicated in different colours (top row). A detailed version of this cluster specifying the conditions and mutants is provided in Figure 5—figure supplement 1C. (B) Cytoscape gene network representing phenotype correlations between lincRNA and coding-gene mutants. Yellow and blue edges show positive and negative phenotype correlations, respectively. The lincRNAs are shown in green and the protein-coding genes in grey, including a pink border if their function is unknown. Clusters discussed in the main text are highlighted in colour.
Figure 5—figure supplement 1
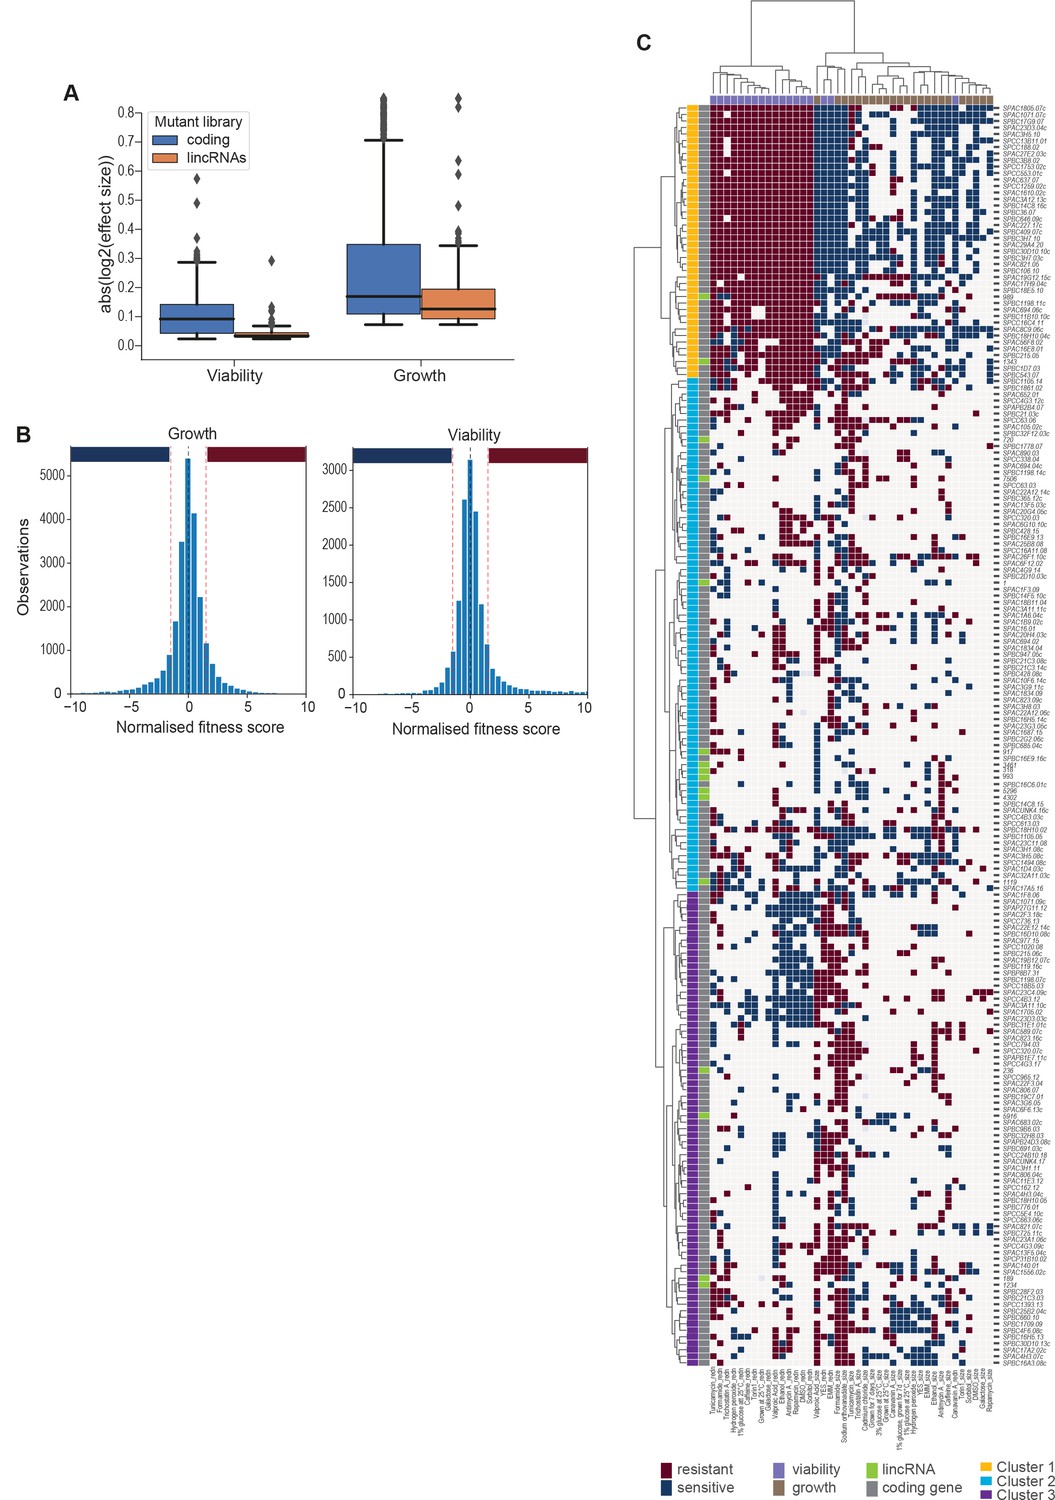
Effect sizes, data discretization, and cluster details.
(A) Absolute log2 effect sizes for viability and growth data of long intergenic non-coding RNA (lincRNA) and coding-gene mutants. (B) Distributions of growth and viability scores with discretization thresholds. Scores reflect the effect size scaled by the standard deviation of the wild-type control in that condition. Thresholds were set at ±1.5 which resulted in ~23% of data being non-zero (blue and red bars for sensitive and resistant phenotypes, respectively). (C) Hierarchical clustering as in Figure 5A with row and column labels. Discretized data for 16 lincRNA mutants (orange) and 178 coding-gene mutants (blue). Resistant (dark red) and sensitive (dark blue) phenotypes are indicated for corresponding mutant-condition combinations. Hierarchical clustering of both mutants and conditions was performed with the Ward method using Euclidean distances. Based on the dendrogram, the genes were divided into three clusters indicated in different colours.
Figure 5—figure supplement 2
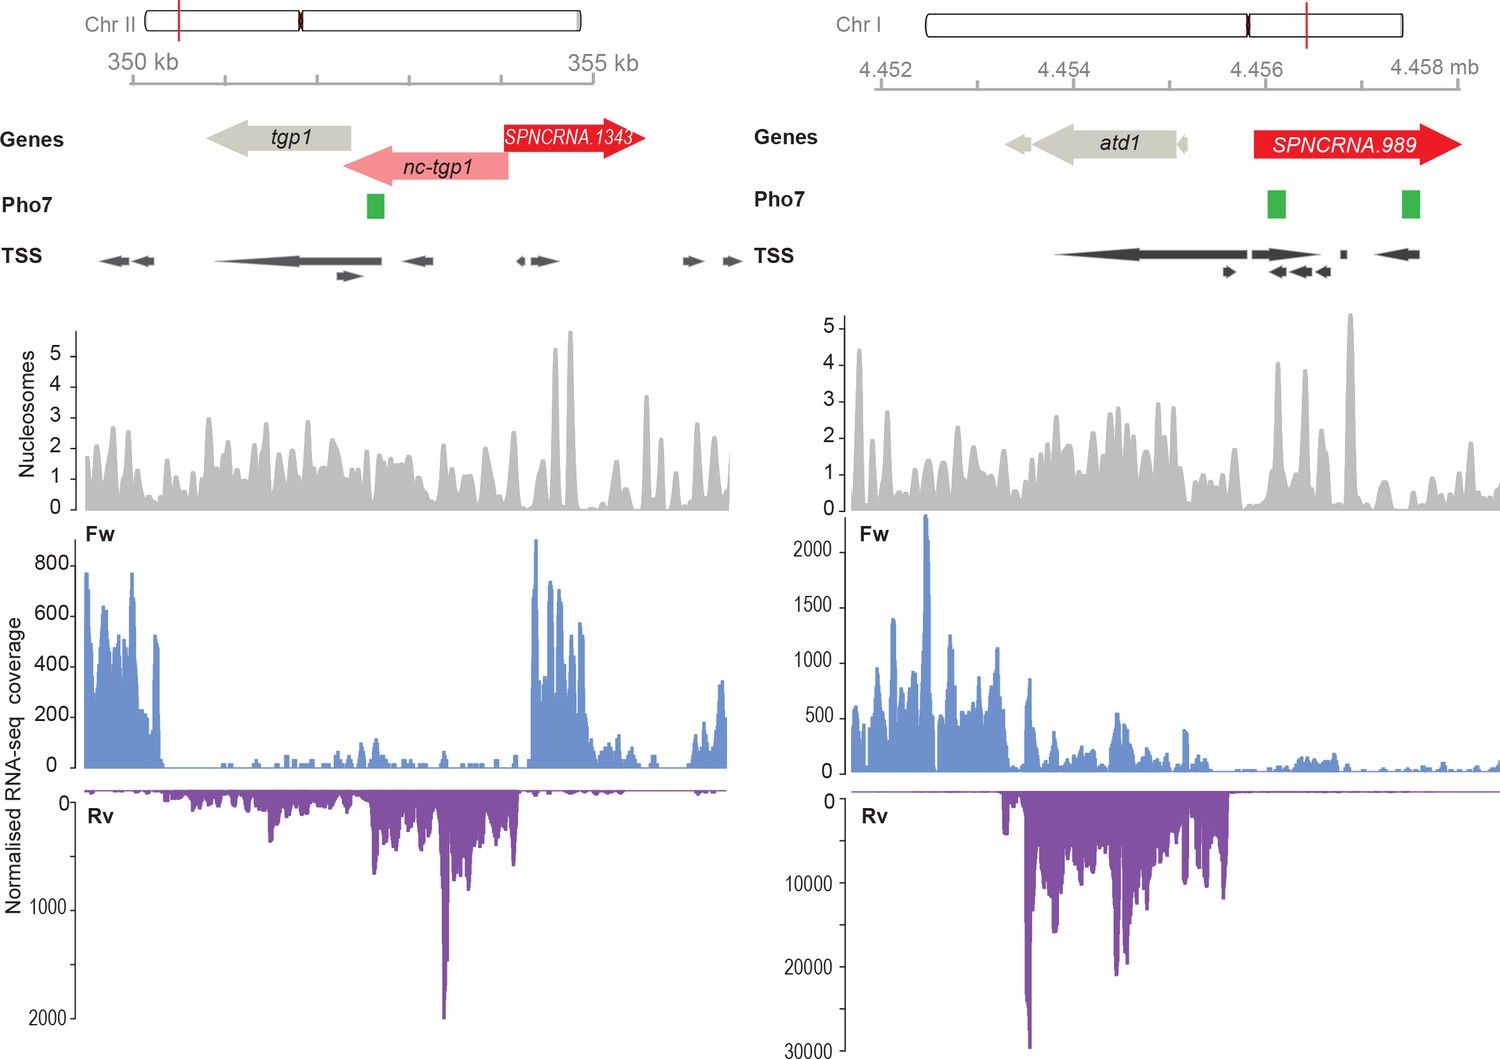
Genome browser view of the chromosomal regions surrounding SPNCRNA.1343 (left) and SPNCRNA.989 (right).
The Pho7 binding sites as described by Schwer et al., 2017, the transcription start sites (TSS), and the nucleosome positioning data as described by Atkinson et al., 2018. RNA-sequencing-normalized coverage is separated in forward (Fw) and reverse (Rv) strands (Maria Rodriguez-Lopez, unpublished data).
Figure 5—figure supplement 3
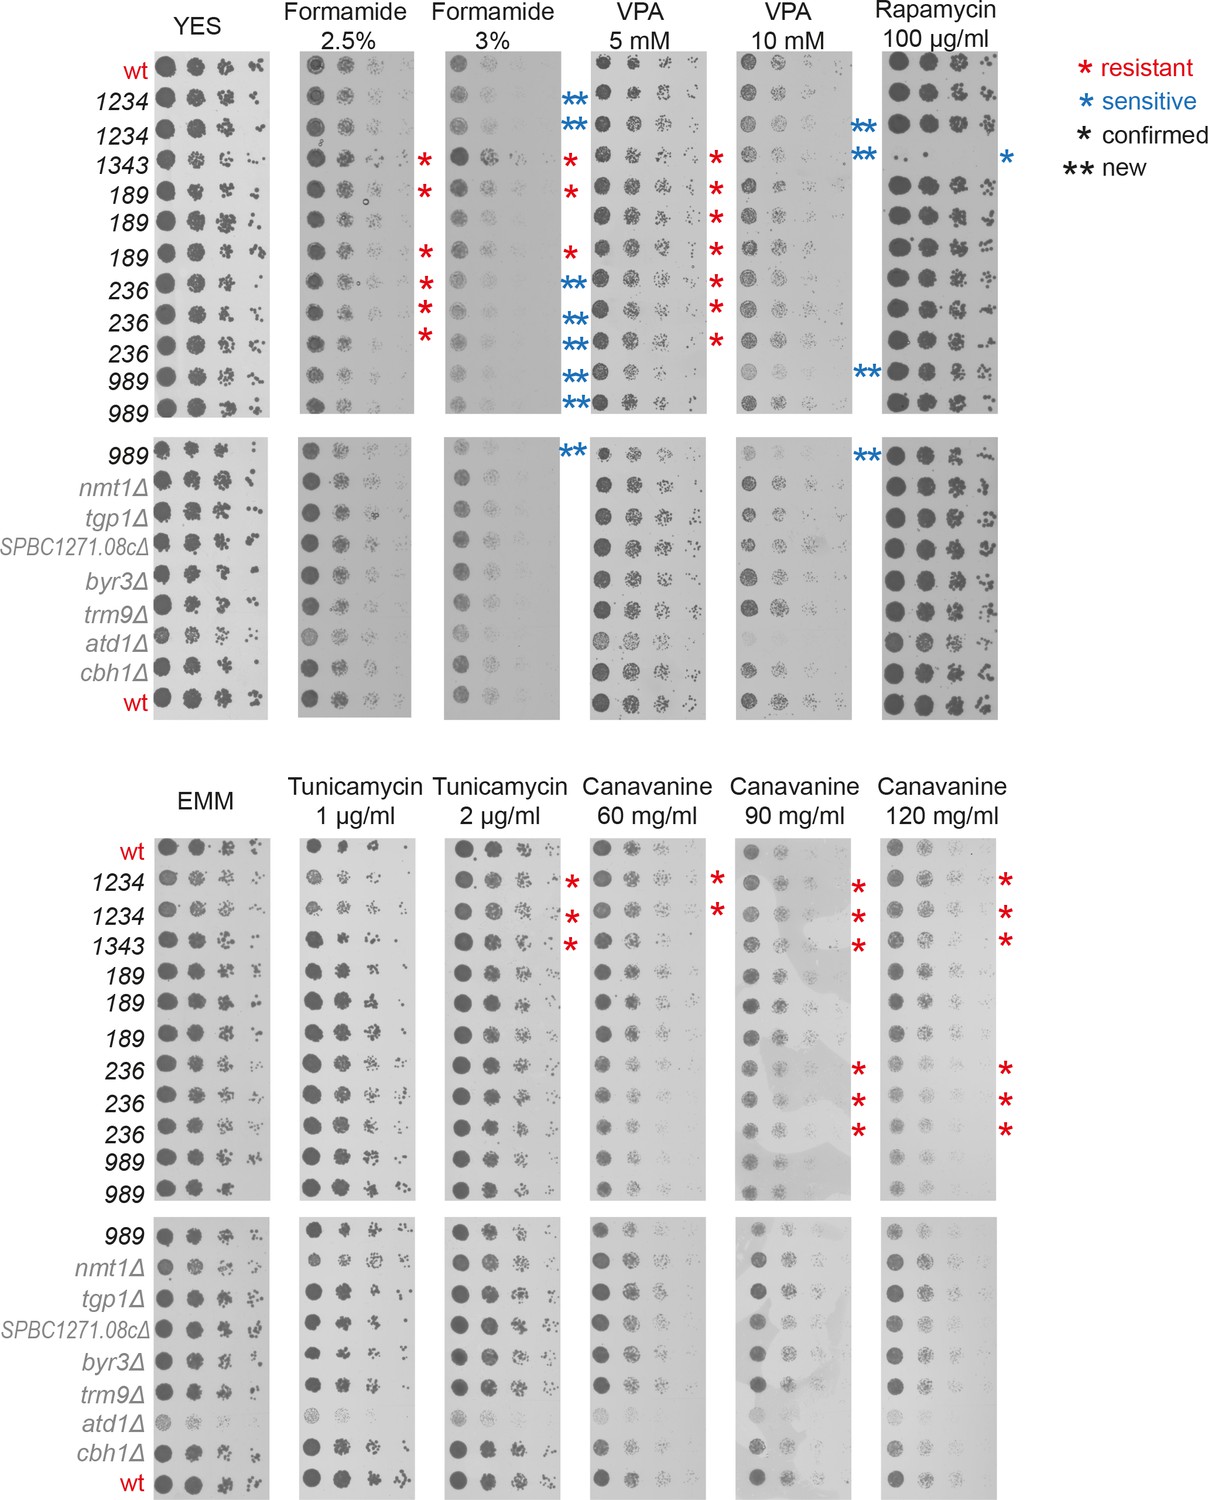
Spot assays with fivefold serial dilutions to validate selected long intergenic non-coding RNA (lincRNA) deletion phenotypes from the screen.
Deletion mutants of lincRNAs (black) and neighbouring protein-coding genes (grey) grown in yeast extract supplement (YES) were serially diluted and plated onto YES (top) or Edinburgh Minimal Medium (EMM) (bottom) plates containing the drugs indicated. Single asterisks indicate validated lincRNA phenotypes, while double asterisks indicate subtle phenotypes in the higher doses of formamide and valproic acid (VPA) not detected in the doses used for the screen, suggesting dosage effects in the serial dilution assays.
Figure 6 with 2 supplements
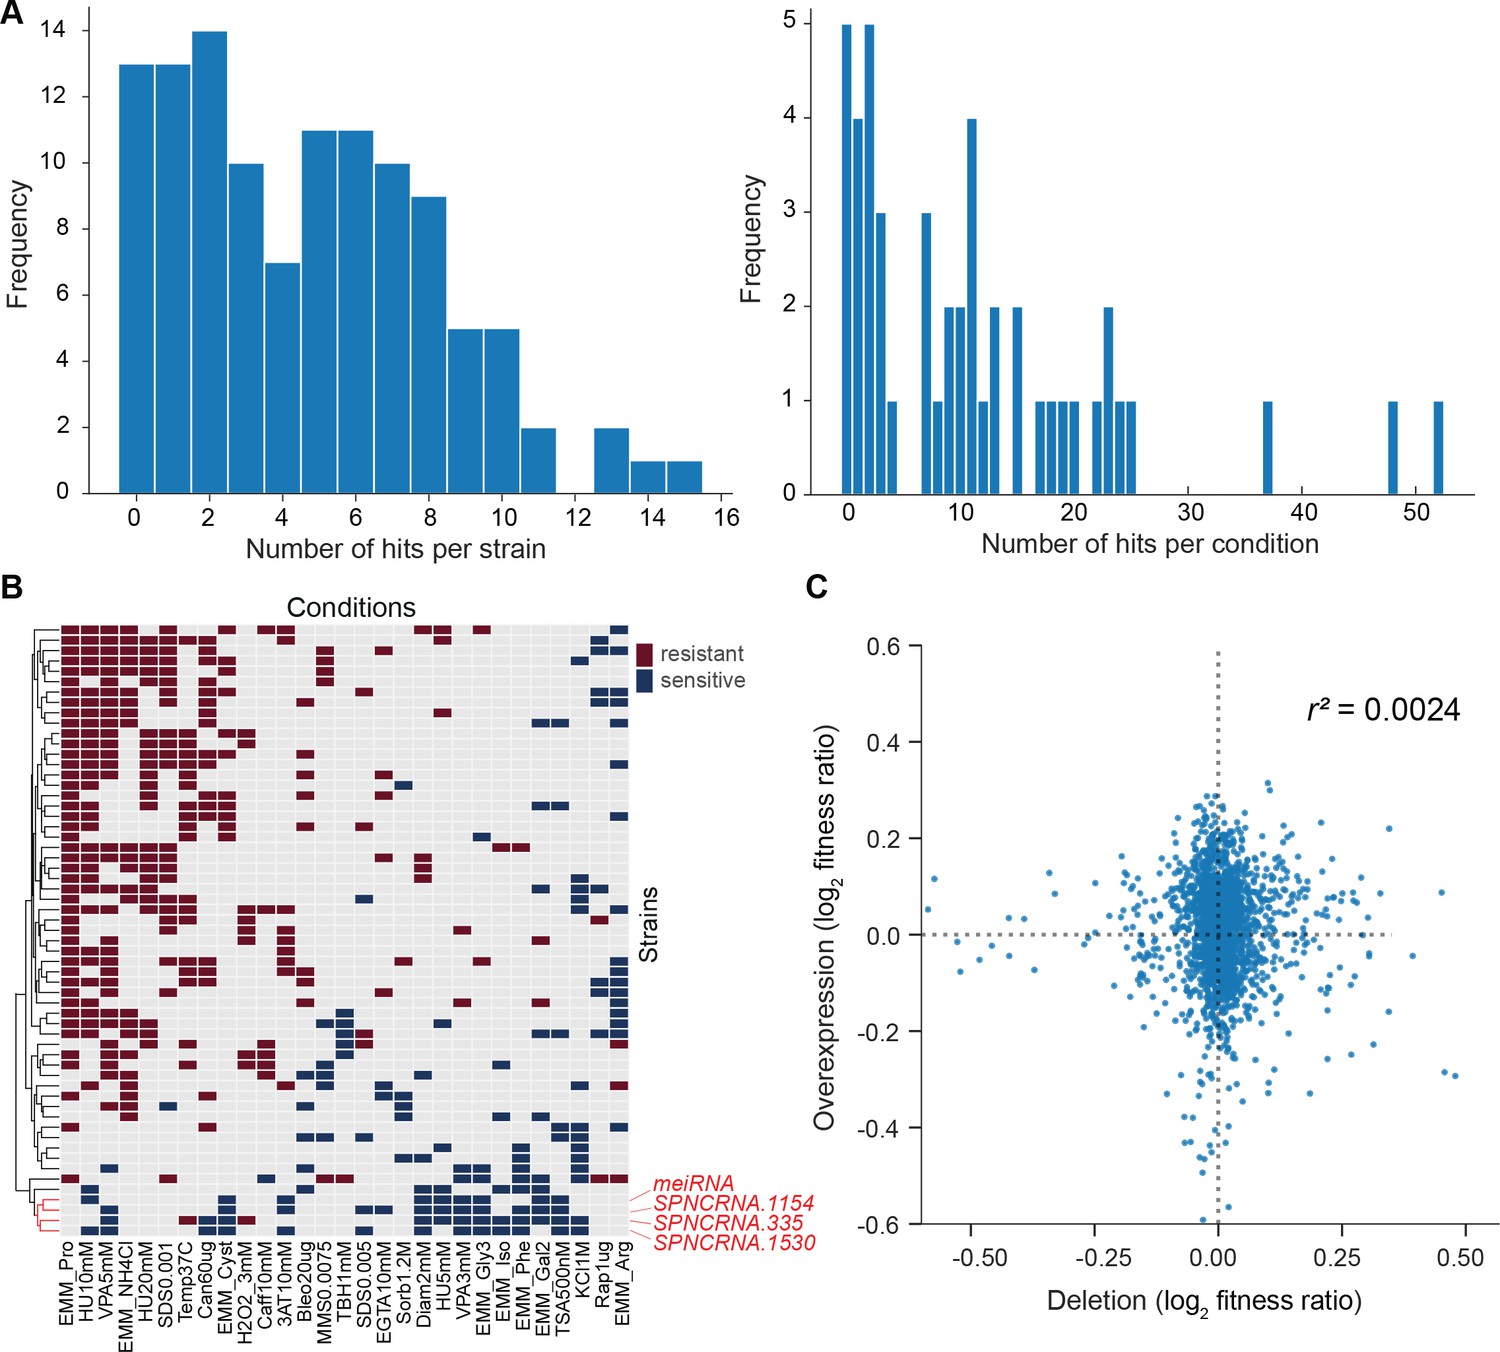
Growth phenotypes of long intergenic non-coding RNA (lincRNA) overexpression mutants in different conditions.
(A) Distributions of significant phenotype hits per strain (left) and condition (right) for lincRNA overexpression strains with altered growth under benign and stress conditions. Overall, 113 overexpression strains were phenotyped under 47 different conditions, based on 31 distinct environmental factors. We applied a significance threshold of p≤0.01, after correction for multiple testing, and a difference in fitness of ≥5% to call hits based on colony size. (B) Hierarchical clustering of discretized relative log2 median effect sizes for lincRNA overexpression strains (rows) using only the strains and conditions with at least five hits (59 mutants, 29 conditions). Resistant (red) and sensitive (blue) phenotypes are indicated for strain-condition combinations. The sub-cluster highlighted in red is discussed in the main text. (C) Comparison of phenotype data from lincRNA deletion vs. overexpression mutants. Plot showing maximum median effect sizes for 104 lincRNA mutants represented in both deletion and overexpression libraries, phenotyped under 22 shared conditions. The pairwise Pearson correlation coefficient is indicated. To aid visualization, 10 extreme outliers were removed out of 2288 data points.
Figure 6—figure supplement 1
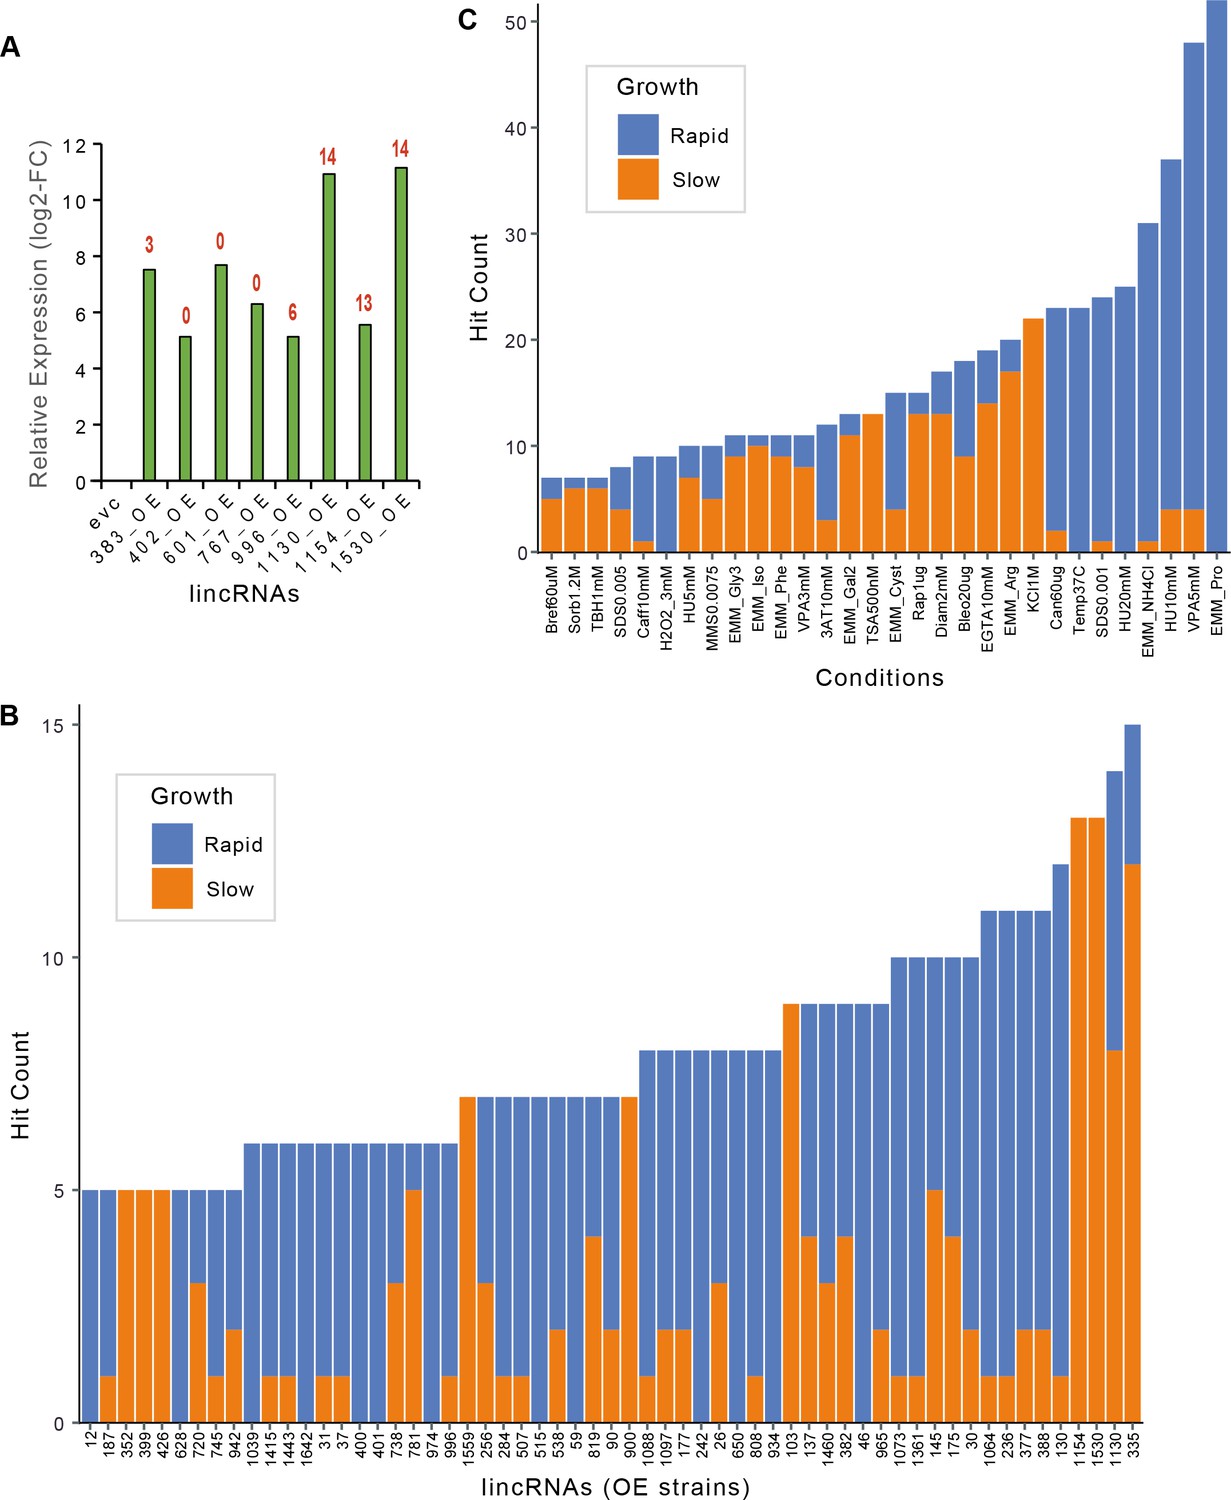
Expression fold-changes and phenotypes per strain or condition for long intergenic non-coding RNA (lincRNA) overexpression strains.
(A) RT-qPCR analysis of transcript levels for selected lincRNAs in overexpression strains relative to empty-vector control (evc) for exponentially growing cells. The numbers of phenotype hits observed for each overexpression strain are indicated in red on top of bars. Hit counts per strain (B) or per condition (C) for lincRNA overexpression strains with altered colony growth separated by faster and slower colony growth phenotypes relative to evc. Data for slower and faster growth are stacked. Adjusted p-value ≤0.01 and difference in fitness ≥5% were used as significant thresholds to call hits. Only genes or conditions which produced ≥5 hits are shown.
Figure 6—figure supplement 2
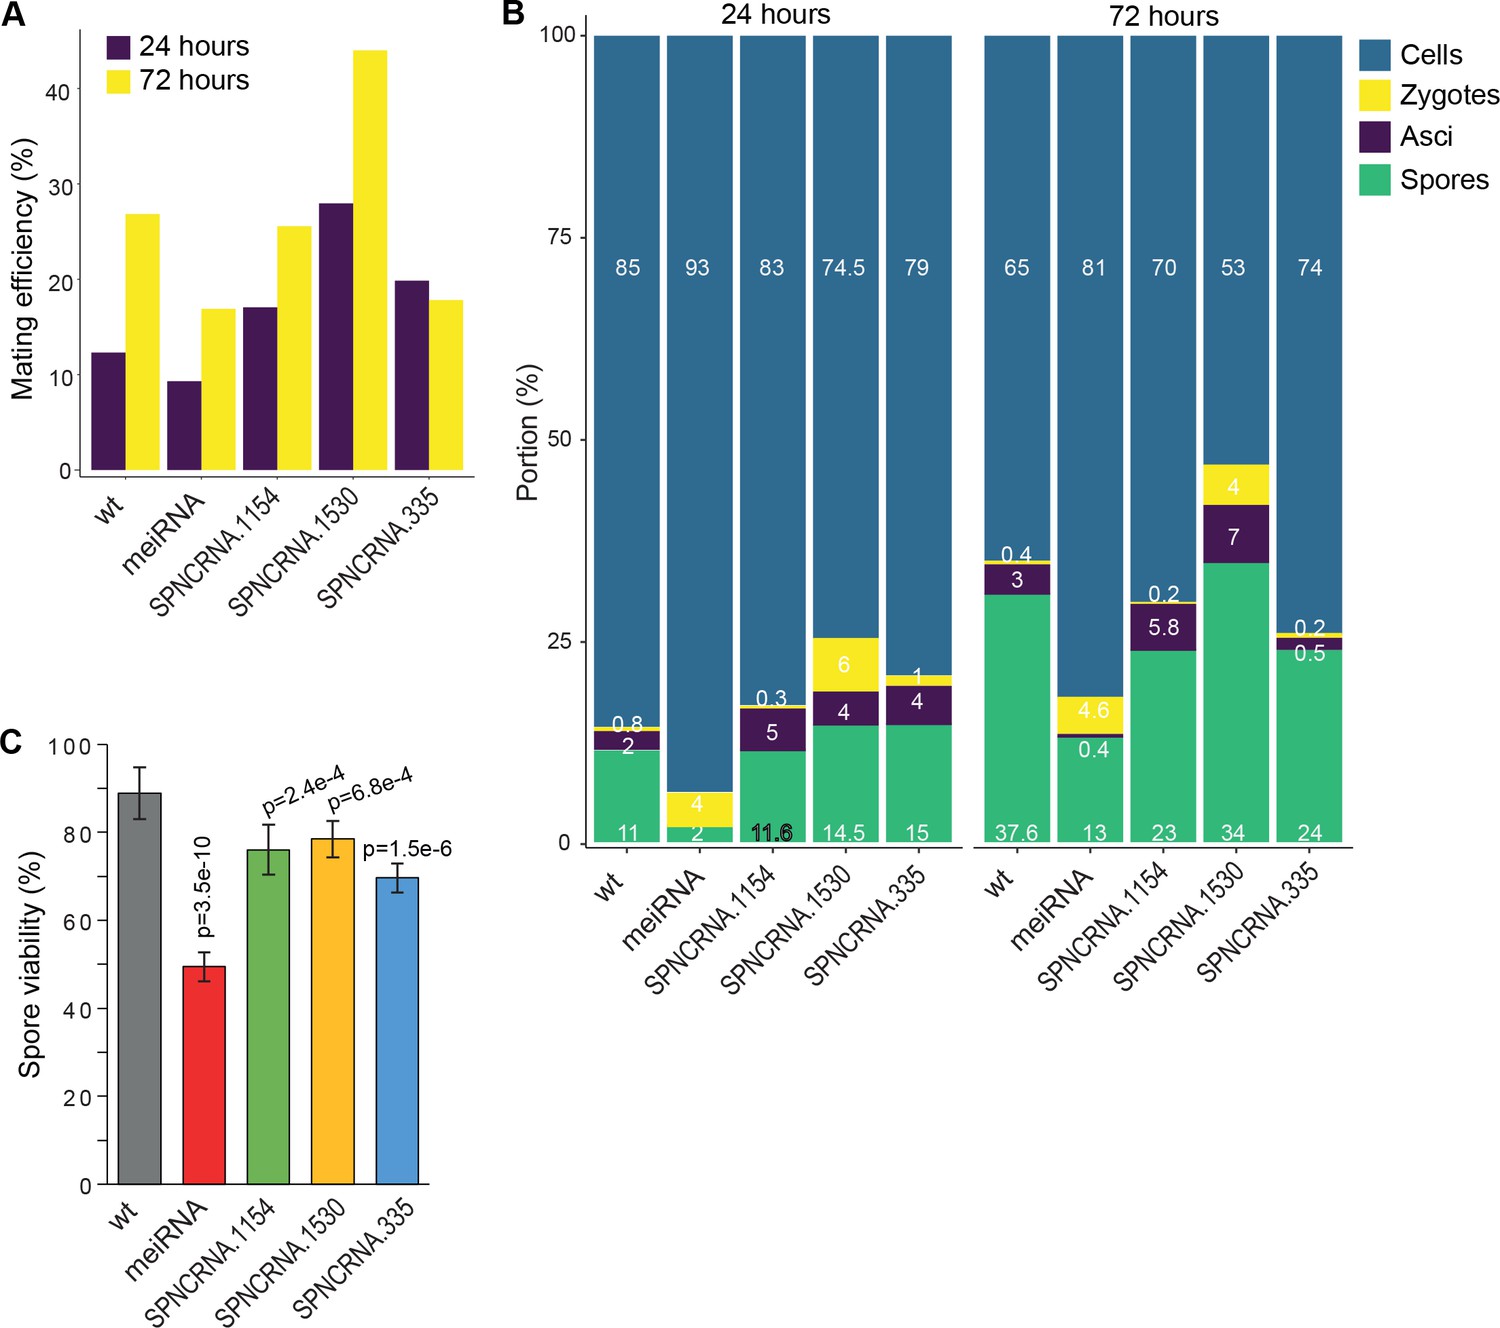
Meiotic phenotypes of long intergenic non-coding RNA (lincRNAs) from sub-cluster in Figure 6B.
(A) Mating efficiency at 24 and 72 hr in Edinburgh Minimal Medium without nitrogen (EMM-N) medium for the four lincRNA deletion mutants and wild-type (wt) control strain as indicated. (B) Percentages of cells, zygotes, asci, and free spores at 24 and 72 hr in EMM-N medium for the four lincRNA deletion mutants and wt control strain as indicated. (C) Percentages of viable spores at 72 hr in EMM-N medium for the four lincRNA deletion mutants and wt control strain as indicated. The p-values indicate significant differences compared to wt spores, determined using the two-sample t-test. Spore viability was determined in three independent biological repeats, and for each repeat at least 100 spore colonies per plate were counted on three plates.
Additional files
-
Supplementary file 1
Details of strains and conditions.
- https://cdn.elifesciences.org/articles/76000/elife-76000-supp1-v1.xlsx
-
Supplementary file 2
Phenotype data of long intergenic non-coding RNA (lincRNA) deletion mutants.
- https://cdn.elifesciences.org/articles/76000/elife-76000-supp2-v1.xlsx
-
Supplementary file 3
Summary tables of long intergenic non-coding RNA (lincRNA) and coding-gene deletion mutants.
- https://cdn.elifesciences.org/articles/76000/elife-76000-supp3-v1.xlsx
-
Supplementary file 4
Phenotype data of coding-gene deletion mutants.
- https://cdn.elifesciences.org/articles/76000/elife-76000-supp4-v1.xlsx
-
Supplementary file 5
Clustering analysis of deletion-mutant phenotypes.
- https://cdn.elifesciences.org/articles/76000/elife-76000-supp5-v1.xlsx
-
Supplementary file 6
Phenotype data of long intergenic non-coding RNA (lincRNA) overexpression mutants.
- https://cdn.elifesciences.org/articles/76000/elife-76000-supp6-v1.xlsx
-
Transparent reporting form
- https://cdn.elifesciences.org/articles/76000/elife-76000-transrepform1-v1.pdf
Download links
A two-part list of links to download the article, or parts of the article, in various formats.
Downloads (link to download the article as PDF)
Open citations (links to open the citations from this article in various online reference manager services)
Cite this article (links to download the citations from this article in formats compatible with various reference manager tools)
Functional profiling of long intergenic non-coding RNAs in fission yeast
eLife 11:e76000.
https://doi.org/10.7554/eLife.76000


